1. Introduction
In Romania, the fir (
Abies alba Mill.) is frequently found mixed with beech (
Fagus sylvatica L.) at altitudes between 700 and 1200 m. Mixed of fir and beech forests are formations representative of the lower mountain zone in Romania. Of the coniferous trees, Norway spruce (
Picea abies (L.) Karst.) descends to these altitudes sporadically, but heat and reduced precipitation become limiting factors to its lower range; the proportion of spruce increases with altitude. Fir and beech influence climatic factors differently—especially humidity, light, and heat—so that, under the shelter they provide, beech seedlings frequently become established under fir, and vice versa. Consequently, the structures of stands are greatly varied in terms of the relative proportions of the two species. The stands structures present a wide range of diameter categories and offer the most favorable conditions for promoting structure of the uneven-aged stand type, which is characteristic of the natural selection system [
1,
2,
3,
4,
5,
6]. Long-term experiments [
7,
8,
9,
10,
11] revealed the effects of long-term interventions on the structure, growth, and total production of stands [
12]. In order to change even-aged stand structures into structures suitable for 65 forest selection systems, silvicultural conversion treatments are applied [
13,
14,
15,
16] For even-aged beech-coniferous mixed stands in the Postăvarul Massif, the interventions had a character of transformation to uneven-aged structure.
Knowledge of the growth and relationships among trees can explain the development of stands. Interventions carried out on stands result in regulation of the ratio between the number of trees and their growth area. Change in diameter is the most dynamic biometric characteristic due to its sensitivity to silvicultural practices. A reduction in density can result in an acceleration of the diameter increment.
Although a reduction in stocking degree can generate significant growth increases, these increases may be only temporary. If a certain stocking degree is exceeded, this can lead to losses in production and exploitability. The reactions of trees to a reduction in stocking degree, through the activation of diameter increments, are particularly notable in young, vigorous trees [
17]. Stand structure also dictates the growing pattern, with radial stem increments having a linear variation in even-aged stands, whereas a curvilinear variation occurs in uneven-aged stands due to a decrease in the radial increment in trees with large diameters. Therefore, the largest stem increments occur in trees in central categories. The volume increment varies depending on the correlation between height and diameter increments. These aspects—for both even- and uneven-aged stands—have been discussed in detail in the forestry literature [
18,
19,
20,
21,
22,
23,
24,
25] and were expressed in growth functions used in forest modeling [
26], developed at the level of the stand, size class, or single tree [
27].
When no successive inventories are performed, the current annual volume increment (
CAIv) can be determined based on the percentage current annual volume increment (
PCAIv).
PCAIv is based on the diameter and height increments. The models that have been developed express these increments in relation to variables such as diameter, height, and age of the trees. Following the experimentation of three variants of determining Δ
h (measured on felled trees, estimated by dynamic height curve and by conventional height curve) the elaborated models estimate the current volume increment with reduced errors of only 4–9% [
28].
Other studies relating to the physiological processes of trees highlighted that the size of aged trees [
29,
30] (but not necessarily their age [
31]) becomes very important when considering a reduction in their height increments [
32]. The correlation between radial and height increments is weak, such that the diameter increment cannot be used for estimating the height increment. The radial increment has maximum values at different points in a tree’s lifespan, with fluctuations caused by silvicultural practices, site conditions, climatic factors, inter- and intraspecific competition, and niche development [
33]. The correlation between severe periods of reduction in fir growth and climatic factors has also been highlighted by dendrochronological studies [
34] through drought indices. This also has a significant influence on the radial increment in trees [
35,
36].
Diameter strongly influences the
CAIv and, consequently, a tree’s current annual basal area increment (
CAIg) has an equally significant impact on the volume increment. One study on Romanian even-aged stands [
19] highlighted a linear correlation relationship, with high values (
r = 0.80–0.95) occurring in mid-diameter categories between the
CAIg and
CAIv.
It is important to note that all of these determinations, which are aimed at identifying the variability in stand growth and the relation between increments and tree characteristics, require the use of a large number of sample trees. To ensure a sampling error within 10%, for a coverage probability of 95%, it is necessary to take measurements from at least 40–60 trees. If measurements are taken from only 10 trees, the sampling error will be between 20 and 30% [
19].
Understanding the growth behavior of the fir at the local level is essential to the adaptation of its management. The trends in annual increment are also useful for understanding tree vitality. There are differences between the current annual increments of trees and stands and the increment values determined as averages by periods (periodic annual increments). It is therefore useful to know the current increment determined for each year of increment. Furthermore, the size of the CAIv should result from directly measurable elements that intervene in its size. If CAIg and the CAIh or the current annual form height increment (CAIfh) participates in the CAIv, then, in the calculation relations, the annual current values of these characteristics can be entered. The CAIg participates with the largest share in the CAIv, but its contribution in terms of volume increment varies during tree development. Knowing each increment’s contribution to the size of the CAIv during tree development provides information on opportunities for silvicultural work to stimulate the volume increment as well as each increment’s effect on volume increment. The CAIv can be determined by direct measurements or increment cores. When height increment is not measured, it can be determined indirectly using the correlations between height increment and other biometric characteristics of trees. The extraction of increment cores from all the inventoried trees leads to the safest results, but the procedures based on sample trees are also accessible to practice. We wished to consider all these aspects at the structure level, so as to be able to develop biometric relationships that would be useful in silvicultural practices.
The main objectives of this study were (1) develop models to estimate the PCAIh based on the mean tree height of stand, (2) assess the accuracy of the relationship (based on the PCAIg and PCAIfh) for estimating the volume increment at the mean tree and stand level, and (3) assess the possibility of using the mean tree for determining the volume increment of the stand.
2. Materials and Methods
2.1. Materials
Table 1 shows the symbols of the variables used in this study.
Study area: The research was carried out in stands of fir with beech situated in the Valea Cetății watershed in the Postăvarul Massif. The stands are situated at altitudes ranging between 700 and 950 m, on slopes with inclinations of between 20 and 35° and various slope aspects. The area is characterized by multiannual average temperatures of 7–8.3 °C and annual precipitation of around 780 mm. The soils are deep and intermediate-depth eutricambosoils, with a groundcover of
Galium odoratum–
Cardamine bulbifera type. Our study was limited to stands in which fir constituted at least 30% of stands composition (to ensure the sample representativeness). From the stands, we selected a key surface area comprising 10 stands covering 131.8 ha (please see the
Supplementary material).
Field measurements: The stands had average ages of 100–130 years, with disseminated elements that may have reached 140–150 years old. The stands basal area are ranging between 35 and 45 m
2ha
−1. In each stand, observations were made and measurements performed on the site conditions, herbaceous flora and seedlings. To determine the structure of the stands, experimental areas of 0.25–1.0 ha were studied, in which all the trees with diameters greater than 3 cm were inventoried. For each inventoried tree, several biometric characteristics were measured (diameter, height, pruning height, diameter of the crown). In this study, we exemplify the main biometric characteristics for one stand (45°37′05″ N, 25°35′39″ E) representative of a sample area of 1 ha (100 × 100 m) (
Table 2). Of 133 inventoried mature fir trees, we extracted increment cores from 64 trees, with two diametrically opposed cores taken from each, following a direction parallel to the contour line (from 45 trees), and four cores from each, in two perpendicular directions, from trees where the inclination of the ground also permitted the extraction of cores from downstream (from 19 trees, i.e., 166 cores). The trees from which the cores were extracted were selected in report to their basal area on diameter categories. Therefore, for large diameter categories (due to the smaller number of tree) samples were extracted also form outside the 1.0 ha plot. Core samples were extracted from 14 diameter categories (characterized by amplitude that varied between 2 and 8 cm). Thus, the obtained radial growth and the curve of radial increments address the trees growth trend corresponding to all diameter categories. The size of the sample ensured an error of ±8% under the conditions of a probability of 95%, which was established following an examination of the variability of radial increments. In seven felled sample trees with dimensions close to the mean basal area tree, we determined height increments by measuring the stem internode distance from the top to the base. Towards the inferior part of trees (i.e., the first 3 m of stem) where the position of the verticil was not suitable, we used increment cores extracted to the pith (to establish the trees age at different heights).
2.2. Methods
Calculating the growth of trees: The increment cores (extracted to the pith) of trees with different diameters were measured. The measurement of the diameter increment in trees of different ages enabled us to determine their development in relation to the diameter and basal area. Annual height increments, as determined in the sample trees, were expressed as a percentage in relation to the height at the end of the growing period. These data yielded models that expressed the variation in annual increments in relation to the heights the trees reached during their lifetimes. We used the ratio of the heights of mean trees to reconstitute the heights from the beginning of the growing period (0) to the end (n), hg0/hgn.
The diameter increment was determined on the basis of radial increments (ir), according to the relation d0 = dn − 2ir, and the radial increments that we used in the calculations came from the equation for the radial increments curve. Radial increments were measured using a digital positiometer.
The
CAIg (or
ig) still resulted from the difference between the two moments (at the end and beginning of the chosen period), on the basis of a diameter increment, according to the relation:
We used a coefficient for the bark (k) of 1.054, which we determined experimentally as being specific to the stands studied. Bark thickness was measured in 142 fir trees.
CAIh were measured in the felled sample trees within the category of mean basal area tree.
The increment percentages of each biometric characteristic (
d,
g,
h,
fh, or
v) were analyzed at the level of the sample trees from the category of the mean basal area tree (felled). To calculate the percentages of annual increments of the biometric characteristics at the level of average tree (diameter, basal area, height, volume), we applied Pressler’s formula [
22].
The CAIv was determined at the level of the mean tree of the stand and at the level categories of diameter as well as the entire stand. At the category-of-diameter and stand levels, the calculation was similar to that used for an individual tree. To obtain CAIv (or iv), we performed a single inventory based on increment cores.
Based on the diameter and height increments, the diameter and height of the trees could be determined at the beginning of the growth year. The
CAIv was determined by subtracting the volume at the end (
n) from that of the beginning (0) of the chosen period; in the case of the tree, this was
The volume of the trees was determined based on diameter and height by regression equation used for this species in Romania [
23]:
In the Equation (3): a0 = −4.46414; a1 = 2.19479; a2 = −0.12498; a3 = 1.04645; a4 = −0.016848.
The relationships between the volume increments at the tree level (
iv) and stand level (
IV) were developed by introducing the basal areas (
g and
G, respectively) and form heights (
fh) from the beginning and end of the chosen period. For the tree, we reached the known relation
iv =
gnhnfn −
g0h0f0. We expressed the form-height from the beginning of the chosen period (
fh0), based on the form-height increment (
CAIfh or
ifh). We also introduced the
CAIg (or
ig) into the relation of the
CAIv, respectively
ig = gn − g0 and we reached the known relationships: [
18]
iv = igfh n + g0ifh and [
19,
23]:
The CAIv values we obtained by applying the Equations (2) and (4) were considered as reference values. With the CAIv determined by the two relations, we compared the CAIv obtained by applying the simplified relationship-based PCAIv.
The characteristics of the mean trees (of the basal area and of the volume) resulted, indirectly, from the following calculations: dg of the mean tree from the mean basal area (determined by the ratio G/N), the volume of the mean volume tree from V/N, and the form-height (FH) of the stand from V/G.
Finally, we present the value of the CAIs for fir mean tree and stand. They have been determined for a single year of growth, based on the values of the variables measured at the level of year 2017, which followed a period in which the health state of fir in the study area had continuously deteriorated.
3. Results
3.1. Volume Increment of the Mean Tree
The current increment percentages of the mean tree: The CAIv is the result of diameter increment, height, and changes in the stem shape of the trees. In the PCAIv, the PCAIg of the mean basal area tree can be used. The PCAIg has a relatively significant influence on the PCAIv.
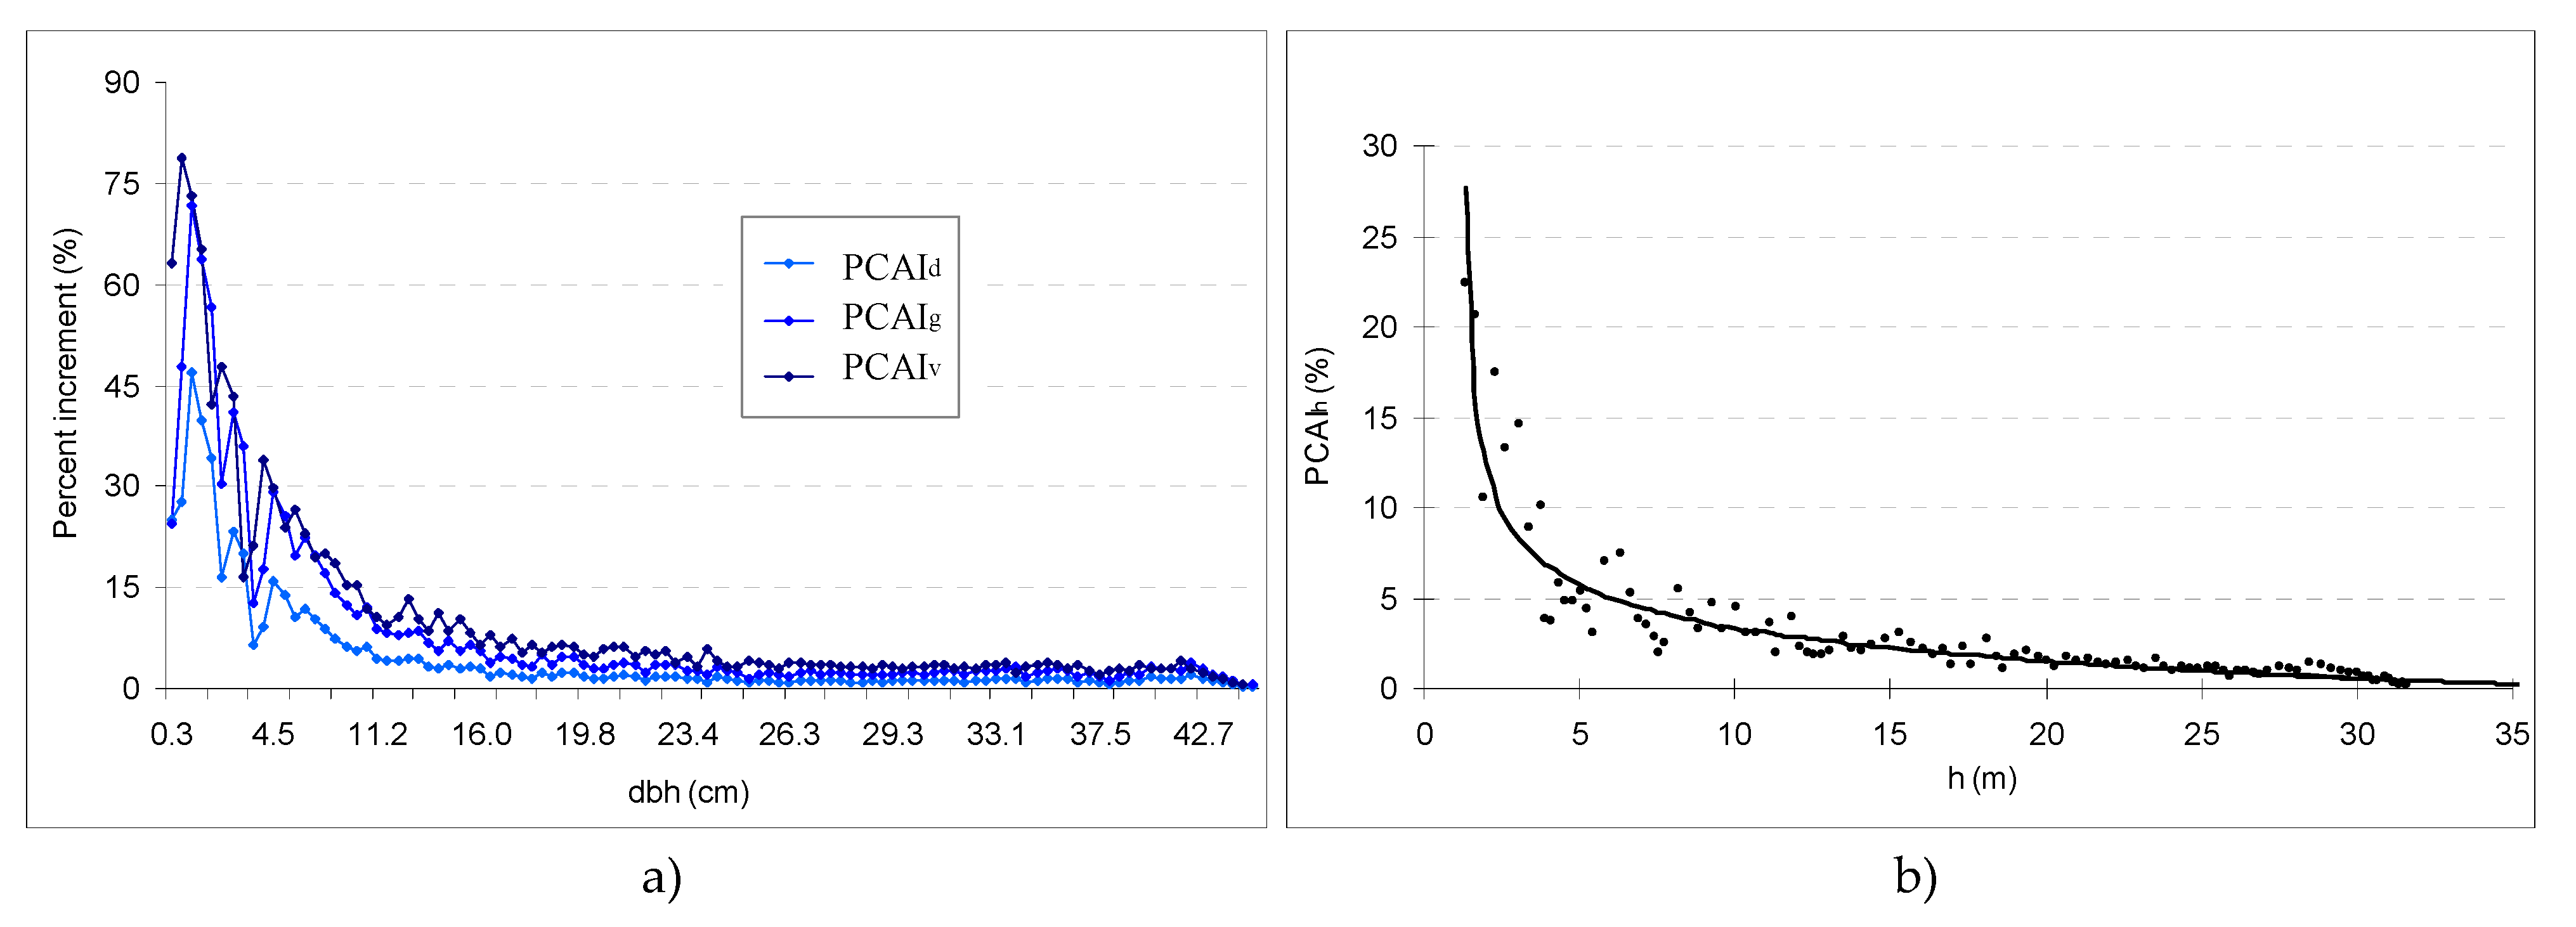
At ages between 110 and 130 years, the
CAIh models indicated a height increment (
CAIh) ranging between 0.8 and 0.14 m. Increments of 0.14 m were recorded in structurally closed stands situated on the lower parts of slopes. The increments decreased toward the higher parts of slopes and toward stand densities less than 0.8. Models assist in predicting annual or periodic height increments in trees of various ages in relation to their heights. Such a model is represented by the equation:
which characterizes the experimental distribution in
Figure 1b, or
In Equations (5) and (6), the CAIh of the trees is expressed as a percentage in relation to their height at the end of the chosen period. The models become applicable if the height of the tree is known, based on a single inventory. In turn, the variation in height in relation to age can be explained through the development function. The height can also be determined by means of the height curve, which expresses the variation of the height in relation to the diameter of the trees. Equations (5) and (6) explained 84–86% of the variation units in the CAIh. The height and diameter significantly influence the percentage annual height increment (PCAIhs) and explain its tendency (R2 = 0.91–0.93).
The percentages of the increment of each biometric characteristic (
d, h, g, or
v) diminish as a tree advances in age (
Figure 1).
Relationships between the current increment percentages: Throughout a tree’s development, the percentage increments
PCAIg and
PCAIh changes from one year to the next and from one development period to the next (
Table 3). Together,
PCAIg and
PCAIh determine the tree’s volume increment and ensure its tendency, as expressed by the functions of growth and development.
Fir trees presented the highest percentages of growth during the period between 15 and 55 years. The greatest contribution of the PCAIh in the PCAIv (42%) is made during the period between 56 and 85 years. After this interval, the contribution of PCAIh in PCAIv climbs as high as 20%. Between 85 and 115 years, PCAIv was 2.92% on average and this is largely (80%) attributable to the PCAIg.
The annual percentages of the increments established at the sample-tree level prove known relationships:
and:
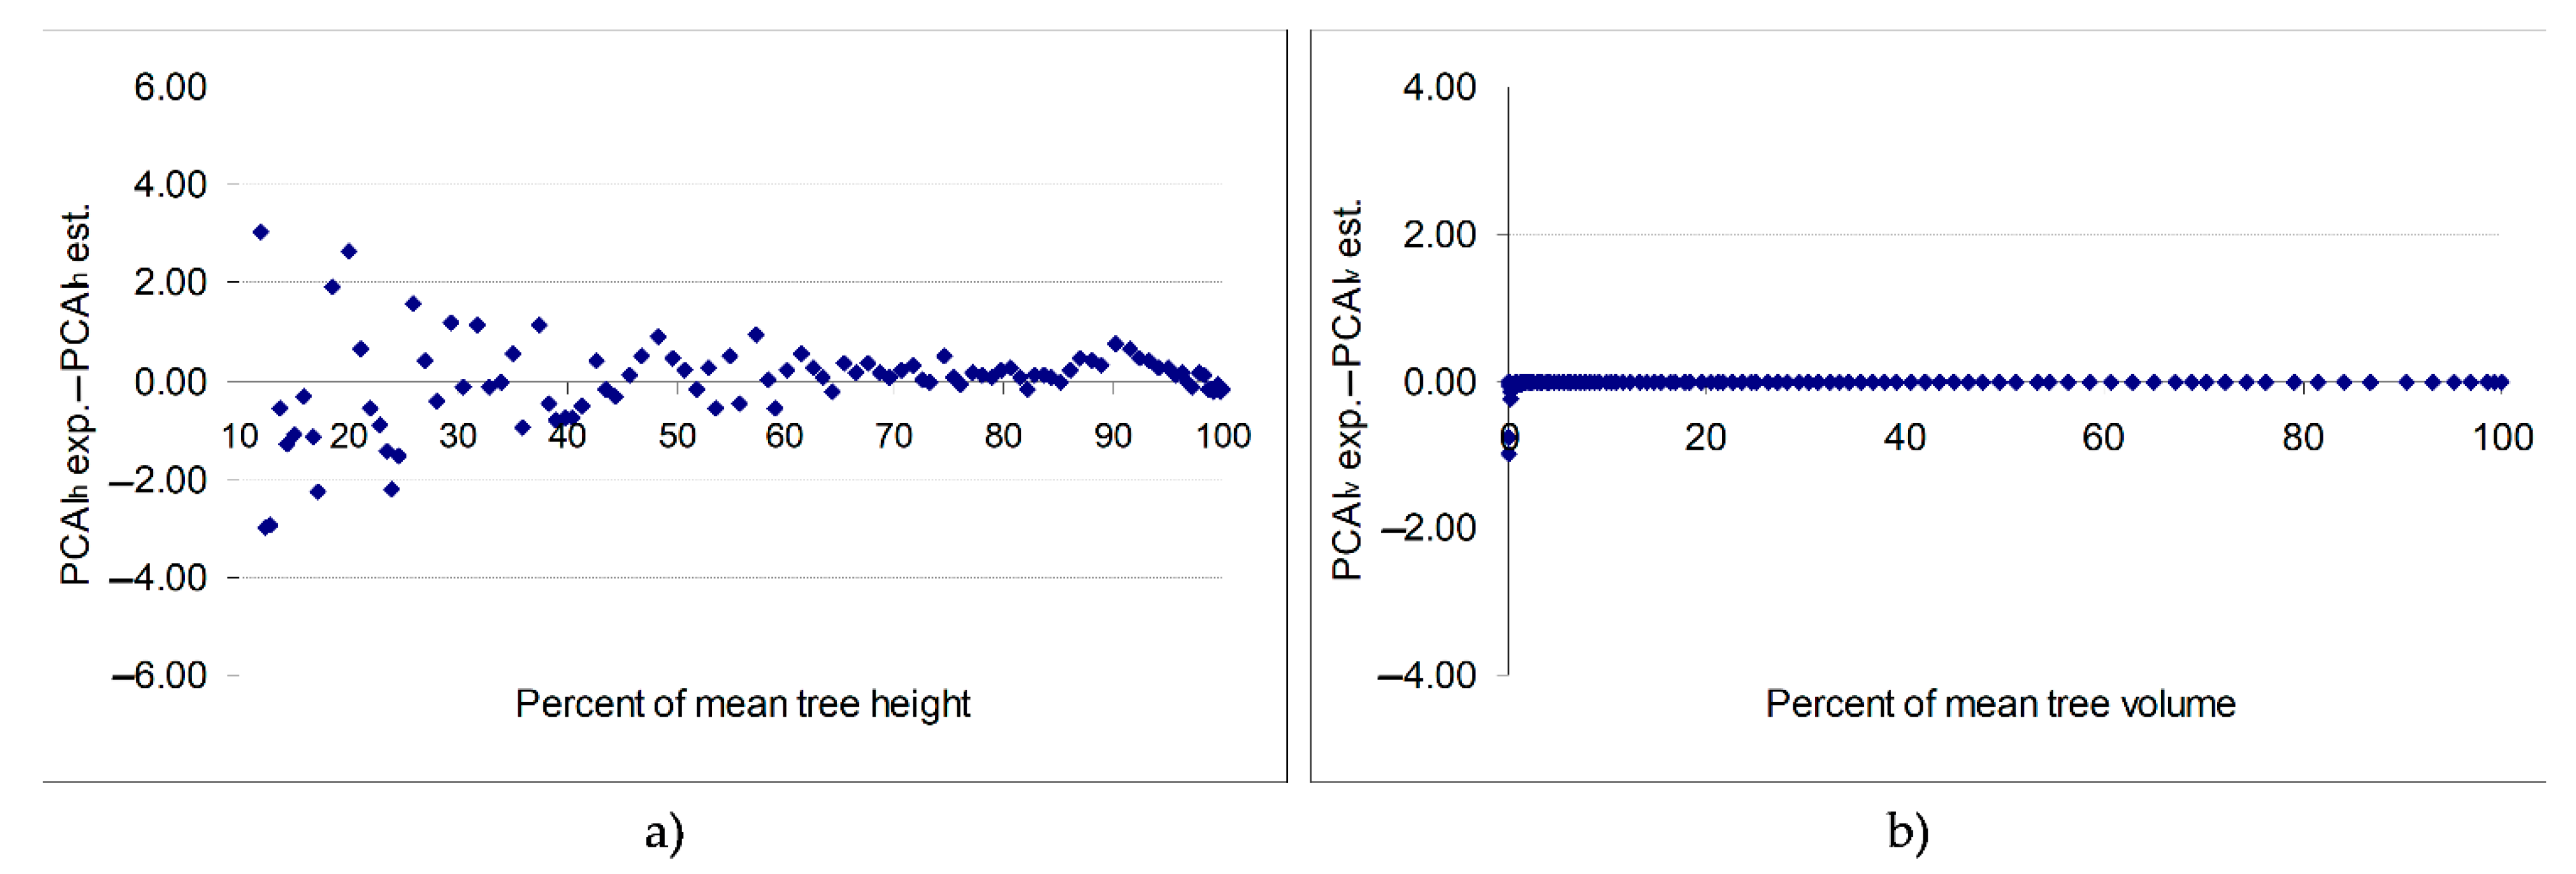
The differences between the experimental values of the percentage of height increment and those estimated by the models diminished as the trees grew in height (
Figure 2a). The average deviations of the experimental values of %ih, in comparison to the values estimated by the equation (BIAS), were +0.001483 and the average of the squares of the deviations RMSE was 0.87490. Using Equation (7) to calculate the
PCAIv yielded an average deviation in the experimental values of
PCAIv, compared to the values estimated by the relation, of −0.027425, with an average of the squares of deviations of 0.129521 (
Figure 2b and
Table 4). When
CAIfh was related to the height of the trees at the end of period for the calculation of the
PCAIfh, the BIAS was 0.019223 and the RMSE was 0.050536. Furthermore, the values of the deviations decreased for volume—just as they did for height—as the volume of the trees increased (
Figure 2b). This can be explained by the reduced weight of the percentage
PCAIh in relation to volume as the trees advanced in age. The accumulation in volume, then, is largely due to annual basal area increments.
During tree development, the contribution of each biometric characteristic to the volume differs. Therefore, it is natural that, at different moments in tree development, the percentages of the biometric characteristics would have variable proportions relative to the
PCAIv. For Equation (7) the participation of the respective percentages in the
PCAIv was expressed by the coefficient
ki (i = 0.1 to 1.0 h). For Equation (7) we noted the stability of the
ki, which decreased throughout the development of the trees (
Table 4). Thus, this relationship can be recommended for determining the current volume increment.
Current annual increment of the mean tree: The CAIv of the mean tree resulted from the application of Equations (2) and (4) adapted to the level of the individual trees, as well as Equation (7). Through the Equations (2) and (4), the same CAIv value resulted: 17,937 dm3.
PCAIv-based relationship (expressed by Equation (7)):
also led to a value close to the size of 17,937 dm
3, the difference being +0.4%.
3.2. Stand Growth
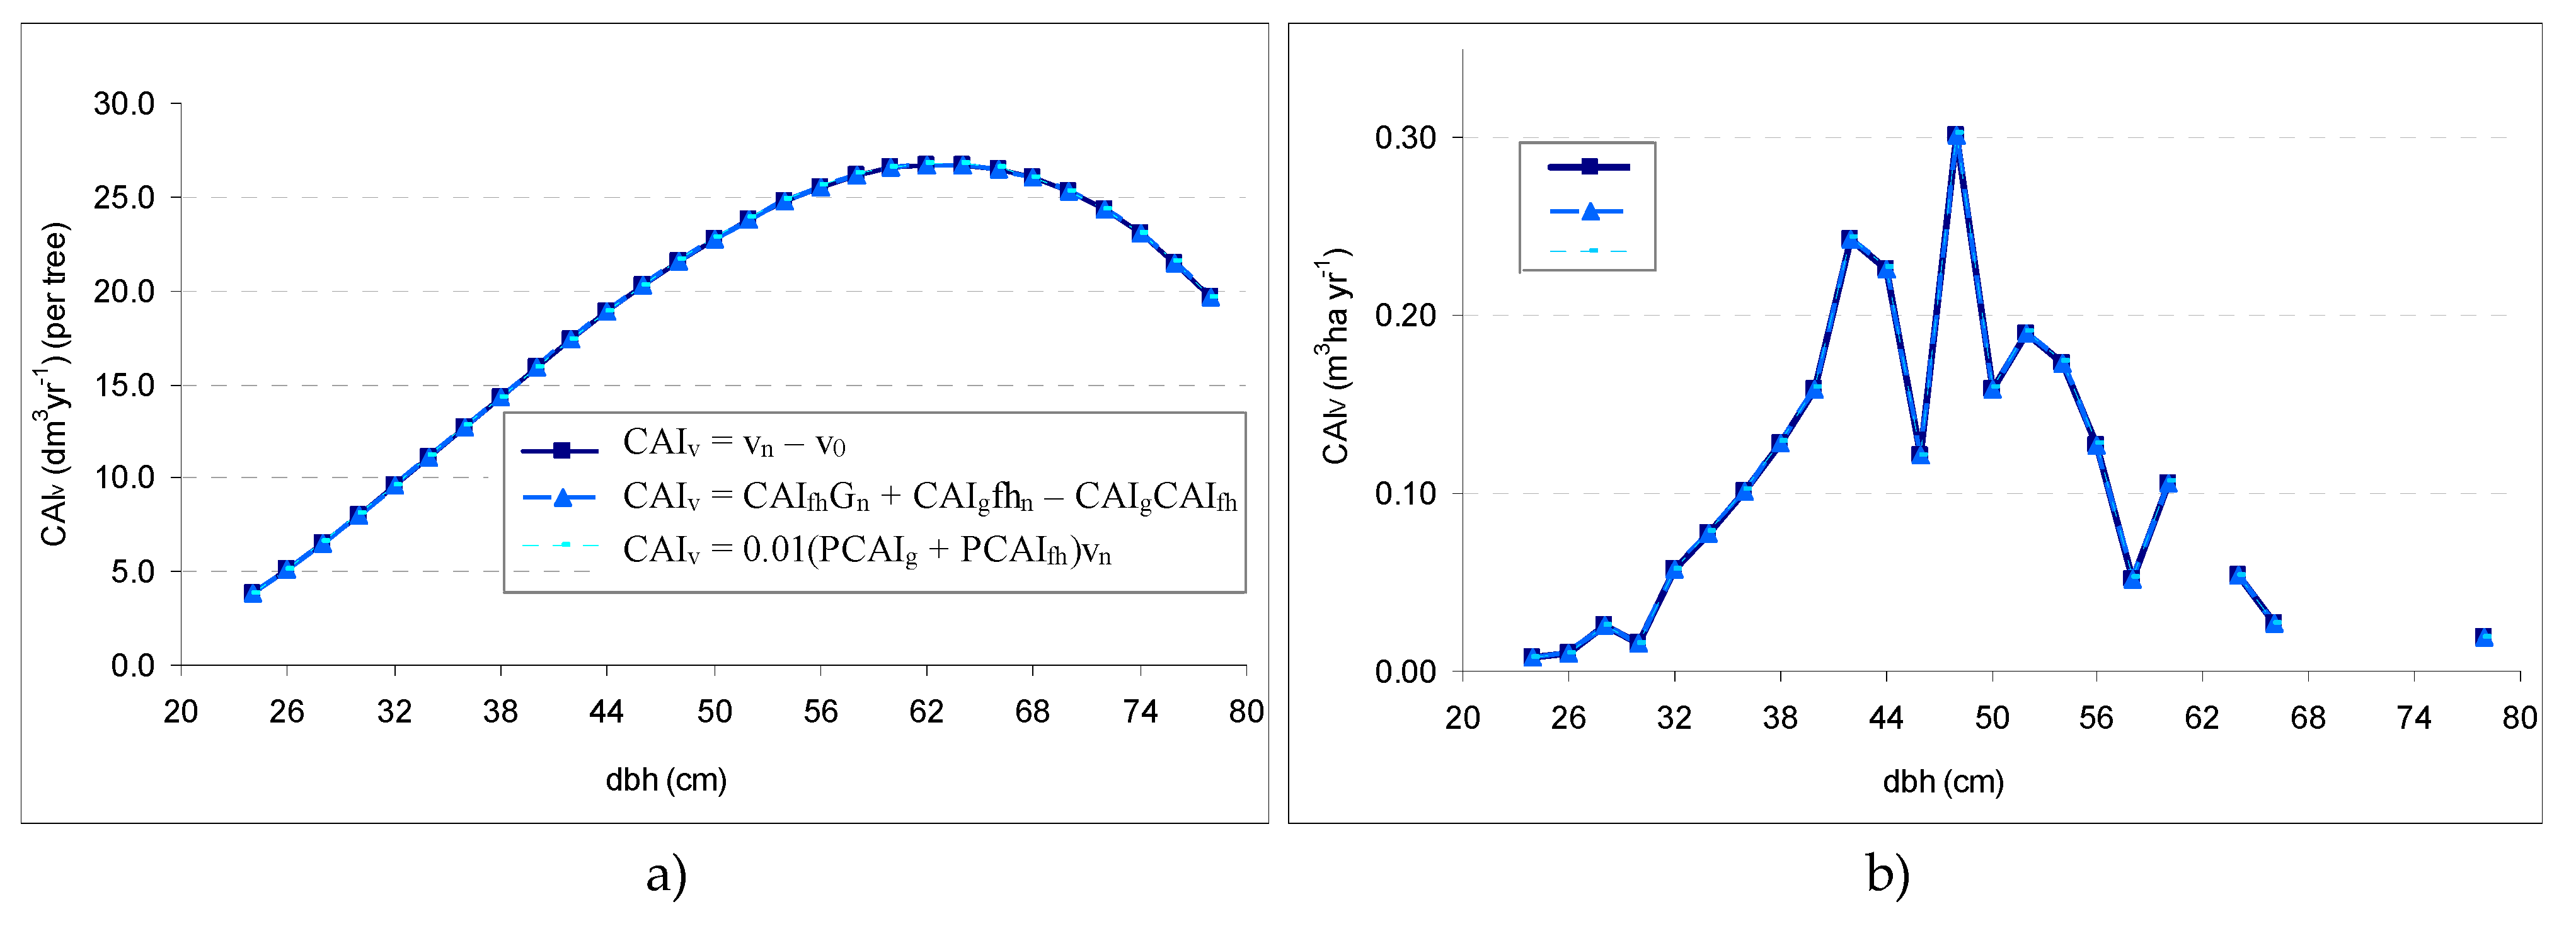
The CAIV of the stand was produced by applying Equations (2), (4), and (7) to the category-of-diameter and entire-stand levels. The CAIh was determined by the regression Equation (5).
At the category-of-diameter and stand level, the calculation was similar to that used for an individual tree. At the level of the entire stand, we introduced into the calculations the values of the biometric characteristics from the level of the entire stand. By applying Equations (2) and (4) similar value for
CAIV as those obtained (i.e., 2.38 m
3 yr
−1). Of the simplified Equation (7), based on the percentage-of-form-height increment (
PCAIfh), presented the greatest stability. This can be applied to determine the volume increment of individual trees (
Figure 3a) and the stand (
Figure 3b).
By applying the simplified Equation (7), the volume difference compared to Equations (2) and (4) was +0.4%.
The Mean Tree of the Stand
Given the elements that impact volume increment, more attention should be paid to the basal area of the stand and the CAIG than to the form-height of the stand (FH).
When applying Equations (4) and (7), the form-height can be deduced from the volume of the mean volume tree or the stand volume. Using only the two trees (i.e., mean basal area tree or mean volume tree) in the calculation of volume increment leads to +8.6 and +8.9% errors (
Table 5). The tree with the mean current annual volume increment (
) is a hypothetical tree that may have the
and FH.
Furthermore, upon analyzing the results from
Table 5, it results that, for the structural conditions of the studied stands (i.e., even-aged structures), the diameter of the real tree with represent about 95% of the
dg. It results that the growth determination based on measurements of trees from the categories of the two trees (i.e., mean basal area tree and mean volume tree) can lead to values of current volume increment close to the values of the tree with
. Thus, the field works can be simplified.
In
Figure 3a, it is clear that the trees in the superior-diameter categories, due to their large exchange surfaces, also recorded the greatest volume increments. It was found that the
CAIv per tree was influenced by weight of trees by category of diameter, and that the measure of the
CAIv of a stand depended on the respective size of the growing stock on the distribution of tree volume by diameter category.
In
Table 5, the
CAIvs of the mean trees were determined using the Equation (4). For comparative purposes, we used the average value of the
CAIv per tree: 17.937 dm
3.
4. Discussion
4.1. Relationships between Tree Growth and Biometric Characteristics
Due to fluctuations in the radial increments, the maximum diameter increment occurred at different moments in the lifetimes of the trees. The trees with higher radial growths also have large volume growth. Remarkable volume growths were found in the diameter categories with the greatest volumes. However, these trees, in the conditions of the lower-altitude limit, do not have the largest radial increments. For older stands, the radial growth-diameter relationship can be expressed by a second-degree parabola. Expressing radial growth or diameter growth by a line or a logarithmic equation may overestimate the radial growths of older trees. Because stands are suited to uneven-aged structures, the study of increments is of interest, especially for establishing target diameters after which the stand structures may be modeled.
The maximum height increment was influenced by the position of the trees, their vitality and their stationary conditions. Just as with the diameter increment, the height increments of the studied stands, expressed in Equations (5) and (6), presented reduced values. The height increment values measured in the sample trees, expressed as a percentage in relation to the height, diameter or age, indicated the same decreasing tendency, with height and age explaining a variation in percentage of the height growth of 85%. Other studies [
28,
31] show that the age of trees does not statistically explain the reduced height gain, but the size of the trees significantly influences it.
Throughout the life of a tree, the rhythm of the diameter increment differs from that of the height increment. At the sample-tree level, the
PCAIv is particularly influenced by
PCAIg, with the correlation being very strong (
R2 = 0.99). The
PCAIh also influences the volume increment (
R2 = 0.86). In the
PCAIv of the trees,
PCAIh has a low share, around 20% (
Table 3). Therefore, the
CAIv of trees is achieved mostly (approximately 80%) based on the
PCAIg.
Trees distribute their maximum radial increments at different times in their lives, depending on the structural conditions. The measurements performed on the felled sample-trees, from the category of the mean tree, show that the height increment contributed the greatest weight to the volume increment, among trees aged 55–65 years, when the trees grew 0.5–0.6 of the mean tree height at the end of the growing year, and 0.2 of their volume. At this point, the diameter increment had the lowest proportion of volume increment, but after this moment, the proportion of the diameter increment began to increase, while the proportion of height increment decreased. Thus, after 85 years, a progressively accentuated thickening of the stem occurs. In this period, trees grow 22% of their height increment and 16% of their form-height.
The form factor also decreased as the trees grew in diameter, from a value of 0.505 (for trees with
d = 24 cm and
h = 26 m) to 0.392 (for trees with
d = 78 cm and
h = 35.1 m). Fluctuations in the form factor depended on two variables: tree diameter and height. For short periods of time, the form factor gave reduced variations or remained constant [
37], so that its value did not influence the measurement of the
CAIv, which was determined by successive inventories. For the example presented, the value of the form factor of the stand remained almost unchanged (from 0.4486 in 2016 to 0.4482 in 2017).
The
PCAIh determined on the basis of experimental data produced values of height increment close to those reported in the existing literature [
38] for fir stands in Romania [
39].
4.2. Precision in Estimating the Current Volume Increment Using Simplified Relationship
Efforts have been made to establish simplified relationships for determining the
CAIv. In the literature, formulae based on the
PCAIv have been proposed by Dvoreţki, Tiurin, Anucin, Pressler, Breymann, Schneider, and Prodan (see Giurgiu, 1979). We have used only the equation for the
PCAIv:
piv =
pig +
pih +
pif [
22]. The precision of the different formulae varies. The formulae of Tretiacov and Dvoreţki [
19] lead to mean squared errors when determining the
PCAIV, ranging between ±9 and ±13%, but the determination errors can reach up to 20%, especially for short observation periods of 3–5 years.
Simplified relationships are based on strong correlations between the percentages of mean-tree growth. It is known that, throughout a tree’s lifetime, the percentages of biometric-characteristic increments vary from one year to the next, but, on the whole, they preserve a decreasing tendency. Elements such as
CAIg, CAIfh, basal area, and form-height at the end of the growth period decisively influence the volume increment [
18].
The precision of the
CAIv determinations based on successive inventory (Equation (2)) was categorically influenced by errors in the respective volumes e
Vn% and e
V0%. These volumes were determined using Equation (3). Errors in the two volumes depended on the errors with which the variables introduced in their calculus were determined. For a probability of 95%, the interval of errors reaches of 8–10% [
37]. Under our study conditions, the tree diameters were determined based on circumference, the heights were measured in all 133 samples, and the form factor was found using the volume of the trees, so we can consider that the error in volume increment determined by successive inventories reached a maximum of 10%.
According to Krenn’s equation [
18], in the case of successive inventories, the greater the volume of the stand and its determination error, the less the growth in the volume of the stand, and the greater the volume increment error. For periods of 10 years, the error in
CAIv, obtained by applying the equation based on form-height and basal area (Equation (4)) from the beginning of the observation period, was ±8%, decreasing to ±2.4% when the period was extended to 40 years [
18].
In the case of simplified relationship (Equation (7)), the error in
CAIv (e
CAIv) depends on the error involved in determining the volume (e
v), the volume to which
PCAIv is applied, and the error in the
PCAIv (e
PCAIv). Thus, the error in volume increment could be written:
The error involved in determining the volume of the trees and the stand (ev) can be considered to be ±10%. In determining the error in the PCAIv, the error in PCAIg (ePCAIg) and the error in the PCAIfh (ePCAIfh) intervene. By analyzing radial increments from 64 trees, the error ePCAIg was found to represent ±8%. Given that ePCAIfh represents around 25% of ePCAIg, we can consider that ePCAIph represents 2%. By introducing these values into each relationship (10), errors in volume increment fall within ±13% (in ~90% of the cases). These errors also include possible errors in determining the volume of the trees using Equation (3). Only the error in determining the PCAIv (ePCAIv), obtained by applying the relation (7), is ± 8%.
4.3. Practical Utility of Volume Increment Relationship
The relationships used to determine the CAIv can also be applied to cases where a single inventory is carried out at the end of the chosen period. In such cases, to determine CAIg, the extraction of increment cores is necessary. If the CAIh cannot be measured, it can be determined with the help of Equations (5) and (6). Because the form factor fluctuates throughout the lifetime of trees, it is best that the form-height be determined from the volume of the stand. However, the use of the volume, both at the end and beginning of the chosen period, leads to diminishing errors in determining volume increments.
At the level of the mean tree, using simplified Equation (7) to has led to values of the
CAIv (17.937 dm
3) that are close to those obtained using Equations (2) and (4) (
Table 6). Annual increments in height of 0.08 m were obtained by other studies carried out on fir located at its southernmost distribution limit, but at tree heights of 42.5 m [
32].
At the level of the stand, the
PCAIv of the mean tree (0.80 from
Table 3), obtained using Equation (7), applied to the volume of the fir stand, produced a measure of growth of 2.39 m
3yr
−1, which is 0.009 m
3 greater than the (+0.4%) current growth of the tree (
Table 6).
Limits to the simplified relationship: The simplified relationship, Equation (7), introduced the entire measure of PCAIfh into the calculation, together with the PCAIg. This made it applicable to any structural conditions, both at the level of individual trees, category of diameter and the entire stand.
The adaptation of silvicultural work in fir stands: This study showed that, at their lower-altitude limit, old, even-aged stands have lower growth. Future structures of fir and beech mixed stands will need to be adapted to ensure a better representation of younger generations in the stands [
5,
6]. These generations are capable of ensuring the continuity of the protection functions attributed to such stands as well as their stability. To create such structures, silvicultural interventions in the stands need not delay placing installed seedlings in sunlight or extracting trees in the central categories that hinder the stand’s development. For stands in transformation, the necessity of installing and developing new generations dictates the timing and intensity of such interventions. By the age of around 80 years, silvicultural works should aim to stimulate the growth of trees in height—and after that age, growth in diameter. The deciduous species that naturally regenerate and are encountered in mixed stands, such as sycamore maple and mountain elm, need to be given the chance to contribute to the composition of these stands. The creation of diversified vertical structures must be a condition of sustainable silvicultural work on such stands. Thus, stands will be able to maintain their vitality and their capacity for regeneration at any moment in their existence. The natural regeneration of mixed stands also creates the premise of being able to capitalize on local provenances that are much better adapted to the prevailing environmental conditions [
40]. Such characteristics should constitute targets for silvicultural work on the future structures of fir and beech mixed forests.
5. Conclusions
By applying silvicultural works, the stand structure and, implicitly, the relationships between the trees change, against a background of site conditions. These influences are recorded by the trees and are displayed in their growth. The CAIv is the result of diameter increment, height, and changes in the stem shape of the trees. The percentages of the increment of each biometric characteristic (d, h, g, or v) diminish as a tree advances in age. The height increment of the mean tree can be determined by the models expressed by Equations (5) and (6). The differences between the experimental values of the percentage of height increment and those estimated by the models diminished as the trees grew in height. The average deviations of the experimental values of PCAIh, in comparison to the values estimated by the equation, was 0.001483, and the RMSE was 0.87490. The CAIv of the tree was produced by applying relationship of the PCAIv. Using Equation (7) to calculate the PCAIv yielded an RMSE in the experimental values of PCAIv, compared to the values estimated by the relation, of 0.129521. When CAIfh was related to the height of the trees at the end of period for the calculation of the PCAIfh the RMSE was 0.050536. At the level of the mean tree and stand, the simplified equation (Equation (7)) has led to values of the CAIv, and respectively CAIV, that are close (0.4%) to those obtained using relationship based on basal area and form-height increments and relationship based on successive inventory.
The CAIV of a stand can be determined on the basis of the CAIv of the mean current volume increment tree. The tree with the average value of the CAIv of all trees is influenced by the structure of the stand, and its biometric characteristics are difficult to determine because they are specific to each structure. The characteristics of such a tree can be linked to the characteristics of the mean basal area tree and of the mean volume tree, which are easy to determine by means of a single inventory at the end of the chosen period. In even-aged stands, the mean current volume increment tree is a hypothetical tree that may have the mean basal area and the form-height of the stand. Such research should be continued on several felled sample trees in order to further clarify this statement in different structural conditions.
This study on the trees in the area shows that the fir trees maintain their ability to record active height increments until around the age of 80 (with a maximum between 50 and 60 years). After this age, the trees continue to accumulate significant increases in diameter. The reduction of stand density through silvicultural work must be correlated with these moments, which may prevent volume growth losses and increase final production.


