Article

The Effect of Crown Dimensions on Stem Profile for Dahurian Larch, Korean Spruce, and Manchurian Fir in Northeast China

Key Laboratory of Sustainable Forest Ecosystem Management-Ministry of Education, School of Forestry, Northeast Forestry University, Harbin 150040, China
*
Author to whom correspondence should be addressed.
Forests 2021, 12(4), 398; https://doi.org/10.3390/f12040398
Submission received: 1 February 2021 / Revised: 19 March 2021 / Accepted: 25 March 2021 / Published: 28 March 2021
(This article belongs to the Section Forest Ecology and Management)

Abstract

:
Crown architecture has long been evaluated for its impact on taper modeling. However, most of the research has focused on a limited number of crown dimensions. This study examined the effect of adding several crown dimensions in improving the diameter and volume estimates of Dahurian larch, Korean spruce, and Manchurian fir in northeast China. The crown dimensions included crown length, crown ratio, crown width, height to live crown base, diameter at the crown base, and crown shape. A well-known taper model of Clark et al. (1991) was fitted to the data of 276 trees from natural stands. To adjust the inherent autocorrelation in the data, we added a third-order continuous-time error structure in the model fit. Model fitting was carried out with the NLMIXED procedure (Non-linear Mixed Procedure), followed by the MODEL procedure of SAS using the generalized nonlinear least-squares method. Fit statistics and graphical assessments were used to evaluate the original and modified models. Above 98% of the total variance of d was explained by the models for all species. The addition of crown variables showed slight improvements for root mean square error (RMSE) values in the analyzed species. The RMSE plots indicated that the models with crown variables slightly improved the diameter and volume predictions for the species but only for the upper stem (>50%–90%). The study demonstrated that crown dimensions influence the stem taper, but the original model of Clark et al. (1991) reasonably realized that effect.

1. Introduction

The forests of northeast China represent about 30% of the total forest area in China and serve as a national base of wood products. Additionally, almost half of the national ecosystem carbon is stored in these forests [1]. NE China hosts different forest types, ranging from temperate broadleaf forest to boreal taiga forest. Coniferous forest mainly includes Dahurian larch (Larix gmelinii Rupr.), Manchurian fir (Abies nephrolepis), Korean spruce (Picea koraiensis Nakai), and Korean pine (Pinus koraiensis Siebold & Zucc.). The region falls under the boreal continental climate and is characterized by the southern border of the discontinuous permafrost zone [2,3].
Dahurian larch, Korean spruce, and Manchurian fir are valuable conifer species with a corresponding volume of 955.2 million m3, 1001.6 million m3, and 1135.6 million m3 in this region [4]. These species provide plywood, veneer, and high-quality timber for construction, railway sleepers, and shipbuilding. Other uses include soundboards for musical instruments, boxes, and raw materials for the pulp industry. Besides wood products, forest management objectives in China include biodiversity conservation, soil protection, and carbon sequestration [5]. Taper models have been used to estimate tree volume and biomass simultaneously, which allows for extending the timber inventories to ecological studies [6]. Accurate growth and yield modeling is a critical step in this direction to know the potential productivity of natural forests [7].
Stem taper models are an essential component of growth and yield modeling. Taper models can predict the stem diameter at any height (d), along with merchantable and total volumes [8]. Taper models should also be consistent with the known ecophysiology of trees [9]. Generally, several factors influence the stem shape of trees, e.g., genetic make-up [10], crown characteristics [8], stand characteristics [11], site quality [12], climatic factors [13], and silvicultural treatments [14]. These factors have an important role in taper modeling [15] and have been added as auxiliary variables to conventional independent variables, i.e., total height, diameter at breast height, and height above the ground.
While summarizing the principal factors affecting the stem form, [16] revealed that the variation in stem taper had a reasonably high correlation with the size of the tree crown and the length of the branch-free stem. The tree crown refers to the size, shape, and branching architecture of a tree. Physiologically, the tree crown is the most active part of the tree as it intercepts light for photosynthesis [17]. The photosynthetic activity produces carbohydrates for the development and growth of the tree [16,18]. Crown information helps to investigate several attributes of the forest ecosystem, e.g., sustainable productivity, biodiversity, aesthetics, and wildlife [19].
It was suggested by [16] that differences in stem form are mostly associated with the variation in crown length. Several authors incorporated the crown ratio into taper models to improve the prediction accuracy [20,21,22]. However, other crown dimensions are also suggestive of crown production capacity. Crown shape reflects the intercepting ability of solar radiation [23]. The horizontal area of crown and diameter at the crown base correlates with inter-tree spacing and, therefore, not only indicates the competition among trees but also reveals the available sunlight for a stand. Adding these variables improves the fitting and flexibility of taper models [18]. However, these improvements depend on the species, region, and other factors mentioned above [8,22].
Previous research has received mixed results of incorporating crown variables in taper models. It was observed by [22] that combining the crown ratio variable increased the predictive ability of the Kozak (1988) model [24] for lodgepole pine (Pinus contorta Dougl. ex. Loud) in British Columbia. Reference [18] found that the Max and Burkhart (1976) model with the crown length and crown ratio was more precise for loblolly pine (Pinus taeda L.) in Uruguay [25]. Reference [8] incorporated crown length, crown ratio, and height to live crown base in several taper models for balsam fir (Abies balsamea (L.) Mill), red spruce (Picea rubens Sarg.), and white pine (Pinus strobus L.) in North America. Although incorporating additional covariates reduced the bias and root mean square errors significantly in volume estimates, the impact on diameter estimates was nominal. References [26,27] included crown variables in the Clark et al. (1991) model for yellow poplar (Liriodendron tulipifera L.) in West Virginia and black pine (Pinus nigra J.F. Arnold) in Turkey, respectively. Both studies suggested that the improvements were too slight to justify the addition of covariates. References [20,28] did not ascertain the feasibility of adding crown ratio in different taper models for the plantations of Pinus taeda in the USA and Larix gmelinii in NE China, respectively.
In general, using crown variables as additional covariates is not warranted due to the difficulties of acquiring crown measurements coupled with a minor increase in the predictive abilities of taper models [29,30]. However, [31] suggested that the objective of using additional covariates should not only be to increase model accuracy but also to confirm biologically acceptable extrapolations.
Over the years, mixed-effects models have gained attention in taper modeling [19,32,33]. Mixed models contain both fixed effects and random effects parameters to explain between-tree and within-tree variations in taper studies. Random effects in mixed models should have a biological association with tree variables. We used tree-specific mixed-effects modeling to investigate the connections between random parameters and crown variables.
Previous taper studies have mainly examined the influence of limited crown dimensions. In this analysis, crown variables included crown length (CL), crown ratio (CR), crown width (CW), height to live crown base (HCB), diameter at crown base (CD), and crown shape (CS, CS = CW/CL). This study aimed to assess the effectiveness of adding several crown variables in the Clark et al. (1991) [34] form-class segmented model. The specific objectives were to (i) evaluate the addition of CL, CR, CW, HCB, CD and CS as independent variables in improving diameter and volume estimates of Dahurian larch, Korean spruce, and Manchurian fir in NE China and (ii) assess the effects of the crown variables on taper formation of the species.

2. Materials and Methods

This study was carried out at Lilin forest farm (129°15′–129°30′ E, 48°74′–49°9′ N), covering an area of 8128 hm2, administered by Wuying forest bureau, Heilongjiang province, NE China. The study area falls in the cold temperate forest, and the prevailing climate is continental with summer monsoon. The mean annual precipitation fluctuates between 550 and 600 mm, and the range of mean annual temperature is 0 °C to 2 °C. The predominant forest types are Larix gmelinii, Picea koraiensis, Abies nephrolepis, and deciduous broadleaf mixed forest [35]. The typical soil of the area is dark brown forest soil [36].

2.1. Data Description

A sample of 276 trees was collected from uneven-aged natural stands, representing the existing range of diameter and height classes in the study area. The sample comprised 109 trees of Dahurian larch, 103 trees of Korean spruce, and 64 trees of Manchurian fir. Diameter at breast height over bark (D, 1.3 m) and crown width (CW) were recorded to the nearest 0.1 cm for all trees. Crown width was calculated by taking the average of two projections of perpendicular axes from the crown base to the ground. Trees were felled to measure total tree height (H), height to the live crown base (HCB), and stem diameter over bark at the crown base (CD). The live crown base was considered to be at the lowest branch whorl. Diameters over bark (d) were measured at the heights (h) of 0.3, 0.6, 1, 1.3, and 2 m. After the height of 2 m, d was measured at a fixed interval of 1 m. The measurement range was 0.3 to 1 m along the stem except for the top section, which was considered as a cone. Two perpendicular diameters (over bark) were measured, and their average was used. Smalian’s formula [37,38] were used to calculate log volumes that were added to the volume of the cone to get over bark total volume. Finally, crown length (CL), crown ratio (CR), and crown shape (CS) were derived using the crown measurements. The ratio between crown length and total tree height determined the crown ratio. The ratio between crown width and crown length provided the crown shape. The summary statistics of the datasets are shown in Table 1.

2.2. Taper Model

We used the model of Clark for this analysis. The selected model has shown excellent results for many species. For example, (i) for several conifer species in the southern USA and Northeast China; (ii) for loblolly pine (Pinus taeda L.) in Brazil; (iii) balsam fir (Abies balsamea (L.) Mill.) and red spruce (Picea rubens Sarg.) in North America; and (iv) for Brutian pine (Pinus brutia Ten.), Scots pine (Pinus sylvestris L.), Lebanon cedar (Cedrus libani A. Rich.), Cilicica fir (Abies cilicica Carr.), and Black pine (Pinus nigra Arnold.) in Turkey [8,34,39,40,41].
The model of Clark comprises Schlaegel’s form-class model and Max and Burkhart’s segmented model.
d = { I S [ D 2 ( 1 + ( b 2 + b 3 / D 3 ) ( ( 1 h / H ) b 1 ( 1 1.3 / H ) b 1 ) 1 ( 1 1.3 / H ) b 1 ) ] + I B [ D 2 ( D 2 F 2 ) ( ( 1 1.3 / H ) b 4 ( 1 h / H ) b 4 ) ( 1 1.3 / H ) b 4 ( 1 5.3 / H ) b 4 ] + I T [ F 2 ( b 6 ( h 5.3 H 5.3 1 ) 2 + I M ( 1 b 6 b 5 2 ) ( b 5 h 5.3 H 5.3 ) 2 ) ] } 0.5
where d = diameter over bark at height h (cm), D = diameter at breast height over bark (cm), h = height above ground along stem (m), F = diameter at 5.3 m height, bi = regression coefficients for different stem sections i.e., b1, b2, b3 for <1.3 m, b4 for 1.3–5.3 m and b5, b6 for >5.3 m. Four indicator variables are defined as follows:
I S = { 1 h < 1.3 0 otherwise I B = { 1 1.3 h < 5.3 0 otherwise I T = { 1 h > 5.3 0 otherwise I M = { 1 h < ( 5.3 + b 5 ( H 5.3 ) ) 0 otherwise

2.3. Model Derivation

Initially, the fitting of Clark’s model was carried out using tree-level mixed-effect modeling (Non-linear Mixed Procedure (NLMIXED procedure) in SAS). The general mixed-effects model of Clark is
d = { I S [ D 2 ( 1 + ( b 2 + μ 2 ) + ( ( b 3 + μ 3 ) / D 3 ) ( ( 1 h / H ) ( b 1 + μ 1 ) ( 1 1.3 / H ) ( b 1 + μ 1 ) ) 1 ( 1 1.3 / H ) ( b 1 + μ 1 ) ) ] + I B [ D 2 ( D 2 F 2 ) ( ( 1 1.3 / H ) ( b 4 + μ 4 ) ( 1 h / H ) ( b 4 + μ 4 ) ) ( 1 1.3 / H ) ( b 4 + μ 4 ) ( 1 5.3 / H ) ( b 4 + μ 4 ) ] + I T [ F 2 ( ( b 6 + μ 6 ) ( h 5.3 H 5.3 1 ) 2 + I M ( 1 ( b 6 + μ 6 ) ( b 5 + μ 5 ) 2 ) ( ( b 5 + μ 5 ) h 5.3 H 5.3 ) 2 ) ] } 0.5
where μ 1 , μ 2 , μ 3 , μ 4 , μ 5 , μ 6 are random parameters. All other variables are the same as described earlier.
After identifying the best combinations of random- and fixed-effect parameters, we substituted the random parameters with crown variables [28]. For the selection of best combination, the criteria were (1) Akaike’s Information Criterion (AIC), (2) Schwarz’s Bayesian Information Criterion (BIC), and (3) twice the negative log-likelihood (−2Ln (L)).

2.4. Parameter Estimation/Model Fitting

In the final step, seven models were fitted: The Clark model with and without crown variables (CL, CR, CW, HCB, CD, and CS). Mixed-effects modeling was not used at this stage because it requires calibration for improving the diameter estimates. Mixed-effects modeling was only carried out in the initial step to identify the random parameters [28].
The model parameters were estimated with the MODEL procedure of SAS using the generalized nonlinear least-squares method [38]. The spatial correlation was expected within the observations due to the hierarchical data of the study. We instituted a third-order continuous autoregressive error structure (CAR (3)) to adjust the innate autocorrelation. This specified error structure allows the practical use of a model for irregularly spaced and unbalanced data [42]. Programming for CAR (3) structure was worked out in the MODEL procedure of SAS [38].

2.5. Model Comparisons
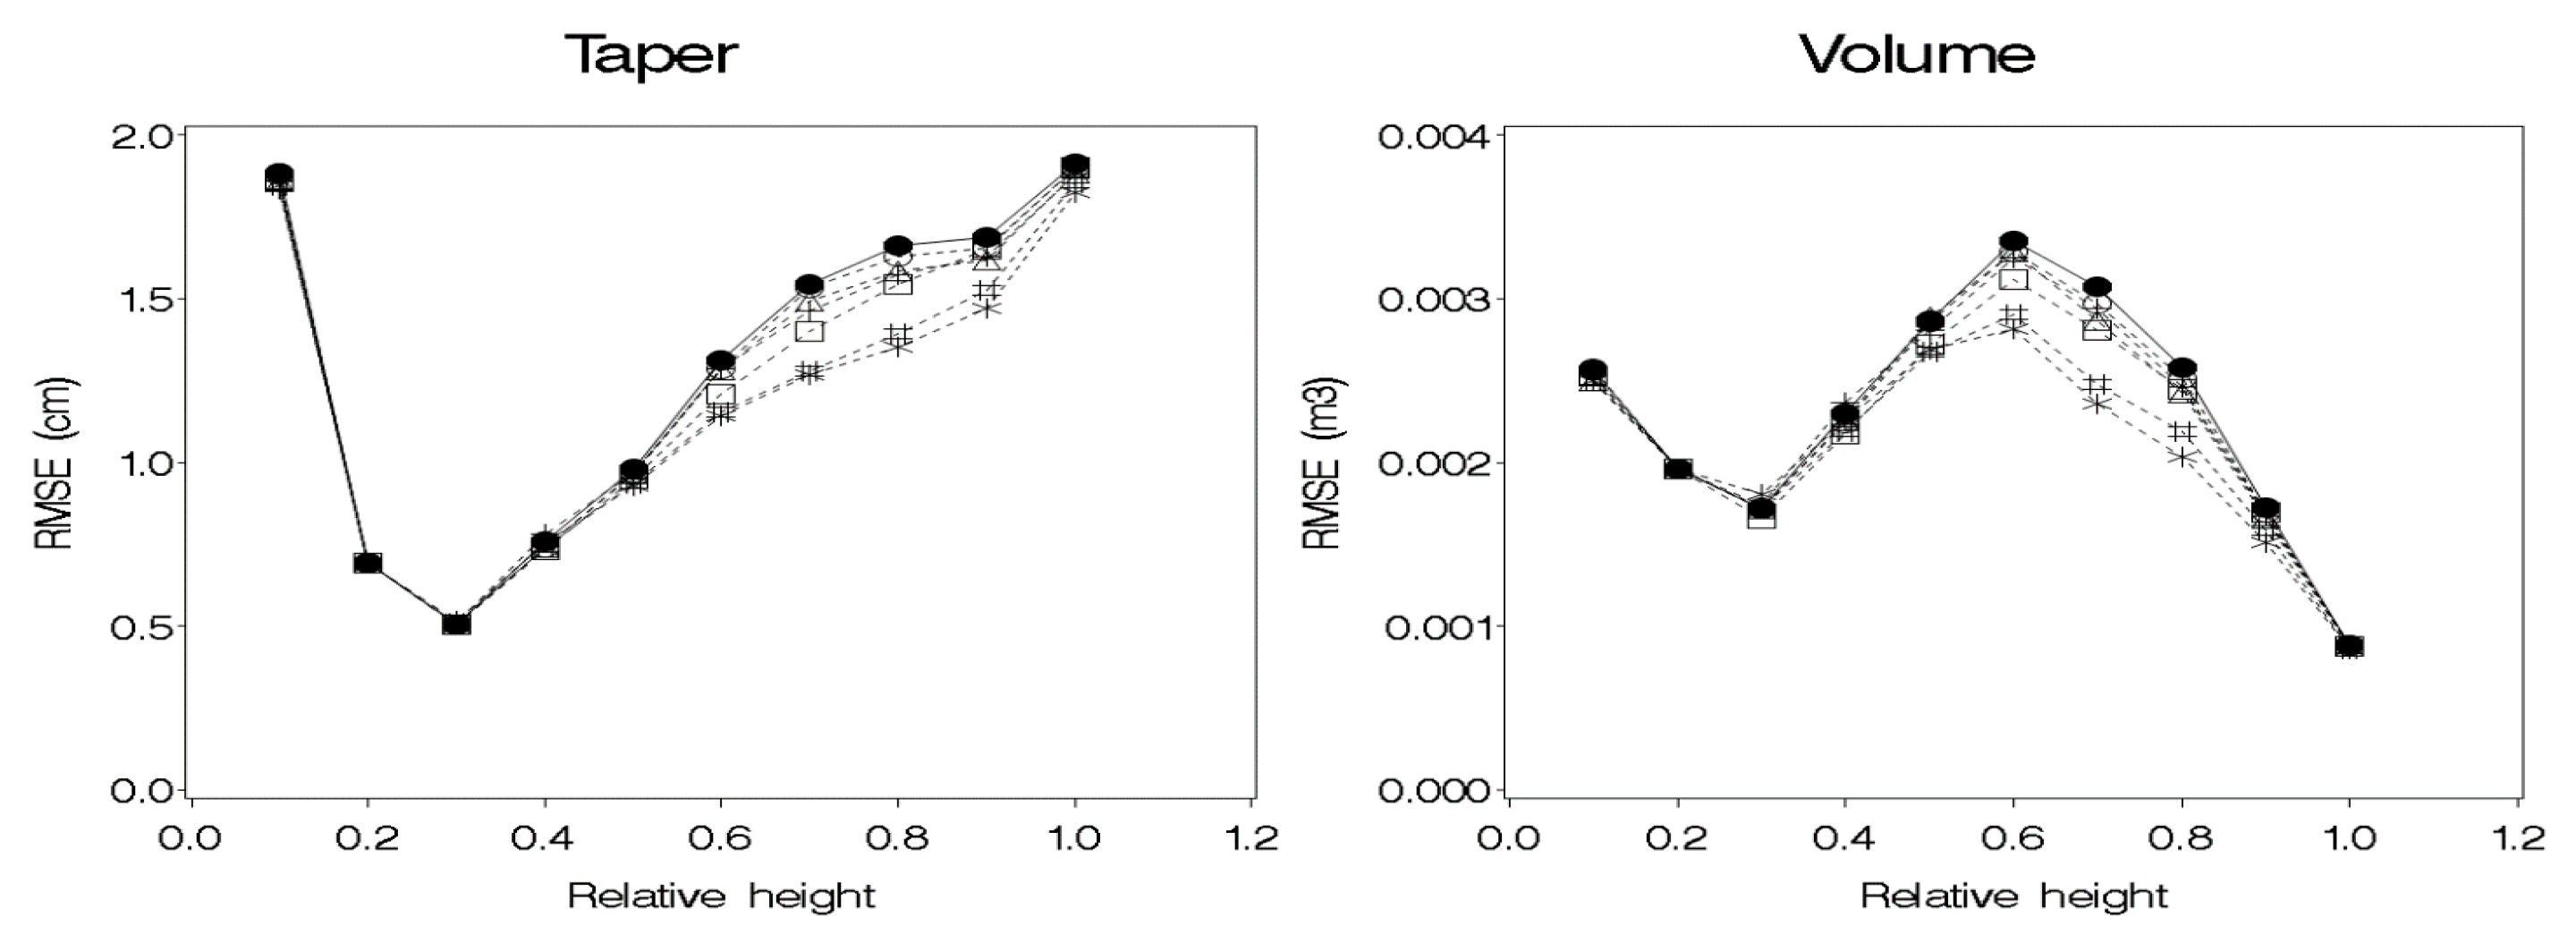
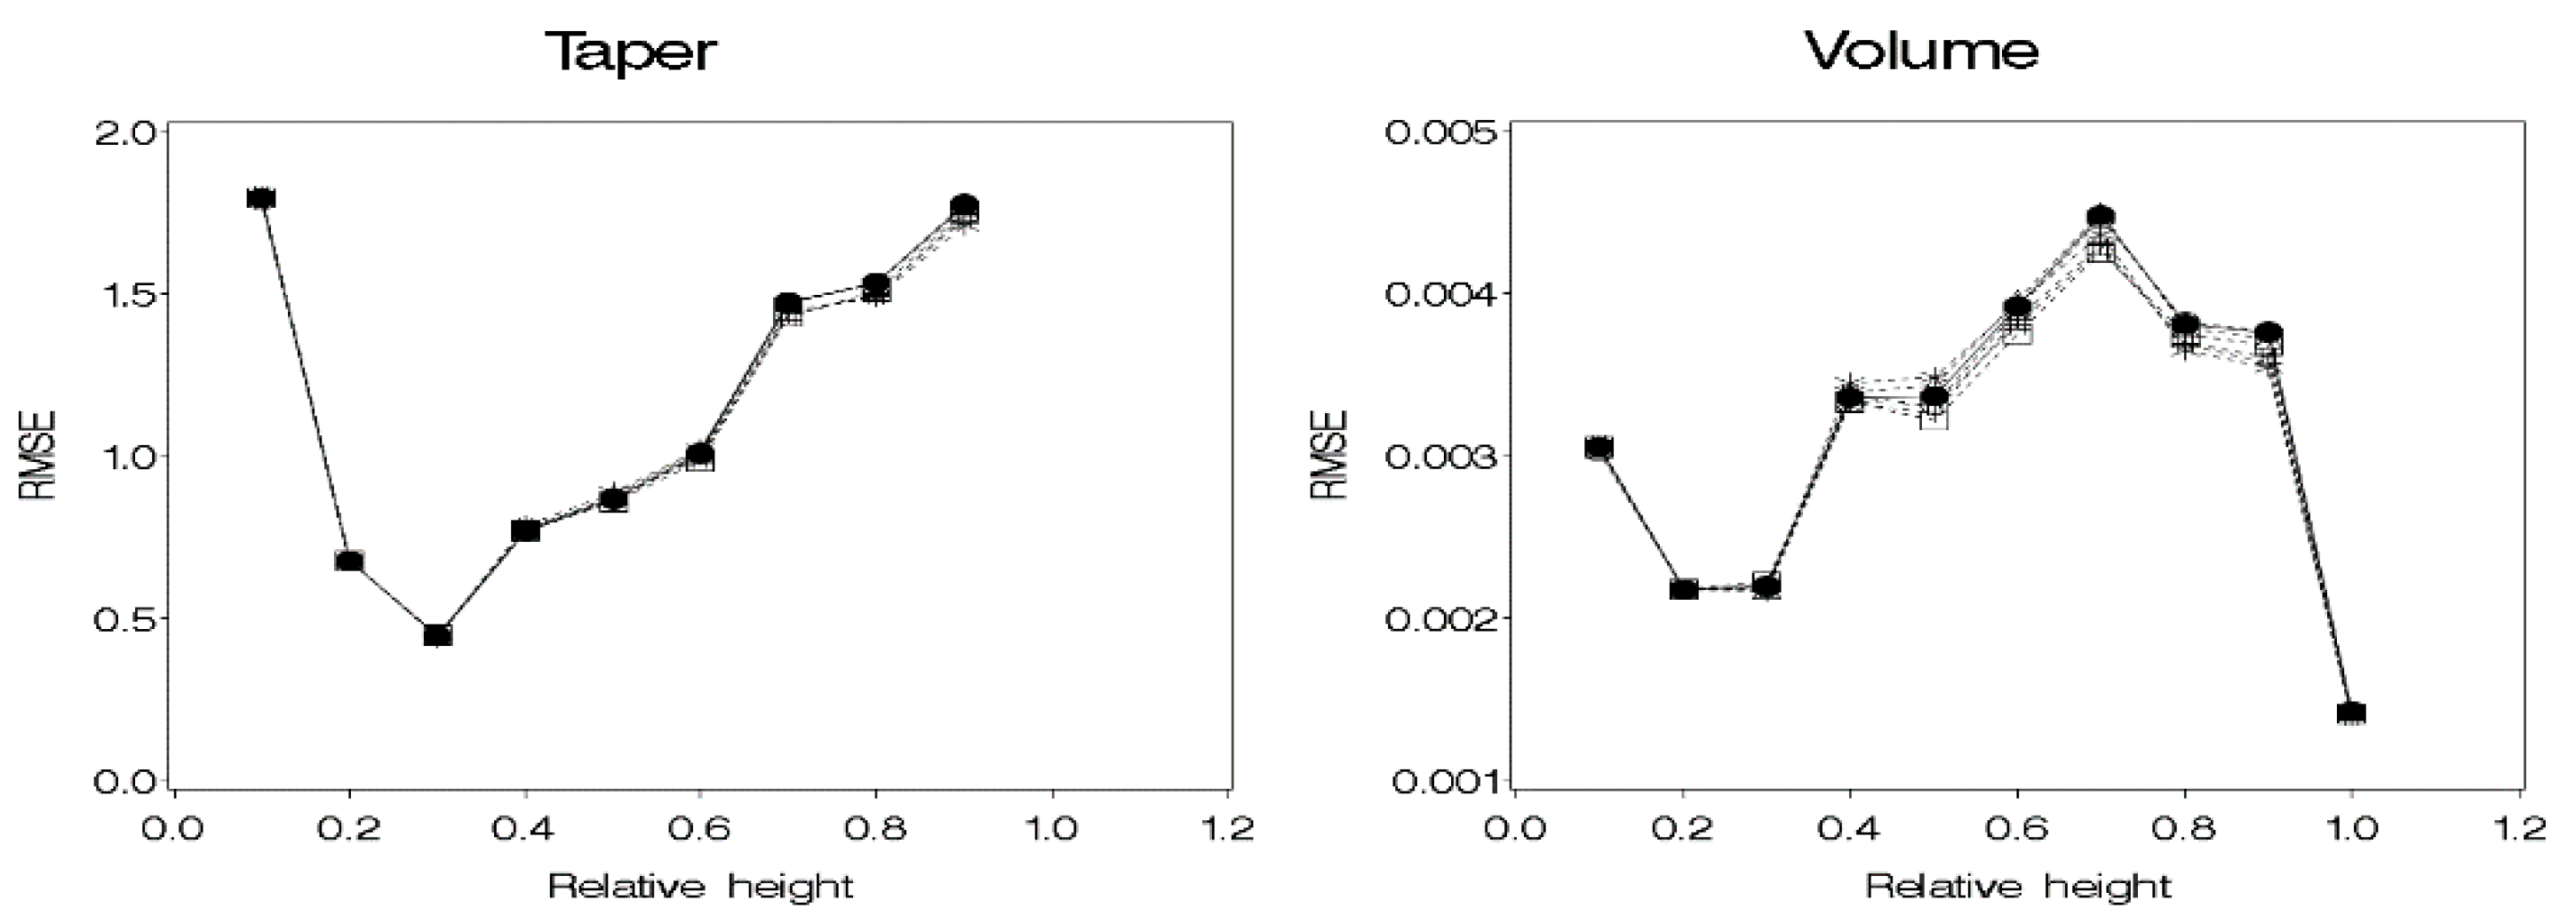
The accuracy of the models was evaluated by numerical and graphical assessments of diameter and volume predictions. The measured diameters were used to calculate sectional volumes, which were added to obtain the observed total volume. Similarly, the predicted diameters were utilized to calculate the predicted total volume. Stump height was 0.3 m and the length of sections varied from 0.3 to 1 m along the stem in this analysis. The observed volume of each section was calculated by Smalian’s formula, while the predicted volume was calculated using the volume equation of Clark et al. (1991). Two standard goodness-of-fit statistics were tested: root mean square error (RMSE) and fit index (FI). The notations for these statistics are as under;
R M S E = i = 1 n ( y i y ^ i ) 2 n p
F I = 1 i = 1 n ( y i y ^ i ) 2 i = 1 n ( y i y ¯ i ) 2
where y i , y ^ i , and y ¯ stand for measured, predicted, and average values of the response variable; n symbolizes the total number of observations, and p is the number of parameters, respectively.
The accuracy of the models was also assessed for different stem sections. The stem was divided into ten sections (relative heights), and RMSE was calculated for diameter and volume in each section. The RMSEs were plotted against relative heights to compare the models’ performance in predicting diameter and volume. Taper simulations were generated to analyze the influence of different crown variables on taper formation of Dahurian larch, Korean spruce, and Manchurian fir.

3. Results

We fitted Model 2 of Clark with possible combinations of fixed- and random-effects parameters. The fitting of the model with more than two random-effects parameters failed to achieve convergence. Therefore, we tested this model with random-effects added to one or two fixed-effects parameters only. Table 2 shows the evaluation statistics for the model with the best one and two random-effects parameters, as well as fixed-effects models. The mixed models with two random parameters, u2 and u6, showed the lowest values of AIC, BIC, and −2Ln (L).
The Clark model with the random parameters, u2 and u6, substituted by crown variables, resulted in the following model 6.
d = { I S [ D 2 ( 1 + ( b 2 + λ 2 c r w n ) + ( b 3 / D 3 ) ( ( 1 h / H ) b 1 ( 1 1.3 / H ) b 1 ) 1 ( 1 1.3 / H ) b 1 ) ] + I B [ D 2 ( D 2 F 2 ) ( ( 1 1.3 / H ) b 4 ( 1 h / H ) b 4 ) ( 1 1.3 / H ) b 4 ( 1 5.3 / H ) b 4 ] + I T [ F 2 ( ( b 6 + λ 6 c r w n ) ( h 5.3 H 5.3 1 ) 2 + I M ( 1 ( b 6 + λ 6 c r w n ) b 5 2 ) ( b 5 h 5.3 H 5.3 ) 2 ) ] } 0.5
where λi are the parameters and crwn represents the crown variables, which denoted either CL, CR, CW, HCB, CD, or CS. All other variables are the same as described earlier.
Model 1 and model 5 with different crown variables were fitted using the generalized nonlinear least-squares method. The initial fitting of the models without the error structure resulted in strong autocorrelation. As an example, the autocorrelation observed in the d predictions with the Clark model is shown in Figure 1. This correlation trend disappeared when a third-order continuous autoregressive error structure CAR (3) was added in the model fit.
Table 3 shows the parameter estimates, and Table 4 highlights the fit-statistics of the models with and without crown variables for the species. Above 98% of the total variance of d was explained by the models for all species. The addition of crown variables showed slight improvements for FI values in the analyzed species. Inclusion of crown variables reduced the RMSE from 0.004 cm to 0.031 cm for Dahurian larch, −0.0001 cm to 0.001 cm for Korean spruce, and 0.0 cm to 0.006 cm for Manchurian fir, respectively. This reduction was more evident in the models with CL (2.63% and 0.39%) for Dahurian Larch and Korean spruce and CR (2.29%, 0.39%, and 1.13%) for Dahurian larch, Korean spruce, and Manchurian fir, respectively. The improvement in RMSE was marginal (0.40–1.13%) for Korean spruce and Manchurian fir.
The plots of RMSE against relative heights providing the diameter and volume predictions of the models are displayed in Figure 2, Figure 3 and Figure 4. All models indicated similar diameter predictions along the entire stem for Korean spruce and Manchurian fir. However, for volume predictions, the models with HCB and CR showed slightly better results for 50–90% relative heights of Korean spruce. The models with HCB and CR accompanied by the model with CL marginally improved the predictions for 40%–60% relative heights of Manchurian fir. The models with CL and CD behaved inconsistently for middle and upper stem sections of Korean spruce and Manchurian fir, respectively. For Dahurian larch, although the models showed similar performance for the basal log and middle stem (relative heights, 0%–50%), they behaved differently for upper stem sections. In general, the models with crown variables performed better than the original model for the relative heights of >50%–90%. The model with CL showed the best results, which was followed by the model with CR for Dahurian larch.
Taper simulations were also generated for the trees of the same size with different values of crown variables (Figure 5, Figure 6 and Figure 7). Crown variables, irrespective of lower or higher values, did not affect the taper of Korean spruce, whereas the higher values of CD and CS slightly reduced the taper of Manchurian fir. Dahurian larch was more sensitive to crown variables, which influenced the taper differently. Higher values of CL, CR, CD, and CW produced greater taper, although the latter variable showed a modest influence. Inversely, higher HCB and CS showed less taper.

4. Discussion

Most of the past taper analyses accounted for a limited number of crown dimensions for different species in the world. The commonly used crown variables are CL and CR [18,22,26,27]. Reference [8] incorporated HCB along with CR and CL in their study. This analysis evaluated the role of CL, CR, CW, HCB, CD, and CS in improving the taper models for Dahurian larch, Korean spruce, and Manchurian fir in NE China.
The initial fitting of the Clark model was carried out as a tree-specific mixed model with possible combinations of fixed- and random-effects parameters. The fitting of the model with more than two random-effects parameters failed to achieve convergence. Therefore, we tested this model with random-effects added to one or two fixed-effects parameters only. The mixed models with two random parameters, μ 2 and μ 6 showed the lowest values of AIC, BIC, and −2Ln (L).
Although the addition of random parameters μ 2 and μ 6 improved the fitting, the models expanded with both μ 2 and μ 6 provided the best statistics. The addition of random parameters μ 2 and μ 6 affects the lower section and middle/upper section, respectively. The original equation is quadratic for the lower portion and linear for the upper portion [34]. The adapted model with two random parameters allows for the variation in both segments between trees. The expansion of the models with random effects μ 2 and μ 6 is tenable, considering the effects of parameters on different stem sections. The parameters b1b3 correspond to the basal log (<1.3 m), b4 to the lower stem (1.3–5.3 m), and b5b6 to the middle and upper stem (>5.3 m). The random-effects affected all parameters b1b4, but the parameter b2 showed the best statistics among different combinations. The variation was usually minimum in the lower stem (see, for example, [34], Figure 3, Table 4). The parameter b2 explained the basal log and compensated for the slightly tapered lower stem. The parameter b6 captured the variation in the middle stem and joined b5 to control the upper stem. With a higher value, parameter b6 had a major impact on the model, and parameter b5 contributed a little, indicating that parameter b6 explained the tree-level variation in both sections.
According to the past literature, the potential of crown variables in improving the predictions of a taper model depends on the specific species, and it might be study-specific. The magnitude of improvement depends on natural changes in crown architecture, variations in crown sizes in available data, and the response of a particular taper model to crown variables [8].
Reference [18] found that the addition of CL and CR in the Max and Burkhart (1976) model improved diameter predictions for the middle stem (30%–70%) of loblolly pine. Reference [26] added CR in the model of Clark et al. (1991) for estimating the diameter and volume of yellow poplar. The modified model was slightly less accurate for the relative heights of 30%–50%, while it was marginally better for upper sections (>50%–60%). Both models, modified and original, showed accurate predictions for the lower stem (<30%). Reference [27] obtained a similar performance from the model of Clark with CR and CL for black pine. Reference [28] observed that the Max and Burkhart (1976) model with CR decreased the RMSE by 10% for diameter estimates of Dahurian larch. However, improvement in the values of FI was nominal. Reference [8] added CL, CR, and HCB to the model of Clark and received a mixed response for balsam fir, red spruce, and white pine. The variables of CL and CR improved the diameter predictions of red spruce and balsam fir, while HCB showed a positive impact only for balsam fir. However, the improvements were modest since the largest reduction in RMSE was 0.03 cm for balsam fir. The Clark model with CR and CL slightly better predicted the volume of all species, but the addition of HCB negatively affected the predictions for red spruce and white pine.
In agreement with previous studies, the addition of crown variables improved the prediction accuracy for the species analyzed, although noticeable improvements were only observed for Dahurian larch. Slightly different from [26,27], the models with or without crown variables were equally suitable for the lower stem (<50%) of Dahurian larch, while they showed similar performance for all stem sections of Manchurian fir and Korean spruce. Similar to [8], the models with CR and CL performed better than the models with HCB in this analysis. However, we did not find a negative effect of HCB or other crown variables across the species except a minor distortion in CL and CD for Korean spruce and Manchurian fir, respectively. Reference [8] suggested that shade tolerance could be an important factor in taper modeling with crown variables. Their suggestion might transfer to this analysis, given that the analyzed species have different levels of shade tolerance. The crown morphology of shade-intolerant species is different from the species that are tolerant of shade. The former produces a lower stem taper and live crown ratio [43]. Taper simulations in this study also reflected variation in stem taper among the species.
Although the effect of crown architecture on stem form has long been documented [16,44], its inclusion in taper modeling has varied. Some researchers found that the crown variables were either nonsignificant or marginally improved model fits [8,20,22]. In contrast, some studies have observed otherwise, suggesting that it might be influenced by the available dataset, species, and model form [18,45,46]. However, [31] noted that the addition of crown variables should not only be to improve model predictions but also to ensure the logical biological behavior of the model. Therefore, a taper equation should predict trees of smaller crowns compared with the trees of similar size having bigger crowns to allow for wider diameters above diameter at breast height (DBH), thinner diameters below DBH, and a similar DBH. So, the persistent analyses of incorporating crown variables are still essential and encouraged [47]. It might include further analysis of crown variables for a wide range of species and stand conditions, besides the influence of various measures of the crown. For example, the commonly used variable is the crown ratio, whereas height to crown midpoint [48], crown length [27], or a combination of crown variables could also be effectual [18].

5. Conclusions

This study used several crown variables in an initial attempt to improve the model of Clark et al. (1991) for Dahurian larch, Korean spruce, and Manchurian fir in Northeast China. The addition of crown variables modestly improved the predictions for Dahurian larch and showed a minimal improvement for Manchurian fir and Korean spruce. The model of Clark et al. (1991) without crown variables demonstrated quite reasonable predictions for diameter and volume in terms of fit-statistics and graphical analysis for different stem sections. Different crown variables influenced the taper of Manchurian fir and Korean spruce least. However, for Dahurian larch, larger CL and CR showed more taper for the upper stem and near the ground, while HCB and CS indicated inverse relations for these sections. Although incorporating crown variables improved the model performance, the gain was too little to justify the additional measurements.
It is worth noting that the analyzed species are widely distributed in Northeast China. This region has significant variations in terms of geo-climatic factors, which are reflected in crown morphology. Future analysis of a sample with a larger representation could extend the scope and generalize the results of this study.

Author Contributions

A.H., investigation, software, formal analysis, writing—original draft preparation, visualization; M.K.S., methodology, investigation, writing—review and editing; L.J., Conceptualization, software, validation, resources, data curation, supervision, project administration, funding acquisition. All authors have read and agreed to the published version of the manuscript.

Funding

This research was financially supported by the National Natural Science Foundation of China (31570624) and the Heilongjiang Touyan Innovation Team Program.

Institutional Review Board Statement

Not applicable.

Informed Consent Statement

Not applicable.

Data Availability Statement

The data presented in this study are available on request from the corresponding author.

Acknowledgments

The authors would like to thank all members of the Department of Forest Management, Northeast Forestry University, China, who collected and provided the data for this study.

Conflicts of Interest

The authors declare no conflict of interest.

References

  1. Zhang, Y.; Liang, S. Changes in forest biomass and linkage to climate and forest disturbances over Northeastern China. Glob. Chang. Biol. 2014, 20, 2596–2606. [Google Scholar] [CrossRef]
  2. Shi, F.; Li, J.; Koike, T.; Nie, S. Resources of the white birch (Betula platyphylla) for sap production and its ecological charac-teristics in northeast China. Eurasian J. For. Res. 2001, 2, 31–38. [Google Scholar]
  3. Cai, H.; Zhang, S.; Yang, X. Forest Dynamics and Their Phenological Response to Climate Warming in the Khingan Mountains, Northeastern China. Int. J. Environ. Res. Public Health 2012, 9, 3943–3953. [Google Scholar] [CrossRef]
  4. Xu, J.; Xie, S.; Han, A.; Rao, R.; Huang, G.; Chen, X.; Hu, J.; Liu, Q.; Yang, X.; Zhang, L. Forest Resources in China—The 9th National Forest Inventory; National Forestry and Grassland Administration: Beijing, China, 2019; p. 29.
  5. Dong, L.; Jin, X.; Pukkala, T.; Li, F.; Liu, Z. How to manage mixed secondary forest in a sustainable way? Eur. J. For. Res. 2019, 138, 789–801. [Google Scholar] [CrossRef] [Green Version]
  6. Macfarlane, D.W.; Weiskittel, A.R. A new method for capturing stem taper variation for trees of diverse morphological types. Can. J. For. Res. 2016, 46, 804–815. [Google Scholar] [CrossRef] [Green Version]
  7. Hou, J.; Yin, R.; Wu, W. Intensifying Forest Management in China: What does it mean, why, and how? For. Policy Econ. 2019, 98, 82–89. [Google Scholar] [CrossRef]
  8. Li, R.; Weiskittel, A.R. Comparison of model forms for estimating stem taper and volume in the primary conifer species of the North American Acadian Region. Ann. For. Sci. 2010, 67, 302. [Google Scholar] [CrossRef] [Green Version]
  9. Liu, Y.; Yue, C.; Wei, X.; Blanco, J.A.; Trancoso, R. Tree profile equations are significantly improved when adding tree age and stocking degree: An example for Larix gmelinii in the Greater Khingan Mountains of Inner Mongolia, northeast China. Eur. J. For. Res. 2020, 139, 443–458. [Google Scholar] [CrossRef]
  10. Gomat, H.Y.; Deleporte, P.; Moukini, R.; Mialounguila, G.; Ognouabi, N.; Saya, A.R.; Vigneron, P.; Saint-Andre, L. What factors influence the stem taper of Eucalyptus: Growth, environmental conditions, or genetics? Ann. For. Sci. 2011, 68, 109–120. [Google Scholar] [CrossRef] [Green Version]
  11. Sharma, M.; Zhang, S. Variable-exponent taper equations for jack pine, black spruce, and balsam fir in eastern Canada. For. Ecol. Manag. 2004, 198, 39–53. [Google Scholar] [CrossRef]
  12. Calama, R.; Montero, G. Stand and tree-level variability on stem form and tree volume in Pinus pinea L.: A multilevel random components approach. Investig. Agrar. Sist. Y Recur. For. 2006, 15, 24–41. [Google Scholar] [CrossRef] [Green Version]
  13. Schneider, R.; Franceschini, T.; Fortin, M.; Saucier, J.-P. Climate-induced changes in the stem form of 5 North American tree species. For. Ecol. Manag. 2018, 427, 446–455. [Google Scholar] [CrossRef]
  14. Tasissa, G.; Burkhart, H.E. An application of mixed effects analysis to modeling thinning effects on stem profile of loblolly pine. For. Ecol. Manag. 1998, 103, 87–101. [Google Scholar] [CrossRef]
  15. Brooks, J.R.; Jiang, L.; Özçelik, R. Compatible stem volume and taper equations for Brutian pine, Cedar of Lebanon, and Cilicica fir in Turkey. For. Ecol. Manag. 2008, 256, 147–151. [Google Scholar] [CrossRef]
  16. Larson, P.R. Stem Form Development of Forest Trees. For. Sci. 1963, 9, a0001-42. [Google Scholar] [CrossRef]
  17. Panzou, G.J.L.; Feldpausch, T.R. Measuring Crown Dimensions for Tropical Forest Trees a Field Manual; NERC: Exeter, UK, 2020. [Google Scholar]
  18. Leites, L.P.; Robinson, A.P. Improving taper equations of loblolly pine with crown dimensions in a mixed-effects modeling framework. For. Sci. 2004, 50, 204–212. [Google Scholar]
  19. Bronisz, K.; Zasada, M. Comparison of Fixed—and Mixed-effects Approaches to Taper Modeling for Scots Pine in West Poland. Forests 2019, 10, 975. [Google Scholar] [CrossRef] [Green Version]
  20. Burkhart, H.E.; Walton, S.B. Incorporating crown ratio into taper equations for loblolly pine trees. For. Sci. 1985, 31, 478–484. [Google Scholar]
  21. Valenti, M.A.; Cao, Q.V. Use of crown ratio to improve loblolly pine taper equations. Can. J. For. Res. 1986, 16, 1141–1145. [Google Scholar] [CrossRef]
  22. Muhairwe, C.K.; Lemay, V.M.; Kozak, A. Effects of adding tree, stand, and site variables to Kozak’s variable-exponent taper equation. Can. J. For. Res. 1994, 24, 252–259. [Google Scholar] [CrossRef]
  23. Larocque, G.R.; Marshall, P.L. Crown development in red pine stands. I. Absolute and relative growth measures. Can. J. For. Res. 1994, 24, 762–774. [Google Scholar] [CrossRef]
  24. Kozak, A. A variable-exponent taper equation. Can. J. For. Res. 1988, 18, 1363–1368. [Google Scholar] [CrossRef]
  25. Max, T.A.; Burkhart, H.E. Segmented Polynomial Regression Applied to Taper Equations. For. Sci. 1976, 22, 283–289. [Google Scholar]
  26. Jiang, L.; Brooks, J.R.; Hobbs, G.R. Using crown ratio in yellow-poplar compatible taper and volume equations North. J. Appl. For. 2007, 24, 271–275. [Google Scholar]
  27. Özcelik, R.; Bal, C. Effects of adding crown variables in stem taper and volume predictions for black pine. Turk. J. Agric. For. 2013, 37, 231–242. [Google Scholar] [CrossRef]
  28. Jiang, L.-C.; Liu, R.-L. Segmented taper equations with crown ratio and stand density for Dahurian Larch (Larix gmelinii) in Northeastern China. J. For. Res. 2011, 22, 347–352. [Google Scholar] [CrossRef]
  29. Burkhart, H.E.; Tomé, M. Modeling Forest Trees and Stands; Springer Science & Business Media: Berlin/Heidelberg, Germany, 2012. [Google Scholar]
  30. Sharma, M. Incorporating stand density effects in modeling the taper of red pine plantations. Can. J. For. Res. 2020, 50, 751–759. [Google Scholar] [CrossRef]
  31. Weiskittel, A.R.; Hann, D.W.; Kershaw, J.A.; Vanclay, J.K. Forest Growth and Yield Modeling; Wiley: Hoboken, NJ, USA, 2011. [Google Scholar]
  32. Trincado, G.; Burkhart, H.E. A generalized approach for modeling and localizing stem profile curves. For. Sci. 2006, 52, 670–682. [Google Scholar] [CrossRef]
  33. Cao, Q.V.; Wang, J. Evaluation of Methods for Calibrating a Tree Taper Equation. For. Sci. 2015, 61, 213–219. [Google Scholar] [CrossRef] [Green Version]
  34. Clark, A. Stem Profile Equations for Southern Tree Species; Southeastern Forest Experiment Station: Asheville, NC, USA, 1991; Volume 282. [Google Scholar]
  35. Tan, K.; Piao, S.; Peng, C.; Fang, J. Satellite-based estimation of biomass carbon stocks for northeast China’s forests between 1982 and 1999. For. Ecol. Manag. 2007, 240, 114–121. [Google Scholar] [CrossRef]
  36. Burger, D.; Shidong, Z. An Introductory Comparison of Forest Ecological Conditions in Northeast China and Ontario, Canada. For. Chron. 1988, 64, 105–115. [Google Scholar] [CrossRef] [Green Version]
  37. Burkhart, H.E.; Avery, T.E.; Bullock, B.P. Forest Measurements, 6th ed.; Waveland Press: Long Grove, IL, USA, 2019; p. 434. [Google Scholar]
  38. SAS Institute Inc. SAS/STAT® 9.2 User’s Guide; SAS Institute Inc.: Cary, NC, USA, 2008; p. 2876. [Google Scholar]
  39. Hussain, A.; Shahzad, M.K.; He, P.; Jiang, L. Stem taper equations for three major conifer species of Northeast China. Scand. J. For. Res. 2020, 35, 562–576. [Google Scholar] [CrossRef]
  40. Figueiredo-Filho, A.; Borders, B.E.; Hitch, K.L. Taper equations for Pinus taeda plantations in Southern Brazil. For. Ecol. Manag. 1996, 83, 39–46. [Google Scholar] [CrossRef]
  41. Özçelik, R.; Brooks, J.R. Compatible volume and taper models for economically important tree species of Turkey. Ann. For. Sci. 2012, 69, 105–118. [Google Scholar] [CrossRef] [Green Version]
  42. Grégoire, T.G.; Schabenberger, O.; Barrett, J.P. Linear modelling of irregularly spaced, unbalanced, longitudinal data from permanent-plot measurements. Can. J. For. Res. 1995, 25, 137–156. [Google Scholar] [CrossRef]
  43. Smith, D.M.; Larson, B.C.; Kelty, M.J.; Ashton, P.M.S. The Practice of Silviculture: Applied Forest Ecology, 9th ed; John Wiley and Sons Inc.: New York, NY, USA, 1997. [Google Scholar]
  44. Pressler, M.R. Das Gesetz der Stammbildung; Arnoldische Buchhandlung: Leipzig, Germany, 1864. [Google Scholar]
  45. Hann, D.W.; Walters, D.K.; Scrivani, J.A. Incorporating crown ratio into prediction equations for Douglas-fir stem volume. Can. J. For. Res. 1987, 17, 17–22. [Google Scholar] [CrossRef]
  46. Yang, Y.; Huang, S.; Trincado, G.; Meng, S.X. Nonlinear mixed-effects modeling of variable-exponent taper equations for lodgepole pine in Alberta, Canada. Eur. J. For. Res. 2009, 128, 415–429. [Google Scholar] [CrossRef]
  47. McTague, J.P.; Weiskittel, A.R. Evolution, history, and use of stem taper equations: A review of their development, application, and implementation. Can. J. For. Res. 2021, 51, 210–235. [Google Scholar] [CrossRef]
  48. Dean, T.J.; Roberts, S.D.; Gilmore, D.W.; Maguire, D.A.; Long, J.N.; O’Hara, K.L.; Seymour, R.S. An evaluation of the uniform stress hypothesis based on stem geometry in selected North American conifers. Trees 2002, 16, 559–568. [Google Scholar] [CrossRef]
Figure 1. An example of d residuals plotted against Lag1 and Lag2 residuals for Clark model fitted without considering the autocorrelation parameters (a) and using first (b) second (c,d) and third (e,f) order continuous autoregressive error structures.
Forests 12 00398 g001
Figure 2. Root mean square error (RMSE) by relative height classes for diameter and volume predictions using Clark model with and without crown variables for Dahurian larch.
Forests 12 00398 g002
Figure 3. Root mean square error (RMSE) by relative height classes for diameter and volume predictions using Clark model with and without crown variables for Korean spruce.
Forests 12 00398 g003
Figure 4. Root mean square error (RMSE) by relative height classes for diameter and volume predictions using Clark model with and without crown variables for Manchurian fir. (For Figure 2, Figure 3 and Figure 4: Symbols for Clark model with and without variables; Clark (dot), crown length (CL) (star), crown ratio (CR) (hash), crown width (CW) (circle), diameter at crown base (CD) (triangle), height to live crown base (HCB) (square) and crown shape (CS) (plus).
Forests 12 00398 g004
Figure 5. Tree profiles generated from the Clark model with crown variables with the same values of diameter at breast height (DBH) (24.0 cm) and total height (18.0 m) by the different values of crown leangth (CL) (4 and 14 m), crown ratio (CR), (0.2 and 0.7), crown width (CW), (2 and 10 m), Height to live crown base (HCB), (5 and 15 m), crown base diameter (CD), (5 and 28 cm), crown shape (CS), (0.3 and 1.4) for Dahurian larch.
Forests 12 00398 g005
Figure 6. Tree profiles generated from the Clark model with crown variables with the same values of DBH (28.0 cm) and total height (22.0 m) by the different values of CL (4 and 18 m), CR (0.2 and 0.7), CW (2 and 12 m), HCB (6 and 18 m), CD (5 and 22 cm), CS (0.6 and 1.6) for Korean spruce.
Forests 12 00398 g006
Figure 7. Tree profiles generated from the Clark model with crown variables with the same values of DBH (24.0 cm) and total height (18.0 m) by the different values of CL (4 and 14 m), CR (0.2 and 0.7), and HCB (5 and 15 m) for Manchurian fir. (For Figure 5, Figure 6 and Figure 7: Solid lines represent lower values and dotted lines represent higher values.)
Forests 12 00398 g007
Table 1. Summary statistics for the tree species analyzed.
SpeciesVariablesMeanSDMinimumMaximum
Dahurian larch
No. trees 110
D (cm)24.375.648.640.2
H (m)18.682.578.924.6
d (cm)17.618.891.054.4
h (m)7.906.030.324.0
Korean spruce
No. trees 103
D (cm)29.217.3610.849.5
H (m)22.003.6110.030.7
d (cm)22.0110.081.075.3
h (m)10.377.300.31.3
Manchurian fir
No. trees 64
D (cm)26.106.015.540.2
H (m)19.992.987.325.9
d (cm)19.139.251.147.4
h (m)9.526.660.325.9
D, diameter at breast height over bark; H, total tree height; d, diameter over bark at height; h; height at any point; SD, Standard deviation.
Table 2. Fit statistics for Clark (1991) Model 2 with different combinations of random parameters for three tree species.
SpeciesRandom
Parameters
AIC
(Smaller Is Better)
BIC
(Smaller Is Better)
−2Ln(L)
(Smaller Is Better)
Dahurian larchNone *858086208566
μ 2 801480367998
μ 2 , μ 6 719472217174
Korean spruceNone *902890699014
μ 2 849785188481
μ 2 , μ 6 766676937647
Manchurian firNone *546955065455
μ 6 483248504816
μ 2 , μ 6 459546164575
* Clark (1991) Model 1 fitted by ordinary least square. Abbreviations: AIC, Akaike’s Information Criterion; BIC, Schwarz’s Bayesian Information Criterion; and −2Ln (L), twice the negative log-likelihood.
Table 3. Parameter estimates (standard errors in parentheses) of the Clark model with and without crown variables.
b1b2b3b4b5b6λ2λ6
Dahurian Larch
Clark model without crown25.488 (1.736)0.768 (0.015)509.46 (130.8)6.483 (0.935)0.764 (0.015)2.490 (0.094)
Clark model with CL25.127 (1.682)0.920 (0.059)357.755 (141.4)6.495 (0.866)0.782 (0.013)4.626 (0.266)−0.014 (0.005)−0.195 (0.019)
Clark model with CR25.238 (1.692)0.943 (0.063)416.651 (133.3)6.495 (0.877)0.776 (0.013)4.689 (0.286)−0.321 (0.112)−4.040 (0.433)
Clark model with CW25.533 (1.732)0.692 (0.051)597.44 (144.2)6.484 (0.926)0.768 (0.014)3.114 (0.191)0.011 * (0.007)−0.095 (0.023)
Clark model with HCB25.4212 (1.716)0.632 (0.052)545.94 (130.8)6.491 (0.905)0.766 (0.014)1.221 (0.170)0.014 (0.005)0.138 (0.019)
Clark model with CD25.257 (1.708)0.9939 (0.068)234.08* (150.5)6.496 (0.908)0.772 (0.014)3.806 (0.243)−0.011 (0.003)−0.067 (0.010)
Clark model with CS25.404 (1.718)0.626 (0.040)459.27 (131.6)6.487 (0.920)0.769 (0.015)1.872 (0.144)0.231 (0.059)1.019 (0.218)
Korean Spruce
Clark model without crown43.445 (2.014)0.721 (0.015)1509.32 (262.1)6.737 (1.275)0.926 (0.005)8.612 (0.506)
Clark model with CL43.464 (2.008)0.681 (0.040)1573.14 (269.0)6.771 (1.261)0.929 (0.005)10.466 (0.724)0.003 * (0.002)−0.112 (0.025)
Clark model with CR43.437 (2.006)0.679 (0.039)1464.28 (263.9)6.765 (1.261)0.928 (0.005)10.509 (0.737)0.073 * (0.065)−2.946 (0.664)
Clark model with CW43.436 (2.012)0.551 (0.061)2009.01 (318.9)6.737 (1.274)0.926 (0.005)8.278 (0.645)0.021 (0.007)0.045 * (0.061)
Clark model with HCB43.405 (2.007)0.732 (0.035)1470.63 (281.9)6.757 (1.265)0.927 (0.005)7.665 (0.503)−0.001 * (0.002)0.103 (0.025)
Clark model with CD43.442 (2.015)0.685 (0.061)1632.88 (332.1)6.745 (1.275)0.927 (0.005)9.078 (0.666)0.001 * (0.002)−0.016 * (0.015)
Clark model with CS43.416 (2.007)0.733 (0.029)1498.20 (262.8)6.765 (1.262)0.928 (0.005)7.695 (0.516)−0.021 * (0.042)2.063 (0.486)
Manchurian Fir
Clark model without crown49.283 (3.048)0.648 (0.014)272.64 (81.87)4.011 (1.595)0.858 (0.012)4.057 (0.254)
Clark model with CL49.980 (3.063)0.446 (0.056)344.53 (86.00)4.005 (1.584)0.865 (0.012)5.217 (0.531)0.013 (0.003)−0.065 (0.026)
Clark model with CR50.064 (3.035)0.319 (0.065)315.37 (81.71)3.943 (1.573)0.866 (0.011)5.697 (0.611)0.439 (0.086)−2.007 (0.654)
Clark model with CW49.365 (3.050)0.571 (0.059)286.65 (82.98)4.015 (1.596)0.859 (0.012)4.259 (0.521)0.013 * (0.009)−0.029 * (0.073)
Clark model with HCB49.868 (3.029)0.754 (0.027)257.67 (80.21)3.913 (1.576)0.863 (0.011)3.690 (0.278)−0.019 (0.004)0.084 (0.030)
Clark model with CD49.109 (3.031)0.689 (0.063)254.32 (86.66)3.998 (1.575)0.864 (0.012)2.333 (0.417)−0.002 * (0.002)0.073 (0.017)
Clark model with CS49.807 (3.060)0.757 (0.041)325.83 (84.68)4.006 (1.587)0.861 (0.012)3.353 (0.389)−0.278 (0.098)1.885 (0.838)
(*) indicates non-significant parameters at p < 0.05. Abbreviations: CL, crown length; CR, crown ratio; CW, crown width; HCB, Height to live crown base; CD, crown base diameter; CS, crown shape.
Table 4. Fit statistics for Clark model with and without crown variables by species.
Species and ModelsRMSEFI
Dahurian Larch
Clark model without crown1.18860.9822
Clark model with CL1.15730.9831
Clark model with CR1.16140.9830
Clark model with CW1.18410.9823
Clark model with HCB1.17390.9826
Clark model with CD1.17460.9826
Clark model with CS1.17940.9825
Korean Spruce
Clark Model without crown1.20480.9857
Clark Model with CL1.20010.9859
Clark Model with CR1.20000.9859
Clark Model with CW1.20320.9858
Clark Model with HCB1.20110.9858
Clark Model with CD1.20490.9858
Clark Model with CS1.20060.9859
Manchurian Fir
Clark Model without crown1.13600.9850
Clark Model with CL1.12920.9852
Clark Model with CR1.12320.9854
Clark Model with CW1.13600.9850
Clark Model with HCB1.12520.9853
Clark Model with CD1.12920.9852
Clark Model with CS1.13170.9851
Abbreviations: CL, crown length; CR, crown ratio; CW, crown width; HCB, Height to live crown base; CD, crown base diameter; CS, crown shape.
Publisher’s Note: MDPI stays neutral with regard to jurisdictional claims in published maps and institutional affiliations.

