Article

Dynamics of Soil Nutrients, Microbial Community Structure, Enzymatic Activity, and Their Relationships along a Chronosequence of Pinus massoniana Plantations

1
Institute for Forest Resources and Environment of Guizhou, Key Laboratory of Forest Cultivation in Plateau Mountain of Guizhou Province, College of Forestry, Guizhou University, Guiyang 550025, China
2
College of Agriculture, Guizhou University, Guiyang 550025, China
*
Author to whom correspondence should be addressed.
Forests 2021, 12(3), 376; https://doi.org/10.3390/f12030376
Submission received: 3 February 2021 / Revised: 24 February 2021 / Accepted: 18 March 2021 / Published: 21 March 2021
(This article belongs to the Section Forest Ecology and Management)

Abstract

:
Pinus massoniana is the major afforestation and vegetation restoration tree in southern China, and it plays an important role in the sustainable development of plantations. However, long-term single planting of P. massoniana has resulted in the decline of soil quality and forest productivity, and a soil fertility assessment is urgently needed. We selected P. massoniana plantations of four age stages for plot investigation and sampling to determine the soil physicochemical properties, microbial diversity and composition, and enzyme activities at different soil depths. The results showed that soil total phosphorus (TP) and available phosphorus (AP) decreased with the increase of age, especially low C/N ratio and high C/P and N/P ratio in the 30-year and 36-year stands, leading to P limitation. Meanwhile, the bacterial Shannon index also decreased with the increase of age and was positively correlated with AP, NO3-N, and pH. However, the fungal Shannon index decreased first and then increased with the increase of age; soil acid phosphatase (S-ACP) and urease activities showed a similar trend. Correlation analysis demonstrated that the increase of total organic carbon (TOC) and total nitrogen (TN) promoted the increase of fungal Shannon index, which was beneficial to the secretion of more enzymes. We found that soil physicochemical properties, microbial diversity, and enzyme activity decreased simultaneously when soil depths increased. Moreover, Acidobacteria and Basidiomycota were the most abundant bacterial and fungal communities, respectively, followed by Proteobacteria and Actinobacteria for bacteria and Ascomycota for fungi, and these microbial taxa were significantly affected by soil water content (SWC), TOC, AP, and C/P. In conclusion, this work reveals the potential correlation among soil physicochemical properties, microbial diversity and composition, and enzyme activities, and revealed potential correlations among them which will help to improve understanding of soil conditions and provide a reference for rational management of soil resources.

1. Introduction

Pinus massoniana is the main tree species for afforestation and vegetation rehabilitation in Southern China because of its special advantages such as fast growth, high adaptability to drought and barren soils, and its capacity to retain water and nutrients. According to a national survey, the forest area of the dominant species of P. massoniana in China is about 10 million ha, accounting for 6.08% of the total forest area in the country and 20% of the plantation forest areas in Southern China [1,2]. Consequently, P. massoniana occupies an extremely important position in promoting wood production and sustainable development of plantations. However, the long-term monoculture tree plantations leading to significant decline in soil quality and woodland productivity have been often reported by the previous researchers [3,4,5]. For example, the decline of soil quality leads to the loss of topsoil and associated nutrients, which changes the soil microbial community structure and enzymatic activity, even the instability of the forest ecosystem [3,6]. Therefore, it is of great significance to evaluate the soil quality of the plantation for rational management and utilization of soil resources, maintenance of soil fertility, and improvement of plantation productivity.
The growth and development of plants are strongly affected by soil nutrients, especially the lack of nitrogen (N) and phosphorus (P) in soil which may limit the growth of plants because their nutrients mainly come from soil [7]. Previous studies reported that soil carbon (C), N, and P stoichiometry (C/N, C/P, and N/P ratios) have been used as a comprehensive indicator of soil nutrient status and element balance [8,9]. Ren et al. [10] found that the imbalance of soil C, N, and P elements during afforestation led to P limitation. In addition, changes in soil physical properties affect other soil chemical and biological properties [11], e.g., soil water content (SWC) and pH can affect the absorption of other nutrients [12,13]. As such, they are used as indicators to monitor forest soil quantity.
As a crucial component of biodiversity in terrestrial ecosystems, soil microbial communities play an important role in promoting the decomposition of organic matter, nutrient cycling, and energy flow of forest ecosystems [3,14]. Changes in microbial community composition and diversity can reflect soil fertility status and have been used as an important indicator for assessing soil quality and soil disturbance intensity in many ecosystem processes [15,16]. As previously reported, soil microbes can promote nutrient cycling. In turn, soil physicochemical properties drive microbial community structure, thereby altering the availability, accumulation, and mineralization of nutrients [17]. The evidence has indicated that soil microbial community structure was affected by soil organic matter availability, pH, temperature, water content, and C/N ratio [18,19,20]. Meanwhile, the unbalanced soil C: N: P stoichiometry leads to soil N and P limitations, which may affect microbial composition and diversity [10]. Besides, the decomposition of litter and dead root by microbes results in a change in the C: N: P ratio and converges toward soil organic matter and microbial biomass. In turn, the changes in the C: N: P ratio affect the decomposition process and nutrient cycling [14,21]. Soil enzymes play a catalytic role in the material cycle and energy flow of the forest ecosystem, e.g., sucrase catalyzes sucrose hydrolysis to produce monosaccharides and increased soil soluble nutrients; urease is involved in nitrogen cycling and catalytic hydrolysis of urea to CO2 and NH3; phosphatase can hydrolyze phosphate ester and participate in phosphorus cycling and mineralization [9,22,23]. Thus, enzyme activity can objectively reflect soil fertility to a certain extent, (e.g., a decrease in soil enzyme activity would indicate a decline in soil quality) [6]. Previous studies have shown that the enzymes related to mineralization of C, N, and P are closely related to the C: N: P stoichiometry of soil, e.g., higher C, N, and P nutrient availability can inhibit enzyme activities [24,25]. Simultaneously, soil physicochemical properties such as pH, water content, and temperature also affect enzyme activity [25,26]. Generally, soil enzymes are mainly secreted from roots and microbes, so enzyme activity is also affected by microbial community changes [27]. For example, increasing the number of soil microbes can promote the activities of sucrase and urease [22,26]. Therefore, comprehensive evaluation of soil nutrients, microbial community structure, and soil enzyme activity is of great significance for rational management and utilization of soil resources, maintenance of soil fertility, and improvement of plantation productivity.
Previous evidence revealed the effects of different afforestation years on soil nutrients, microbial communities, and enzyme activities, and revealed the close relationship between them [6,9,28]. Zhang et al. [9] found that soil microbial biomass, enzyme activity, and C/P and N/P ratios increased synergistically with the planting years of the Pinus tabulaeformis plantation, and there was a significant correlation between soil organic carbon, total nitrogen, enzyme activity, and microbial biomass. Zhu et al. [6] showed that successive cultivation of Eucalyptus urophylla decreased soil bacterial community diversity, microbial biomass, and enzyme activity, but increased fungal community diversity. Most of the above studies were performed in the topsoil, but the soil properties (physical, chemical, microbes, and enzyme) at different soil depths with afforestation years are still not completely understood, especially in successive cultivated plantations, and further research is needed. Moreover, Shen et al. [29] reported that different soil depths had significant effects on the numbers and activities of soil bacteria and fungi, and considered that the bacteria, fungi and enzyme activities of surface soil (0–20 cm) were more sensitive to nitrogen deposition.
Based on the existing research sites, we selected 10, 20, 30, and 36 years of P. massoniana plantations widely distributed in Central Guizhou, China as the research object. Soil samples were collected from different soil depths (0–20, 20–40, and 40–60 cm) to analyze soil physicochemical properties (total organic carbon (TOC), total nitrogen (TN), total phosphorus (TP), and C/N, C/P, and N/P ratios, ammonium nitrogen (NH4+-N), nitrate nitrogen (NO3-N), available phosphorus (AP), pH, soil water content (SWC), soil temperature (ST), and soil electrical conductivity (SEC)), microbes (bacterial and fungal alpha diversity and composition), and enzyme activity (acid phosphatase (S-ACP), sucrase, and urease). We hypothesized that: (1) the available nutrients in the soil may be consumed with the increase of the chronosequence of P. massoniana plantations (especially as it may lead to more severe P limitation in the late stage of plantation under the condition of low P in subtropical regions [30]), the imbalance of element stoichiometry (e.g., C/N, C/P, and N/P ratios), and the variation of other physicochemical properties, which may lead to different trends of bacteria, fungi, and different enzymes; (2) soil nutrient composition and related physicochemical properties decreased with soil deepening, which may lead to a simultaneous decrease in soil bacterial and fungal diversity and enzyme activities, but the differences in the functions of specific bacterial and fungal taxa may cause different trends. The objectives of this study were to (1) elucidate the rules of the changes of soil physicochemical properties, bacterial and fungal alpha diversity and composition, and enzyme activities of P. massoniana plantation with planting years; (2) determine whether there are significant differences in soil physicochemical properties, bacterial and fungal alpha diversity and composition, and enzyme activities in different soil depths; (3) reveal the correlation among soil physicochemical properties, bacterial and fungal alpha diversity and composition, and enzyme activities. The related results are expected to provide theoretical reference for soil nutrient monitoring, management, and artificial intervention of P. massoniana plantations.

2. Materials and Methods
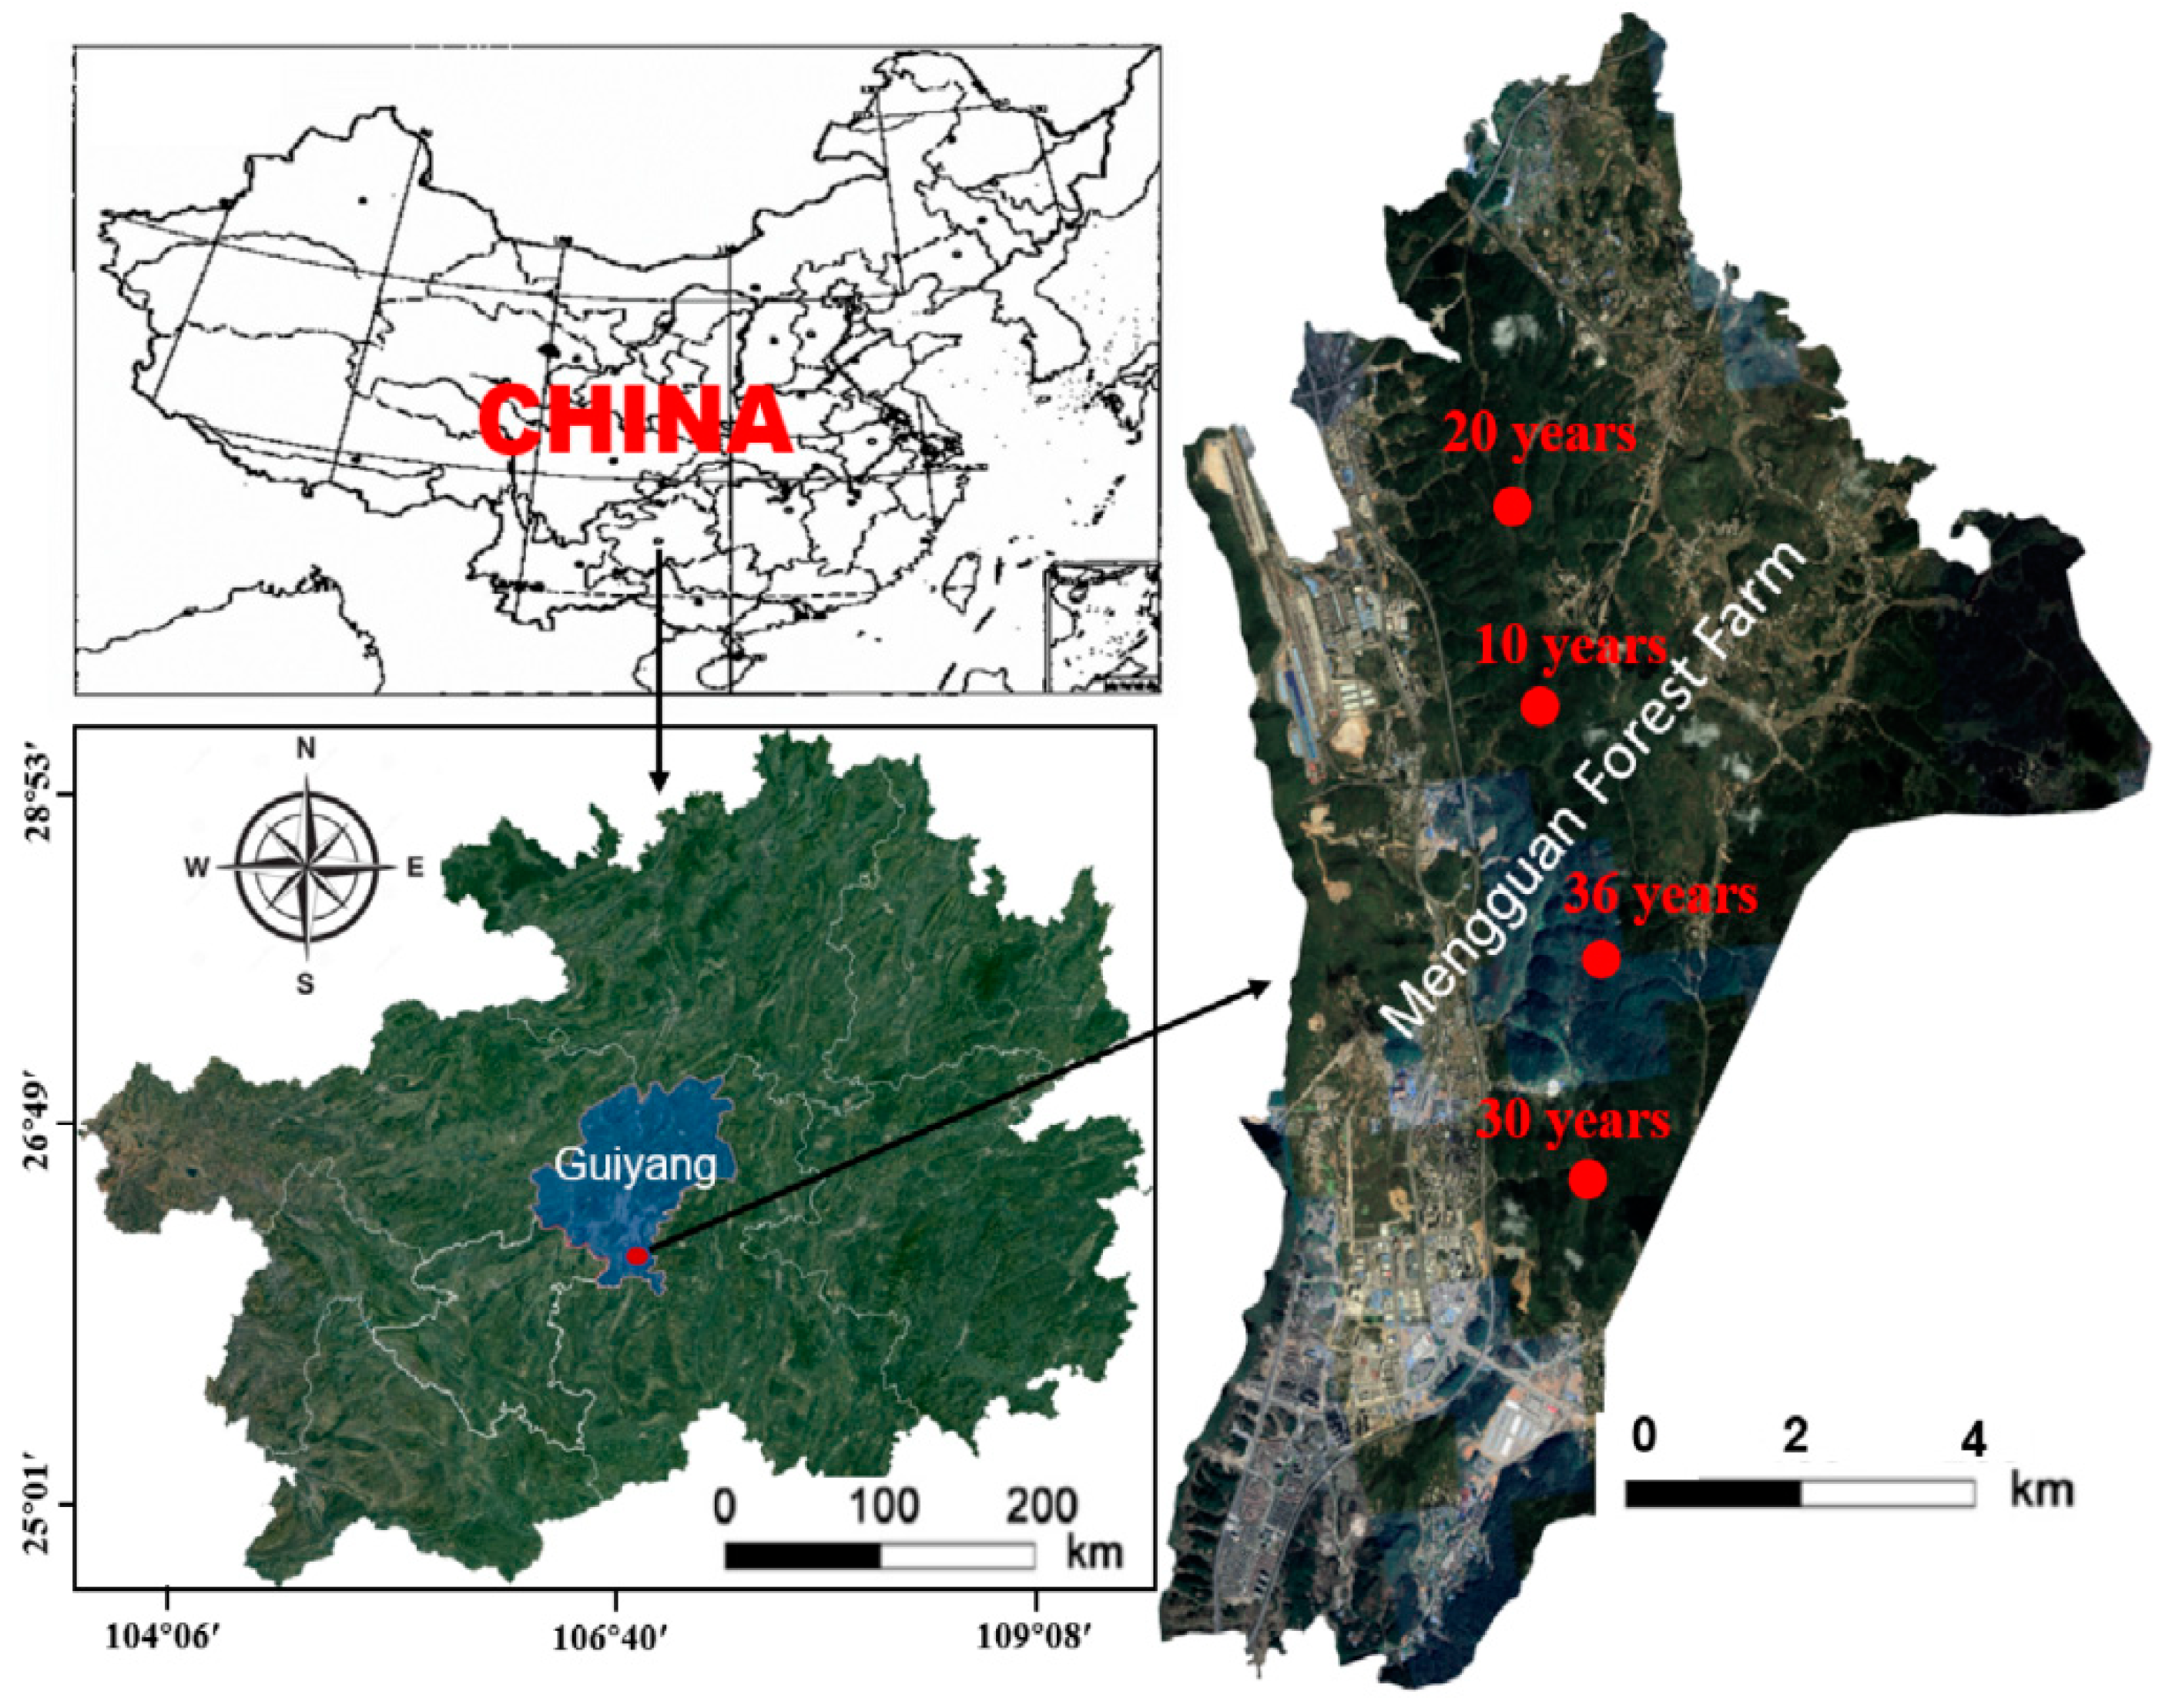
2.1. Study Region

This study was carried out in the Mengguan Forest Farm (26°21′54.6″ N–26°22′30″ N, 106°43′20.8″ E–106°44′12″ E) in Guiyang, Guizhou Province, China (Figure 1). The total area of the forest farm is 1143 ha; it belongs to the mountain geomorphic type in the northern subtropical area, with an altitude of about 1100–1300 m and a relative height difference of 100–200 m. Therefore, it also has a subtropical monsoon climate, with an annual mean temperature of 14.9 °C and annual mean relative humidity of 80%. The annual precipitation reaches 1120 mm and is primarily concentrated from May to August, accounting for about 60% of the annual precipitation. The soil of the forest farm belongs to the siliceous yellow soil developed from sand shale, which is acidic, has a pH value of 3.5–6.5, moderate fertility, and a soil depth of 60–80 cm. The virgin vegetation of the forest farm was P. massoniana and broadleaf tree (Betula platyphylla and Myrica rubra) sparse forest, which was established as a pure forest of P. massoniana in 1980s. We conducted a preliminary investigation of the P. massoniana plantation on 5–25 August 2017 and determined that four stands aged 10, 20, 30, and 36 years and established in 2007, 1997, 1987, and 1981, respectively, with a plant/row distance of 1 m × 2 m (each stand was consistent). According to the forestry industry standards of the People’s Republic of China: Regulations for age-class and age-group division of main tree-species (LY/T 2908-2017), the above four stands represent the young forest, middle-aged forest, near-mature forest, and mature forest, respectively [31]. After afforestation, the areas were irrigated, pruned, and managed only in the first three years. The first and the second thinning were conducted 10 and 20 years after establishment, respectively, with 40% and 30% of trees being removed, leaving a density of less than 1500 trees ha−1. The main tree species were P. massoniana, and the shrub species primarily included Myrsine africana, Viburnum dilatatum, and Vaccinium bracteatum. The herbs were primarily Dichanopteris dichotoma, Odontophoria chinensis, and Deyeuxia pyrimidalis.

2.2. Experimental Design

The sample plot setting was carried out on 20–25 August 2017. The four stands had similar environmental characteristics, such as altitude, slope aspect, slope, slope position, and soil texture. Three 20 m × 20 m typical plots were randomly set in different age stands (12 sample plots in total). The diameter at breast height (DBH), tree height, height under the branch, canopy density, altitude, slope aspect, slope, slope position, and soil parameters of P. massoniana in the sample plot were measured (Table 1).

2.3. Soil Samples Collection

Soil sample collection was carried out on 20 June 2019. Five sampling points were set on the diagonal of each 20 m × 20 m plot to collect soil samples at depths of 0–20, 20–40, and 40–60 cm, respectively. Then, the debris such as stones, litter, and roots were removed, and the five different sampling points with the same soil depth were mixed. Each plot obtains representative samples of three soil depths (using the quartering method, taking 500 g soil for each soil depth). A total of 36 soil samples (4 ages × 3 plots × 3 soil depths) were obtained in this study. Each soil sample was divided into two parts. One-part samples were placed in sterile bags, and these samples were cooled immediately until arrival at the laboratory, and then they were subsampled and frozen at −80 °C as soon as possible until they were used to extract soil microbial DNA. The other part was used to determine the physicochemical properties and enzyme activities of soil.

2.4. Soil Physicochemical Properties and Enzyme Activity Measurements

The collected soil samples were air dried and crushed in the laboratory to determine the soil physicochemical properties and enzyme activities. The total organic carbon (TOC) concentration of soil was determined using the K2Cr2O7 oxidation method. After digestion with H2SO4-H2O2, the concentrations of total nitrogen (TN) and total phosphorus (TP) were determined by the Kjeldahl and Mo-Sb colorimetric assay methods, respectively [32]. Soil ammonium (NH4+-N) was extracted by 2 mol L−1 KCl and determined by the Indigo phenol blue method [33]. Nitrate nitrogen (NO3-N) was determined by ultraviolet spectrophotometry [34]. Available phosphorus (AP) was extracted by NH4F, followed by the colorimetric method [35]. The pH value of soil was determined by the glass composite electrode method (water soil ratio of 2.5: 1) [20]. Soil water content (SWC), temperature (ST), and electrical conductivity (SEC) were measured by TDR350 soil moisture, temperature, and electrical conductivity meter. Soil acid phosphatase (S-ACP) was determined by diphenyl sodium phosphate colorimetry, sucrase by 3,5-Dinitrosalicylic acid colorimetry, and urease by indophenol colorimetry [36].

2.5. Determination of Soil Bacteria and Fungi

2.5.1. DNA Extraction, PCR Amplification, and Illumina Sequencing

Soil DNA extraction, PCR amplification, and Illumina sequencing were completed by Hangzhou Kaitai Biotechnology Co., Ltd. (Hangzhou, China). The soil sample weighed 0.25 g. FastDNA® Spin Kit (MP Biomedicals, Santa Ana, CA, USA) was used to extract the total DNA in the soil sample according to the manufacturer’s instructions. The DNA concentration and purity were detected using the Thermo NanoDrop 2000 UV spectrophotometer and 1% agarose gel electrophoresis. The tested samples were stored at −80 °C for further analysis. The v3 + v4 region of the bacterial 16S rDNA gene and V4 region of the fungal 18S rDNA gene were amplified by StepOne Plus fluorescent quantitative PCR. The bacterial primers were 341F (5′–CCTACGGGNGGCWGCAG–3′) and 805R (5′–GGACTACHVGGGTWTCTAA–3′) [37]. The fungal primers were EF4F (5′–GGAAGGGRTGTATTTATTAG–3′) and EF3R (5′–TCCTCTAAATGACCAAGTTTG–3′) [38]. The PCR reaction was performed in a 20.0 µL mixture, which contained 1.0 µL of DNA template (10 ng/µL), 0.4 µL of forward primer, 0.4 µL of reverse primer, 0.4 µL of ROX Reference Dye, 10.0 µL of 2 × SYBR®Premix EX Taq™, and 7.8 µL of water without RNA enzyme (Rnase-Free Water). The PCR amplification procedure was as follows: per-denaturation at 95 °C, 3 min, 1 cycle; denaturation at 95 °C, 30 s, 25 cycles; annealing at 55 °C, 30 s; extension at 72 °C, 30 s; final extension at 72 °C, 5 min, 1 cycle; and 4 °C storage. Library quality inspection was performed by Thermo NanoDrop 2000 UV spectrophotometer and 2% agarose gel electrophoresis. After the quality inspection was qualified, the library was quantified by KAPA Library Quantification Kit Illumina® Platforms (KAPA Biosystems, Inc., Wilmington, NC, USA). Finally, an equal amount of PCR product from each sample was put into the single tube, and then high-throughput sequencing was performed using Illumina Miseq platform of Hangzhou Kaitai Biotechnology Co., Ltd. (Hangzhou, China).

2.5.2. Sequencing Data Processing

The two ends of the library were sequenced on the Illumina MiSeq. Each sample generated two files (reads1 and reads2), which were stored in a low-quality fastq format. Conducting quality control and filtering on the original offline data is necessary to obtain high-quality sequencing data and improve the accuracy of biological information analysis [39]. The main steps were as follows: (1) the fastq_mergepairs command of Vsearch software was used to assemble the paired reads from double terminal sequencing into a single sequence; (2) Cutadapt software was used to remove PCR primers from the sequence; (3) the fastq_filter command Vsearch software was used to remove the base sequence containing N (fuzzy base), the same base number of more than 8, and length of less than 100 bp.

2.5.3. Operational Taxonomic Unit (OTU) Clustering and Notes

To reduce the amount of redundant calculation in the process of analysis, we counted the repetitive sequence and extracted the non-repetitive sequence. We used Vsearch software to remove the once-detected sequences (Singleton sequences). The sequences with more than 97% similarity were gathered into one operational taxonomic unit (OTU), the chimeric sequence was removed, and the OTU representative sequence was used for subsequent species annotation. We used the Ribosomal Database Project (RDP) [40] and SLIVA databases [41] to classify and identify bacteria and fungi, respectively. The raw sequencing reads are available at the Sequence Read Archive (SRA) database of the National Center for Biotechnology Information (NCBI) under accession numbers SRP291512: PRJNA675184.

2.6. Statistical Analysis

Based on the OTU information of soil samples, the alpha diversity (Shannon index, H′) of bacteria and fungi in soil samples was calculated by using the software of mothur (version v.1.30.1) [10]. The Shannon index was used to estimate the microbial diversity in the soil samples, and the larger the Shannon index, the higher the diversity. Two-way ANOVA was used to examine the effects of stand age and soil depth on soil microbial community composition and diversity and elemental stoichiometry. Significant differences were measured by one-way ANOVA followed by an LSD test and significance was determined at the 0.05 level. Pearson correlation was used to determine the relationship between soil microbial diversity, enzyme activity, and soil physicochemical properties. These statistical analyses were carried out on SPSS 21.0 software (SPSS, Somers, NY, USA) and the figures were mapped on Origin 2020 (Origin Lab Corp., Northampton, MA, USA). Redundancy analysis (RDA) was used to study the effect of soil element stoichiometric variables on soil microbial community composition and implemented on Canoco 5.0 software (Microcomputer Power, Inc., Ithaca, NY, USA). The formula of Shannon index (H′) is as follows:
H   =     i = 1 S o b s n i N ln n i N
where Sobs = the number of OTU actually measured; ni = the number of OTU containing i sequences; n = the number of all sequences.

3. Results

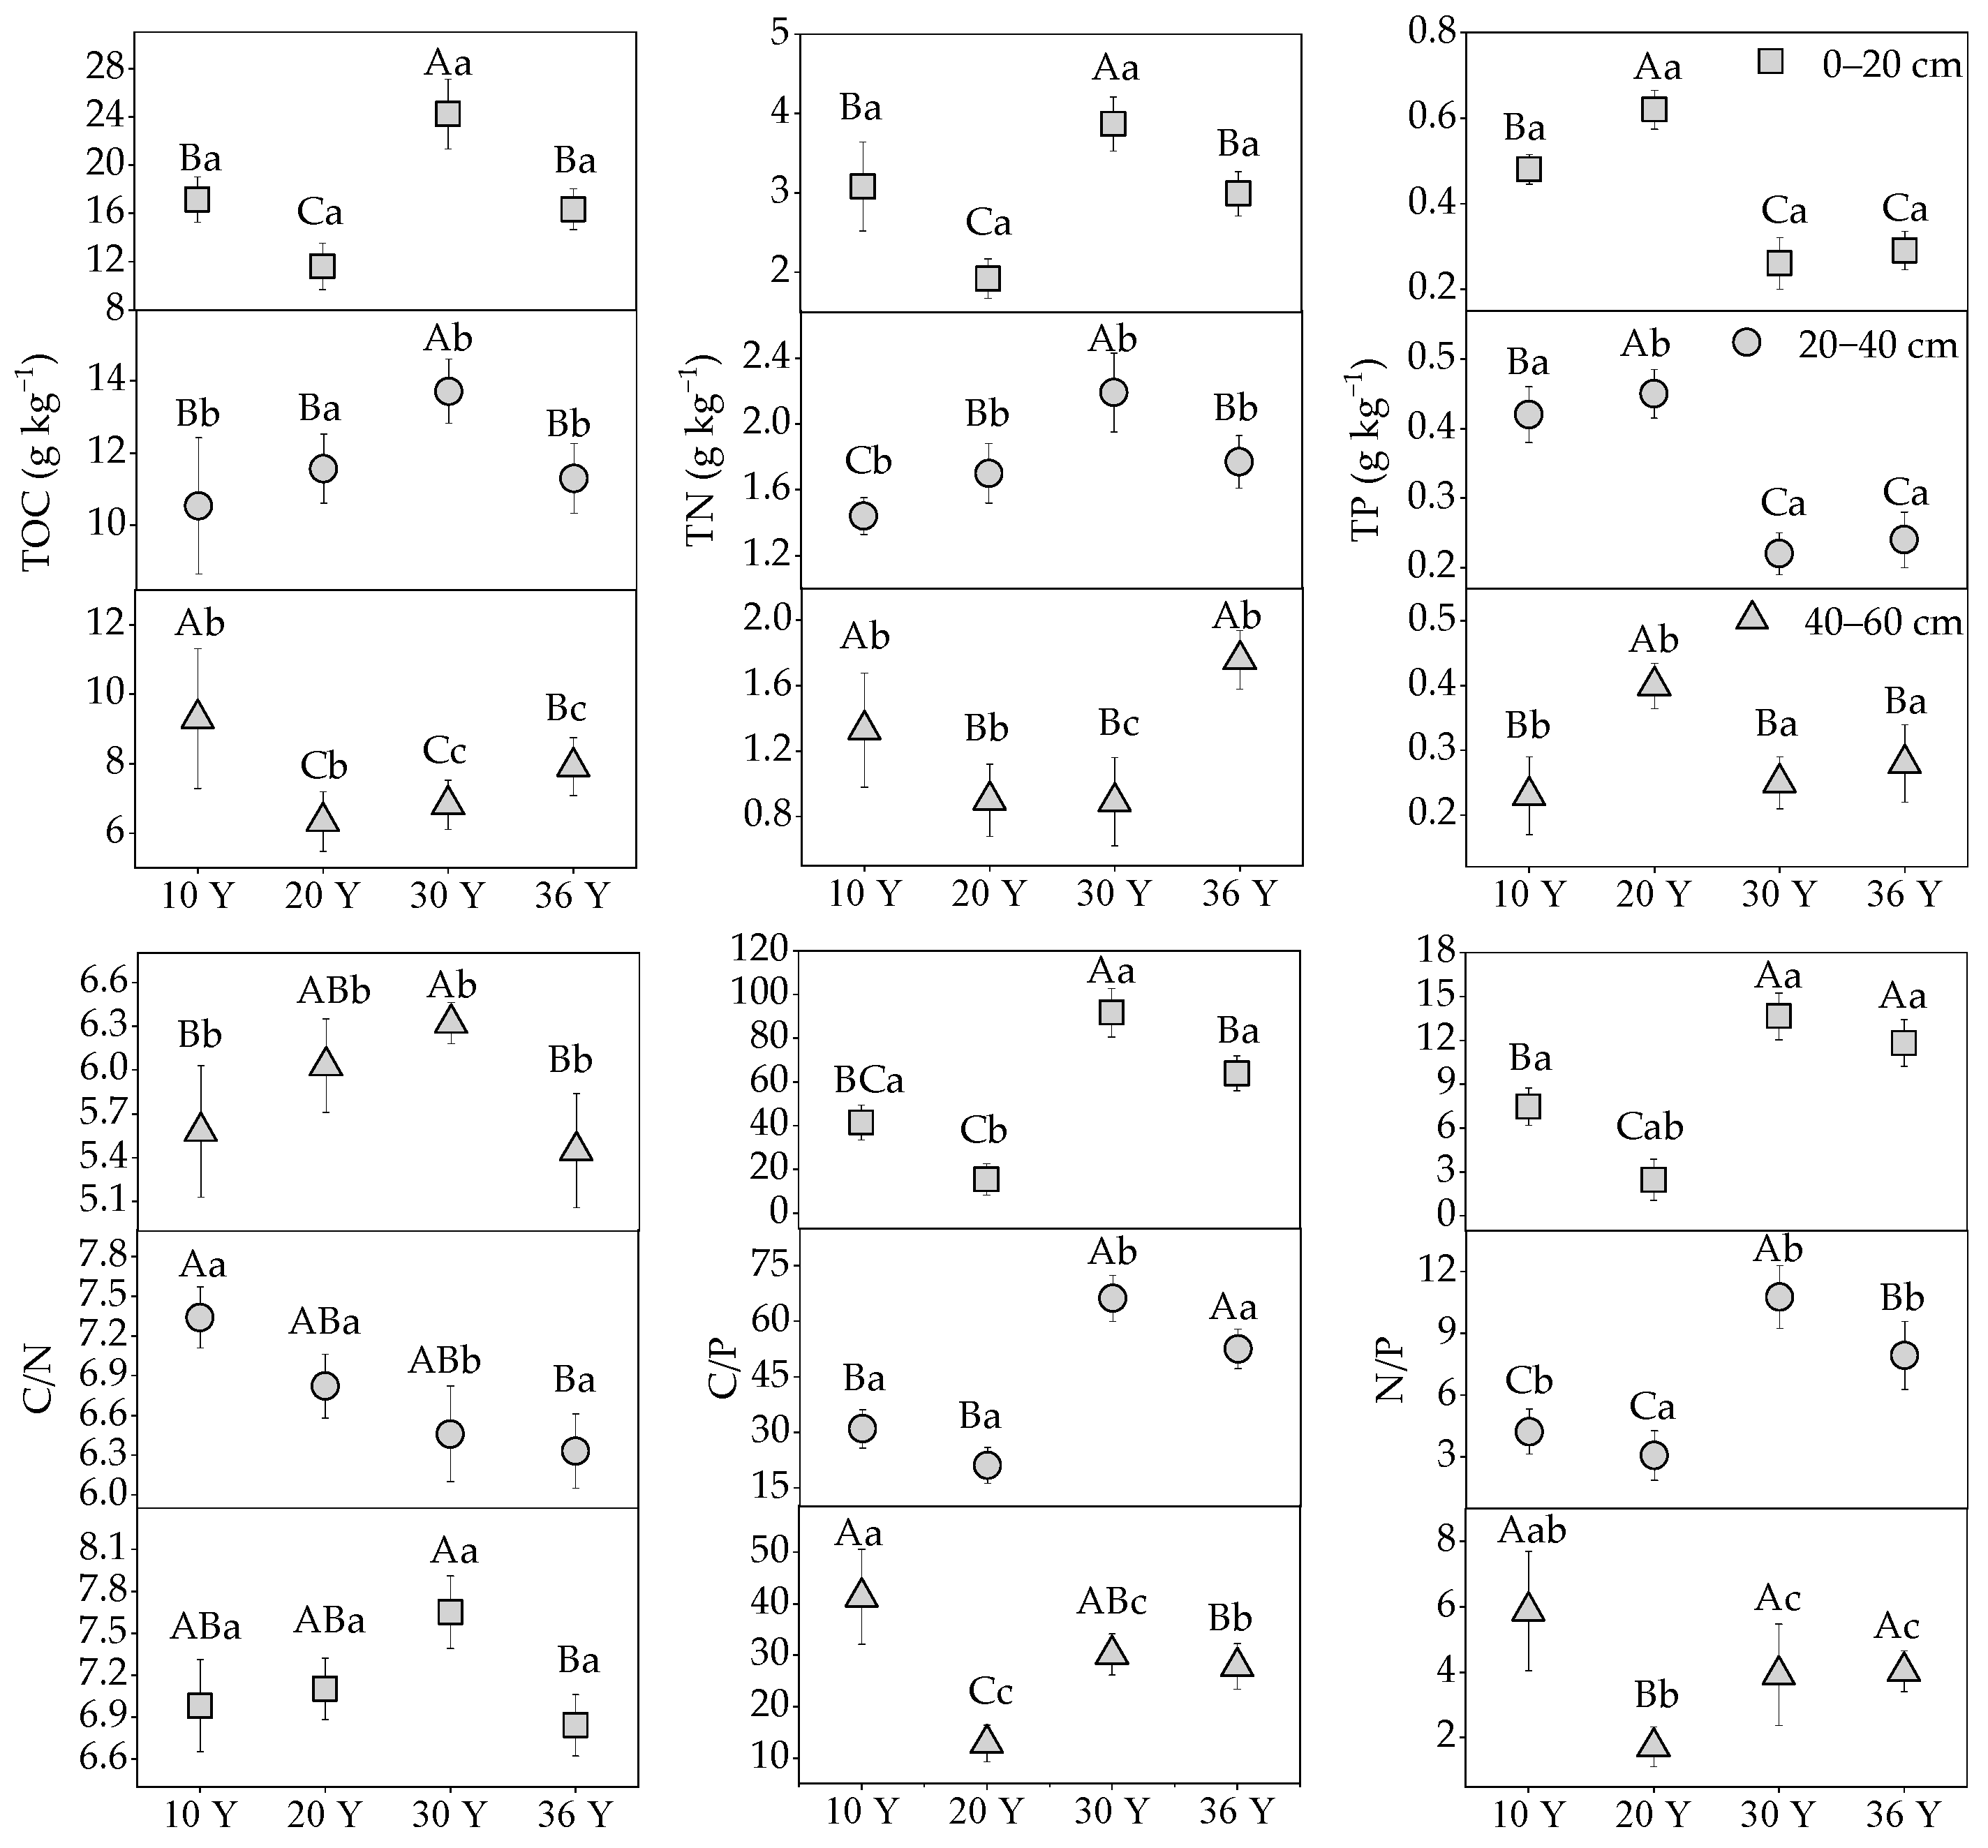
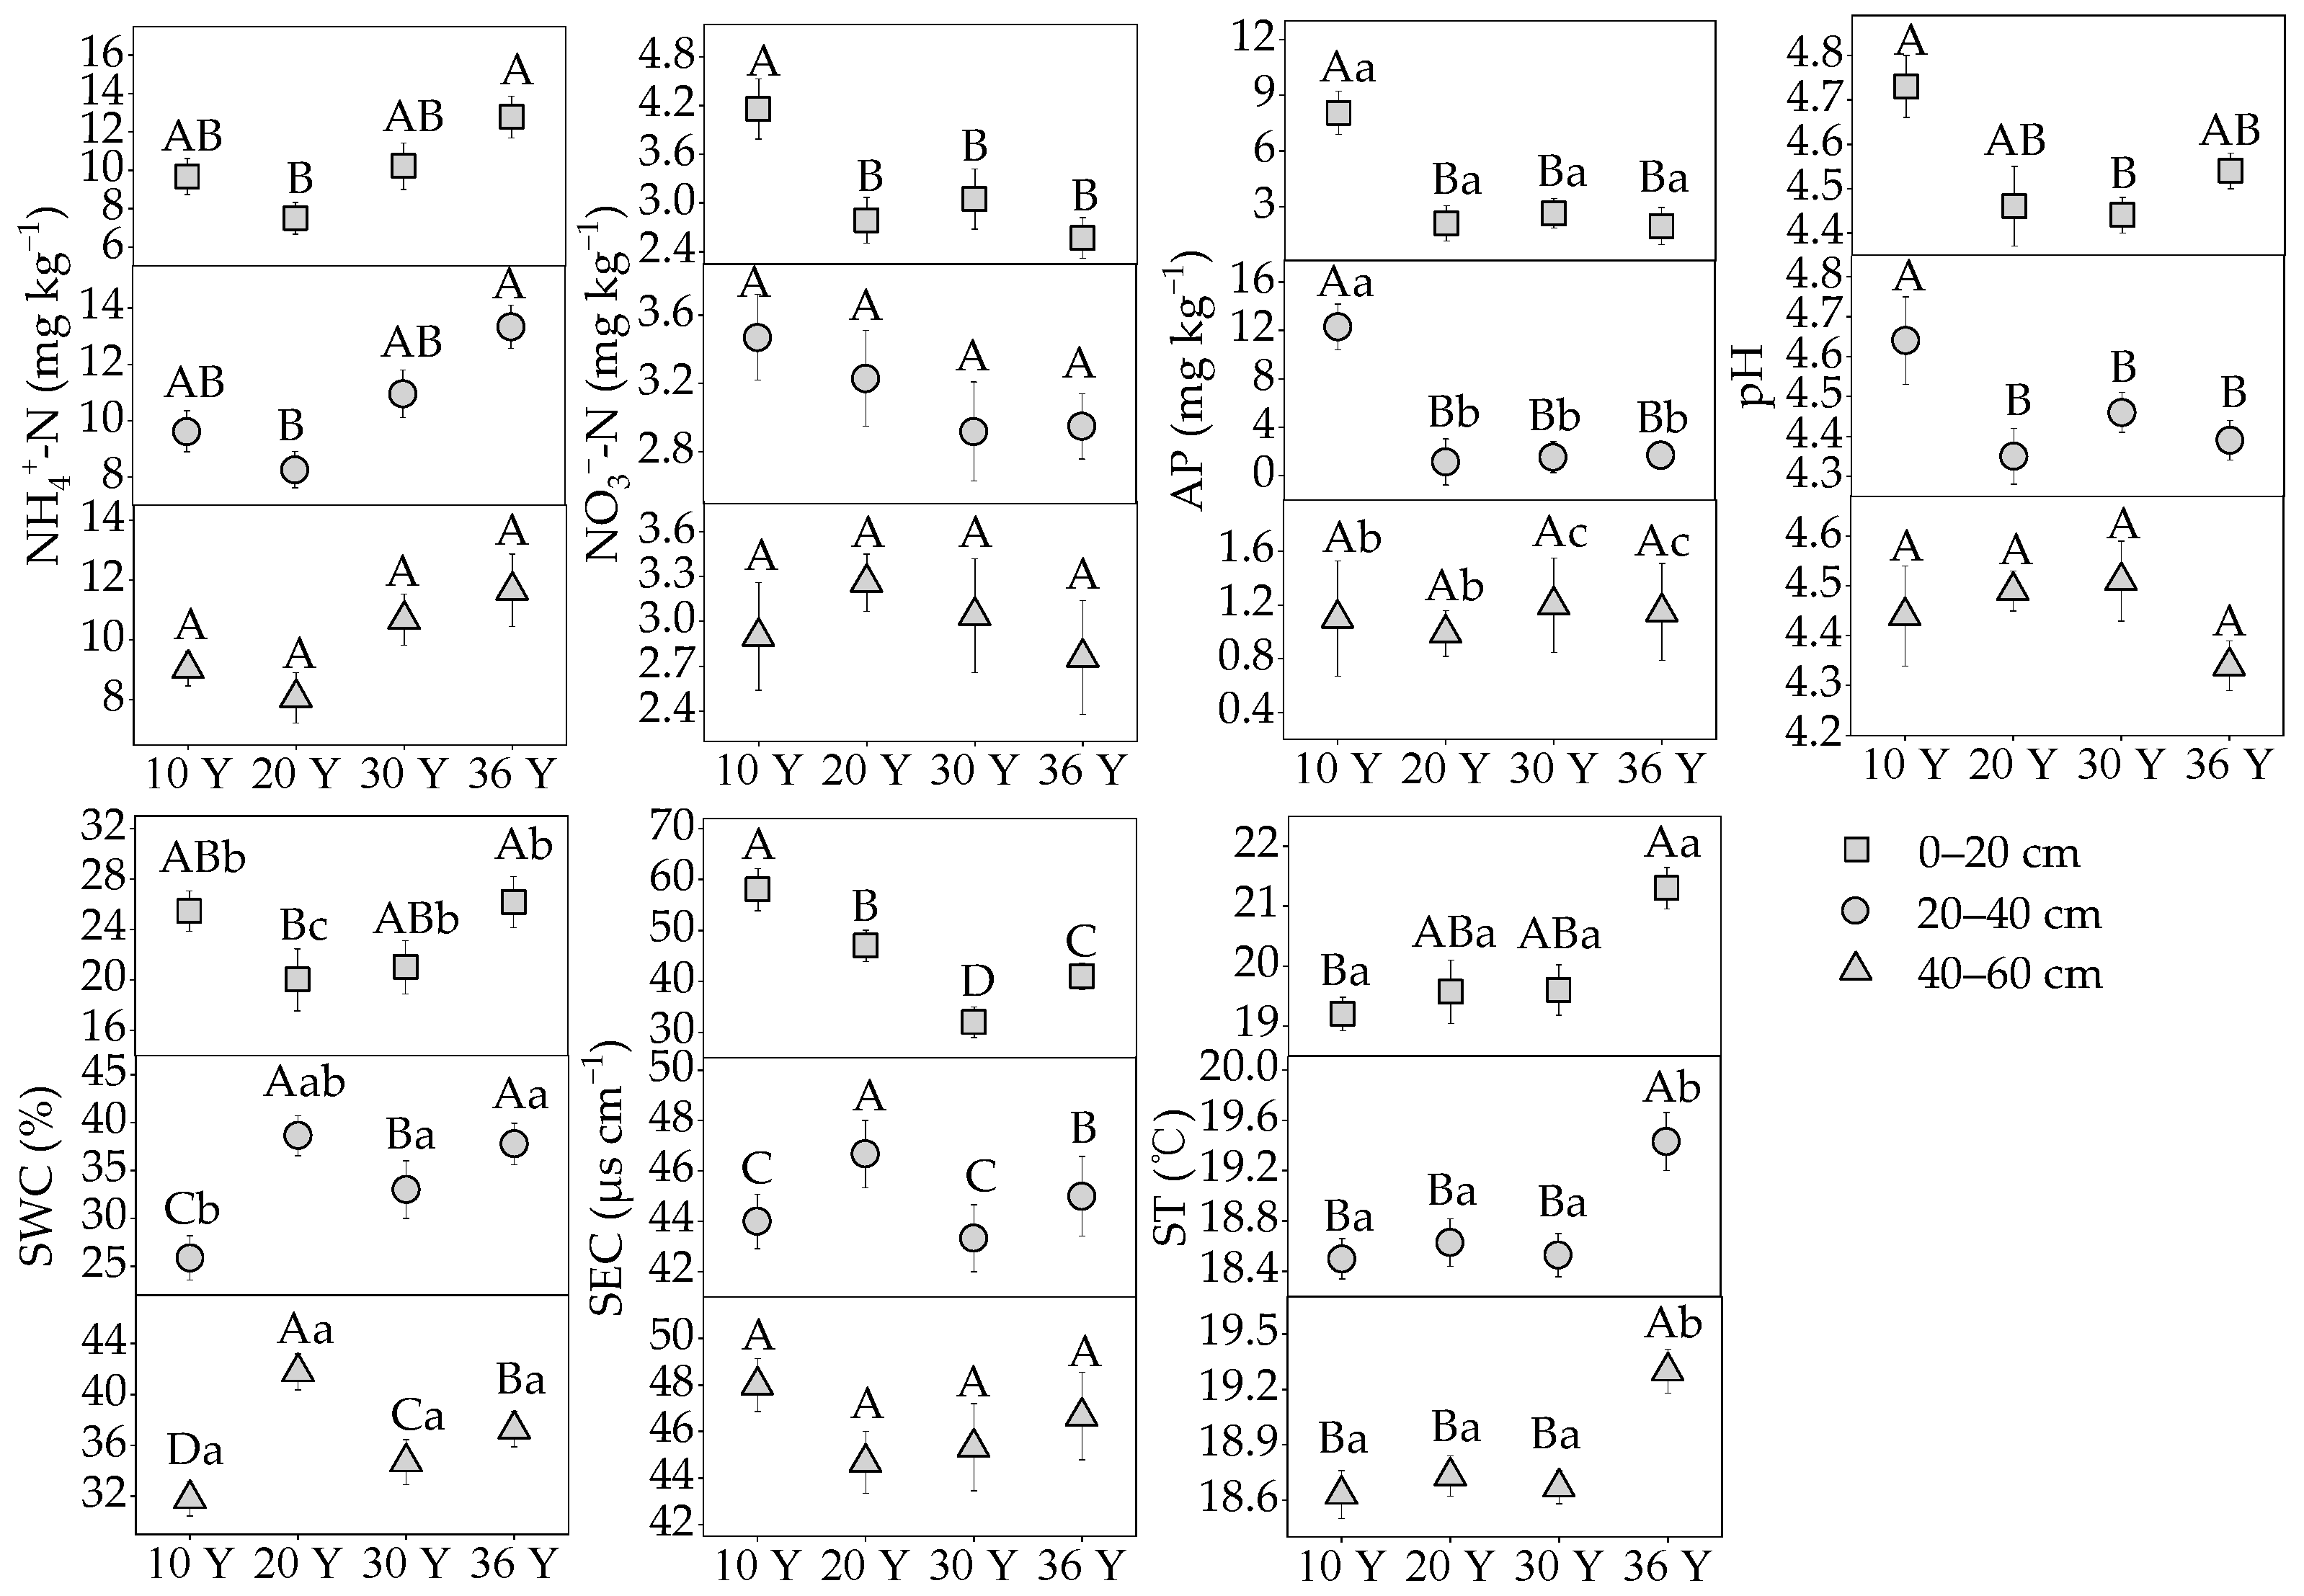
3.1. The Variation of Soil C: N: P Stoichiometry and Physicochemical Properties with Stand Age and Soil Depth

The two-way ANOVA showed that different stand ages and soil depths had significant effects on soil TOC, TN, and TP concentrations and their stoichiometry (Table 2, p < 0.05 or p < 0.01). TOC and TN concentrations in different soil depths showed different trends with the increase of stand age. That is, the 0–20 and 20–40 cm soil depths showed that 30-year stand was significantly higher than other stands, while the 40–60 cm soil depth showed that 20-year and 30-year stands were significantly lower than the other stands (Figure 2, p < 0.05). TP concentrations of 0–20, 20–40, 40–60 cm soil depths increased first, then decreased with the increase of stand age and peaked in 20-year stand (0.62 ± 0.04 g kg−1, 0.45 ± 0.02 g kg−1, and 0.40 ± 0.03 g kg−1, respectively). C/N ratio of 0–20 and 40–60 cm soil depths first increased, then decreased with the increase of stand age and peaked in 30-year stand (6.32 ± 0.14 and 7.65 ± 0.49, respectively), while C/N ratio of 20–40 cm soil depth tended to decrease (Figure 2). The changing trend of C/P and N/P ratios in the three soil depths were opposite to TP concentration with the increase of stand age. Except for the C/N ratio, the soil nutrient concentration and their stoichiometry of 0–20 cm soil depth in four stands were significantly higher than other soil depths (Figure 2, p < 0.05).
Different stand ages had significant effects on soil physicochemical properties (p < 0.05 or p < 0.01). Different soil depths had no significant effects on NH4+-N, NO3-N, pH, and SEC (p > 0.05), but had significant effects on AP, SWC, and ST (Table 2, p < 0.01). NH4+-N and ST of three soil depths tended to rise with the increase of stand age and reached the highest in 36-year stand (the mean values were 12.59 ± 0.58 mg kg−1 and 20.01 ± 0.37 °C, respectively). On the contrary, except for 40–60 cm soil depth, NO3-N, AP, and pH tended to decrease with the increase of stand age, and the maximum appeared in 10-year stand (the mean values were 3.51 ± 1.56 and 7.15 ± 2.06 mg kg−1, and 4.60 ± 0.05, respectively) (Figure 3). SWC and SEC showed irregular changes, and they decreased first and then increased in 0–20 cm soil depth with the increase of stand age, which was the lowest in 20 (20.00 ± 2.46%) and 30 years (32.00 ± 2.00 µs cm−1), respectively. AP and ST of four stands decreased significantly with the increase of soil depth, while SWC increased significantly (Figure 3, p < 0.05).

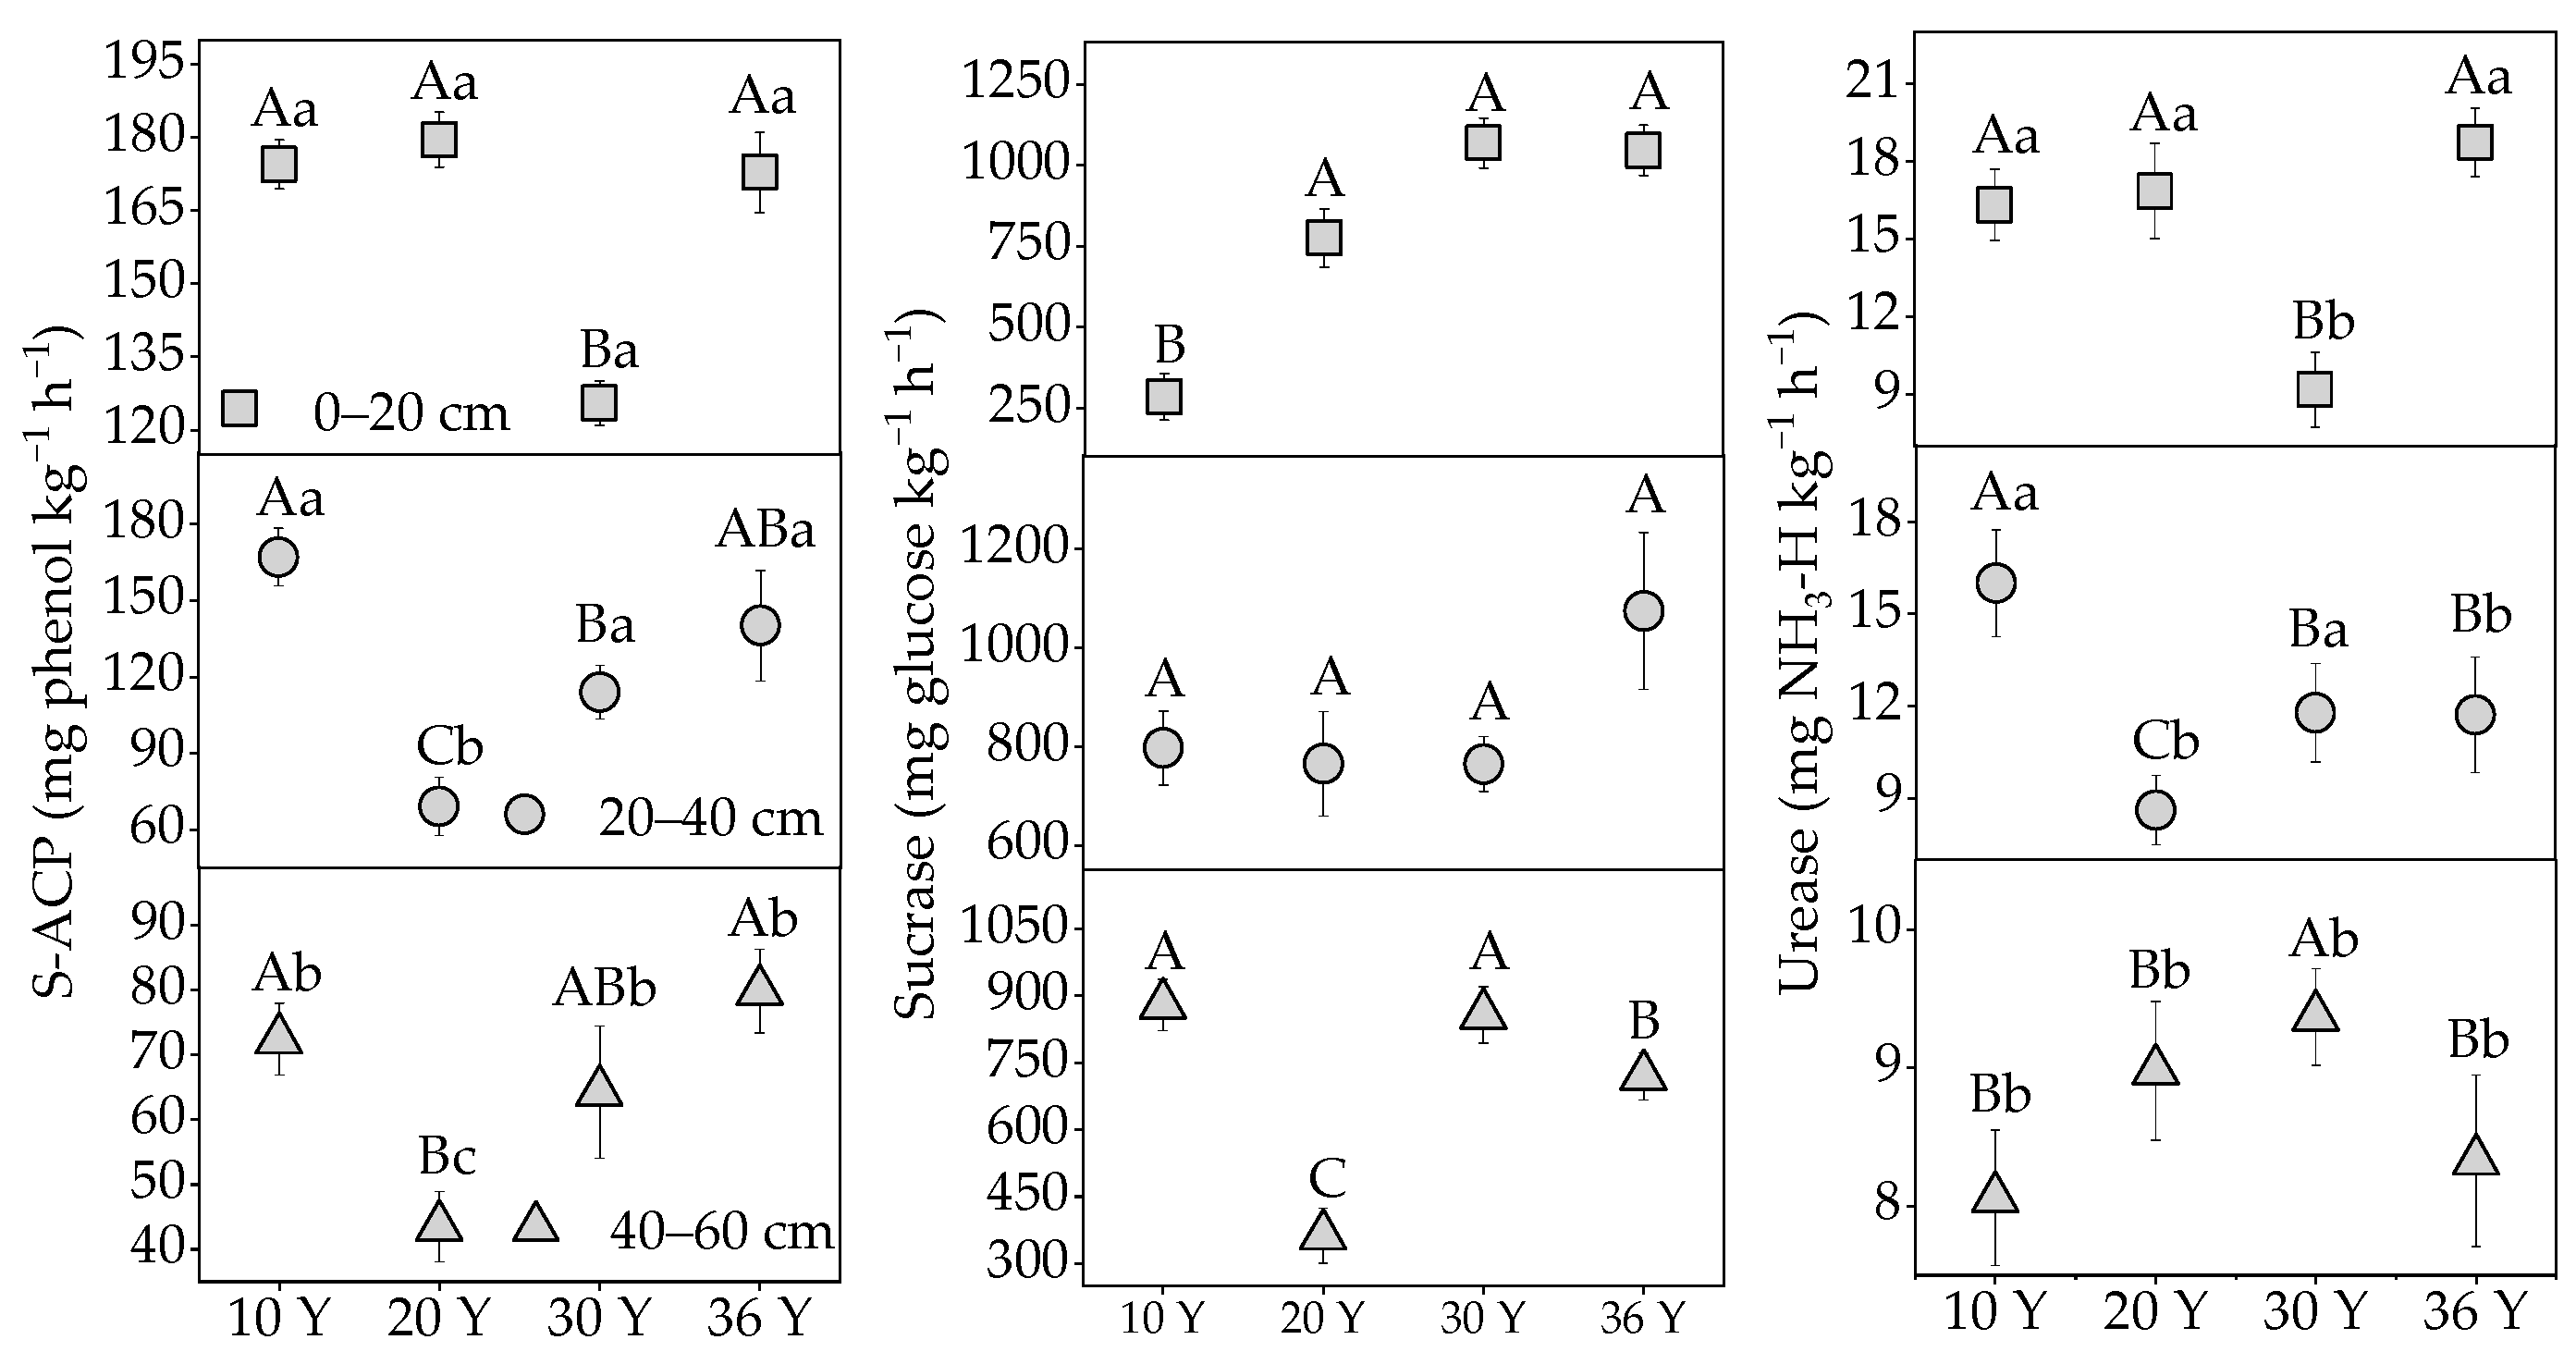
3.2. The Variation of Soil Enzyme Activities with Stand Age and Soil Depth

The two-way ANOVA showed that different stand ages had significant effects on S-ACP, sucrase, and urease (p < 0.01). Different soil depths had significant effects on soil acid phosphatase and urease (p < 0.01), while they had no significant effects on sucrase (Table 2, p > 0.05). On the whole, except for urease of 30-year stand at 40–60 cm, soil depth was significantly higher than other stands (p < 0.05); S-ACP and urease decreased first and then increased with the increase of stand age. S-ACP and urease of 30-year stand at 0–20 cm soil depth was significantly lower than other stands, and S-ACP of 20-year stand at 20–40 and 40–60 cm soil depths and urease of 20-year stand at 20–40 cm soil depth was significantly lower than other stands (Figure 4, p < 0.05). The sucrase of 0–20 and 20–40 cm soil depth tended to rise with the increase of stand age, but there was no significant difference between different stands at the 20–40 cm soil depth (p > 0.05). The sucrase of 20-year stand at 40–60 cm soil depth was significantly lower than other stands (Figure 4, p < 0.05). Moreover, S-ACP and urease of 40–60 cm soil depth in four stands were significantly higher than other depths (p < 0.05).

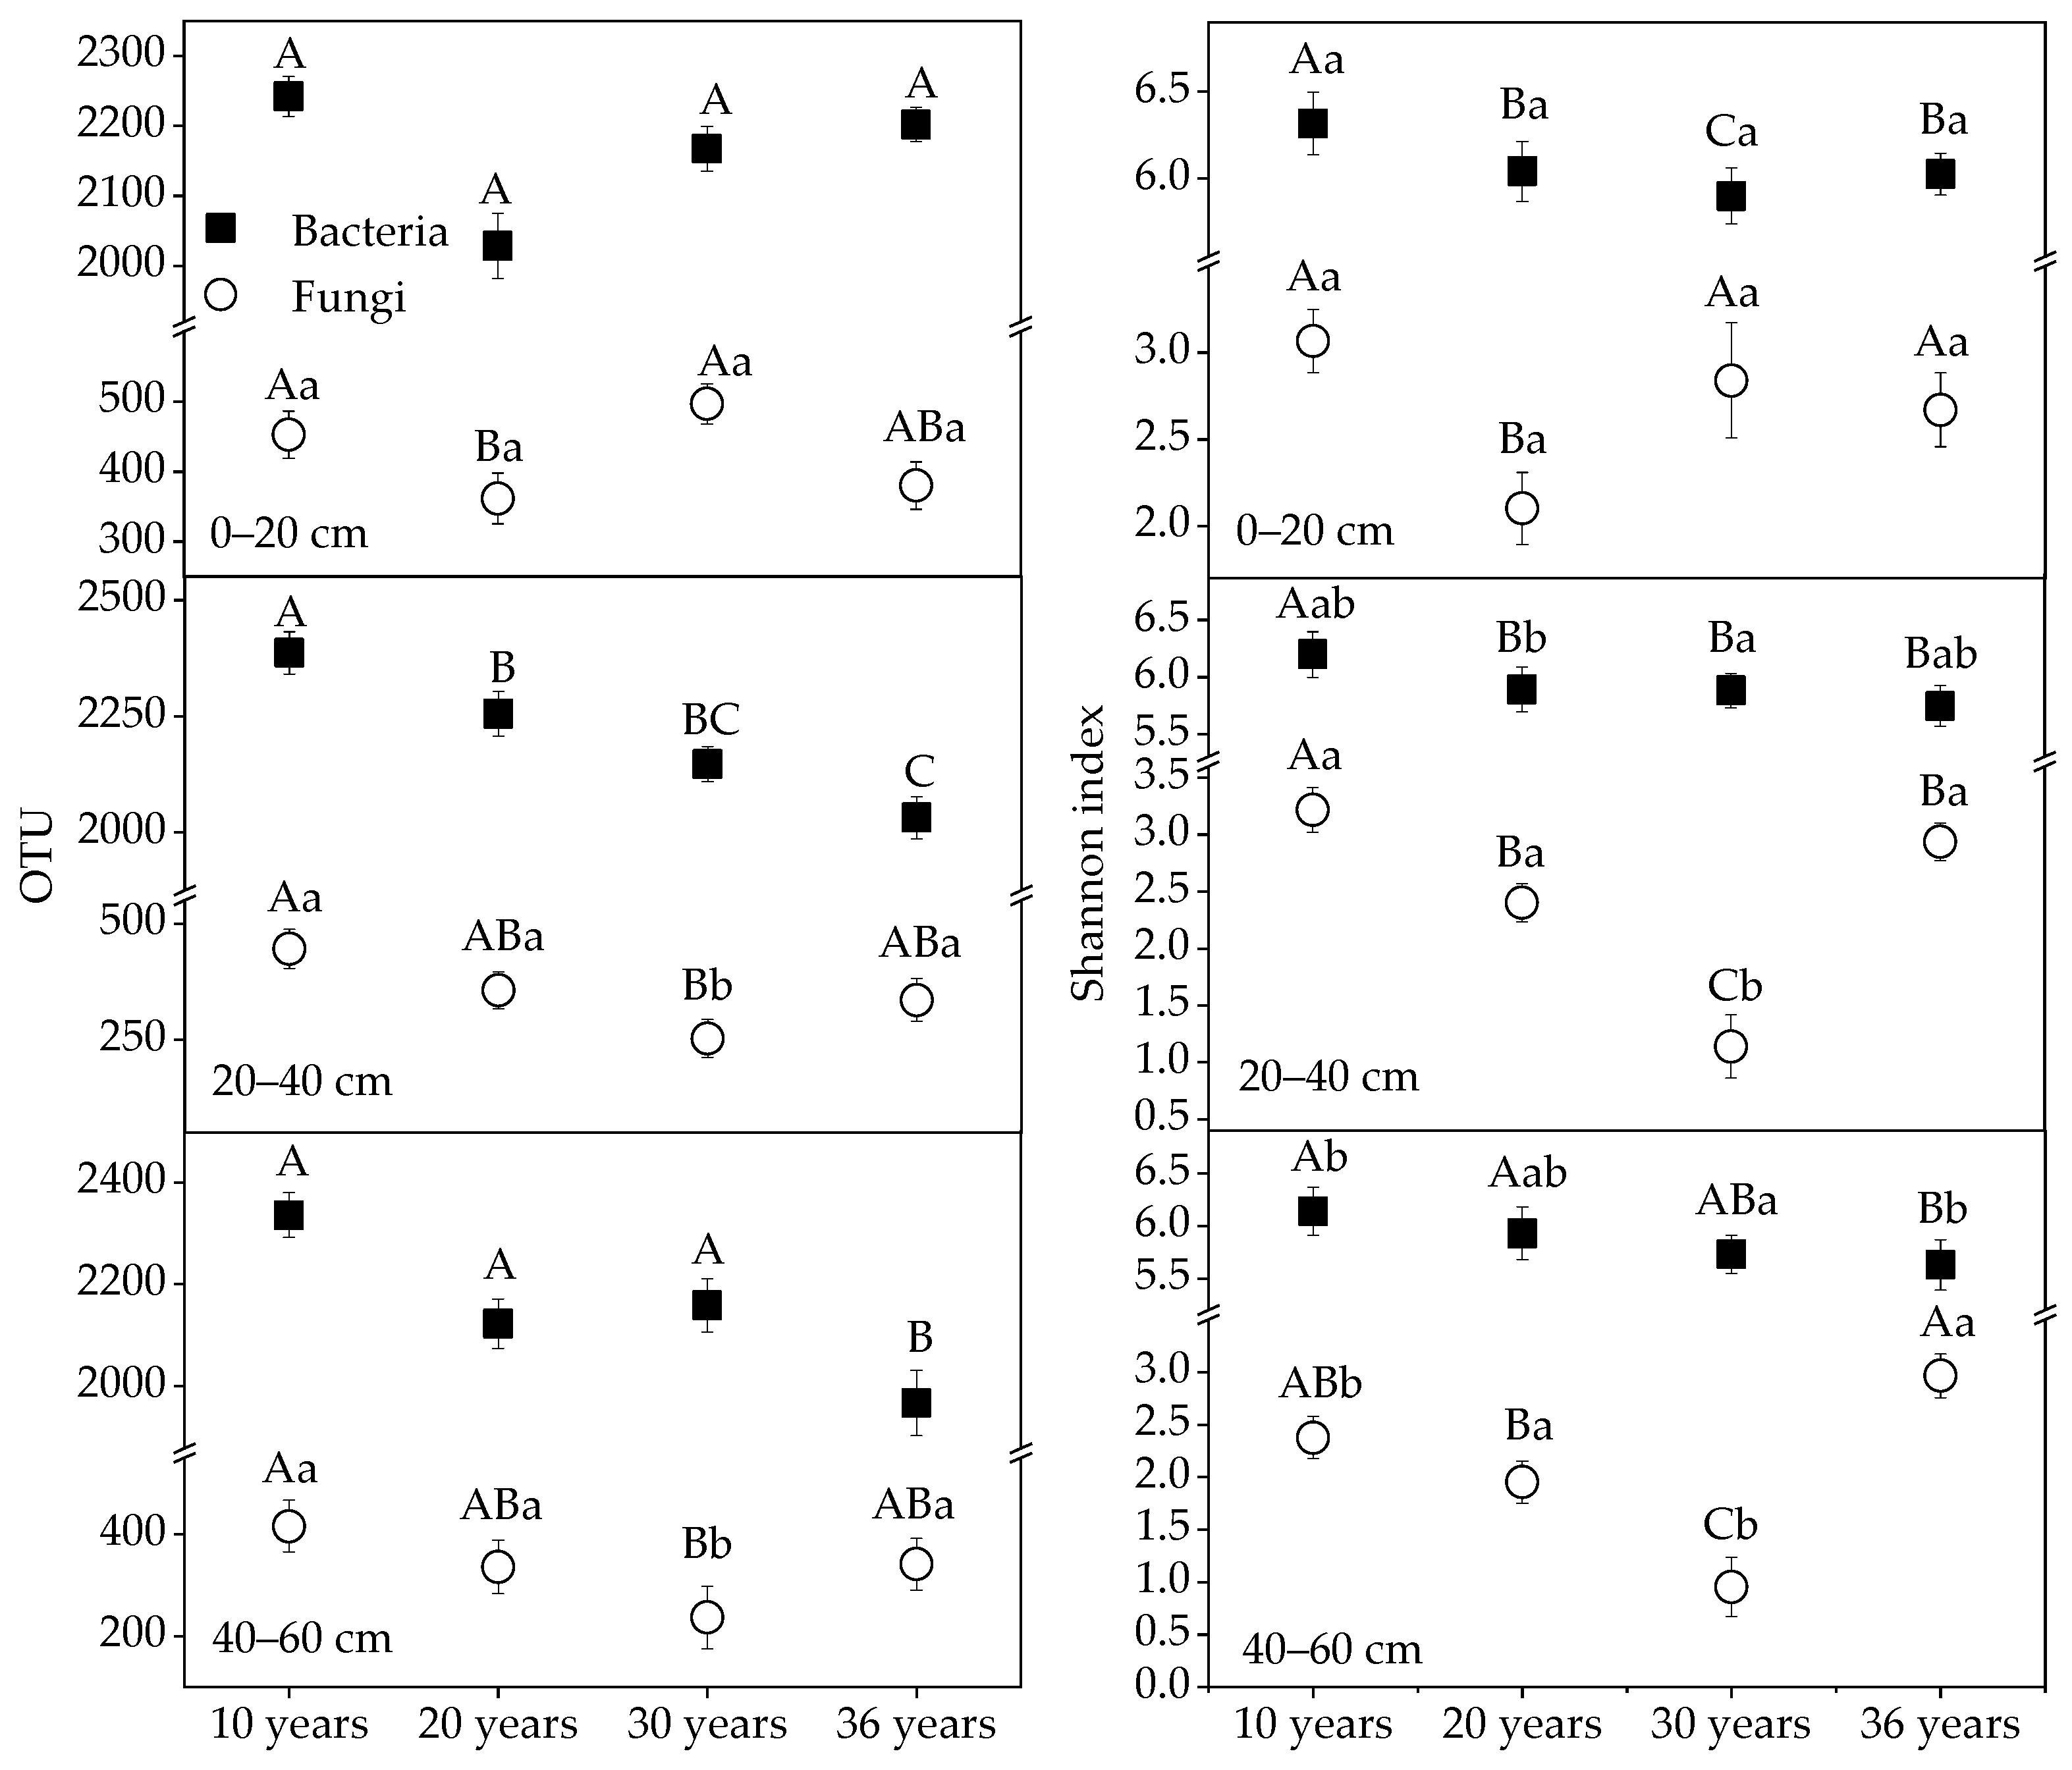
3.3. Alpha Diversity of Soil Bacteria and Fungi

The total quantity of bacterial and fungal OTU obtained from 36 samples was 78,132 and 13,230, respectively, and the number of bacterial and fungal OTU in each sample was 1780 to 2461 and 151 to 528, respectively (Figure 5). Based on 97% similarity, the rarefaction curves for bacteria and fungi tended to saturate for each sample (Figure S1), which showed that the sequencing data were reasonable, and the majority of sequence types could be detected. The two-way ANOVA showed that different stand ages had significant effects on bacterial and fungal OTU and Shannon index (p < 0.05). Different soil depths had significant effects on bacterial Shannon index and fungal OTU and Shannon index (p < 0.05), while they had no significant effects on bacterial OTU (Table 2, p > 0.05). The bacterial and fungal Shannon index had the same trend with OTU, that is, the bacterial alpha diversity decreased with the increase of stand age, while the fungal alpha diversity first decreased and then increased (Figure 5). The bacterial Shannon index of 0–20, 20–40, and 40–60 cm soil depths were the largest in 10-year stand, which were 6.32 ± 0.08, 6.20 ± 0.10, and 6.14 ± 0.03, respectively. The fungal Shannon index of 20–40 and 40–60 cm depths were the smallest in the 30-year stand, which were 1.14 ± 0.18 and 0.95 ± 0.28, respectively (Figure 5). Furthermore, the bacterial and fungal alpha diversity of 0–20 cm soil depth was significantly higher than that of the other two soil depths (Figure 5).

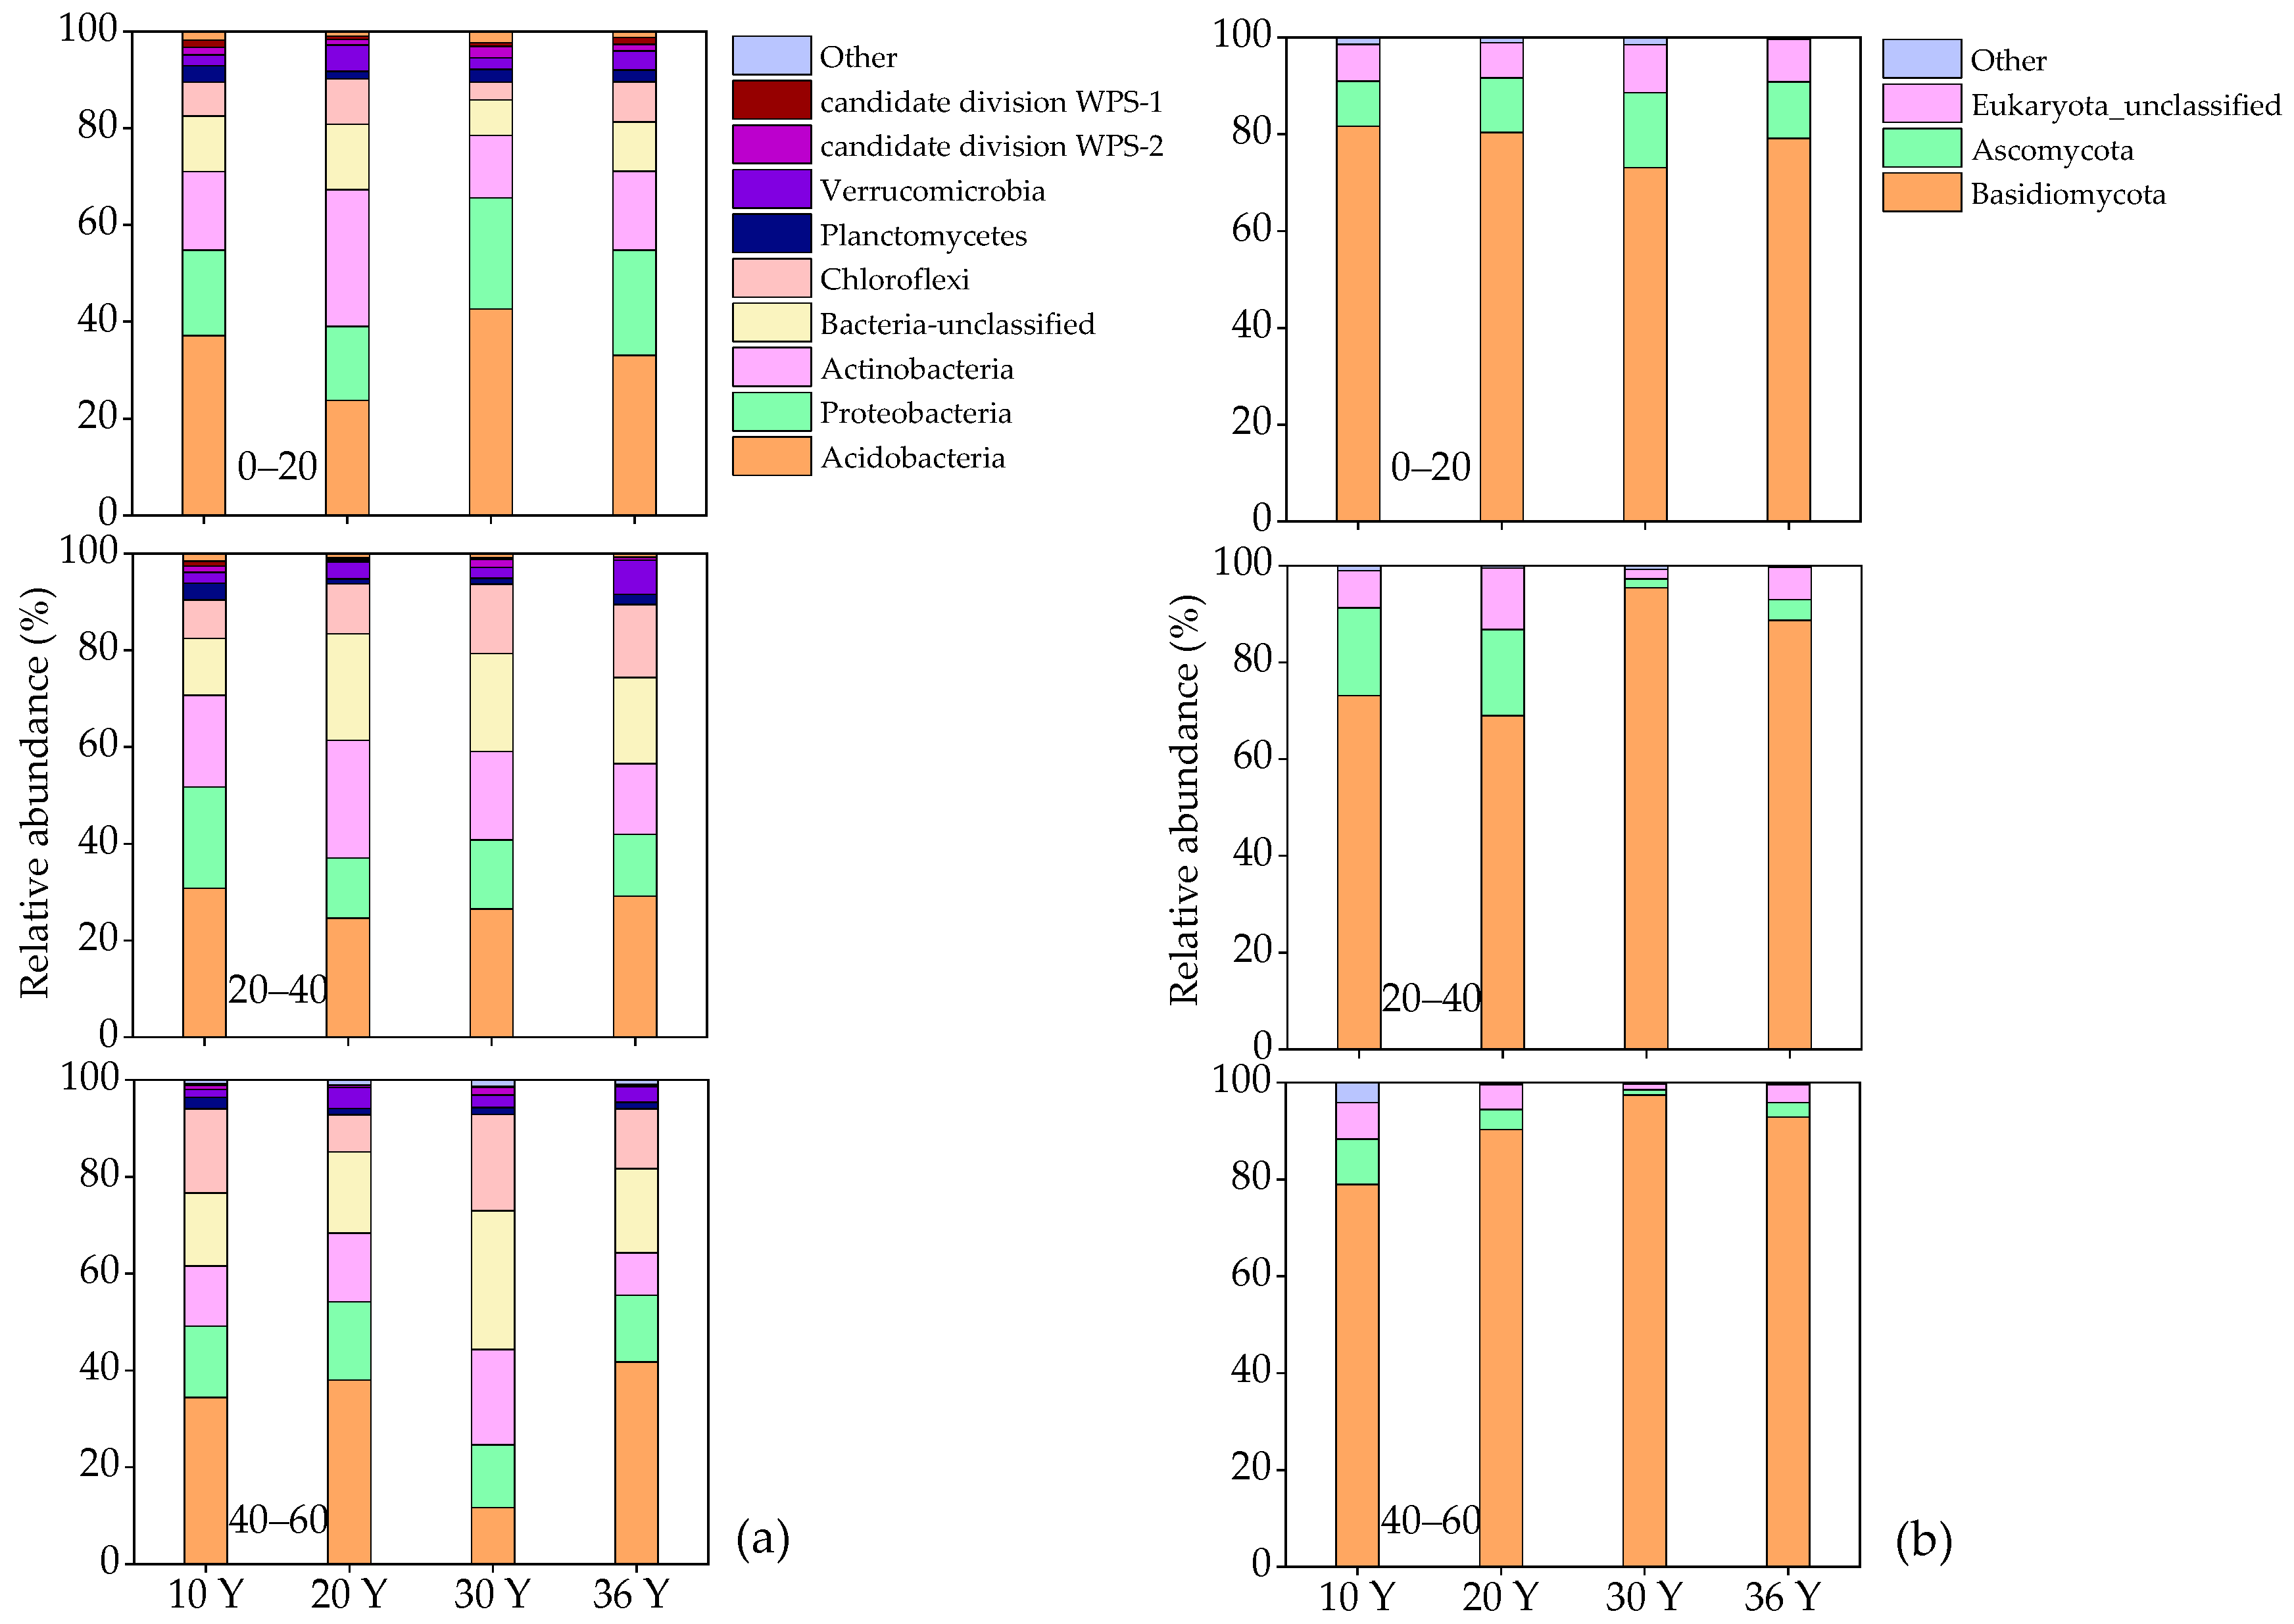
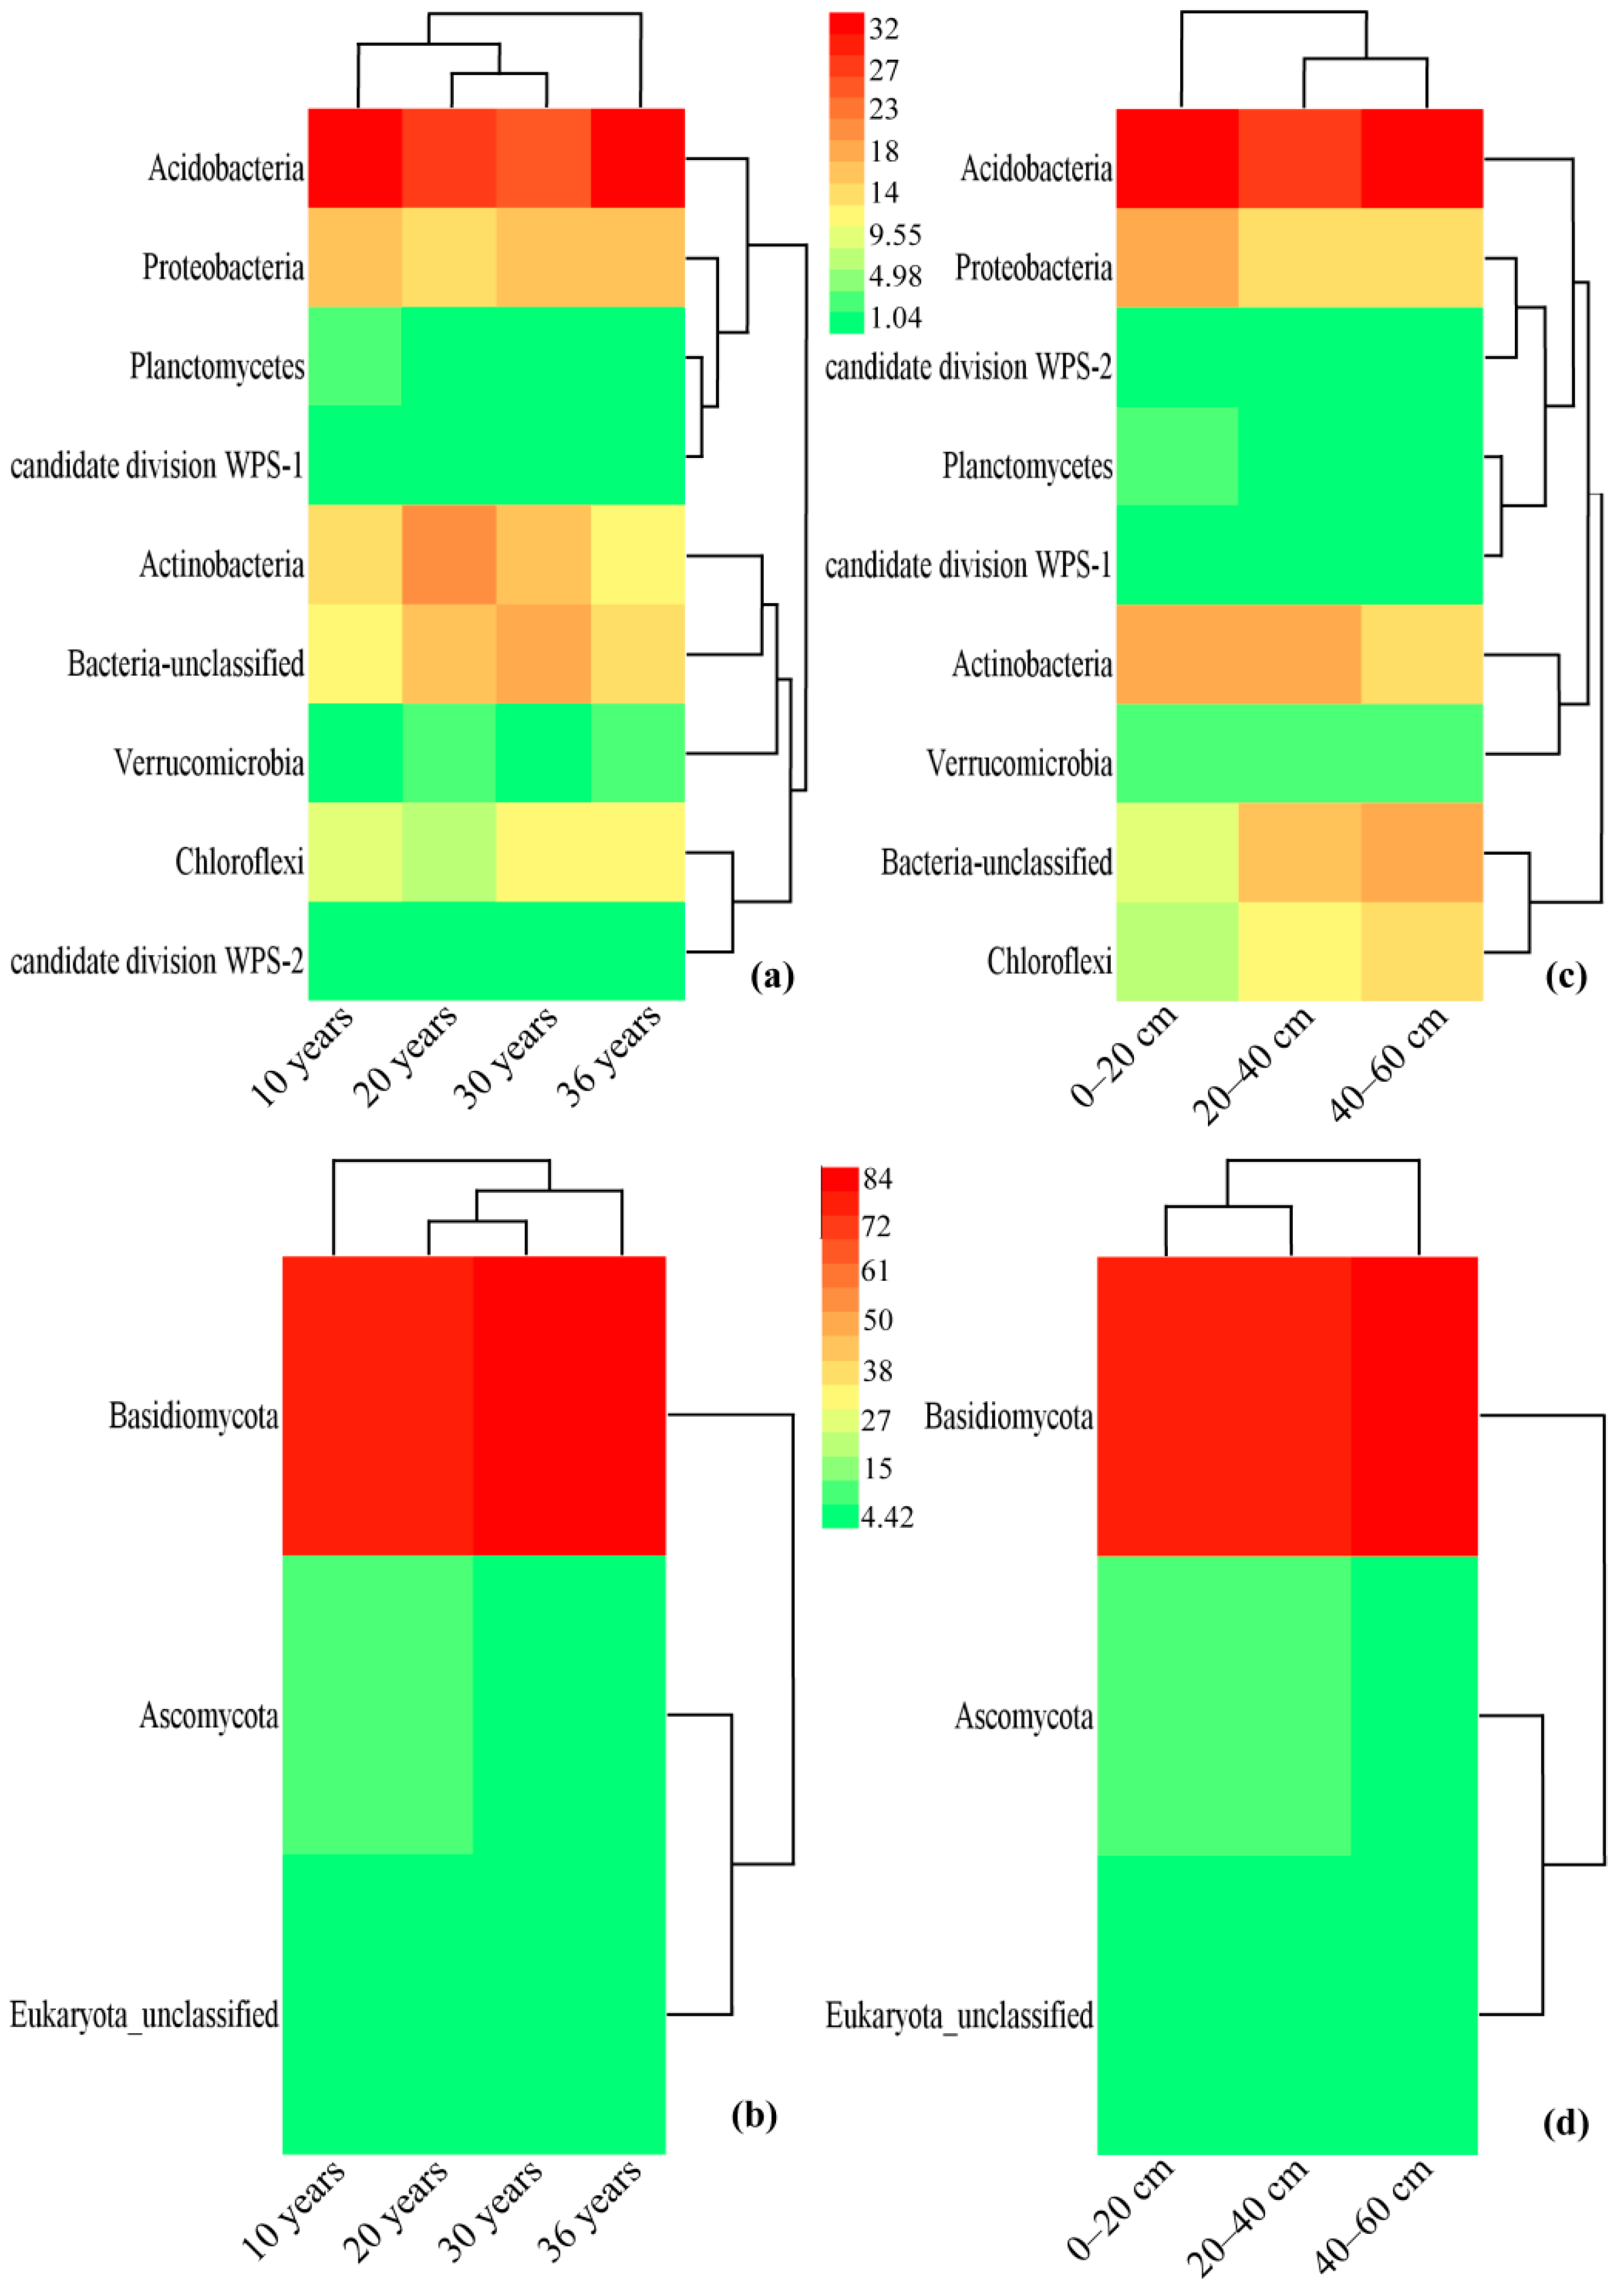
3.4. Community Composition of Bacteria and Fungi

A total of 9 and 3 phyla of bacteria and fungi with a relative abundance of more than 1% were identified (phyla with more than 1% average abundance in at least one sample were considered as predominant) (Figure 6a,b). The average relative abundances of Acidobacteria (31.12%), Proteobacteria (16.33%), Actinobacteria (17.06%), Bacteria-unclassified (16.02%), and Chloroflexi (11.11%) were all higher than 10%, which were dominant in the soil bacterial community. The relative abundances of Planctomycetes, Verrucomicrobia, candidate division WPS-2, and candidate division WPS-1 were all higher than 1% (Figure 6a), and they were also important members of soil bacteria. The trend of different bacterial relative abundance with the increase of stand age and soil depth was different. Acidobacteria and Proteobacteria first decreased and then increased with the increase of stand age, while Actinobacteria and Bacteria-unclassified were the opposite. Acidobacteria showed no obvious rule with the increase of soil depth, Proteobacteria and Actinobacteria decreased, while Bacteria unclassified and Chloroflexi increased (Figure 6a). The average relative abundance of Basidiomycota (83.34%) in the soil fungal community was the highest, followed by Ascomycota (8.96%) and Eukaryota-unclassified (6.71%). The relative abundance of Basidiomycota increased with the increase of stand age and soil depth, but Ascomycota and Eukaryota-unclassified were the opposite (Figure 6b).
The heat map showed that bacterial and fungal communities as 20-year, 30-year, and 36-year stands were clustered together, clearly separated from the 10-year stand. The 20–40 cm and 40–60 cm soil depths were clustered together, clearly separated from 0–20 cm soil depth (Figure 7).

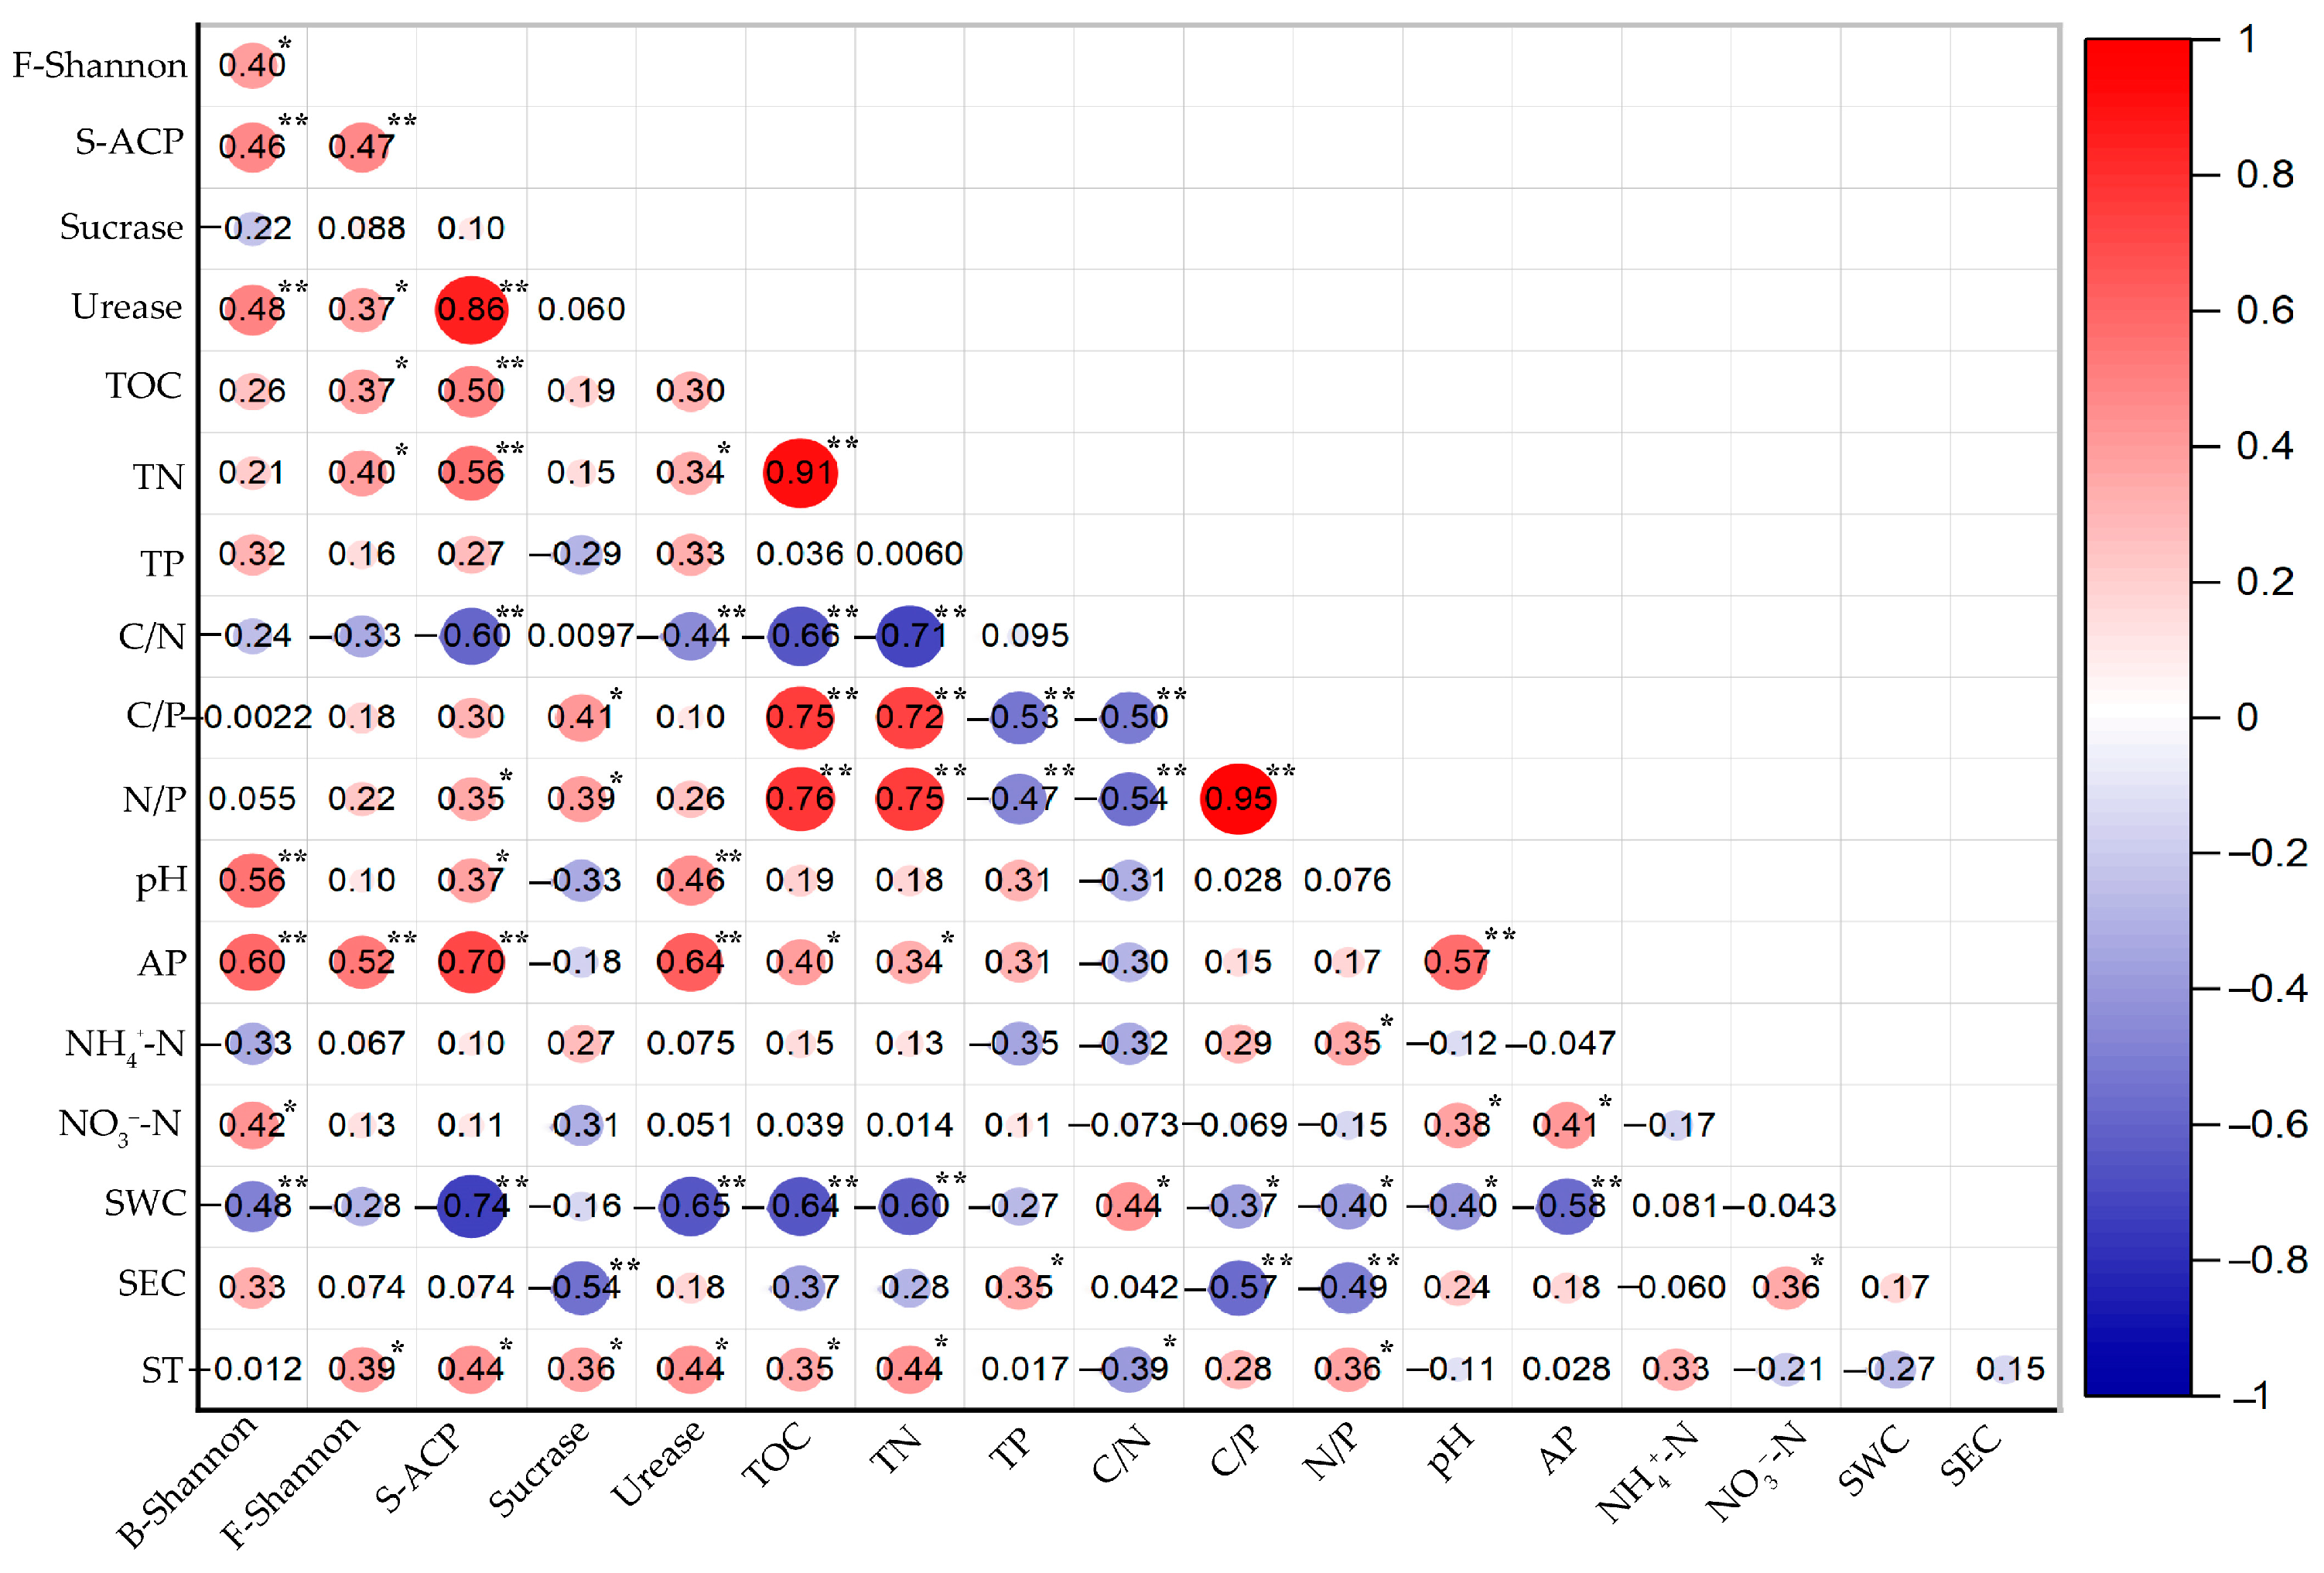
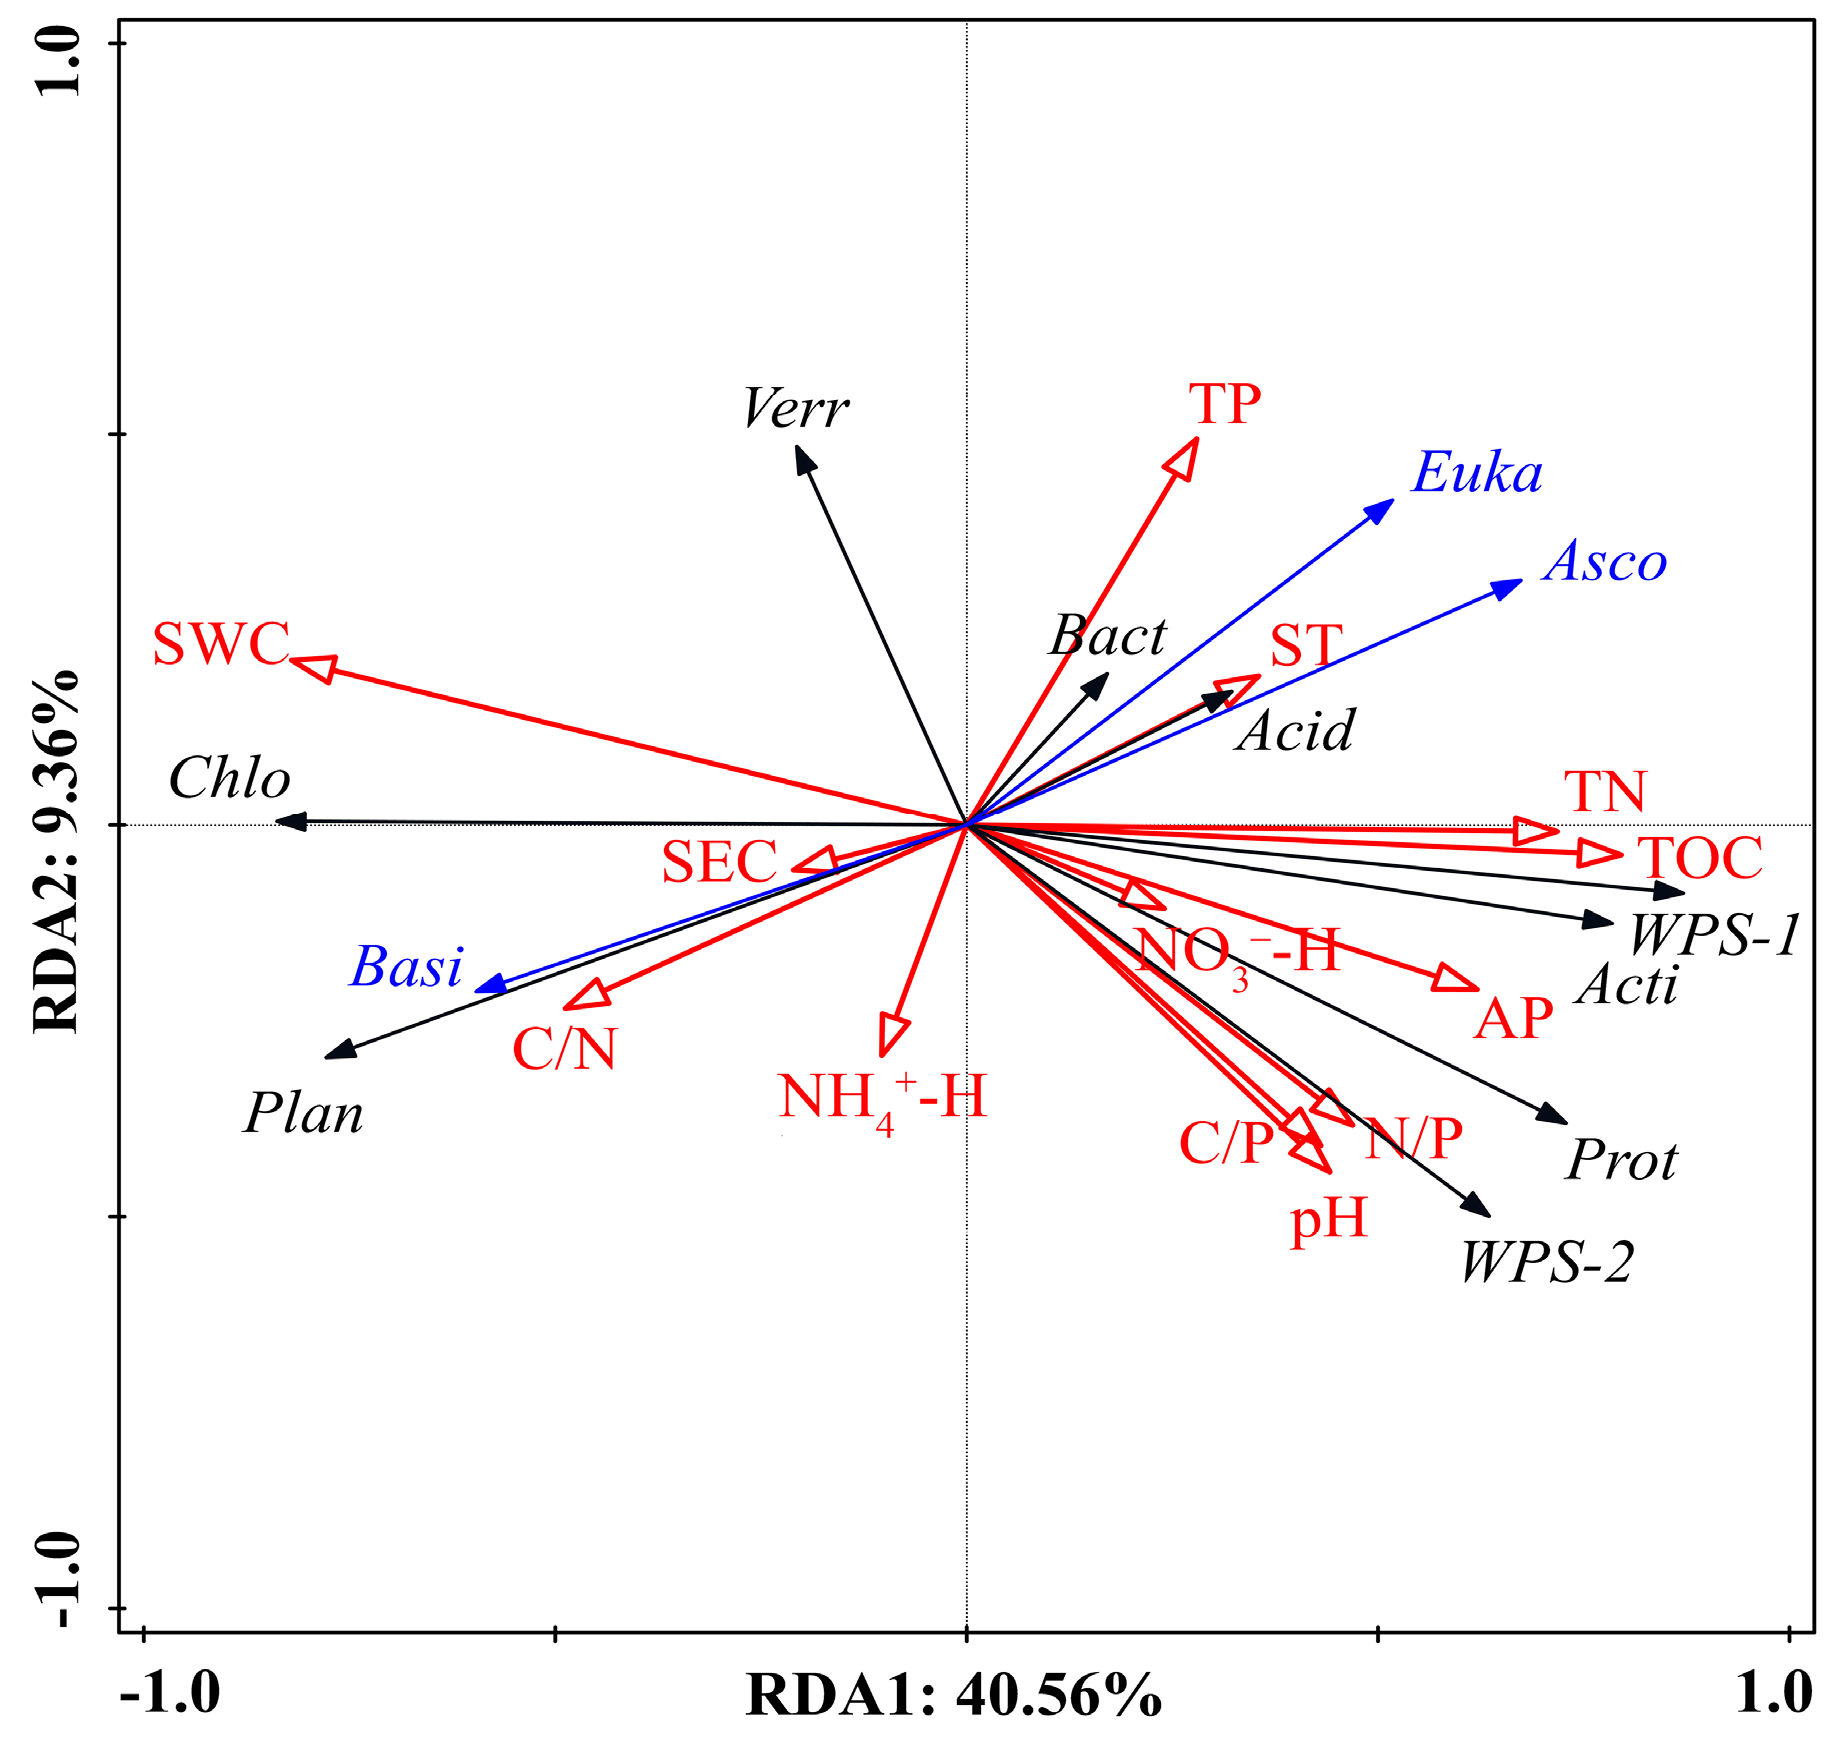
3.5. Relationship between Microbes, Enzyme Activity, and Soil Physicochemical Properties

Pearson correlation analysis showed that soil enzyme activities and the bacterial and fungal Shannon index were significantly correlated with soil physicochemical properties (Figure 8, p < 0.05 or p < 0.01). S-ACP was positively correlated with TOC, TN and N/P ratios, pH, AP, and ST, as well as negatively correlated with C/N ratio and SWC; sucrase was positively correlated with C/P and N/P ratios, ST, and negatively correlated with SC; urease was positively correlated with TN, pH, AP, and ST, and negatively correlated with C/N ratio (Figure 8). Bacterial Shannon index was positively correlated with pH, NO3-N, SC, and negatively correlated with NH4+-N, and SWC. Fungal Shannon index was positively correlated with TOC, TN, AP, and ST. Besides, bacterial and fungal Shannon index were significantly positively correlated with S-ACP and urease (p < 0.01), but not significantly correlated with sucrase (p > 0.05) (Figure 8). In conclusion, S-ACP, urease, bacterial, and fungal Shannon index were significantly positively correlated with AP (p < 0.01), but negatively correlated with SWC.
Redundancy analysis was conducted with the abundance of soil bacteria and fungi as response variables and soil physicochemical properties as explanatory variables (environmental variables). The results showed that the first two axes of the RDA plot explained 40.56% and 9.36% (49.92% in total) of the total microbial variation (Figure 9). A Monte Carlo permutation test showed that the SWC, TOC, AP, and C/P ratio were significantly correlated (p < 0.05) with soil microbial community composition in all environmental variables considered. In particular, the SWC was the first factor that contributed to 28.2% of total variation (Table 3). Figure 9 show that SWC was positively correlated with Planctomycetes, Chloroflexi, Verrucomicrobia, and Basidiomycota, while negatively correlated with Acidobacteria, Actinobacteria, Proteobacteria, Bacteria-unclassified, candidate division WPS-1, candidate division WPS-2, Ascomycota, and Eukaryota-unclassified. Conversely, TOC, AP, and C/P ratio were negatively correlated with Planctomycetes, Chloroflexi, Verrucomicrobia, and Basidiomycota, while positively correlated with Acidobacteria, Bacteria-unclassified, Actinobacteria, Proteobacteria, candidate division WPS-1, candidate division WPS-2, Ascomycota, and Eukaryota-unclassified.

4. Discussion

4.1. Effects of Soil Physicochemical Properties on Microbial Alpha Diversity

The results were in line with our first expectation that soil bacterial and fungal alpha diversity (Shannon index) showed different trends with the increase of the chronosequence of P. massoniana plantations (Figure 5), and the bacterial Shannon index was significantly correlated with soil AP, NO3-N, pH, and SWC (p < 0.05), while fungal Shannon index was significantly correlated with TOC, TN, AP, and ST (p < 0.05) (Figure 8). Previous studies have shown that soil physicochemical properties, root biomass, and chemical composition change constantly with the continuous development of forests, which inevitably leads to changes in the diversity and composition of the soil microbial community [6,21,42]. Our research revealed that the bacterial Shannon index tended to decline with the increasing age of the P. massoniana plantation (Figure 5), and a similar result has been reported in other studies [6,42]. In our study, the decline of bacterial Shannon index could be attributed to the gradual decrease of soil nutrient availability, especially AP and NO3-N during the aging process of the P. massoniana plantation. As N and P were essential nutrients for microbial growth, the change of their effectiveness affected microbial composition and diversity [43]. As we knew, P was a necessary component in the production of the ribosome, ATP, DNA, and RNA to maintain rapid growth [44]. In 0–20 cm and 20–40 cm soil depths, the TP concentration in near-mature and mature forests was significantly lower than that in young and middle forests, while C/P and N/P ratios were just the opposite, which may lead to P limitation and thus inhibit bacterial growth (Figure 2). Moreover, fungi are more likely to thrive at a lower pH, while bacteria occupy the dominant position at a higher pH [45]. Our results showed that soil pH was significantly positively correlated with bacterial Shannon index (Figure 9), indicating that the decrease of pH in the near-mature and the mature forest was also the reason for the decrease of bacterial diversity. Generally, excessive water reduces soil porosity and restricts oxygen input and CO2 emission in the process of aerobic respiration, and thus affects aerobic microbial activities [46]. Hence, SWC increases with the age of the P. massoniana plantation, which may inhibit aerobic bacterial growth and affect its diversity. However, we found that the fungal Shannon index decreased first and then increased with the increase of the P. massoniana plantation age (Figure 5). This result indicates that the soil condition may be more helpful to the growth and reproduction of fungi with the increase of P. massoniana plantation stand age. It is generally believed that the availability and quality of soil C and nutrients regulate microbial biomass and activity, and the C/nutrients ratio can reflect the quality of soil microbial growth environment to some extent [20]. Correlation analysis showed that fungal Shannon index was significantly positively correlated with soil TOC and TN (Figure 8, p < 0.05), which confirmed the above conclusion. In the present study, the increase of TOC and TN in the near-mature and mature forests provided carbon sources and nutrients for fungi and promoted the increase of fungal diversity. On the other hand, the needles of P. massoniana contain refractory components (cellulose, lignin, tannin, etc.) and fungi can decompose the lignocellulosic matrix which other microbes cannot use to obtain more nutrients [47,48]. Thus, the increase of fungal alpha diversity may be related to the increase of litters of P. massoniana. Kubartova et al. [49] studied the fungal diversity of litter decomposition in temperate forests of southern France and found that the decomposition rate and fungal richness of the mixed litter were significantly higher than that of beech and spruce litters in the late stage of decomposition (24 months). This indicates that the mixed litter can provide diverse niches for microbes. Consequently, P. massoniana coniferous broadleaved mixed forest should be more conducive to the microbial decomposition of litters and improve soil fertility.
Different soil depths had significant effects on bacterial and fungal Shannon index (Table 2), and they decreased significantly with the increase of soil depth (Figure 5, p < 0.05), which agreed with our second hypothesis. Du et al. [50] studied variations in bacterial and fungal communities through soil depth profiles in a Betula albosinensis forest and similar results were obtained. The main reason is that the soil organic C, N, and AP decreased significantly with the increase of soil depth (Figure 2 and Figure 3), and the direct carbon sources and nutrients required by soil bacteria and fungi were limited, resulting in the decrease of their diversity. Secondly, SWC increases with the increase of soil depth, which may change soil structure, affect soil respiration, and inhibit aerobic microbial activities, causing their diversity to decrease [46]. In addition, the input of litter and roots on the soil surface can provide more abundant carbon and nitrogen for the surface soil to increase the microbial diversity [14,51]. However, the nutrients of the deep soil depth are derived from the combinations of allocation of root secretions, translocations of mineral nutrients from top surface by leaching, and weathering of minerals [52]. We also found that the soil C/P and N/P ratios significantly decreased with the increase of soil depth, while the C/N ratio significantly increased (Figure 2), indicating that the deep soil microbial diversity may be limited by N and the surface soil (0–20 cm) microbial diversity may be limited by P [29]. With no P fertilizer application, the P source in the 0–20 cm soil is primarily from weathering soil containing P minerals. Even though the P content in soil minerals of the P. massoniana forest in this study area is high, the rate of P released from the weathering process is less than the rate of P demand by both trees and the microbial. In addition, phosphorus can easily be fixed by Al and Fe when soil pH is as low as in our studied sites (<4.8, Figure 3). Thus, more N fertilizer should be applied to the deep soil and more P fertilizers should be applied to the topsoil to promote the absorption of nutrients by plants and maintain microbial diversity.

4.2. Effects of Soil Physicochemical Properties on Microbial Composition

Cluster analysis showed that the bacteria and fungi were clearly separated at 10-year stand from the others, and they were clearly separated at 0–20 cm soil depth from the other soil depths (Figure 7). It indicates that the composition of soil microbial communities varied greatly with the change of stand age and soil depth. Our two hypotheses have been confirmed once again. RDA analysis indicated that SWC, TOC, AP, and C/P ratio were the main factors affecting the microbial community (Figure 9 and Table 3), and different bacterial and fungal taxa had different responses to these soil physicochemical properties, which supported our hypothesis. Specifically, the abundance of Acidobacteria was the highest among all soil depths and stands, followed by Proteobacteria and Actinobacteria (Figure 6a). The same results were found in B. albosinensis forest by Du et al. [50]. However, Acidobacteria were positively correlated with soil TOC, AP, and pH in our results (Figure 9), which were different from most previous studies. Zhang et al. [53] studied the forest soil in Shennongjia and found that Acidobacteria_GP1, Acidobacteria_GP2, and Acidobacteria_GP3 were significantly positively correlated with soil pH, and other subgroups (excluding Acidobacteria_GP7) and were significantly negatively correlated with pH. Fierer et al. [54] found that the relative abundance of Acidobacteria and soil TOC and C/N ratio were significantly positively correlated. The above showed that different subpopulations of Acidobacteria had different adaptability to soil physicochemical properties, and not all Acidobacteria were acidophilic and oligotrophic. Proteobacteria and Actinobacteria decreased with soil deepening and were significantly positively correlated with soil TOC and AP (Figure 7a and Figure 9), which was consistent with the changes in soil bacteria in the B. platyphylla forest [50]. In general, the distribution of Proteobacteria is affected by the content of organic carbon, which is related to the high utilization rate of carbon [54]. More importantly, Proteobacteria preferred the high P, because its rapid growth requires a large number of RNA to meet the rapid cell division [55]. Previous studies showed that Actinobacteria is a key litter decomposer in soil, and part species of this phylum can secrete extracellular enzymes to promote the degradation of lignin, polysaccharides, and phenolics [17,56]. Consequently, Actinobacteria in topsoil can promote nutrient cycling by decomposing litter. SWC was negatively correlated with Acidobacteria, Proteobacteria, and Actinobacteria, and was the main limiting factor (the explanation rate was 28.2%) (Figure 9 and Table 3). As mentioned earlier, SWC mediates microbial activity by affecting soil aeration and nutrient availability, so high SWC may not be beneficial for microbial growth [13,46].
For fungal communities, Basidiomycota was the most abundant in all soil layers and stands, followed by Ascomycota and Eukaryota-unclassified (Figure 6b). We observed that the abundance of Basidiomycota increased as the soil depths increased, and similar results were reported in previous studies [50,57]. In this study, soil nutrients (e.g., TOC, TN, AP) tended to decrease with the deepening of soil, and they were negatively correlated with the abundance of Basidiomycota (Figure 2, Figure 3 and Figure 9). Therefore, the change of Basidiomycota abundance may possibly be attributed to other causes. In most cases, the majority genera of Basidiomycota formed a symbiotic relationship with plant roots, enabling them to obtain carbon sources directly from the roots [57]. Cheng et al. [58] found that the P. massoniana roots of 2–10 mm were mainly distributed in the 20–60 cm depth range. Thus, the Basidiomycota in deep soil (40–60 cm) can form mycorrhiza with P. massoniana roots, providing carbon and nutrients, which makes the abundance of Basidiomycota higher. Usually, Ascomycota is mostly saprophytes, which decompose litter to obtain nutrients, while only a few of them can form mycorrhiza with plant roots, so Ascomycota is mainly distributed in surface soil [59]. Moreover, the soil nutrient content decreased and SWC increased with the deepening of the soil (Figure 2 and Figure 3), which may not be conducive to the survival of Ascomycota, resulting in the decline of its abundance. We also noticed that the abundance of Ascomycota in the topsoil (0–20 cm) increased with the age of P. massoniana plantation (Figure 6b). This may be related to the increase of undergrowth shrubs and herbs in the near mature forest and mature forest stage after thinning, which makes litter easier to decompose. However, the abundance of Ascomycota in 20–40 cm and 40–60 cm soil depths tended to decrease with age (Figure 6b), which could be explained by the increase of nitrogen concentration (especially NH4+-N) in these two soil depths with age, because high nitrogen was harmful to the phylum [6].

4.3. Relationship among Soil Physicochemical Properties, Microbes, and Enzyme Activity

The activities of several enzymes have different trends with the increase of the chronosequence of P. massoniana plantations, but they decreased synchronously with the soil depths, and were significantly correlated with soil physicochemical properties and microbial alpha diversity. These results are in accordance with our hypothesis. Generally, a high S-ACP level is essential for improving soil P availability [6]. Our study observed that the topsoil has higher P and S-ACP, and there was a strong positive correlation between them, which was consistent with the function of S-ACP. Strangely, S-ACP first decreased and then increased with increasing stand age while AP continued to decrease, which indicated that S-ACP was not only related to phosphorus but may also be influenced by other factors. Previous studies demonstrated that TOC and TN could provide sufficient substrates for enzyme synthesis [28], so the lower soil TOC and TN in the middle-aged forest stage and deep soil led to the decrease of enzyme activity. S-ACP and urease were positively correlated with soil TOC and TN, which confirmed the above results. At the same time, the improvement of soil pH and the increase of ST can also create a favorable condition for the enzyme to exist stably in the soil [9]. Correlation analysis showed that S-ACP and urease were significantly negatively correlated with soil C/N ratio and SWC; sucrase was significantly negatively correlated with SEC, which indicated that higher C/N, SWC, and SEC might not be conducive to enzyme activity. In addition, soil enzyme activity was not only related to soil physicochemical properties, but also positively correlated with bacterial and fungal diversity, because most exoenzymes and endoenzymes are mainly from microbes [27,29]. In particular, S-ACP was significantly negatively correlated with C/N ratio, positively correlated with N/P ratio, and positively correlated with bacterial and fungal Shannon index (Figure 8). Consequently, microbes may consume more C and N to secrete enzymes related to phosphorus metabolism under the condition of phosphorus deficiency [9]. In conclusion, fungi may have more competitive advantages than bacteria on TOC and TN in P. massoniana plantations under low phosphorus conditions. Therefore, the recovery of TOC and TN leads to an increase in fungal diversity, thus improving the enzyme activity. In turn, increased fungal diversity and enzyme activity promoted nutrient cycling.

5. Conclusions

Our results showed that the nutrient availability of woodland decreased significantly with the increase of the chronosequence of P. massoniana plantations, especially AP. Meanwhile, soil C/N ratio decreased while C/P and N/P ratios increased, indicating that there was a more serious P limitation in the near-mature forest and mature forest stage. On this basis, coupled with the decrease of pH and NO3-N, these resulted in the decrease of soil bacterial alpha diversity. However, fungi can increase their diversity by consuming more TOC and TN under the condition of P limitation, which leads to the increase of enzyme activity (especially S-ACP). From different soil depths, soil physicochemical properties, microbial diversity, and enzyme activities decreased synchronously, and there was a close correlation between them. We also analyzed the microbial composition at different ages and soil depths and found that bacteria and fungi in the 10-year stand were significantly separated from other stands, and bacteria and fungi in the 0–20 cm soil depth were significantly separated from the other two soil layers. In all stands and soil depths, Acidobacteria was the most abundant bacterial community, followed by Proteobacteria and Actinobacteria; Basidiomycota was the most abundant fungal community, followed by Ascomycota. Furthermore, SWC, TOC, AP, and C/P ratio were the main factors affecting the microbial community; in particular, SWC had the highest contribution rate, and excessive SWC might inhibit the survival of most microbes. In short, these results reflect the potential relationship between soil physicochemical properties, microbial diversity and composition, and enzyme activities, which enhances understanding of soil fertility in different soil depths during the development of P. massoniana plantations and provides a reference for manual intervention.

Supplementary Materials

The following are available online at https://www.mdpi.com/1999-4907/12/3/376/s1, Figure S1: Rarefaction curves of bacteria (a) and fungi (b).

Author Contributions

Q.G. planned and supervised the project, conceived and designed the experiments, reviewed drafts of the paper. J.P. performed the experiments, analyzed the data and led manuscript production. H.L., S.L., Y.Z., S.Y., X.S., and Y.Q. collected and analyzed the data. X.F. analyzed the data and made charts. All authors have read and agreed to the published version of the manuscript.

Funding

This study was financially supported by Guizhou Science and Technology Program ([2018]1040), the Technological Projects of Guizhou Province, China ([2018]5261), Guizhou Science and Technology Support Project ([2019]2314), the Construction Project for Firs-class Ecology Discipline in Guizhou (GNYL [2017] 007), and Guangxi for Innovation-driven Development Special Project (AA17204087-4).

Acknowledgments

We would like to thank Hangzhou Kaitai Biotechnology Co., Ltd. for completing the soil DNA extraction, PCR amplification and Illumina sequencing experiments.

Conflicts of Interest

The authors declare no conflict of interest.

References

  1. Yang, H.; Wang, S.; Zhang, J.; Fan, B.; Zhang, W. Biomass and nutrients of Pinus massoniana plantations in southern China: Simulations for different management practices. J. Food Agric. Environ. 2011, 9, 689–693. [Google Scholar]
  2. SFA (State Forestry Administration P.R. China). National Forest Resources Statistics (2009–2014). NFI 8th; State Forestry Administration P.R: Bejing, China, 2014.
  3. Wen, L.; Lei, P.; Xiang, W.; Yan, W.; Liu, S. Soil microbial biomass carbon and nitrogen in pure and mixed stands of Pinus massoniana and Cinnamomum camphora differing in stand age. For. Ecol. Manag. 2014, 328, 150–158. [Google Scholar] [CrossRef]
  4. Chen, F.; Zheng, H.; Zhang, K.; Ouyang, Z.; Lan, J.; Li, H.; Shi, Q. Changes in soil microbial community structure and metabolic activity following conversion from native Pinus massoniana plantations to exotic Eucalyptus plantations. For. Ecol. Manag. 2013, 291, 65–72. [Google Scholar] [CrossRef]
  5. Wang, W.; Su, D.; Qiu, L.; Wang, H.; An, J.; Zheng, G.; Zu, Y. Concurrent changes in soil inorganic and organic carbon during the development of larch, Larix gmelinii, plantations and their effects on soil physicochemical properties. Environ. Earth Sci. 2013, 69, 1559–1570. [Google Scholar] [CrossRef]
  6. Zhu, L.; Wang, X.; Chen, F.; Li, C.; Wu, L. Effects of the successive planting of Eucalyptus urophylla on soil bacterial and fungal community structure, diversity, microbial biomass, and enzyme activity. Land Degrad Dev. 2019, 1–11. [Google Scholar] [CrossRef]
  7. Koerselman, W.; Meuleman, A.F.M. The vegetation N: P ratio: A new tool to detect the nature of nutrient limitation. J. Appl. Ecol. 1996, 33, 1441–1450. [Google Scholar] [CrossRef]
  8. Mooshammer, M.; Wanek, W.; Zechmeister-Boltenstern, S.; Richter, A. Stoichiometric imbalances between terrestrial decomposer communities and their resources: Mechanisms and implications of microbial adaptations to their resources. Front. Microbiol. 2014, 5, 22. [Google Scholar] [CrossRef] [Green Version]
  9. Zhang, W.; Qiao, W.; Gao, D.; Dai, Y.; Deng, J.; Yang, G.; Han, X.; Ren, G. Relationship between soil nutrient properties and biological activities along a restoration chronosequence of Pinus tabulaeformis plantation forests in the Ziwuling Mountains, China. Catena 2018, 161, 85–95. [Google Scholar] [CrossRef]
  10. Ren, C.; Zhao, F.; Kang, D.; Yang, G.; Han, X.; Tong, X.; Feng, Y.; Ren, G. Linkages of C:N:P stoichiometry and bacterial community in soil following afforestation of former farmland. For. Ecol. Manag. 2016, 376, 59–66. [Google Scholar] [CrossRef]
  11. Fageria, N.K. Soil quality vs. environmentally-based agricultural management practices. Commun. Soil Sci. Plant Anal. 2002, 33, 2301–2329. [Google Scholar] [CrossRef]
  12. Minasny, B.; Hong, S.Y.; Hartemink, A.E. Soil pH increase under paddy in South Korea between 2000 and 2012. Agric. Ecosyst. Environ. 2016, 221, 205–213. [Google Scholar] [CrossRef]
  13. Mayakaduwage, S.; Mosley, L.M.; Marschner, P. Phosphorus pools in acid sulfate soil are influenced by soil water content and form in which P is added. Geoderma 2021, 381, 114692. [Google Scholar] [CrossRef]
  14. Zechmeister-Boltenstern, S.; Keiblinger, K.M.; Mooshammer, M.; Peñuelas, J.; Richter, A.; Sardans, J.; Wanek, W. The application of ecological stoichiometry to plant–microbial–soil organic matter transformations. Ecol. Monogr. 2015, 85, 133–155. [Google Scholar] [CrossRef] [Green Version]
  15. Powlson, D.S.; Jenkinson, D.S. A comparison of the organic matter, biomass, adenosine triphosphate and mineralizable nitrogen contents of ploughed and direct-drilled soils. J. Agric. Sci. 1981, 97, 713–721. [Google Scholar] [CrossRef]
  16. Van, D.H.M.G.; Bardgett, R.D.; Van Straalen, N.M. The unseen majority: Soil microbes as drivers of plant diversity and productivity in terrestrial ecosystems. Ecol. Lett. 2008, 11, 296–310. [Google Scholar]
  17. Zhang, C.; Liu, G.B.; Xue, S.; Wang, G.L. Soil bacterial community dynamics reflect changes in plant community and soil properties during the secondary succession of bandoned farmland in the Loess Plateay. Soil Biol. Biochem. 2016, 97, 40–49. [Google Scholar] [CrossRef]
  18. Tian, J.; He, N.; Hale, L.; Niu, S.; Yu, G.; Liu, Y.; Blagodatskaya, E.; Kuzyakov, Y.; Gao, Q.; Zhou, J. Soil organic matter availability and climate drive latitudinal patterns in bacterial diversity from tropical to cold-temperate forests. Funct. Ecol. 2018, 32, 61–70. [Google Scholar] [CrossRef]
  19. Lauber, C.L.; Ramirez, K.S.; Aanderud, Z.; Lennon, J.; Fierer, N. Temporal variability in soil microbial communities across land-use types. ISME J. 2013, 7, 1641–1650. [Google Scholar] [CrossRef] [PubMed]
  20. Wan, X.; Huang, Z.; He, Z.; Yu, Z.; Wang, M.; Davis, M.R.; Yang, Y. Soil C:N ratio is the major determinant of soil microbial community structure in subtropical coniferous and broadleaf forest plantations. Plant Soil. 2015, 387, 103–116. [Google Scholar] [CrossRef]
  21. Ren, C.; Chen, J.; Deng, J.; Zhao, F.; Han, X.; Yang, G.; Tong, X.; Feng, Y.; Shelton, S.; Ren, G. Response of microbial diversity to C:N:P stoichiometry in fine root and microbial biomass following afforestation. Biol. Fertil. Soils 2017, 53, 457–468. [Google Scholar] [CrossRef]
  22. Fang, F.; Wu, C.Z.; Hong, W.; Fan, H.L.; Song, P. Study on the ralationship between rhizospheric or non-rhizospheric soil enzyme and microbe in different plants. Subtrop. Agric. Reasearch. 2007, 3, 209–215. [Google Scholar]
  23. Adamczyk, B.; Kilpeläinen, P.; Kitunen, V.H.; Smolander, A. Potential activities of enzymes involved in N, C, P and S cycling in boreal forest soil under different tree species. Pedobiologia 2014, 57, 97–102. [Google Scholar] [CrossRef]
  24. Xu, Z.; Yu, G.; Zhang, X.; He, N.; Wang, Q.; Wang, S.; Wang, R.; Zhao, N.; Jia, Y.; Wang, C. Soil enzyme activity and stoichiometry in forest ecosystems along the North-South Transect in eastern China (NSTEC). Soil Biol. Biochem. 2017, 104, 152–163. [Google Scholar] [CrossRef]
  25. Stock, S.C.; Kster, M.; Dippold, M.A.; Nájera, F.; Kuzyakov, Y. Environmental drivers and stoichiometric constraints on enzyme activities in soils from rhizosphere to continental scale. Geoderma 2019, 337, 973–982. [Google Scholar] [CrossRef]
  26. Zhang, C.B.; Jin, Z.X.; Ke, S.X. Study on the relationship among enzymes activities, microorganism, respiration rate and physico-chemical properties of soil under different forests of Tiantai mountain. J. Plant Nutr. Fertil. 2004, 10, 51–56. [Google Scholar]
  27. Burns, R.G.; Deforest, J.L.; Marxsen, J.R.; Sinsabaugh, R.L.; Stromberger, M.E.; Wallenstein, M.D.; Weintraub, M.N.; Zoppini, A. Soil enzymes in a changing environment: Current knowledge and future directions. Soil Biol. Biochem. 2013, 58, 216–234. [Google Scholar] [CrossRef]
  28. Lucas-Borja, M.E.; Hedo, J.; Cerda, A.; Candel-Perez, D.; Vinegla, B. Unravelling the importance of forest age stand and forest structure driving microbiological soil properties, enzymatic activities and soil nutrients content in Mediterranean Spanish black pine(Pinus nigra Ar. ssp. salzmannii) Forest. Sci. Total Environ. 2016, 562, 145–154. [Google Scholar] [CrossRef]
  29. Shen, F.; Wu, J.; Fan, H.; Liu, W.; Guo, X.; Duan, H.; Hu, L.; Lei, X.; Wei, X. Soil N/P and C/P ratio regulate the responses of soil microbial community composition and enzyme activities in a long-term nitrogen loaded Chinese fir forest. Plant Soil. 2019, 436, 91–107. [Google Scholar] [CrossRef]
  30. Li, B.; Ge, T.; Xiao, H.; Zhu, Z.; Li, Y.; Shibistova, O.; Liu, S.; Wu, J.; Inubushi, K.; Guggenberger, G. Phosphorus content as a function of soil aggregate size and paddy cultivation in highly weathered soils. Environ. Sci. Pollut. Res. Int. 2016, 23, 7494–7503. [Google Scholar] [CrossRef]
  31. NFA (National Forestry Administration). Regulations for Age-Class and Age-Group Division of Main Tree-Species; Wang, H.C., Li, G.C., Luan, G.J., Wang, R.N., Wang, H.Z., Bian, F., Shi, J., Zhou, J., Wang, Q., Gao, Z.F., et al., Eds.; National Forestry Administration: Beijing, China, 2017. Available online: http://www.doc88.com/p-5671706807327.html (accessed on 27 October 2017).
  32. Bao, S. Soil and Agricultural Chemistry Analysis; China Agriculture Press: Beijing, China, 2000. [Google Scholar]
  33. Shi, Y.; Shen, Q.R.; Mao, Z.S.; Xu, G.H. Time and Horizontal Spatial Variations of NH4+-N and NO3-N of Rhizospheric Soil with RiceCultivation on Upland Condition Mulched with Half-decomposed Rice Straw. Sci. Agric. Sin. 2002, 5, 520–524. [Google Scholar]
  34. Norman, R.J.; Stucki, J.W. The Determination of Nitrate and Nitrite in Soil Extracts by Ultraviolet Spectrophotometry. Soil Sci. Soc. Am. J. 1981, 45, 347–353. [Google Scholar] [CrossRef]
  35. Pfahler, V.; Bielnicka, A.; Smith, A.C.; Granger, S.J.; Turner, B.L. A rapid ammonium fluoride method to determine the oxygen isotope ratio of available phosphorus in tropical soils. Rapid Commun. Mass Spectrom. 2020, 34, e8647. [Google Scholar] [CrossRef] [Green Version]
  36. Guan, S.Y. Soil Enzyme and Its Research Methods; China Agricultural press: Beijing, China, 1986. [Google Scholar]
  37. Hugerth, L.W.; Wefer, H.A.; Lundin, S.; Jakobsson, H.E.; Lindberg, M.; Rodin, S.; Engstrand, L.; Andersson, A.F. DegePrime, a Program for Degenerate Primer Design for Broad-Taxonomic-Range PCR in Microbial Ecology Studies. Appl. Environ. Microbiol. 2014, 80, 5116–5123. [Google Scholar] [CrossRef] [PubMed] [Green Version]
  38. Smit, E.; Leeflang, P.; Glandorf, B.; Van Elsas, J.D.; Wernars, K. Analyis of fungal diversity in the wheat rhizosphere by sequencing of cloned PCR-amplified genes encoding 18S rRNA and temperature gradient gel electrophoresis. Appl. Environ. Microbiol. 1999, 65, 2614–2621. [Google Scholar] [CrossRef] [Green Version]
  39. Yang, C.; Liu, N.; Zhang, Y. Soil aggregates regulate the impact of soil bacterial and fungal communities on soil respiration. Geoderma 2019, 337, 444–452. [Google Scholar] [CrossRef]
  40. Wang, Q.; Garrity, G.M.; Tiedje, J.M.; Cole, J.R. Naïve Bayesian Classifier for Rapid Assignment of rRNA Sequences into the New Bacterial Taxonomy. Appl. Environ. Microbiol. 2007, 73, 5261–5267. [Google Scholar] [CrossRef] [PubMed] [Green Version]
  41. Quast, C.; Pruesse, E.; Yilmaz, P.; Gerken, J.; Schweer, T.; Yarza, P.; Peplies, J. The SILVA ribosomal RNA gene database project: Improved data processing and web-based tools. Nucleic Acids. Res. 2013, 41, D590–D596. [Google Scholar] [CrossRef] [PubMed]
  42. Wu, Z.; Elizabeth, H.S.; Wenxiong, L.; Bailian, L.; Linkun, W.; Changxun, F.; Zhixing, Z.; Zhen, J. Soil Microbial Community Structure and Metabolic Activity of Pinus elliottii Plantations across Different Stand Ages in a Subtropical Area. PLoS ONE. 2015, 10, e0135354. [Google Scholar] [CrossRef] [PubMed]
  43. Liu, Y.; Zang, H.; Tida, G.; Bai, J.; Guggenberger, G. Intensive fertilization (N, P, K, Ca, and S) decreases organic matter decomposition in paddy soil. Appl. Soil Ecol. 2018, 127, 51–57. [Google Scholar] [CrossRef]
  44. Delgado-Baquerizo, M.; Reich, P.B.; Khachane, A.N.; Campbell, C.D.; Thomas, N.; Freitag, T.E.; Al-Soud, W.A.; Sørensen, S.; Bardgett, R.D.; Singh, B.K. It is elemental: Soil nutrient stoichiometry drives bacterial diversity. Environ. Microbiol. 2017, 19, 1176–1188. [Google Scholar] [CrossRef] [PubMed]
  45. Högberg, M.N.; Högberg, P.; Myrold, D.D. Is microbial community composition in boreal forest soils determined by pH, C-to-N ratio, the trees, or all three? Oecologia 2007, 150, 590–601. [Google Scholar] [CrossRef]
  46. Shi, P.L.; Zhang, X.Z. Some advance in the main factors controlling soil respiration. Adv. Earth Sci. 2005, 20, 778–785. [Google Scholar]
  47. Kjaller, A.; Struwe, S. Microfungi in ecosystems: Fungal occurrence and activity in litter and soil. Oikos 1982, 39, 389–442. [Google Scholar] [CrossRef]
  48. Guo, P.; Jiang, H.; Yu, S.; Ma, Y.; Dou, R.; Song, X. Comparison of Litter Decomposition of Six Species of Coniferous and Broad-leaved Trees in Subtropical China. Chin. J. Appl. Environ. Biol. 2009, 15, 655–659. [Google Scholar]
  49. Kubartová, A.; Ranger, J.; Berthelin, J.; Beguiristain, T. Diversity and Decomposing Ability of Saprophytic Fungi from Temperate Forest Litter. Microb. Ecol. 2009, 58, 98–107. [Google Scholar] [CrossRef]
  50. Du, C.; Geng, Z.; Wang, Q.; Zhang, T.; Wang, Y. Variations in bacterial and fungal communities through soil depth profiles in a Betula albosinensis forest. J. Microbiol. 2017, 55, 684–693. [Google Scholar] [CrossRef]
  51. Izumi, H.; Cairney, J.W.G.; Killham, K.; Moore, E.; Alexander, I.J.; Anderson, I.C. Bacteria associated with ectomycorrhizas of slash pine (Pinus elliotti) in south-eastern Queensland, Australia. FEMS Microbiol. Lett. 2008, 282, 196–204. [Google Scholar] [CrossRef] [PubMed]
  52. Clemmensen, K.E.; Bahr, A.; Ovaskainen, O.; Dahlberg, A.; Ekblad, A.; Wallander, H.; Stenlid, J.; Finlay, R.D.; Wardle, D.A.; Lindahl, B.D. Roots and Associated Fungi Drive Long-Term Carbon Sequestration in Boreal Forest. Science 2013, 339, 1615–1618. [Google Scholar] [CrossRef]
  53. Zhang, Y.; Cong, J.; Lu, H.; Li, G.; Qu, Y.; Su, X.; Zhou, J.; Li, D. Community structure and elevational diversity patterns of soil Acidobacteria. J. Environ. Sci. 2014, 26, 1717–1724. [Google Scholar] [CrossRef]
  54. Fierer, N.; Bradford, M.A.; Jackson, R.B. Toward an ecological classification of soil bacteria. Ecology 2007, 88, 1354–1364. [Google Scholar] [CrossRef] [PubMed]
  55. Elser, J.J. Growth rate–stoichiometry couplings in diverse biota. Ecol. Lett. 2010, 6, 936–943. [Google Scholar] [CrossRef] [Green Version]
  56. Kopecky, J.; Kyselkova, M.; Omelka, M.; Cermak, L.; Novotna, J.; Grundmann, G.L.; Moënne-Loccoz, Y.; Sagova-Mareckova, M. Actinobacterial community dominated by a distinct clade in acidic soil of a waterlogged deciduous forest. FEMS Microbiol. Ecol. 2011, 78, 386–394. [Google Scholar] [CrossRef] [PubMed] [Green Version]
  57. Santalahti, M.; Sun, H.; Jumpponen, A.; Pennanen, T.; Heinonsalo, J. Vertical and seasonal dynamics of fungal communities in boreal Scots pine forest soil. FEMS Microbiol. Ecol. 2016, 92, fiw170. [Google Scholar] [CrossRef] [PubMed] [Green Version]
  58. Cheng, R.M.; Wang, R.L.; Xiao, W.F.; Feng, X.H.; Liu, Z.B.; Ge, X.G.; Wang, X.R.; Zhang, W.Y. Spatial distribution of root biomass of Pinus massoniana plantation in Three Gorges Reservoir area, China. Acta Ecol. Sin. 2012, 32, 823–832. [Google Scholar] [CrossRef] [Green Version]
  59. He, Y.H.; Zhou, G.Y.; Wang, S.J.; Li, H. Fungal diversity in Cunninghamia lanceolata plantation soil. Acta Ecol. Sin. 2014, 34, 2725–2736. [Google Scholar]
Figure 1. Location of the Mengguan Forest Farm in Guizhou of China and the sampling plots.
Forests 12 00376 g001
Figure 2. Soil total organic carbon (TOC), total nitrogen (TN), and total phosphorus (TP) concentrations and their stoichiometry of different stand ages and soil depths. 10 Y: 10-year stand; 20 Y: 20-year stand; 30 Y: 30-year stand; 36 Y: 36-year stand; 0–20 cm: 0–20 cm soil depth; 20–40 cm: 20–40 cm soil depth; 40–60 cm: 40–60 cm soil depth. The values show means ± SE. Different capital and lowercase letters represent differences among different stand ages and soil depths, respectively (p < 0.05).
Forests 12 00376 g002
Figure 3. Soil physicochemical properties of different ages and soil depths. NH4+-N: ammonium nitrogen; NO3-N: nitrate nitrogen; AP: available phosphorus; SWC: soil water content; SEC: soil electrical conductivity; ST: soil temperature. 10 Y: 10-year stand; 20 Y: 20-year stand; 30 Y: 30-year stand; 36 Y: 36-year stand; 0–20 cm: 0–20 cm soil depth; 20–40 cm: 20–40 cm soil depth; 40–60 cm: 40–60 cm soil depth. The values show means ± SE. Different capital and lowercase letters represent differences among different stand ages and soil depths, respectively (p < 0.05).
Forests 12 00376 g003
Figure 4. Soil enzyme activities of different ages and soil depths. S-ACP: soil acid phosphatase. 10 Y: 10-year stand; 20 Y: 20-year stand; 30 Y: 30-year stand; 36 Y: 36-year stand; 0–20 cm: 0–20 cm soil depth; 20–40 cm: 20–40 cm soil depth; 40–60 cm: 40–60 cm soil depth. The values show means ± SE. Different capital and lowercase letters represent differences among different stand ages and soil depths, respectively (p < 0.05).
Forests 12 00376 g004
Figure 5. Alpha diversity of soil bacterial and fungal communities at different stand ages and soil depths. 0–20 cm: 0–20 cm soil depth; 20–40 cm: 20–40 cm soil depth; 40–60 cm: 40–60 cm soil depth. The values show means ± SE. Different capital and lowercase letters represent differences among different stand ages and soil depths, respectively (p < 0.05).
Forests 12 00376 g005
Figure 6. Relative abundance distribution of bacterial and fungal communities at the phylum level at different soil depths and stand ages. Phyla with more than 1% average abundance in at least one sample were considered as predominant. (a,b) show the variation of relative abundance of bacteria and fungi, respectively. Other: the taxa of bacteria or fungi with relative abundance less than 1%; 10 Y: 10-year stand; 20 Y: 20-year stand; 30 Y: 30-year stand; 36 Y: 36-year stand; 0–20 cm: 0–20 cm soil depth; 20–40 cm: 20–40 cm soil depth; 40–60 cm: 40–60 cm soil depth.
Forests 12 00376 g006
Figure 7. Heat map depicting the hierarchy cluster results for the abundance of bacteria and fungi at the phylum level. Phyla with more than 1% average abundance in at least one sample were considered as predominant. (a,b) show the clustering of bacteria and fungi at different ages, respectively. (c,d) show the clustering of bacteria and fungi at different soil depths, respectively. Red indicates high relative abundance and green indicates low relative abundance. 0–20 cm: 0–20 cm soil depth; 20–40 cm: 20–40 cm soil depth; 40–60 cm: 40–60 cm soil depth.
Forests 12 00376 g007
Figure 8. Pearson correlation coefficients between the soil physicochemical properties, the enzyme activities, and the microbial alpha diversity. B–Shannon index: the bacterial Shannon index; F–Shannon index: the fungal Shannon index; NH4+-N: ammonium nitrogen; NO3-N: nitrate nitrogen; AP: available phosphorus. The value shows the correlation coefficient, positive values represent positive correlation and negative values represent negative correlation. * p < 0.05, ** p < 0.01.
Forests 12 00376 g008
Figure 9. Ordination plots of the redundancy analysis (RDA) to determine the relationship between bacterial (black arrow) and fungal (blue arrow) phylum with relative abundance greater than 1% and soil physicochemical properties (red arrow). NH4+-N: ammonium nitrogen; NO3-N: nitrate nitrogen; AP: available phosphorus; SWC: soil water content; SEC: soil electrical conductivity; ST: soil temperature; S-ACP: soil acid phosphatase; Acidobacteria (Acid), Proteobacteria (Prot), Actinobacteria (Acit), Bacteria-unclassified (Bact), Chloroflexi (Chlo), Planctomycetes (Plan), Verrucomicrobia (Verr), candidate division WPS-1 (WPS-1), candidate division WPS-2 (WPS-2), Basidiomycota (Basi), Ascomycota (Asco), Eukaryota-unclassified (Euka).
Forests 12 00376 g009
Table 1. The basic situation of different stand ages in Pinus massoniana plantations.
Parameter List10 Years20 Years30 Years36 Years
Altitude (m)1194117512061214
Slope aspectN/ENWNNEN
Slope (°)5658
Slope positionDownhillDownhillDownhill/Middle slopeMiddle slope
Soil textureSandy loamSandy loamSandy loamSandy loam
Soil parent rockSandy shaleSandy shaleSandy shaleSandy shale
Forest stand canopy density0.90 ± 0.07 a0.85 ± 0.10 ab0.75 ± 0.09 b0.80 ± 0.08 ab
Forest stand density (trees ha−1)4675 ± 256 a2812 ± 135 b1356 ± 103 c1083 ± 94 d
Average DBH (cm)8.53 ± 1.56 d12.66 ± 2.55 c18.46 ± 3.01 b21.26 ± 5.26 a
Average tree height (m)7.43 ± 1.83 d15.64 ± 2.74 c17.94 ± 2.43 b20.87 ± 3.26 a
N, E, and W mean north, east, and west direction, respectively. DBH: the diameter at breast height. The values show means ± SE. Lowercase letters indicate significant difference among different stand ages (p < 0.05).
Table 2. Effects of stand age (A), soil depth (D), and their interactions on soil physicochemical properties, enzyme activities, and the microbial diversity indicated by a two-way repeated measures ANOVA.
VariablesF (p) Value
ADA × D
TOC22.857 (<0.01)158.197 (<0.01)14.171 (<0.01)
TN8.122 (<0.01)68.933 (<0.01)5.745 (<0.01)
TP10.625 (<0.01)4.283 (0.026)1.520 (0.214)
C/N3.916 (0.021)34.720 (<0.01)1.525 (0.213)
C/P81.256 (<0.01)46.031 (<0.01)17.106 (<0.01)
N/P83.850 (<0.01)74.682 (<0.01)18.641 (<0.01)
pH5.162 (<0.01)2.950 (0.072)2.548 (0.047)
AP481.016 (<0.01)223.540 (<0.01)154.060 (<0.01)
NH4+-N7.864 (<0.01)0.333 (0.720)0.148 (0.988)
NO3-N3.852 (0.022)0.220 (0.804)2.237 (0.074)
SWC18.574 (<0.01)138.262 (<0.01)12.449 (<0.01)
SEC38.255 (<0.01)2.493 (0.104)28.426 (<0.01)
ST7.196 (<0.01)12.471 (<0.01)0.843 (0.550)
S-ACP14.595 (<0.01)111.858 (<0.01)7.782 (<0.01)
Sucrase5.564 (<0.01)1.523 (0.238)4.751 (<0.01)
Urease18.137 (<0.01)116.335 (<0.01)22.932 (<0.01)
B-OTU5.960 (<0.01)0.661 (0.526)1.667 (0.173)
B-Shannon27.456 (<0.01)11.752 (<0.01)1.448 (0.238)
F-OTU5.745 (<0.01)7.696 (<0.01)3.575 (0.011)
F-Shannon28.070 (<0.01)9.711 (<0.01)8.495 (<0.01)
NH4+-N: ammonium nitrogen; NO3-N: nitrate nitrogen; AP: available phosphorus; SWC: soil water content; SEC: soil electrical conductivity; ST: soil temperature; S-ACP: soil acid phosphatase; B-OTU: the bacterial operational taxonomic unit (OTU); B-Shannon: the bacterial Shannon index; F-OTU: the fungal OTU; F-Shannon: the fungal Shannon index. Bold fonts indicate significant (p < 0.05) or extreme significance (p < 0.01).
Table 3. Conditional effects of soil properties on soil microbial community composition obtained from the summary of forward selection in the redundancy analysis (RDA).
VariablesExplains (%)F-Valuep-Value
SWC28.213.40.002 **
TOC73.60.012 *
AP6.23.40.016 *
C/P5.73.40.014 *
ST3.11.90.082
SEC31.80.11
TN21.20.288
NH4+-N1.91.20.338
C/N1.71.10.378
pH1.81.10.344
TP1.20.80.518
NO3-N0.70.50.798
N/P0.70.40.834
Explains(%): the explanation rate of single variable to total variable in soil. NH4+-N: ammonium nitrogen; NO3-N: nitrate nitrogen; AP: available phosphorus; AK: available potassium. * p < 0.05, ** p < 0.01.
Publisher’s Note: MDPI stays neutral with regard to jurisdictional claims in published maps and institutional affiliations.

