Article

Planning to Practice: Impacts of Large-Scale and Rapid Urban Afforestation on Greenspace Patterns in the Beijing Plain Area

1
Research Institute of Forestry, Chinese Academy of Forestry, Beijing 100091, China
2
Key Laboratory of Tree Breeding and Cultivation and Urban Forest Research Centre, National Forestry and Grassland Administration, Beijing 100091, China
3
Department of Forest Resources, Collaborative for Advanced Landscape Planning (CALP), University of British Columbia, Vancouver, BC V6T 1Z4, Canada
*
Author to whom correspondence should be addressed.
Forests 2021, 12(3), 316; https://doi.org/10.3390/f12030316
Submission received: 30 January 2021 / Revised: 25 February 2021 / Accepted: 5 March 2021 / Published: 8 March 2021
(This article belongs to the Special Issue Urban Forestry and Ecological Restoration)

Abstract

:
(1) Research Highlights: Afforestation is one of the most effective urban greening practices for mitigating a variety of environmental issues. Globally, municipal governments have launched large-scale afforestation programs in metropolitan areas during the last decades. However, the spatiotemporal dynamics of urban greenspace patterns are seldom studied during such afforestation programs. (2) Background and Objectives: In this study, the Beijing Plain Afforestation Project (BPAP), which planted 70,711 ha of trees in only four years, was examined by integrating spatial and landscape analysis. To evaluate the real-world outcomes of this massive program, we investigated the spatial-temporal dynamics of landscape patterns during the implementation process to identify potential impacts and challenges for future management of new afforestation. (3) Materials and Methods: We analyzed the transition of various patch types and sizes, applied landscape indicators to measure the temporal changes in urban greenspace patterns, and used the landscape expansion index to quantify the rate and extent of greenspace spatial expansion. (4) Results: Our results illustrated that the implementation of afforestation in the Beijing plain area had generally achieved its initial goal of increasing the proportion of land devoted to forest (increased 8.43%) and parks (increased 0.23%). Afforestation also accelerated the conversion of small-size greenspaces to large-size patches. However, the significant discrepancies found between planned and actual afforestation sites, as well as the large conversion of cropland to forest, may present major challenges for project optimization and future management. (5) Conclusions: This study demonstrated that spatial analysis is a useful and potentially replicable method that can rapidly provide new data to support further afforestation ecosystem assessments and provide spatial insights into the optimization of large inner-city afforestation projects.

1. Introduction

Urban greenspace, i.e., area of trees, shrubs, grasses, or other vegetated area [1], has been investigated for its contribution to biodiversity conservation and human livability in high urban intensity areas [2,3,4]. Urban forests and trees are important for relieving summer heat waves, soil contamination, as well as air and water pollution [5,6,7], and provide recreation space for city residents and food and habitats for animals (e.g., birds, butterflies and bees) [8,9,10]. Thus, the loss of urban trees, forest, and vegetation can impact urban ecosystems and human well-being [11,12].
Urbanization and the subsequent population expansion and land use/cover changes have resulted in rapid forest clearing or deforestation both regionally and globally [13,14,15,16]. In the past three decades, deforestation has greatly threatened urban biodiversity [17,18,19], ecosystem services [20,21] and the health of humans and wildlife [22], also having negative impacts on the urban soil [23], urban water cycle [24] and atmosphere [25], leading to effects such as soil erosion, flooding, and urban heat islands [26,27]. Under the pressure of such environmental issues, fighting deforestation has become a crucial task for municipal governments. Thus, greening and renaturing urban areas have been implemented across the world [28,29].
Afforestation is one of the major practices for city ecological restoring and regreening [30,31], converting non-vegetated areas to forest land through planting trees [32,33], playing an important role in mitigating environmental degradation [13,34] e.g., increasing urban greenspace and improving soil fertility [35], increasing the habitat for urban animals, and regulating urban climates [32]. Globally, over 40 countries have invested at least 15% of their government revenue to national forest conservation, afforestation, reforestation, and plantation [36]. Owing to these efforts, a regional increase in vegetation indices such as the Normalized Difference Vegetation Index and the Enhanced Vegetation Index has been widely reported in recent years [20,37,38,39,40].
As one of the most rapidly urbanizing countries worldwide [41], China has seen an average of 9.71% gross domestic product growth every year since 1989 [42], and accommodates 19% of the global population [43], while facing serious environmental issues such as air and water pollution and land degradation. Within this context, the government has made great efforts to implement multiple environmental programs to control rising ecological problems. Since 1979, China has launched several afforestation programs, such as the Nature Forest Conservation Program, the sloping land conversion program [44], the “Three North” Shelterbelts Program, and Beijing-Tianjin Shelterbelt Program, planting over four million hectares of trees per year [45]. These afforestation programs enhance the proportion of vegetation and are beneficial for ecosystems, e.g., reducing greenhouse gas emission and cooling the local surface temperatures [43,46,47,48]. However, although landscape configuration and composition are closely related to biodiversity, habitats, and livability [49], few studies have focused on the real-world effects of afforestation on landscape patterns (e.g., patch-corridors-matrix).
The type, size, and connectivity of greenspace patches have direct impacts on the foraging, migration, and breeding of birds, bees and many other animal communities [10,50,51]. The size and spatial characteristics of greenspaces are also related to ecosystem services such as cooling effects, food supplies, and human recreation [52,53]. For example, greenspaces with large area and compact spatial distribution can enhance their cooling benefits [54,55], and increasing greenspace patch size can increase the species richness of birds and bees [56,57].
Given the importance of greenspace patterns for landscape benefits and ecosystem services, various landscape ecological methods, principles, and models have been applied to aspects of urban afforestation, greenspace design, and planning [58], e.g., the pattern-process principle, metapopulation theory, and network-based approaches [59]. Nevertheless, it is usually not clear if these plans or guidelines have been well executed during implementation (e.g., identifying whether trees were planted as planned), as most related studies focus on the long-term trends of landscape patterns [32,35,60], and planners or decision-makers have not used landscape ecological analysis to track where and how their planning schemes have been implemented in the short-term [61,62]. In addition, unlike the assessment of ecosystem services such as heat island mitigation, carbon sequestration, and water purification, which need a relatively long time to emerge if provided by newly planted forests, changes in landscape patterns often rapidly reflect the outcomes of such greening projects. Therefore, it could be advantageous to identify and monitor the landscape pattern dynamics before, during and soon after specific afforestation programs, which would allow decision makers and planners to reorient or optimize these large and costly ongoing projects.
Several indices have been developed to measure the heterogeneity characteristics of landscape patterns at multiple scales, such as aggregation, diversity, size, edge, and shape metrics, which have been widely used in large-scale landscape pattern studies [63,64]. In addition, some new landscape indicators (e.g., surface metrics) have been created to quantify landscape connectivity, patch expansion, and ecological process [65,66,67], providing a promising method for quantitative research and spatial analysis of afforestation pattern changes. However, most landscape metrics show interactions and can be difficult to interpret [68]. Therefore, it is important to select or integrate suitable metrics for specific research on landscape pattern changes.
As the capital of China, Beijing has implemented considerable tree planting and forest management practices since the 1940s [47,69]. However, the city is still experiencing conflicts between urban greenspace expansion and urban sprawl in recent years. In the last two decades, the plain area in Beijing has experienced rapid urbanization and faced serious environmental degradation such as deforestation of urban forest [70], air pollution [71], and heavily exploited groundwater [72]. The greenspace system in the plain area has three major problems: (1) the percentage of forest cover in the plain area is 36% less than that in mountainous areas (Figure 1); (2) small and fragmented forest patches are dominant in the plain area; and (3) community greenspace is failing to meet the demands of residents, e.g., some residents have to drive 40−50 km if they want to visit a forest park [29,70]. To mitigate these environmental pressures and improve urban sustainability and resilience, the municipal government in Beijing has launched various afforestation programs since 2000 (e.g., two greenbelt programs during 1993 and 2010). Among them, the Beijing Plain Area Afforestation Project (BPAP) has been considered as the most ambitious greening program in the high-density urbanized area. With the aim to “create huge forest patches, develop urban forest park clusters, and optimize the large-scale forest patterns” [73], BPAP has proposed green strategies with “greenbelts”, “green wedges”, “green rings”, and “green corridors” around the old city center (Figure 1). The BPAP planned to plant 66,674 ha of new forests by converting vacant lots, croplands, sand excavation pits, and wastelands to forests, parks, and wetlands from 2012 to 2015 [74]. Considering the ecological criteria such as being native, drought-tolerant and longevity, a total of 37 tree species (e.g., Pinus tabuliformis Carr., Sophora japonica Linn., Populus spp., Salix spp., Ginkgo biloba L., Fraxinus chinesis Roxb., etc.) were officially recommended for the plain afforestation. During the implementation of BPAP, the proportion of native tree species reached 91.97% [75]. By the end of 2015, BPAP increased plain forest coverage to 25%, and 54 million trees (the survival rate has exceeded 95%) had been planted in the plain area [76]. Therefore, BPAP provides a valuable field site to study the cycle of city afforestation from planning to practice and identify how the landscape heterogeneity changes during the implementation progress.
This research aims to integrate multiple landscape metrics and spatial analysis to quantify the continuous changes of landscape patterns during BPAP implementation, and to assess whether BPAP optimized urban forest patterns in the Beijing plain area as originally intended. For example, does this project plant the new trees in the planned area; whether the afforestation sites are selected as designed and what are the potential impacts of landscape changes on urban ecosystems. Thus, our study can be considered as a first step toward the further assessment of ecosystem services and other costs or benefits. The objectives of our study were to (1) examine and visualize the spatial-temporal dynamics (including landscape transitions and expansion) of landscape patterns changed by BPAP, to (2) identify the positive or negative effect of this large-scale inner-city afforestation, and to (3) clarify potential challenges of future management for new afforestation. Taking the Beijing plain region as our study area, we used GIS-based change detection technology to demonstrate the transition and interactions of various landscape mosaics, and applied seven common landscape metrics as well as landscape expansion index (LEI) to investigate the characteristics and changes of landscape composition, configuration, and expansion during BPAP implementation [77]. Such results may expand the understanding of city afforestation from planning to practice, and provide specific spatial insights for the optimization and future full assessment of ecosystem services in such urban greening projects.

2. Material and Methods
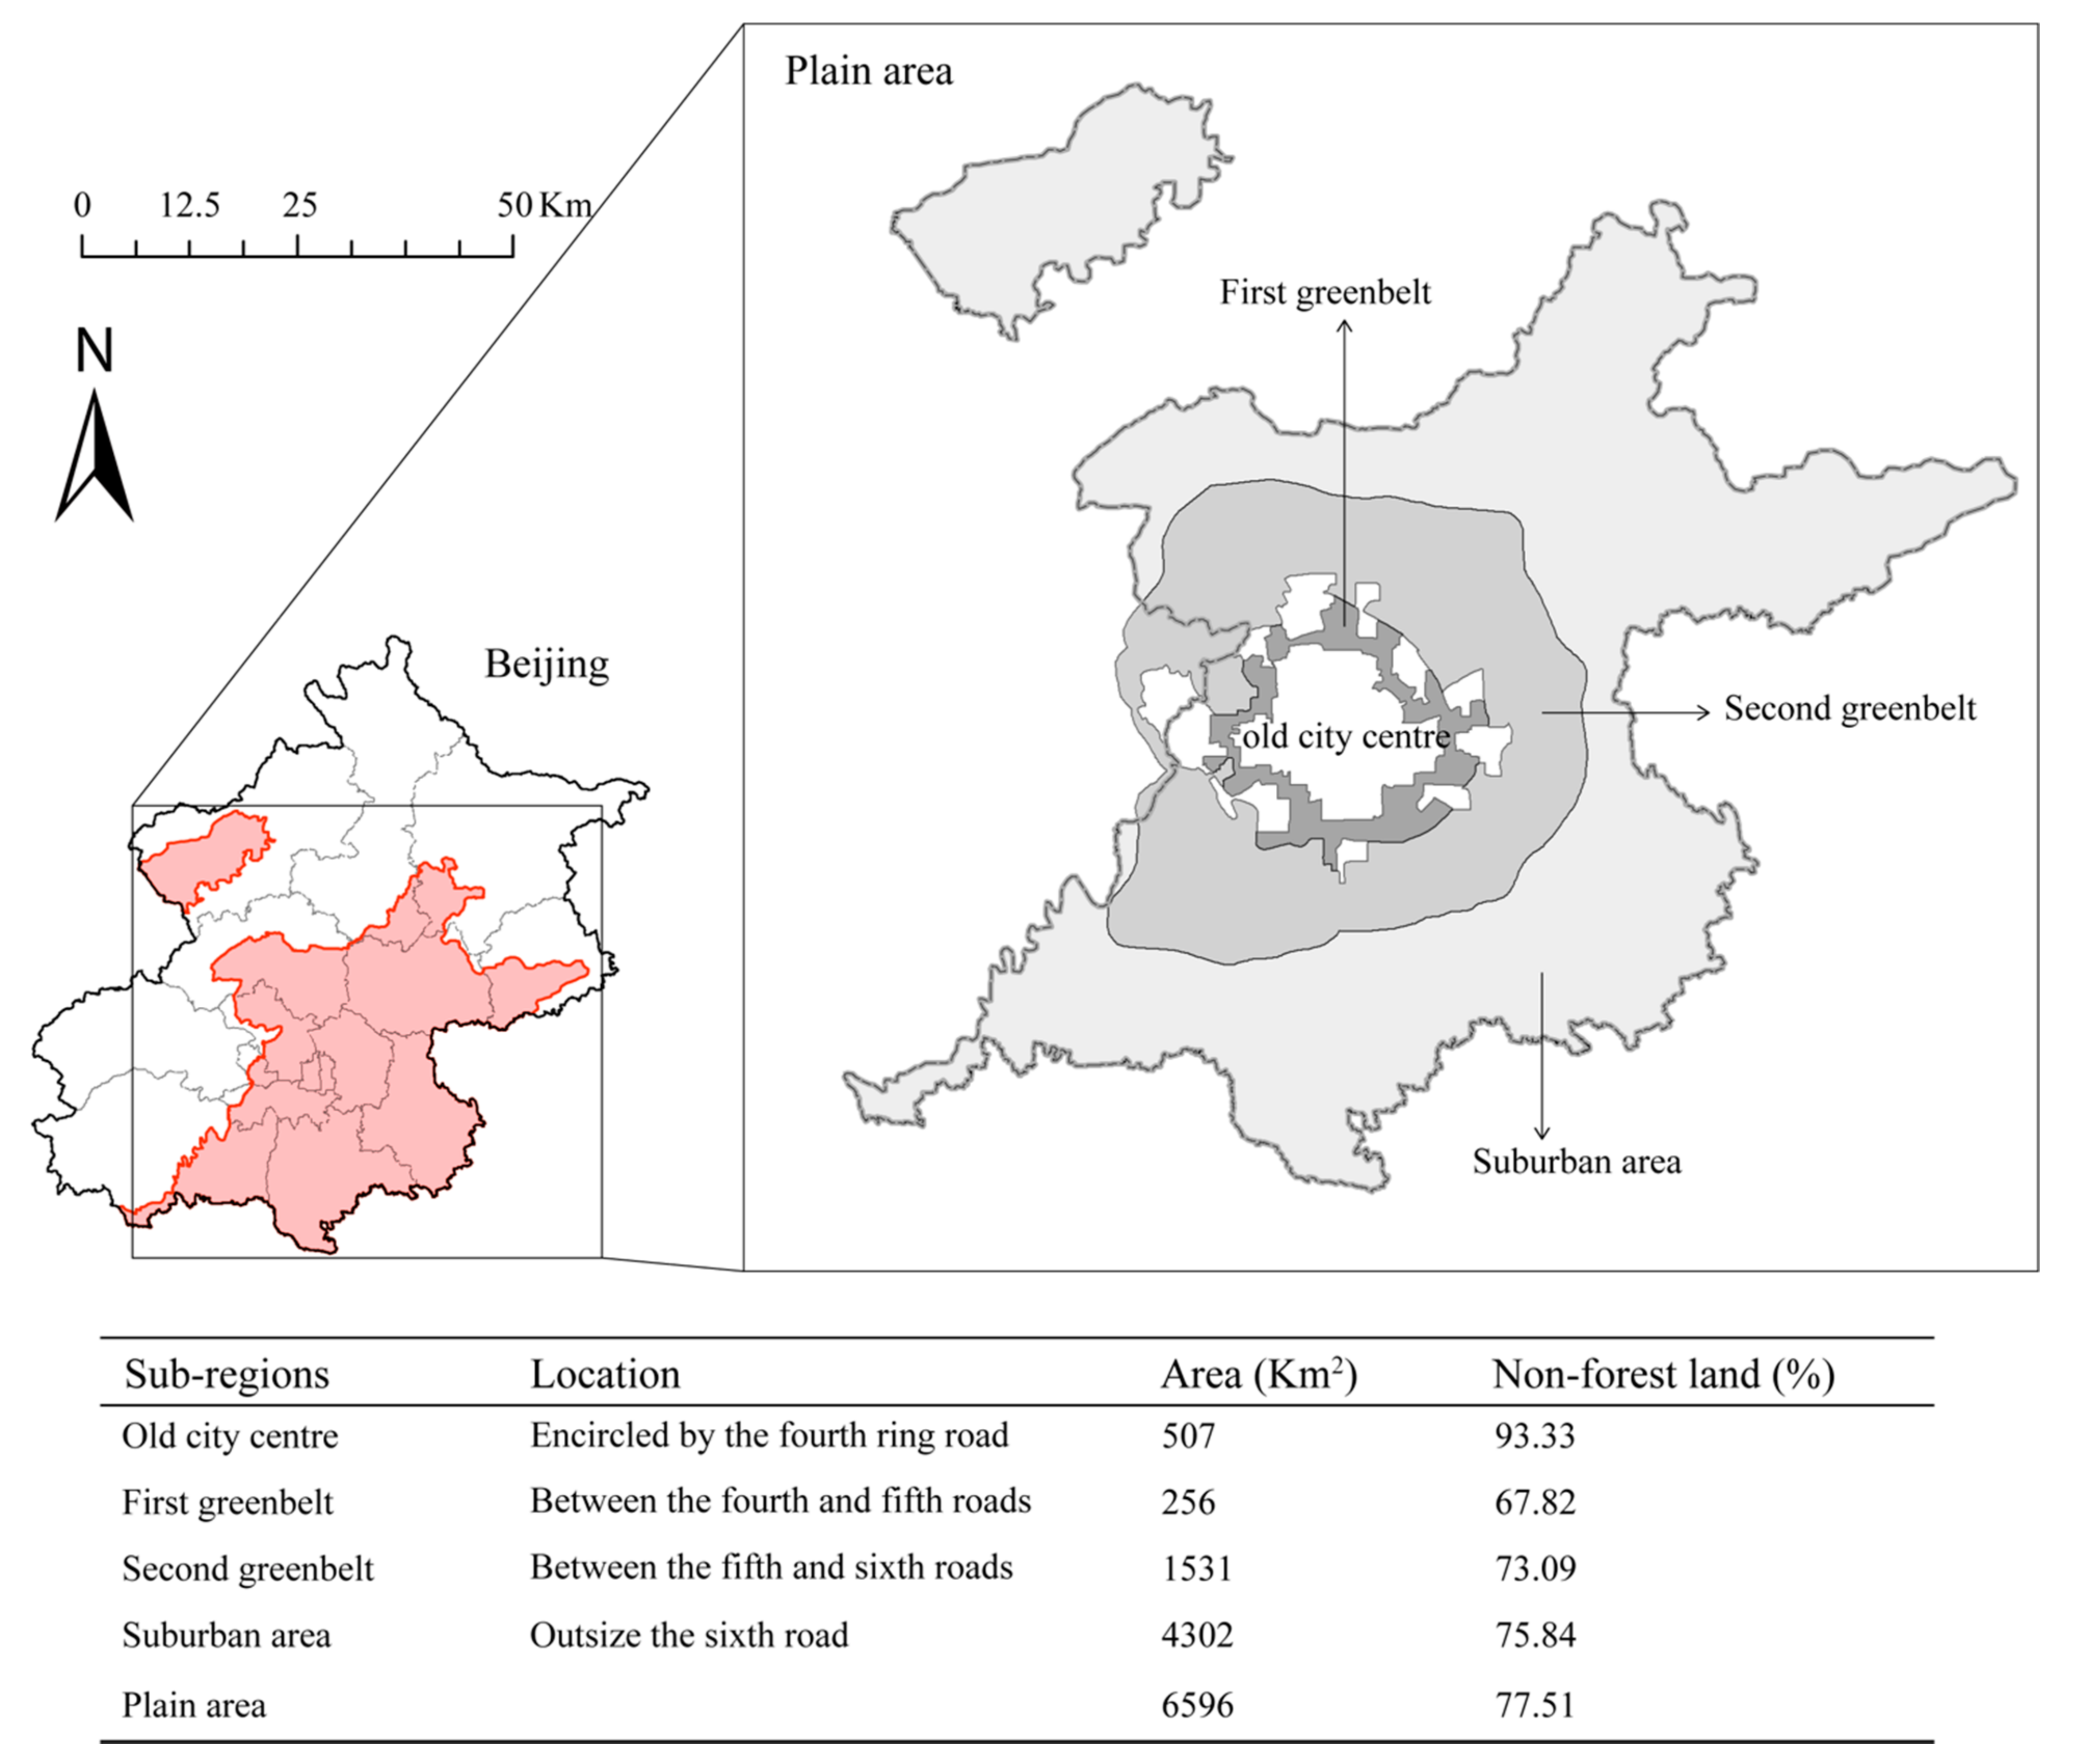
2.1. Study Area

Beijing is located in the north of China and has a metropolitan area of 16,400 km2, consisting of 16 districts. With a size of 6596 km2, Beijing’s plain area encompasses the entire city central and the most recently expanded urban areas (Figure 2), housing over 70% (nearly 16 million people) of Beijing’s population [78]. In this study, we used the division methods for Beijing described in Pan’s research [79], which divides Beijing’s plain area into the old city center, the first greenbelt, the second greenbelt, and the suburban area (Figure 2). Beijing shows a concentric zone model of urban growth, with the Forbidden City being the center and the urban built-up areas expanding outward concentrically. The urban area has been broken down into six concentric circles called the “six ring roads” [80]. According to the 2004–2020 Beijing Master Plan, the region inside the sixth ring road is classified as an urban district, and the area encircled by the fifth ring road is regarded as the central city [81]. To control urban expansion, the local government implemented two greenbelt programs in 2000. The first greenbelt is the area encircled by the fourth and fifth ring roads, and the second greenbelt is encircled by the fifth and sixth ring roads [82]. The old city center is the region encircled by the fourth ring road, with higher population density than that of other sub-regions [83].

2.2. Spatial Data Collection and Preprocessing

We collected Beijing’s geographic data (including administrative boundary, elevation, and sub-region borders), Beijing Forestry Inventory database (BFI, 2009), Beijing Urban Park Inventory database (BUPI, 2009), wetlands census data (2010), and the BPAP geodatabase (2012–2015) from Beijing Gardening and Greening Bureau and Beijing Forestry Survey and Design Institute [85,86]. The BPAP database is created based on a series of high-resolution remote sensing images through visual interpretation and annual field inventory validation with an average accuracy of 90%. The landscape is spatially complex and is viewed as an assemblage of various patch types [87]. In this study, categorical data from BFI, BUPI, wetlands, and BPAP databases [88] were combined to reclassify eight patch types (Table 1) using ArcMap 10.5 [89].

2.3. Landscape Transition Detection

To identify and describe the conversion of landscape types and their patch size, a landscape transition matrix was used to measure the amounts of different patch types and their size changes in corresponding period (i.e., 2009−2012, 2012−2013, 2013−2014, 2014−2015) [92]. To detect the growth of greenspace patch size, we divided the patch size into six levels: (1) very small, (2) small, (3) medium, (4) large, (5) very large, and (6) huge (<10, 10–30, 30–50, 50–100, 100–200, >200 ha, respectively) before creating the patch-size transition matrices [53,93]. As the total number of greenspace patches varied among periods, and thus the total landscape areas (i.e., the number of pixels in the maps) were different, we detected the transitions in the proportion of land area for each patch-size class instead. Finally, a Sankey diagram was used to visualize the four-period transition matrices of landscape types and greenspace patch size from 2009 to 2015 [94]. Sankey diagrams were created using the networkD3 package in RStudio 3.6.1 [95].

2.4. Spatial Pattern Analysis

To examine the changes in landscape patterns after BPAP, we calculated seven class-level and one landscape-level metrics using Fragstats version 4.2 [96]. Percentage of land-scape (PLAND) and number of patches (NP) were chosen to measure landscape composition, as they can quantify the amount and dispersion of the corresponding patch mosaics [97,98]. The increased PLAND and NP values indicate the area of corresponding patch type rises in the landscape. If the total landscape area and class area are constant, a higher NP value indicates a higher fragmentation. Mean patch size (MPS), contagion index (CONTAG), and area-weighted mean shape index (AWMSI) were used to characterize the fragmentation and shape complexity of landscape patterns [77,96]. The increased MPS value indicates the spatial distribution of corresponding patch types become less fragmentation. An increased CONTAG value indicates all patch types become more aggregated in the landscape. A higher AWMSI value indicates the shape of corresponding patch types turn more irregular. To further understand how afforestation changed the spatial patterns from the city center to the suburbs, we applied five landscape metrics in the entire plain area and in three sub-regions. Dot plot was created to visualize the changes of landscape metrics by using the ggplot2 package in RStudio 3.6.1 [99]. All the selected landscape metrics were listed in Table 2.

2.5. Greenspace Expansion Analysis

Landscape expansion, as one of the ecological processes, have great effects landscape patterns [49]. To link the landscape patterns with process, we analyzed the patterns of greenspace expansion during the afforestation implementation. Three landscape expansion models (i.e., infilling, edge expansion, and outlying; Figure 3) were used to discern the patterns of greenspace growth. We then calculated Landscape Expansion Index (LEI) using the LEI tool created by Liu to quantify the expansion modes [67,87]. In addition, considering the greenspace accessibility, species movement distances, and cooling efficiency of urban heat mitigation, we chose buffer with 240 m around the pre-existing greenspace when calculating LEI [49,100,101,102]. As the afforestation program started in 2012 and ended in 2015, we calculated and mapped LEI of greenspace in four periods (i.e., 2009–2012, 2012–2013, 2013–2014, and 2014–2015). We further calculated the percentage of the three landscape expansion types in each period. The greenspace expansion analysis was conducted in ArcMap 10.5 [89].
L a n d s c a p e   e x p a n s i o n   i n d e x   L E I =   A r e a b A r e a b + A r e a v
where Areab was the intersection area between the buffer and corresponding patch type, and Areav was the intersection area between the buffer and vacant area. LEI ranged from 0 to 1.

3. Results

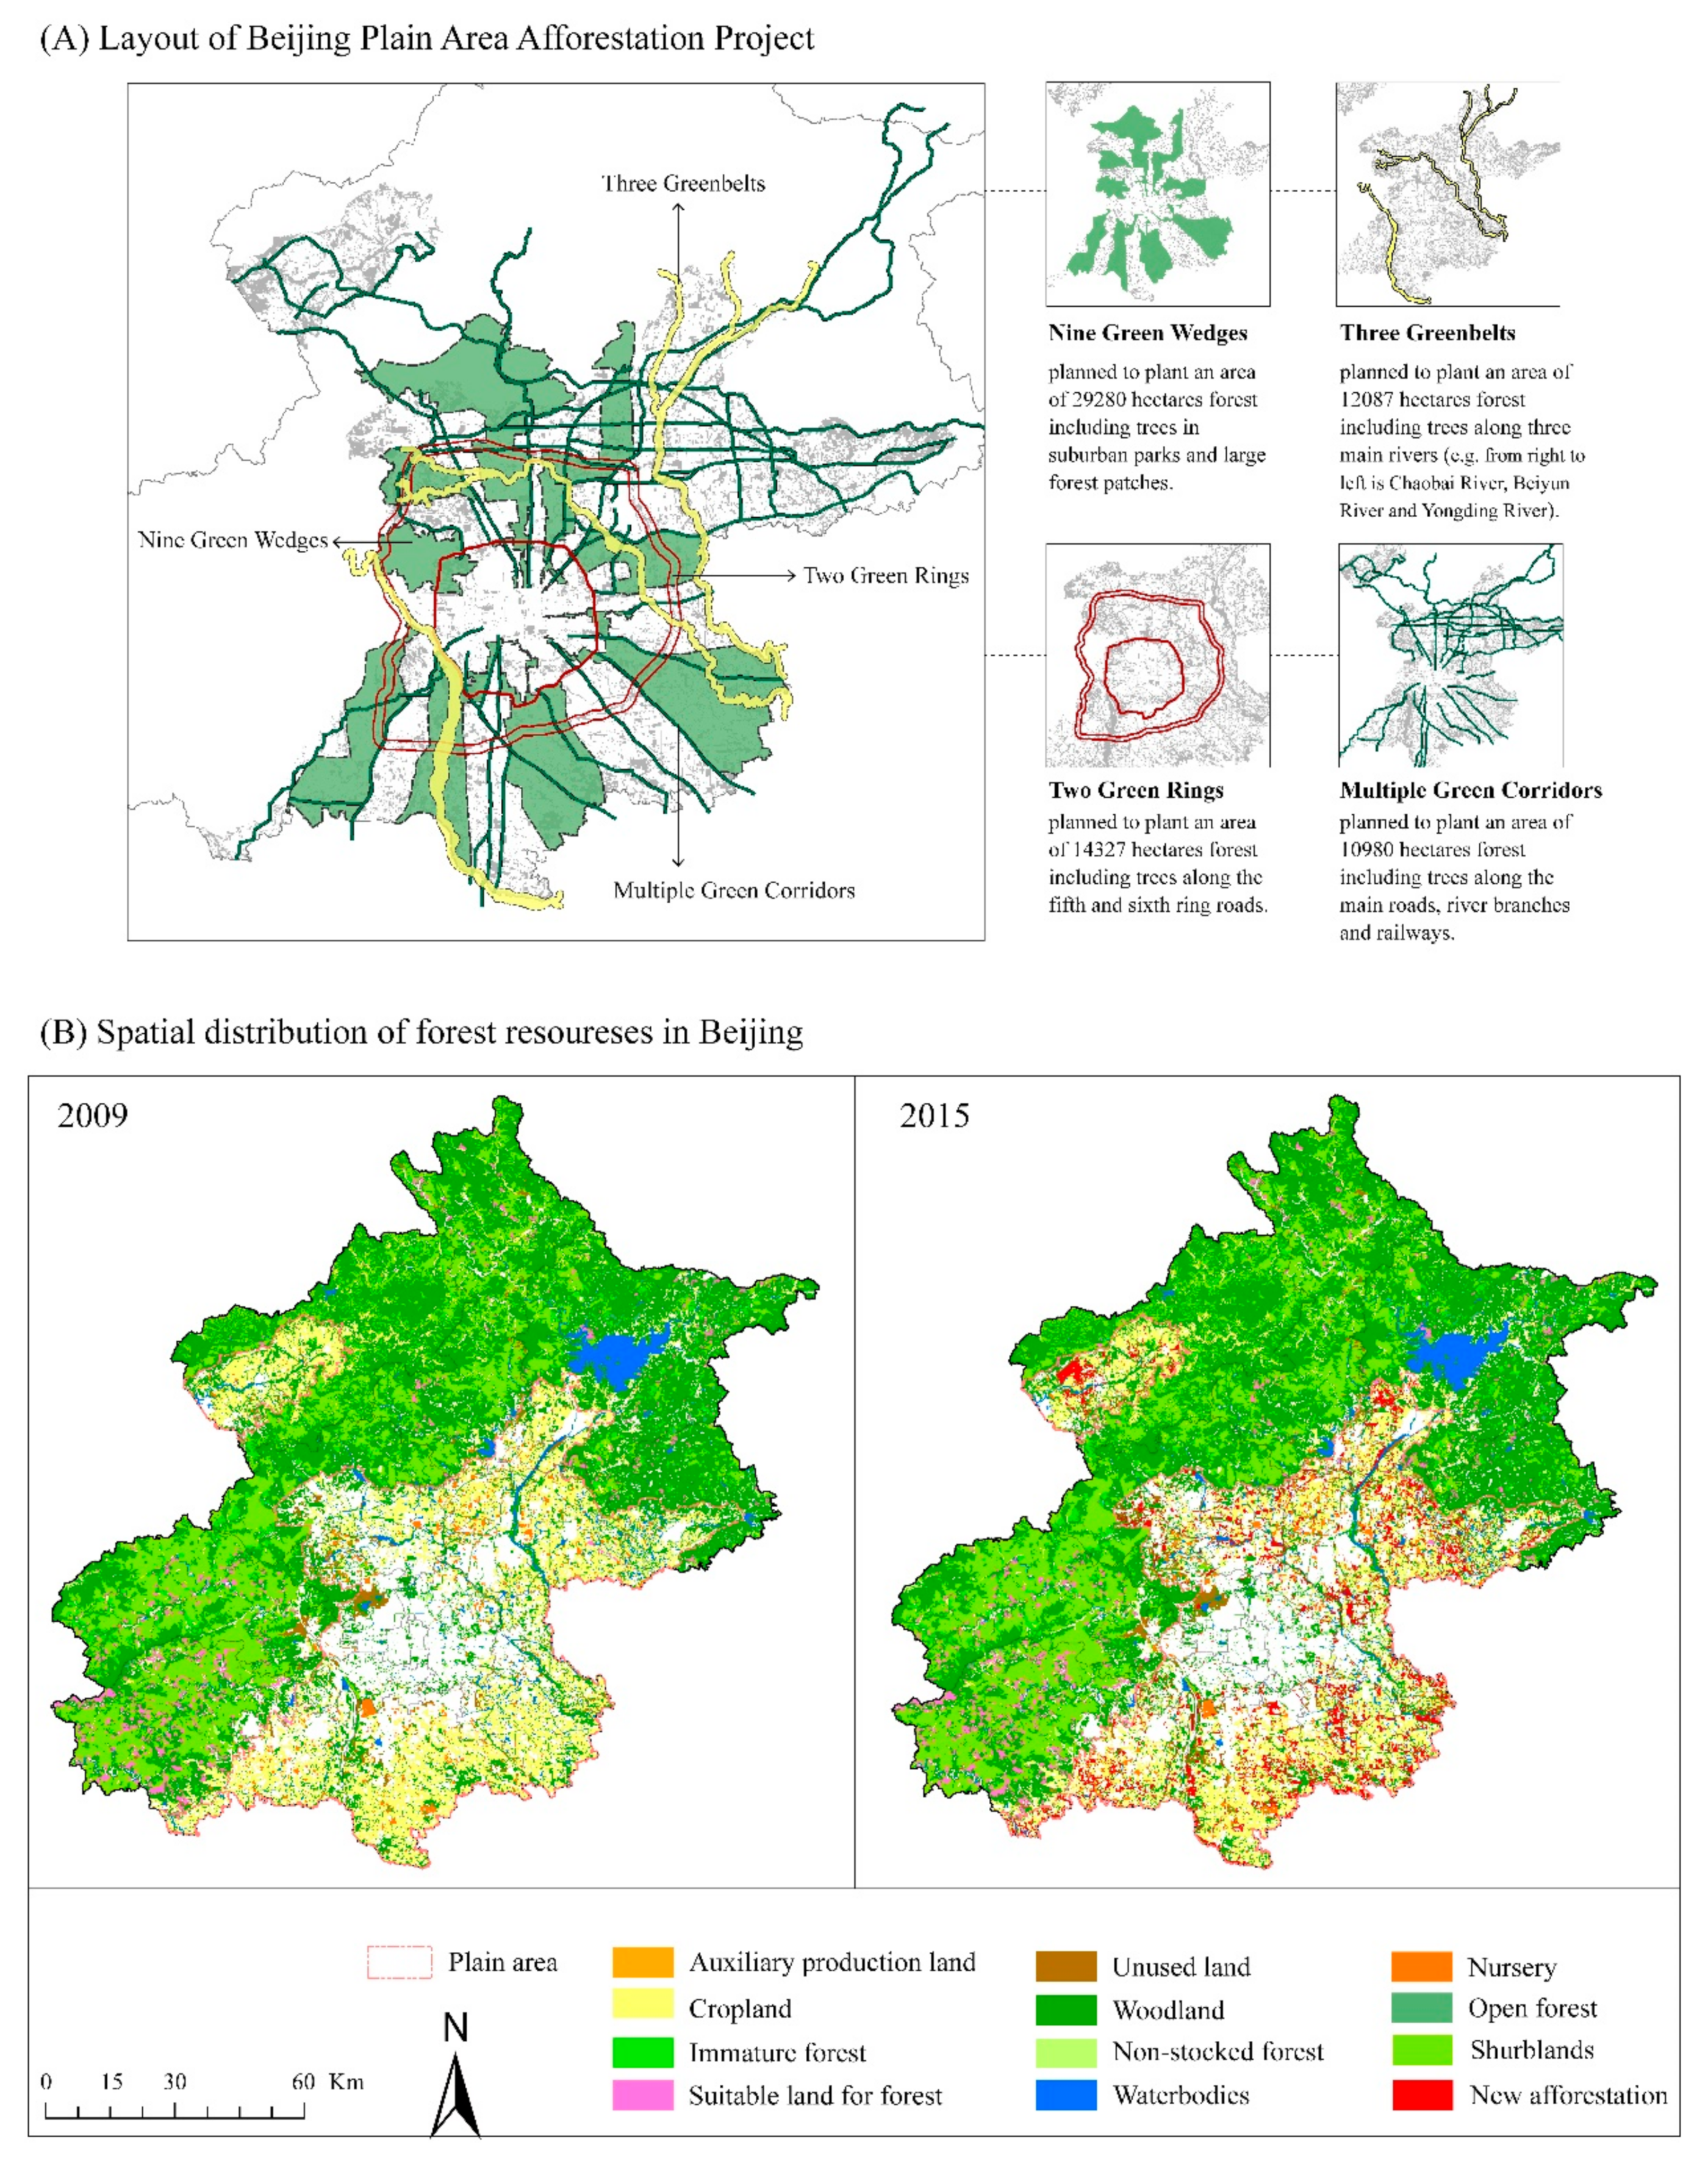
3.1. Afforestation Increased the Overall Forest in Plain Area, Exceeding the Original Goal

A GIS-based comparison of the newly grown greenspace and planned afforestation area showed that, after afforestation, the total newly grown greenspace fulfilled the planned goal, exceeding it by 4037 ha of trees (Table 3). Regarding the four green strategies, only “Nine green wedges” and “Multiple green corridors” achieved the initial planned goals and exceeded them by 861 and 3081 ha, respectively. In addition, areas that were not included in the four “green strategies” gained 17,266 ha of new greenspace. Overall, BPAP accomplished and even exceeded the target of total planned area although the greenbelts and green rings were not completed.

3.2. Afforestation Accelerated Substantial Cropland Conversion to Forest and Growth of Greenspace Size

The stacked bars in the Sankey diagram (Figure 4) represented the relative proportion of patch mosaics, showing that other lands (including urban built-up areas and other impervious surfaces) followed by cropland were the dominant patch type in the plain area, with an area decreased by 1.13% and 6.77% from 2009 to 2015, respectively. Forest was the third most dominant patch mosaic, and its area increased by 8.43% after afforestation, with the largest annual increase in urban forest area occurring between 2012 and 2014. Specifically, the transition rates of forest area reached 14.94% and 12.73% in the period of 2012−2013 and 2013−2014, respectively (Appendix A, Table A1). After BPAP implementation, parks showed a minimal increase (0.23%), while wetlands decreased (0.36%). The area of waterbodies and vacant lots slightly decreased from 2009 to 2015 (0.08% and 0.02%, respectively).
The flow lines in the Sankey diagram (Figure 4) showed the transition from cropland having the greatest contribution to the increased urban forests (19.93% of cropland converted to urban forest after BPAP implementation). This, together with small contributions from other patch types (other lands, vacant lots, waterbodies, and unused land), resulted in an urban forest expansion from approximately half the cropland area in 2009 to an area roughly equal to that of cropland (the proportion of forest and cropland in 2015 are 24.55% and 25.21%, respectively) in only seven years (Figure 4).
Considering all urban greenspace patches, the total area of forest, parks, wetlands, and vacant lots together grew from 25.4% to 34.68% of the total plain area (Figure 4). Throughout the seven years, the flow lines in the Sankey diagram (Figure 4) also showed the transitions among greenspace types. For example, some forests were converted to parks and wetlands, while parks, vacant lots, and wetlands were transformed into forests (e.g., 564.68 ha forests converted to parks and 88 ha vacant lots changed to forests; Table A1). Generally, both forests and parks continuously increased, while wetlands showed a slight decreasing trend throughout the afforestation process.
In addition to overall land proportions, the transition in patch sizes partly owing to afforestation needs to be understood. The stacked bars in the Sankey diagram (Figure 5) illustrated the relative proportion of greenspace land areas for each patch-size category. Generally, the proportion of the land area of very-small (patch size <10 ha), small (10−30 ha), and medium (30−50 ha) patch classes showed declining trends in four periods during BPAP implementation, which is contrary to the results for large (50−100 ha) and huge (> 200 ha) patch classes. The huge patch class area was predominant in all five years and showed an increasing trend during the afforestation process, comprising 33.51% of total greenspace landscape area in 2009, and increasing to 38.05% in 2015. However, the very-small patch class, as the second dominant category, presented a distinct decreasing trend from 2009 to 2015 (decreased by 3.55%). Despite the overall increasing trend, the proportion of very-large (100–200 ha) patches slightly decreased from 2013 to 2014 (0.08%).
The flow lines in the Sankey diagram showed that smaller greenspace patches have been converted to larger sizes in the process of afforestation (Figure 5). Specifically, the transition of very-large patches had the greatest impact on the expansion of huge patch sizes through afforestation, while most large patches were expanded to very-large patches (the land area proportion change for each patch size class can be found in Table A2).

3.3. Afforestation Enhanced Forest Aggregation

The changes in forest, cropland, and other land were more distinct than those of other patch types (Figure 6). To further understand the changes in landscape patterns after afforestation, we first focused on the urban greenspace categories, i.e., forest, parks, wetlands, and vacant lots. Regarding landscape composition, i.e., percentage of landscape (PLAND), forests showed the largest change after afforestation (Figure 6). Regarding the changes in sub-regions (first greenbelt, second greenbelt, and suburban area in Figure 6b–d, respectively), forest showed an increasing growth outward from the first greenbelt. The first greenbelt showed the largest decline in parks, while the second greenbelt showed the highest wetland decline and park growth. Specifically, forest PLAND increase in the suburban area (10.22%) was larger than those in the first and second greenbelt (increase by 2.4% and 6.22%, respectively), indicating that most new forests were located in the outskirts; urban parks PLAND had the highest increase in the second greenbelt (0.95%), while it showed a decrease of 0.37% in the first greenbelt.
Despite the increased fragmentation of the entire plain landscape, i.e., contagion (CONTAG) decreased, greenspace (e.g., forest, parks, and wetlands) presented different fragmentation trends, i.e., mean patch size (MPS) and area weighted mean shape index (AWMSI) (Figure 6). Considering landscape configuration, forest patterns became more connected in the entire plain and the three sub-regions (Figure 6). Specifically, forest patterns became more aggregated (MPS increased 1.49), while those of parks, wetlands, and vacant lots showed higher fragmentation (MPS decreased 0.29, 0.28, and 0.43, respectively) after afforestation in the entire plain area. These changes also occurred in the three sub-regions (Figure 6). In contrast to that of parks and wetlands, the shape of forest and vacant lot patches became more irregular (AWMSI increased by 1.01 and 0.04, respectively) as AWMSI increased in the entire plain area and the second greenbelt (AWMSI increased by 0.38 and 0.03, respectively). In the first greenbelt and suburban area, only the shape of park patches increased in regularity with afforestation (AWMSI decreased 0.01) contrasting with those other greenspace types (forest, wetlands, and vacant lots).
The proportion of other landscape patch types (other land, cropland, waterbodies, and unused land) decreased in the entire plain area as well as in the three sub-regions (Figure 6). Other land and cropland showed changes in landscape metrics more distinct than those of waterbodies and unused land. Additionally, the patterns of other landscape patch types became more fragmented in the entire plain and the three sub-regions after afforestation. With afforestation, other land AWMSI increased by 0.24, 0.28, and 0.08 in the entire plain area and the first and second greenbelt, respectively, indicating that the shape of other land patches, except those in suburban areas, became more regular. In contrast, the shape of cropland patches became more irregular after afforestation in the entire plain area and the three sub-regions (AWMSI decreased 0.72, 0.1, 0.04, and 0.77, respectively). Meanwhile, the shape of waterbody patches became more irregular in the entire plain area and suburbs, and unused land showed the opposite trend. However, both of them increased regularity after afforestation in the two greenbelts.

3.4. The Infilling Greenspace Expansion Type Increased during Afforestation

Edge expansion (new greenspace expanding peripherally around the pre-existing patches) was the most common greenspace expansion type during the afforestation (Figure 7). Throughout all afforestation periods, edge expansion accounted for over 69% of the three greenspace expansion types. With BPAP implementation, the proportion of outlying and edge expansion types decreased, while the infilling type increased. Specifically, from 20092012 to 2012–2013, the infilling percentage increased by 2.87%, while the outlying and edge expansion percentage decreased by 0.05% and 2.81%, respectively. From 2012–2013 to 2013−2014, the infilling percentage increased by 2.89%, while the outlying and edge expansion percentage decreased by 0.99% and 1.91%, respectively. From 2013–2014 to 2014–2015, the infilling percentage increased by 5.21%, while that of outlying and edge expansion decreased 4.95% and 0.24%, respectively. The largest infilling increase occurred during 2013 and 2015, the last two afforestation years.
Regarding the spatial distribution of greenspace expansion, most infilling (red color) was distributed along the rivers and roads, and located in the suburban areas (Figure 7). Specifically, most new infilling greenspaces were distributed along the Yongding River (located in the south of the plain area) and Beiyun River (located in the northeast of the plain area) in 2009–2012, 2012–2013, and 2013–2014. In 2014–2015, most infilling greenspaces were distributed in the southeast of the plain area.

4. Discussion

4.1. Potential Impacts of Inner-City Afforestation on Urban Ecosystems and Inhabitants

Our results indicated that BPAP improved the proportion of greenspace (especially forest) and accelerated the transition from small to large greenspaces, enhancing the green network connectivity in four years (from 2012 to 2015). This further confirmed that large-scale inner-city afforestation plays an important role in the enhancement of greenness in metropolitan areas [60,103]. As the quantity, size, and spatial arrangement of greenspace are essential for urban biodiversity and human health, afforestation will benefit both humans and animals in urban areas [104,105,106,107]. Specifically, the increased forest patches provide additional habitats for urban wildlife, and the decreased fragmentation as well as increased patch size and complexity patch shape also are expected to have positive impacts on species composition, richness, and their movement [13,108,109]. Moreover, the extended and aggregated greenspace is expected to enhance cooling effect benefits by increasing canopy cover and evapotranspiration [7,53,110]. For human well-being, the increase in nearby greenspaces can mitigate air pollution and provide more recreation sites and equitable access for residents, which are beneficial for human mental and physical health [111]. Contrasting with forests and parks, other land (i.e., urban built-up area and impervious surfaces) showed an apparent decline in the first and second greenbelt and suburban areas after BPAP implementation. This indicated that afforestation has enhanced the two previous greenbelt programs [82] and relatively controlled the disordered urban sprawl outward from the old city center.
The changes in greenspace patterns suggests several positive effects through the implementation of afforestation. However, the massive new forests and trees might lead to potential negative impacts on the urban thermal and ventilation environment. Afforestation will lead to a net warming if the daytime cooling is unable to offset the warming during nighttime [48]. In addition, the huge amounts of new trees may reduce wind speed and mixing heights, which could exacerbate air pollution [112]. New afforestation also produces more pollen and catkins, which may threaten sensitized people (e.g., allergies), as large amount of Pinus tabulaeformis Carr., Ginkgo biloba L, Salix spp., Populus spp., and Platycladus orientalis had been planted during BPAP [75,113,114]. Thus, based on our study, a detailed assessment of ecosystem services after afforestation is still needed: for example, linking the greenspace spatial patterns to specific tree species and community locations to analyze the phytogenic pollution risks, and connecting greenspace heterogeneity with surface or air temperatures to investigate the interactions between new afforestation sites and urban warming.

4.2. Challenges of Rapid Afforestation in Future Greenspace Optimization and Management

With the government-led design, planning, and implementation, BPAP efficiency was generally good, if we just consider the total increased amounts of trees and connected urban forest and parks patches. Furthermore, new trees filled gaps within pre-existing greenspace patches and extended around the pre-existing green patches, which followed the original design concept, such as the aggregated-with-outlines principle for an optimal landscape [87]. However, we still need to pay attention to the unfinished afforestation in “three greenbelts” and “two green rings”, which only completed 52.4% and 20.7% of planned areas, respectively. Moreover, 24.4% of new trees were planted in locations not included in the planned area, mainly owing to the conflicts of land use, the land ownership policy and stockholder benefits [75]. Therefore, it is necessary for planners and decision makers to review and rethink their original BPAP plan scheme, and reduce unplanned adjustments of plantation sites during future rounds of plain area afforestation in Beijing.
Landscape transition detection showed that 77.5% of new forests were transferred from cropland, which means that the land replacement costs and management of replanted sites will be significant challenges. As a trading zone for food and vegetables, Beijing historically had a sufficient external food supply, which means that local traditional agriculture developed slowly with low economic benefits, and thus much cropland was dilapidated. Thus, the local government rented farmland to plant new trees during the process of BPAP, which resulted in high compensation costs for the land holders [115]. One of the initial rules for BPAP was “occupy less agricultural land as possible”, however, more cropland was converted than was planned during the project implementation. In addition, as the massive use of cropland for afforestation has contravened the Red Line for Arable Land Protection for food security [116,117], the new afforestation sites located on previous farmland have high risks of being converted back to cropland when food security protection is prioritized. Thus, permanently preserving the new afforestation will be another challenge after BPAP, and a long-term monitoring system for the new replanted sites is needed.
The massive transition from cropland to forests has negative impacts on the biodiversity of agriculture as well [118]. Specifically, the loss of cropland will result in the decrease of segetal plants and traditional local crops such as alfalfa, wheat and rape [119,120,121]. It also threatens the ecological process of domestic animals, insectivorous birds and pollinator insects as the loss of habitats or food [122,123,124]. Thus, the biodiversity conservation for new afforestation is urgent needed to compensate the loss of agricultural biodiversity.

4.3. Integration of Spatial Analysis for Pre-Assessment of Afforestation Programs

There are currently two primary challenges for the assessment of new afforestation: (1) the lack of spatial distribution evaluation at a large scale after afforestation programs, with few studies focusing on landscape pattern changes before and after afforestation, and (2) the overstatement of outcomes in afforestation programs [125]. To assess the real-world outcomes of BPAP and understand the process from planning to implementation, we integrated landscape pattern, transition detection, and expansion analyses to quantify greenspace heterogeneity and spatial-temporal dynamics during the afforestation implementation [126,127]. We also visualized redundant numbers by using readability plots and diagrams to enhance the interpretation and understanding of results. Compared to those of previous afforestation program assessments, such spatial-based analysis methods can be used to measure the actual changes in quantity and spatial placement of new afforestation sites, and provide spatially explicit data to support future efforts on spatial optimization, adjustment, and ecosystem service assessment of afforestation programs [128]. For example, measuring fragmentation can help to evaluate and optimize the spatial distribution of greenspace, which is related to evenness and accessibility [127,129]; measuring landscape type transitions can monitor land use changes during the afforestation programs and identify the potential risks or challenges for future conservation and management (the potential implications of our integrated spatial analysis were listed in Table 4). However, calculation of those indicators through different tools (e.g., ArcGIS, Fragstats, and RStudio) will take significant computing time, especially for those who are not familiar with GIS or landscape analysis, suggesting that a unified platform is needed for further applications. Thus, our future work is constructing and integrating these metrics based on open-source platforms (e.g., RStudio and Python), and develop a replicable user-friendly application for the pre-assessment of afforestation.
In addition, landscape metrics and spatial analysis sometimes fail to evaluate the exact ecological functions and quantify real-world ecological processes during afforestation [130]. Thus, full afforestation assessments, specifically focusing on tree health condition, public use of the facilities, and ecosystem services such as air pollution removal, carbon storage, and heat island mitigation [131,132,133], are still needed based on the spatial-temporal analysis of landscape patterns.

5. Conclusions

Beijing initiated the largest afforestation program in its history in 2012. With a vision of two green rings, three greenbelts, nine green wedges, and multiple green corridors, more than 54 million trees were planted in four years (from 2012 to 2015) on an area of 70,711 ha. Despite the greenspace enhancement in the plain area, we lacked understanding of real outcomes regarding the changes in greenspace patterns during and after such rapid afforestation. Therefore, before a deeper assessment of ecosystem services and other costs or benefits, it was necessary to detect the spatial-temporal changes during implementation of afforestation.
Our work has confirmed that large-scale and rapid afforestation has enhanced urban greenspace by converting cropland and other land (e.g., built-up and other impervious area) into forests and urban parks. The inner-city afforestation also accelerated the conversion of very small greenspaces to larger patches, with potential positive impacts on urban resilience and conservation. After afforestation, forest patches became more aggregated despite the overall landscape fragmentation, which would benefit urban biodiversity and human well-being. However, the extra-adjustment of real afforestation sites and the massive transition between cropland and forest have been challenges for the future optimization and conservation of BPAP. The study also demonstrated that spatially explicit data and analysis can support efforts to assess rapid outcomes (e.g., both specific and cumulative changes in landscape patterns) of current ongoing afforestation programs. Based on this study, future work should focus on the full assessment of social-ecological-economic impacts for new afforestation areas and zoom in to the specific ecosystem services provided by the afforestation. In addition, more comparative research of such afforestation programs is needed for identifying the real-world efficiency of inner-city afforestation from planning to implementation.

Author Contributions

J.J. conceived the study, processed, analyzed and visualized the data, interpreted the results, and wrote the original manuscript. C.W. supervised the overall research and reviewed the draft manuscript. B.J. contributed to the spatial analysis and data curation. S.R.J.S. reviewed the manuscript and contributed to the introduction and methodology sections. All authors have read and agreed to the published version of the manuscript.

Funding

This work was supported by the Fundamental Research Funds for the Central Nonprofit Research Institution of Chinese Academy of Forestry [grant number: CAFYBB2019SY004], the National Natural Science Foundation of China (No. 31800608) and the European Union’s Horizon 2020 research and innovation program under grant agreement [No. 821242].

Acknowledgments

We also would like to express our gratitude to the Beijing Gardening and Greening Bureau (Capital Greening Office), and the Beijing Forestry Survey and Design Institute for providing essential data and materials.

Conflicts of Interest

The authors declare no conflict of interest.

Appendix A

Table A1. Transition matrix of landscape patch types from 2009 to 2015 (unit: hectares).
PeriodPatch TypesOther LandForestCroplandVacant LotsWaterbodiesUnused LandWetlandsParksLoss
2009–2013Other land256,207.432445.51 17.69172.962636.15
Forest 106,240.56 4.03100.17104.20
Cropland 8906.57201,690.33 73.08244.919224.56
Vacant lots 35.21 1773.34 11.0346.24
Waterbodies 101.79 6602.47 5.220.47107.48
Unused land 259.61 8703.93 0.92260.53
Wetlands 1525.75 29,902.070.451526.20
Parks 332.64 0.3434,259.52332.98
Gain013,607.080000100.35530.9114,238.34
Transition Rate−1.02%12.70%−4.37%−2.54%−1.60%−2.91%−4.54%0.57%
2012–2013Other land254,223.311821.04 5.49157.591984.12
Forest 119,579.44 19.06249.14268.20
Cropland 14,572.04186,194.27 112.16811.8515,496.05
Vacant lots 35.53 1732.80 5.0240.55
Waterbodies 109.22 6440.78 0.3449.10158.65
Unused land 264.89 8435.89 3.15268.04
Wetlands 958.80 28,956.8886.741045.53
Parks 453.62 0.0734,336.13453.69
Gain018,215.140000137.121362.5819,714.84
Transition Rate−0.77%14.97%−7.68%−2.29%−2.45%−3.08%−3.03%2.61%
2013–2014Other land252,379.941614.74 75.02153.611843.36
Forest 137,340.53 284.15169.90454.05
Cropland 14,564.73170,427.32 533.43668.7915,766.95
Vacant lots 13.21 1718.44 1.15 14.36
Waterbodies 156.13 6232.41 29.2523.00208.37
Unused land 76.64 8359.25 76.64
Wetlands 718.88 28,202.75176.02894.90
Parks 850.50 20.0534,828.16870.55
Gain017,994.820000943.051191.3120,129.18
Transition Rate−0.73%12.73%−8.47%−0.83%−3.24%−0.91%0.17%0.90%
2014–2015Other land251,360.78815.04 28.46175.661019.16
Forest 155,255.65 34.2245.4779.70
Cropland 3996.19166,310.80 46.3773.964116.52
Vacant lots 4.05 1714.39 4.05
Waterbodies 60.39 6169.81 0.092.1262.60
Unused land 16.90 8342.29 0.0716.97
Wetlands 213.71 28,911.9520.14233.84
Parks 248.94 35,770.54248.94
Gain05355.220000109.15317.415781.78
Transition Rate−0.40%3.40%−2.42%−0.24%−1.00%−0.20%−0.43%0.19%
Table A2. Transition matrix of landscape patch-size classes from 2009 to 2015 (unit: percent). The numbers in the table represented the changed proportion of land area for each patch-size class and corresponded to the width of flow lines between stacked vertical bars in Sankey diagram in Figure 5.
PeriodPatch-Size ClassesVery SmallSmallMediumLargeVery LargeHugeLoss
2009–2012Very small18.900.300.140.140.120.190.89
Small0.1515.200.370.270.190.211.19
Medium0.030.128.260.340.130.230.85
Large0.020.060.1110.300.570.200.95
Very large0.020.070.060.058.800.961.16
Huge0.120.110.000.170.1432.960.55
Gain0.350.650.680.981.141.795.59
2012–2013Very small17.990.450.130.120.160.221.08
Small0.1414.160.650.480.270.301.85
Medium0.050.197.730.520.270.301.34
Large0.020.080.0110.120.690.511.31
Very large0.010.000.000.019.001.011.02
Huge0.040.040.060.090.1634.020.39
Gain0.270.770.851.211.552.346.98
2013–2014Very small16.520.540.180.250.140.261.37
Small0.2612.990.760.570.270.352.21
Medium0.020.147.380.710.280.171.32
Large0.050.060.089.761.120.581.89
Very large0.040.030.030.108.701.872.07
Huge0.070.060.060.140.1235.340.45
Gain0.440.841.101.771.933.239.31
2014–2015Very small16.260.170.040.100.060.060.42
Small0.0313.510.190.130.160.070.58
Medium0.0010.038.020.410.120.020.58
Large0.010.02 11.310.530.120.68
Very large0.010.02 0.0710.120.470.57
Huge0.010.040.000.030.0737.790.16
Gain0.060.280.230.750.940.732.98

References

  1. Taylor, L.; Hochuli, D.F. Defining greenspace: Multiple uses across multiple disciplines. Landsc. Urban Plan. 2017, 158, 25–38. [Google Scholar] [CrossRef] [Green Version]
  2. Swanwick, C.; Dunnett, N.; Woolley, H. The Nature, Role and Value of Green Space in Towns and Cities—An Overview. Built Environ. 2003, 29, 94–106. [Google Scholar] [CrossRef]
  3. Kowarik, I. Novel urban ecosystems, biodiversity, and conservation. Environ. Pollut. 2011, 159, 1974–1983. [Google Scholar] [CrossRef]
  4. Dwyer, L.; Forsyth, P. Assessing the benefits and costs of inbound tourism. Ann. Tour. Res. 1993, 20, 751–768. [Google Scholar] [CrossRef]
  5. McPherson, E.G.; Nowak, D.; Heisler, G.; Grimmpnd, S.; Souch, C.; Grant, R.; Rowntree, R. Quantifying urban forest structure, function, and value: The Chicago urban forest project. Urban Ecosyst. 1997, 1, 49–61. [Google Scholar] [CrossRef]
  6. Kim, G. Assessing urban forest structure, ecosystem services, and economic benefits on vacant land. Sustainability 2016, 8, 679. [Google Scholar] [CrossRef] [Green Version]
  7. Livesley, S.J.; McPherson, E.G.; Calfapietra, C. The Urban Forest and Ecosystem Services: Impacts on Urban Water, Heat, and Pollution Cycles at the Tree, Street, and City Scale. J. Environ. Qual. 2016, 45, 119–124. [Google Scholar] [CrossRef]
  8. Kong, F.; Yin, H.; Nakagoshi, N.; Zong, Y. Urban green space network development for biodiversity conservation: Identification based on graph theory and gravity modeling. Landsc. Urban Plan. 2010, 95, 16–27. [Google Scholar] [CrossRef]
  9. Tryjanowski, P.; Morelli, F.; Mikula, P.; Krištín, A.; Indykiewicz, P.; Grzywaczewski, G.; Kronenberg, J.; Jerzak, L. Bird diversity in urban green space: A large-scale analysis of differences between parks and cemeteries in Central Europe. Urban For. Urban Green. 2017, 27, 264–271. [Google Scholar] [CrossRef]
  10. Threlfall, C.G.; Walker, K.; Williams, N.S.G.; Hahs, A.K.; Mata, L.; Stork, N.; Livesley, S.J. The conservation value of urban green space habitats for Australian native bee communities. Biol. Conserv. 2015, 187, 240–248. [Google Scholar] [CrossRef]
  11. Jin, J.; Gergel, S.E.; Lu, Y.; Coops, N.C.; Wang, C. Asian Cities are Greening While Some North American Cities are Browning: Long-Term Greenspace Patterns in 16 Cities of the Pan-Pacific Region. Ecosystems 2020, 23, 383–399. [Google Scholar] [CrossRef]
  12. Ahn, R.; Burke, T.F.; McGahan, A.M. Innovating for Healthy Urbanization; Springer: Boston, MA, USA, 2015; ISBN 9781489975973. [Google Scholar]
  13. Nagendra, H.; Southworth, J. Reforesting Landscapes: Linking Pattern & Process; Springer: New York, NY, USA, 2010; Volume 10, pp. 149–174. ISBN 978-1-4020-9655-6. [Google Scholar]
  14. Sapart, C.J.; Monteil, G.; Prokopiou, M.; van de Wal, R.S.W.; Kaplan, J.O.; Sperlich, P.; Krumhardt, K.M.; van der Veen, C.; Houweling, S.; Krol, M.C.; et al. Natural and anthropogenic variations in methane sources during the past two millennia. Nature 2013, 490, 85–88. [Google Scholar] [CrossRef] [PubMed]
  15. United Nations; Department of Economic and Social Affairs; Population Division. The World’s Cities in 2016: Data Booklet; United Nations: New York, NY, USA, 2016; ISBN 978-92-1-151549-7. [Google Scholar]
  16. Montesino Pouzols, F.; Toivonen, T.; Di Minin, E.; Kukkala, A.S.; Kullberg, P.; Kuusterä, J.; Lehtomäki, J.; Tenkanen, H.; Verburg, P.H.; Moilanen, A. Global protected area expansion is compromised by projected land-use and parochialism. Nature 2014, 516, 383–386. [Google Scholar] [CrossRef] [PubMed] [Green Version]
  17. Yemshanov, D.; Biggs, J.; Mckenney, D.W.; Lempriere, T. Effects of permanence requirements on afforestation choices for carbon sequestration for Ontario, Canada. For. Policy Econ. 2012, 14, 6–18. [Google Scholar] [CrossRef]
  18. Betts, M.G.; Wolf, C.; Ripple, W.J.; Phalan, B.; Millers, K.A.; Duarte, A.; Butchart, S.H.M.; Levi, T. Global forest loss disproportionately erodes biodiversity in intact landscapes. Nat. Publ. Gr. 2017, 547, 441–444. [Google Scholar] [CrossRef]
  19. Seto, K.C.; Guneralp, B.; Hutyra, L.R. Global forecasts of urban expansion to 2030 and direct impacts on biodiversity and carbon pools. Proc. Natl. Acad. Sci. USA 2012, 109, 16083–16088. [Google Scholar] [CrossRef] [Green Version]
  20. Chazdon, R.L. Beyond deforestation: Restoring forests and ecosystem services on degraded lands. Science 2008, 320, 1458–1460. [Google Scholar] [CrossRef] [Green Version]
  21. Boerema, A. Ecosystem Services: Study of Human Influences on Nature and the Effects for Society. Ph.D. Thesis, University of Antwerp, Antwerp, Belgium, 2016. [Google Scholar]
  22. Foley, J.A.; Defries, R.; Asner, G.P.; Barford, C.; Bonan, G.; Carpenter, S.R.; Chapin, F.S.; Coe, M.T.; Daily, G.C.; Gibbs, H.K.; et al. Global consequences of land use. Science 2005, 309, 570–574. [Google Scholar] [CrossRef] [Green Version]
  23. Pierre, S.; Groffman, P.M.; Killilea, M.E.; Oldfield, E.E. Soil microbial nitrogen cycling and nitrous oxide emissions from urban afforestation in the New York City Afforestation Project. Urban For. Urban Green. 2016, 15, 149–154. [Google Scholar] [CrossRef]
  24. D’Almeida, C.; Vörösmarty, C.J.; Hurtt, G.C.; Marengo, J.A.; Dingman, S.L.; Keim, B.D. The effects of deforestation on the hydrological cycle in Amazonia: A review on scale and resolution. Int. J. Climatol. 2007, 27, 633–647. [Google Scholar] [CrossRef]
  25. Rosenzweig, C.; Karoly, D.; Vicarelli, M.; Neofotis, P.; Wu, Q.; Casassa, G.; Menzel, A.; Root, T.L.; Estrella, N.; Seguin, B.; et al. Attributing physical and biological impacts to anthropogenic climate change. Nature 2008, 453, 353–357. [Google Scholar] [CrossRef] [PubMed]
  26. Nastran, M.; Kobal, M.; Eler, K. Urban heat islands in relation to green land use in European cities. Urban For. Urban Green. 2019, 37, 33–41. [Google Scholar] [CrossRef] [Green Version]
  27. Chapman, S.; Watson, J.E.M.; Salazar, A.; Thatcher, M.; McAlpine, C.A. The impact of urbanization and climate change on urban temperatures: A systematic review. Landsc. Ecol. 2017, 32, 1921–1935. [Google Scholar] [CrossRef]
  28. Gulsrud, N.M.; Hertzog, K.; Shears, I. Innovative urban forestry governance in Melbourne?: Investigating “green placemaking” as a nature-based solution. Environ. Res. 2018, 161, 158–167. [Google Scholar] [CrossRef]
  29. Food and Agriculture Organization of the United Nations. Forests and Sustainable Cities; Food and Agriculture Organization of the United Nations: Rome, Italy, 2018; ISBN 9789251304174. [Google Scholar]
  30. Dominy, S.W.J.; Gilsenan, R.; Mckenney, D.W.; Allen, D.J.; Hatton, T.; Koven, A.; Cary, J.; Yemshanov, D.; Sidders, D. A retrospective and lessons learned from Natural Resources Canada’s Forest 2020 afforestation initiative. For. Chron. 2010, 86, 339–347. [Google Scholar] [CrossRef] [Green Version]
  31. Nagendra, H. Drivers of reforestation in human-dominated forests. Proc. Natl. Acad. Sci. USA 2007, 104, 15218–15223. [Google Scholar] [CrossRef] [PubMed] [Green Version]
  32. Zanchi, G.; Thiel, D.; Green, T.; Lindner, M. Forest Area Change and Afforestation in Europe: Critical Analysis of Available Data and the Relevance for International Environmental Policies; EFI Technical Report 24; European Forest Institute: Joensuu, Finland, 2017; Available online: https://efi.int/sites/default/files/files/publication-bank/2018/tr_24.pdf (accessed on 5 May 2017).
  33. Buendia, C.; Batalla, R.J.; Sabater, S.; Palau, A.; Marcé, R. Runoff Trends Driven by Climate and Afforestation in a Pyrenean Basin. L. Degrad. Dev. 2016, 27, 823–838. [Google Scholar] [CrossRef] [Green Version]
  34. US. Department of Agriculture, Forest Service. America the Beautiful National Tree Program; U.S. Department of Agriculture, Forest Service: Washington, DC, USA, 1991; ISBN 0926-860X.
  35. Fernández-Ondoño, E.; Serrano, L.R.; Jiménez, M.N.; Navarro, F.B.; Díez, M.; Martín, F.; Fernández, J.; Martínez, F.J.; Roca, A.; Aguilar, J. Afforestation improves soil fertility in south-eastern Spain. Eur. J. For. Res. 2010, 129, 707–717. [Google Scholar] [CrossRef]
  36. Rosenbaum, K.L.; Lindsay, J.M. An Overview of National Forest Funds: Current Approaches and Future Opportunities; Food and Agriculture Organization of the United Nations: Rome, Italy, 2001. [Google Scholar]
  37. Zhao, S.; Liu, S.; Zhou, D. Prevalent vegetation growth enhancement in urban environment. Proc. Natl. Acad. Sci. USA 2016, 113, 6313–6318. [Google Scholar] [CrossRef] [Green Version]
  38. Chen, C.; Park, T.; Wang, X.; Piao, S.; Xu, B.; Chaturvedi, R.K.; Fuchs, R.; Brovkin, V.; Ciais, P.; Fensholt, R.; et al. China and India lead in greening of the world through land-use management. Nat. Sustain. 2019, 2, 122–129. [Google Scholar] [CrossRef]
  39. Baer, Y.; Schneider, W.D. A Landsat Surface Reflectance Dataset for North America, 1990–2000. Handb. Phys. Chem. Rare Earths 2006, 3, 68–72. [Google Scholar] [CrossRef]
  40. Vermote, E.; Justice, C.; Claverie, M.; Franch, B. Preliminary analysis of the performance of the Landsat 8/OLI land surface reflectance product. Remote Sens. Environ. 2016, 185, 46–56. [Google Scholar] [CrossRef] [PubMed]
  41. Yang, X.J. China’s Rapid Urbanization. Science 2013, 342, 310. [Google Scholar] [CrossRef]
  42. National Bureau of Satistics. China GDP Growth Slightly Beats Estimates in Q2. Available online: https://tradingeconomics.com/china/gdp-growth-annual (accessed on 18 September 2017).
  43. Li, B.; Gasser, T.; Ciais, P.; Piao, S.; Tao, S.; Balkanski, Y.; Hauglustaine, D.; Boisier, J.-P.; Chen, Z.; Huang, M.; et al. The contribution of China’s emissions to global climate forcing. Nature 2016, 531, 357–361. [Google Scholar] [CrossRef]
  44. Song, C.; Zhang, Y.; Mei, Y.; Liu, H.; Zhang, Z.; Zhang, Q.; Zha, T.; Zhang, K.; Huang, C.; Xu, X.; et al. Sustainability of Forests Created by China’s Sloping Land Conversion Program: A comparison among three sites in Anhui, Hubei and Shanxi. For. Policy Econ. 2014, 38, 161–167. [Google Scholar] [CrossRef]
  45. Xu, J. China’s new forests aren’t as green as they seem. Nature 2011, 477, 371. [Google Scholar] [CrossRef] [Green Version]
  46. Vina, A.; McConnell, W.J.; Yang, H.; Xu, Z.; Liu, J. Effects of conservation policy on Chinas forest recovery. Sci. Adv. 2016, 2, e1500965. [Google Scholar] [CrossRef] [Green Version]
  47. Zhang, Y.; Peng, C.; Li, W.; Tian, L.; Zhu, Q.; Chen, H.; Fang, X.; Zhang, G.; Liu, G.; Mu, X.; et al. Multiple afforestation programs accelerate the greenness in the “Three North” region of China from 1982 to 2013. Ecol. Indic. 2015, 61, 404–412. [Google Scholar] [CrossRef]
  48. Peng, S.-S.; Piao, S.; Zeng, Z.; Ciais, P.; Zhou, L.; Li, L.Z.X.; Myneni, R.B.; Yin, Y.; Zeng, H. Afforestation in China cools local land surface temperature. Proc. Natl. Acad. Sci. USA 2014, 111, 2915–2919. [Google Scholar] [CrossRef] [PubMed] [Green Version]
  49. Forman, R.T.T. Urban ecology principles: Are urban ecology and natural area ecology really different? Landsc. Ecol. 2016, 31, 1653–1662. [Google Scholar] [CrossRef]
  50. Matthies, S.; Rüter, S.; Prasse, R. Urban green spaces—The effects of patch size and distance to the urban edge on vascular plant and bird species diversity. In Proceedings of the Changes European Landscapes: Landscape Ecology, Local to Global, Manchester, UK, 9–12 September 2013. [Google Scholar]
  51. Matsuba, M.; Nishijima, S.; Katoh, K. Effectiveness of corridor vegetation depends on urbanization tolerance of forest birds in central Tokyo, Japan. Urban For. Urban Green. 2016, 18, 173–181. [Google Scholar] [CrossRef]
  52. Pauleit, S.; Slinn, P.; Handley, J.; Lindley, S. Promoting the natural greenstructure of towns and cities: English nature’s accessible natural greenspace standards model. Built Environ. 2003, 29, 157–171. [Google Scholar] [CrossRef]
  53. Vaz Monteiro, M.; Doick, K.J.; Handley, P.; Peace, A. The impact of greenspace size on the extent of local nocturnal air temperature cooling in London. Urban For. Urban Green. 2016, 16, 160–169. [Google Scholar] [CrossRef]
  54. Qiu, K.; Jia, B. The roles of landscape both inside the park and the surroundings in park cooling effect. Sustain. Cities Soc. 2020, 52, 101864. [Google Scholar] [CrossRef]
  55. Shih, W. Greenspace patterns and the mitigation of land surface temperature in Taipei metropolis. Habitat Int. 2017, 60, 69–80. [Google Scholar] [CrossRef]
  56. Daniels, B.; Jedamski, J.; Ottermanns, R.; Ross-Nickoll, M. A “plan bee” for cities: Pollinator diversity and plant-pollinator interactions in urban green spaces. PLoS ONE 2020, 15, e235492. [Google Scholar] [CrossRef] [PubMed]
  57. Leveau, L.M.; Ruggiero, A.; Matthews, T.J.; Isabel Bellocq, M. A global consistent positive effect of urban green area size on bird richness. Avian Res. 2019, 10, 1–14. [Google Scholar] [CrossRef] [Green Version]
  58. Li, H.; Chen, W.; He, W. Planning of green space ecological network in urban areas: An example of Nanchang, China. Int. J. Environ. Res. Public Health 2015, 12, 12889–12904. [Google Scholar] [CrossRef] [Green Version]
  59. Carreiro, M.M.; Song, Y.C.; Wu, J. Ecology, Planning, and Management of Urban Forests; Springer: Berlin/Heidelberg, Germany, 2007; ISBN 9780387353029. [Google Scholar]
  60. Vadell, E.; de-Miguel, S.; Pemán, J. Large-scale reforestation and afforestation policy in Spain: A historical review of its underlying ecological, socioeconomic and political dynamics. Land Use Policy 2016, 55, 37–48. [Google Scholar] [CrossRef]
  61. Abd Elrahman, A.S.; Asaad, M. Urban design & urban planning: A critical analysis to the theoretical relationship gap. Ain Shams Eng. J. 2020. [Google Scholar] [CrossRef]
  62. Haaland, C.; van den Bosch, C.K. Challenges and strategies for urban green-space planning in cities undergoing densification: A review. Urban For. Urban Green. 2015, 14, 760–771. [Google Scholar] [CrossRef]
  63. Mcgarigal, K.; Marks, B.J. Fragstats: Spatial Pattern Analysis Program for Quantifying Landscape Structure; Gen. Technical Report PNW-GTR-351; U.S. Department of Agriculture, Forest Service, Pacific Northwest Research Station: Portland, OR, USA, 1995; Volume 122, p. 1994. [CrossRef]
  64. Yang, C.; He, X.; Wang, R.; Yan, F.; Yu, L.; Bu, K.; Yang, J.; Chang, L.; Zhang, S. The effect of urban green spaces on the urban thermal environment and its seasonal variations. Forests 2017, 8, 153. [Google Scholar] [CrossRef] [Green Version]
  65. Martín-Martín, C.; Bunce, R.G.H.; Saura, S.; Elena-Rosselló, R. Changes and interactions between forest landscape connectivity and burnt area in Spain. Ecol. Indic. 2013, 33, 129–138. [Google Scholar] [CrossRef]
  66. Frazier, A.E.; Kedron, P. Landscape Metrics: Past Progress and Future Directions. Curr. Landsc. Ecol. Rep. 2017, 2, 63–72. [Google Scholar] [CrossRef] [Green Version]
  67. Liu, X.; Li, X.; Chen, Y.; Tan, Z.; Li, S.; Ai, B. A new landscape index for quantifying urban expansion using multi-temporal remotely sensed data. Landsc. Ecol. 2010, 25, 671–682. [Google Scholar] [CrossRef]
  68. Uuemaa, E.; Mander, Ü.; Marja, R. Trends in the use of landscape spatial metrics as landscape indicators: A review. Ecol. Indic. 2013, 28, 100–106. [Google Scholar] [CrossRef]
  69. Profous, G. Trees and Urban Forestry in Beijing, China. J. Arboric. 1992, 18, 145–154. [Google Scholar]
  70. Wang, C. Strategic thinking of the afforestation in Beijing Plain Area. J. Chin. Urban For. 2012, 10, 7–11. (In Chinese) [Google Scholar]
  71. Yang, J.; McBride, J.; Zhou, J.; Sun, Z. The urban forest in Beijing and its role in air pollution reduction. Urban For. Urban Green. 2005, 3, 65–78. [Google Scholar] [CrossRef]
  72. Pan, Y.; Gong, H.; Sun, Y.; Wang, X.; Ding, F. Distributed estimation and analysis of precipitation recharge coefficient in strongly-exploited Beijing plain area, China. Chin. Geogr. Sci. 2017, 27, 88–96. [Google Scholar] [CrossRef] [Green Version]
  73. Wang, C.; Wang, J.; Liu, J.; Qie, G.; Sun, R.; Gu, L.; Wang, X.; Zhang, C. Construction and strategic layout of Beijing Plain Area. J. Chin. Urban For. 2013, 11, 4–7. (In Chinese) [Google Scholar]
  74. Beijing Gardening and Greening Bureau. Beijing Plain Afforestation Program. Available online: http://www.bjyl.gov.cn/sdlh/bjs20wmzlgc/ (accessed on 10 January 2018).
  75. Yao, N.; Konijnendijk van den Bosch, C.C.; Yang, J.; Devisscher, T.; Wirtz, Z.; Jia, L.; Duan, J.; Ma, L. Beijing’s 50 million new urban trees: Strategic governance for large-scale urban afforestation. Urban For. Urban Green. 2019, 44. [Google Scholar] [CrossRef]
  76. State Forestry Administration P.R. China. Forest Coverage Rate in Beijing’s Plain Area Rises to 25 Pct. Available online: http://english.forestry.gov.cn/index.php?option=com_content&view=article&id=963:forest-coverage-rate-in-beijing-s-plain-area-rises-to-25-pct&catid=20&Itemid=161 (accessed on 22 December 2015).
  77. Southworth, J.; Munroe, D.; Nagendra, H. Land cover change and landscape fragmentation—Comparing the utility of continuous and discrete analyses for a western Honduras region. Agric. Ecosyst. Environ. 2004, 101, 185–205. [Google Scholar] [CrossRef]
  78. Beijing Municipal Bureau of Statistics. Beijing Statistical Yearbook; China Statistics Press: Beijing, China, 2013; ISBN 9787503768422.
  79. Pan, Y.; Zhang, Q.; Zhen, L.; Yu, Z. Green space pattern and ecosystem services value of the sub-regions in Beijing plain area. Chin. J. Ecol. 2011, 30, 818–823. (In Chinese) [Google Scholar]
  80. Peng, C.; Chen, W.; Liao, X.; Wang, M.; Ouyang, Z.; Jiao, W.; Bai, Y. Polycyclic aromatic hydrocarbons in urban soils of Beijing: Status, sources, distribution and potential risk. Environ. Pollut. 2011, 159, 802–808. [Google Scholar] [CrossRef]
  81. Tang, Y.; Kunzman, K.R. The evolution of spatial planning for Beijing. Inf. Raumentwickl. 2008, 8, 457–470. [Google Scholar]
  82. Yang, J.; Zhou, J. The failure and success of greenbelt program in Beijing. Urban For. Urban Green. 2007, 6, 287–296. [Google Scholar] [CrossRef]
  83. He, C.; Shi, P.; Chen, J.; Xu, X. Process and Mechanism of Urbanization in Beijing Area. Acta Geogr. Sin. 2002, 57, 363–371. (In Chinese) [Google Scholar]
  84. Zeng, W.; Tomppo, E.; Healey, S.P.; Gadow, K.V. The national forest inventory in China: History-results-international context. For. Ecosyst. 2015, 2, 23. [Google Scholar] [CrossRef] [Green Version]
  85. Jia, B.; Qiu, K. The cooling effect of plain afforestation in the Beijing Project and its remote sensing-based valuation. Acta Ecol. Sin. 2016, 37, 726–735. (In Chinese) [Google Scholar]
  86. Jin, J.; Wang, C.; Jia, B. Coupling analysis of landscape pattern and thermal fields after the afforestation in Beijing plain area. Chin. J. Appl. Ecol. 2018, 29, 3723–3734. (In Chinese) [Google Scholar]
  87. Forman, R.T.T. Land Mosaics: The Ecology of Landscapes and Regions, 1st ed.; Cambridge University Press: Cambridge, UK, 1995; ISBN 9780521474627. [Google Scholar]
  88. Dai, L.; Zhao, F.; Shao, G.; Zhou, L.; Tang, L. China’s classification-based forest management: Procedures, problems, and prospects. Environ. Manag. 2009, 43, 1162–1173. [Google Scholar] [CrossRef] [PubMed]
  89. ESRI. ArcGIS Desktop Help 10.5 Geostatistical Analyst; Environmental Systems Research Institute: Redlands, CA, USA, 2017. [Google Scholar]
  90. Lei, X.D.; Tang, M.P.; Lu, Y.C.; Hong, L.X.; Tian, D.L. Forest inventory in China: Status and challenges. Int. For. Rev. 2009, 11, 52–63. [Google Scholar] [CrossRef]
  91. Forman, R.T.T. Urban Ecology: Science of Cities; Cambridge University Press: Cambridge, UK, 2014; ISBN 9781139030472. [Google Scholar]
  92. Hu, Y.; Batunacun; Zhen, L.; Zhuang, D. Assessment of Land-Use and Land-Cover Change in Guangxi, China. Sci. Rep. 2019, 9, 1–13. [Google Scholar] [CrossRef] [Green Version]
  93. Guo, J. Research on Forest Landscape Ecology; Peking University Press: Beijing, China, 2001; ISBN 7-301-05057-7. (In Chinese) [Google Scholar]
  94. Cuba, N. Research note: Sankey diagrams for visualizing land cover dynamics. Landsc. Urban Plan. 2015, 139, 163–167. [Google Scholar] [CrossRef]
  95. Allaire, J.J.; Ellis, P.; Gandrud, C.; Owen, J.; Russell, K.; Rogers, J.; Sese, C. D3 JavaScript Network Graphs from R. Available online: https://cran.r-project.org/package=networkD3 (accessed on 19 June 2018).
  96. MacGarigal, K. Fragstats Help. Available online: https://www.umass.edu/landeco/research/fragstats/documents/fragstats.help.4.2.pdf (accessed on 25 September 2017).
  97. Shrestha, M.K.; York, A.M.; Boone, C.G.; Zhang, S. Land fragmentation due to rapid urbanization in the Phoenix Metropolitan Area: Analyzing the spatiotemporal patterns and drivers. Appl. Geogr. 2012, 32, 522–531. [Google Scholar] [CrossRef]
  98. Wu, Q.; Hu, D.; Wang, R.; Li, H.; He, Y.; Wang, M.; Wang, B. A GIS-based moving window analysis of landscape pattern in the Beijing metropolitan area, China. Int. J. Sustain. Dev. World Ecol. 2006, 13, 419–434. [Google Scholar] [CrossRef]
  99. Wickham, H.; Chang, W.; Henry, L.; Pedersen, T.L.; Takahashi, K.; Wilke, C.; Woo, K.; Yutani, H.; Dunningtong, D.; Rstudio. Create Elegant Data Visualizations Using the Grammar of Graphics. Available online: https://ggplot2.tidyverse.org/ (accessed on 21 January 2020).
  100. Comber, A.; Brunsdon, C.; Green, E. Using a GIS-based network analysis to determine urban greenspace accessibility for different ethnic and religious groups. Landsc. Urban Plan. 2008, 86, 103–114. [Google Scholar] [CrossRef] [Green Version]
  101. Nielsen, A.B.; Hedblom, M.; Olafsson, A.S.; Wiström, B. Spatial configurations of urban forest in different landscape and socio-political contexts: Identifying patterns for green infrastructure planning. Urban Ecosyst. 2017, 20, 379–392. [Google Scholar] [CrossRef]
  102. Feyisa, G.L.; Dons, K.; Meilby, H. Efficiency of parks in mitigating urban heat island effect: An example from Addis Ababa. Landsc. Urban Plan. 2014, 123, 87–95. [Google Scholar] [CrossRef]
  103. Mcpherson, B.E.G.; Young, R. Understanding the Challenges of municipal tree planting. Arborist News 2010, 19, 60–62. [Google Scholar]
  104. Pei, N.; Wang, C.; Jin, J.; Jia, B.; Chen, B.; Qie, G.; Qiu, E.; Gu, L.; Sun, R.; Li, J.; et al. Long-term afforestation efforts increase bird species diversity in Beijing, China. Urban For. Urban Green. 2018, 29, 88–95. [Google Scholar] [CrossRef]
  105. Lepczyk, C.A.; Aronson, M.F.J.; Evans, K.L.; Goddard, M.A.; Lerman, S.B.; MacIvor, J.S. Biodiversity in the City: Fundamental Questions for Understanding the Ecology of Urban Green Spaces for Biodiversity Conservation. Bioscience 2017, 67, 799–807. [Google Scholar] [CrossRef] [Green Version]
  106. Carrus, G.; Scopelliti, M.; Lafortezza, R.; Colangelo, G.; Ferrini, F.; Salbitano, F.; Agrimi, M.; Portoghesi, L.; Semenzato, P.; Sanesi, G. Go greener, feel better? The positive effects of biodiversity on the well-being of individuals visiting urban and peri-urban green areas. Landsc. Urban Plan. 2015, 134, 221–228. [Google Scholar] [CrossRef]
  107. Konijnendijk, C.C.; Nilsson, K.; Randrup, T.B.; Schipperijn, J. Urban Forests and Trees: A Reference Book; Springer: New York, NY, USA, 2005; ISBN 9788578110796. [Google Scholar]
  108. Rosati, L.; Fipaldini, M.; Marignani, M.; Blasi, C. Effects of fragmentation on vascular plant diversity in a Mediterranean forest archipelago. Plant Biosyst. Int. J. Deal. All Asp. Plant Biol. 2010, 144, 38–46. [Google Scholar] [CrossRef]
  109. Moser, D.; Zechmeister, H.G.; Plutzar, C.; Sauberer, N.; Wrbka, T.; Grabherr, G. Landscape space complexity as an effective measure for plant species richness in rural landscapes. Landsc. Ecol. 2002, 17, 657–669. [Google Scholar] [CrossRef]
  110. Sun, R.; Chen, L. Effects of green space dynamics on urban heat islands: Mitigation and diversification. Ecosyst. Serv. 2017, 23, 38–46. [Google Scholar] [CrossRef]
  111. Ekkel, E.D.; de Vries, S. Nearby green space and human health: Evaluating accessibility metrics. Landsc. Urban Plan. 2017, 157, 214–220. [Google Scholar] [CrossRef]
  112. Nowak, D.J.; Hirabayashi, S.; Doyle, M.; McGovern, M.; Pasher, J. Air pollution removal by urban forests in Canada and its effect on air quality and human health. Urban For. Urban Green. 2018, 29, 40–48. [Google Scholar] [CrossRef]
  113. Lohr, V.I.; Pearson-Mims, C.H.; Tarnai, J.; Dillman, D.A. How urban residents rate and rank the benefits and problems associated with trees in cities. J. Arboric. 2004, 30, 28–35. [Google Scholar]
  114. Markevych, I.; Ludwig, R.; Baumbach, C.; Standl, M.; Heinrich, J.; Herberth, G.; de Hoogh, K.; Pritsch, K.; Weikl, F. Residing near allergenic trees can increase risk of allergies later in life: LISA Leipzig study. Environ. Res. 2020, 191. [Google Scholar] [CrossRef]
  115. Trac, C.J.; Francisco, S.; Schmidt, A.H.; Hinckley, T.M. Is the Returning Farmland to Forest Program a Success? Three Case Studies from Sichuan. Environ. Pract. 2015, 15, 350–366. [Google Scholar] [CrossRef] [PubMed] [Green Version]
  116. Liyan, W.; Herzberger, A.; Liyun, Z.; Yi, X.; Yaqing, W.; Yang, X.; Jianguo, L.I.U. Spatial and Temporal Changes of Arable Land Driven by Urbanization and Ecological Restoration in China. Chin. Geogr. Sci. 2018, 28, 1–11. [Google Scholar]
  117. Chen, A.; He, H.; Wang, J.; Li, M.; Guan, Q.; Hao, J. A study on the arable land demand for food security in China. Sustainability 2019, 11, 4769. [Google Scholar] [CrossRef] [Green Version]
  118. Storkey, J.; Meyer, S.; Still, K.S.; Leuschner, C. The impact of agricultural intensification and land-use change on the European arable flora. Proc. R. Soc. B Biol. Sci. 2012, 279, 1421–1429. [Google Scholar] [CrossRef]
  119. Fanfarillo, E.; Latini, M.; Iberite, M.; Bonari, G.; Nicolella, G.; Rosati, L.; Salerno, G.; Abbate, G. The segetal flora of winter cereals and allied crops in Italy: Species inventory with chorological, structural and ecological features. Plant Biosyst. 2020, 154, 935–946. [Google Scholar] [CrossRef]
  120. Liu, Y.; Duan, M.; Yu, Z. Agricultural landscapes and biodiversity in China. Agric. Ecosyst. Environ. 2013, 166, 46–54. [Google Scholar] [CrossRef]
  121. Yan, Y.H.; Yu, Y.; Du, X.G.; Zhao, B.G. Conservation and augmentation of natural enemies in pest management of Chinese apple orchards. Agric. Ecosyst. Environ. 1997, 63, 253–260. [Google Scholar] [CrossRef]
  122. Martínez-Sastre, R.; Miñarro, M.; García, D. Animal biodiversity in cider apple orchards: Simultaneous environmental drivers and effects on insectivory and pollination. Agric. Ecosyst. Environ. 2020, 295. [Google Scholar] [CrossRef]
  123. McClure, S.B. Domesticated animals and biodiversity: Early agriculture at the gates of Europe and long-term ecological consequences. Anthropocene 2013, 4, 57–68. [Google Scholar] [CrossRef]
  124. Montoya, D.; Gaba, S.; de Mazancourt, C.; Bretagnolle, V.; Loreau, M. Reconciling biodiversity conservation, food production and farmers’ demand. bioRxiv 2018, 416. [Google Scholar] [CrossRef]
  125. Robbins, A.S.T.; Harrell, S. Paradoxes and challenges for China’s forests in the reform era. China Q. 2014, 218, 381–403. [Google Scholar] [CrossRef] [Green Version]
  126. Kechebour, B. El Modelling of Assessment of the Green Space in the Urban Composition. Procedia Soc. Behav. Sci. 2015, 195, 2326–2335. [Google Scholar] [CrossRef] [Green Version]
  127. Tian, Y.; Jim, C.Y.; Tao, Y.; Shi, T. Landscape ecological assessment of green space fragmentation in Hong Kong. Urban For. Urban Green. 2011, 10, 79–86. [Google Scholar] [CrossRef]
  128. Madsen, L.M. The Danish afforestation programme and spatial planning: New challenges. Landsc. Urban Plan. 2002, 58, 241–254. [Google Scholar] [CrossRef]
  129. Wolch, J.R.; Byrne, J.; Newell, J.P. Urban green space, public health, and environmental justice: The challenge of making cities “just green enough”. Landsc. Urban Plan. 2014, 125, 234–244. [Google Scholar] [CrossRef] [Green Version]
  130. Kupfer, J.A. Landscape ecology and biogeography: Rethinking landscape metrics in a post-FRAGSTATS landscape. Prog. Phys. Geogr. 2012, 36, 400–420. [Google Scholar] [CrossRef]
  131. Nowak, D.J.; Crane, D.E. Carbon storage and sequestration by urban trees in the USA. Environ. Pollut. 2002, 116, 381–389. [Google Scholar] [CrossRef]
  132. Nowak, D.J.; Crane, D.E.; Stevens, J.C. Air pollution removal by urban trees and shrubs in the United States. Urban For. Urban Green. 2006, 4, 115–123. [Google Scholar] [CrossRef]
  133. Akbari, H.; Pomerantz, M.; Taha, H. Cool surfaces and shade trees to reduce energy use and improve air quality in urban areas. Sol. Energy 2001, 70, 295–310. [Google Scholar] [CrossRef]
Figure 1. (A) Layout of Beijing Plain Area Afforestation Project (BPAP). The left panel showed the sketched BPAP map, which consisted of four green strategies [74]; the gray polygons referred to the urban greenspace in 2009. The right panels showed the planning objectives of four green strategies (i.e., green wedges, greenbelts, green rings, and green corridors). All BPAP data are from Beijing Gardening and Greening Bureau. (B) Spatial distribution of forest resources in 2009 and 2015. The new afforestation indicates the new trees planted during the implementation of BPAP.
Forests 12 00316 g001
Figure 2. Plain area location and sub-regions. Proportion of non-forest was based on the Beijing Forestry Inventory (2009), and the non-forest land included cropland, other land, unused land, and waterbodies [84].
Forests 12 00316 g002
Figure 3. Diagrammatic illustration of three landscape expansion models adapted from Forman and Liu [67,87]. The greenspace expansion belongs to infilling, edge expansion, and outlying mode when LEI ≥ 0.5, < 0.5, and 0, respectively.
Forests 12 00316 g003
Figure 4. Sankey diagram for patch mosaic transition in the entire plain area in 2009 (before afforestation), 2012, 2013, 2014, and 2015. Stacked vertical bars with different colors indicated the relative area proportion for each patch type, i.e., percentage of landscape (PLAND), in the corresponding year. Grey flows between stacked bars showed the patch type transitions from one year to the next, with width indicating the transition percent between two patch mosaics. The proportion (%) of each patch type in the total landscape in each year was also labeled. The corresponding four period landscape transition matrices can be found in Table A1.
Forests 12 00316 g004
Figure 5. Sankey diagram of patch size class transition for urban greenspace (including forest, parks, wetlands, and vacant lots) in 2009, 2012, 2013, 2014 and 2015. The stacked vertical bars with different colors indicated the relative proportion of each patch size class in the corresponding year. The grey flows between stacked bars showed the different patch size class transitions, with the width representing the transition percent between two size classes. The proportion (%) of land area of each patch size class in the corresponding year was also labeled. The corresponding four period patch size transition matrices can be found in Table A2.
Forests 12 00316 g005
Figure 6. Changes in class-, i.e., percentage of landscape (PLAND, an increased value indicates the relative increased area of corresponding patch type), number of patches (NP, if the total area of corresponding patch type is held constant or decreasing, an higher value indicates higher fragmentation), mean patch size (MPS, an increased value indicates less fragmentation), area weighted mean shape index (AWMSI, an increased value indicates the patch shapes become more irregular), and landscape-level, i.e., contagion (CONTAG, an decreased value indicates the distribution of all patches become more fragmented), indices from 2009 to 2015 in the entire plain area (a), the first greenbelt (b), the second greenbelt (c) and the subregion area (d). The vertical and horizontal axes indicated the landscape indices and patch types, respectively; dot size represented the absolute value of change; green and brown indicated increase and decease, respectively, while white indicated no change from 2009 to 2015; dots with black outlines indicated urban greenspace (i.e., forest, parks, wetlands, vacant lots). The value of change was indicated below each dot.
Forests 12 00316 g006
Figure 7. Maps of urban greenspace landscape expansion types (i.e., infilling, edge expansion, outlying) in 240 m distances during the process of afforestation in 2009−2013, 2012−2013, 2013−2014, 2014−2015. The proportions of each landscape expansion type were also listed on the top of each panel.
Forests 12 00316 g007
Table 1. Patch mosaics created by the categorical datasets from Beijing Forestry Inventory database (BFI, 2009), Beijing Urban Park Inventory database (BUPI, 2009), wetlands census data (2009), and the geodatabase of Beijing Plain Afforestation Project (BPAP, 2012–2015).
Patch TypesDescriptionDatabase
Urban greenspaceForestIncluding coniferous forests, broad-leaf forests, mixed forests, national protective forests, other shrublands, young afforested lands, enclosed young afforested lands [90], auxiliary production forest lands, and the new forest areaBFI, BPAP
ParksParksBUPI, BPAP
WetlandsWetlandsWetlands census data, BPAP
Vacant lotsLand suitable for afforestation [91], including cut-over forest, burned forest and other non-stocked forestBFI
Other space CroplandsCroplandBFI
Waterbodies WaterbodyBFI
Other landIncluding all urban built-up area and other impervious areaBFI
Unused landUnproductive non-forest land or lands are not suitable for afforestationBFI
Table 2. List of selected landscape metrics from Fragstats version 4.2 [96,98].
Abbreviation Landscape Metrics UnitRangeExplanation
PLANDPercentage of landscapePercent0% < PLAND < 100%Proportion of the corresponding patch type in total landscape
NPNumber of patches NoneNP ≥ 1, without limitIt measures the division of the corresponding patch type. Increased NP in the constant landscape area refers to increased fragmentation
MPSMean patch sizeHectaresMPS > 0, without limitIt measures the fragmentation of the corresponding patch type. Increased MPS in a constant landscape refers to decreased fragmentation
AWMSIArea-weighted mean shape index NoneAWMSI ≥ 1, without limitIt measures the complexity of patch shape. Higher AWMSI indicated more irregular patches
CONTAGContagion indexPercent0% < CONTAG ≤ 100%It measures the fragmentation of total landscape and is related to the interspersion of patches. A higher CONTAG refers to a less fragmented landscape with relatively large patches
Table 3. Planned new greenspace area and actual new greenspace growth area after the implementation of afforestation. “YES” and “NO” indicated an actual greenspace growth area over and under the planned area, respectively; while “NEW” indicated new greenspace growth not included in the master planning.
Green StrategiesPlanned Area (ha)Actual Growth Area (ha)Achieved (ha)
Nine green wedges29,28030,141YES
Three greenbelts12,0876,331NO
Two green rings14,3272,962NO
Multiple green corridors10,98014,011YES
Other area-17,266NEW
Total66,67470,711YES
Table 4. Potential applications of several spatial analysis.
MethodsIndicatorsPotential ApplicationsSoftware
Landscape transition detectionPercentage of landscapeMeasures the exact quantity, scale and direction of greenspace growth and transition to provide references for the program optimization and adjustment strategies.ArcGIS
RStudio
Individual patch size
Spatial pattern analysisMean patch sizeMeasures the fragmentation of greenspace to evaluate the potential impacts on urban biodiversity and ecosystem services.Fragstats
RStudio
Area-weighted mean shape indexMeasures the shape of greenspace patches to identify the potential impacts on organismal activities (e.g., migration and predation)
Landscape expansion analysisLandscape expansion indexMeasures the process of greenspace expansion to detect the growth mechanisms of inner-city afforestation, and to evaluate whether the greenspace patterns were arranged as initially planned.ArcGIS
RStudio
Publisher’s Note: MDPI stays neutral with regard to jurisdictional claims in published maps and institutional affiliations.

