Article

Transcriptome Analysis for Fraxinus mandshurica Rupr. Seedlings from Different Carbon Sequestration Provenances in Response to Nitrogen Deficiency

1
Key Laboratory of Saline-Alkaline Vegetation Ecology Restoration (SAVER), Ministry of Education, Northeast Forestry University, Harbin 150040, China
2
Life Science College, Northeast Forestry University, Xiangfang Distract, Hexing road No.26, Harbin 150040, China
*
Author to whom correspondence should be addressed.
Forests 2021, 12(2), 257; https://doi.org/10.3390/f12020257
Submission received: 28 January 2021 / Revised: 19 February 2021 / Accepted: 19 February 2021 / Published: 23 February 2021
(This article belongs to the Special Issue Forest Genomics and Transcriptomics)

Abstract

:
To explore the molecular regulatory mechanism of high-carbon (C) sequestration Fraxinus mandshurica Rupr. (F. mandshurica) provenance and the expression profile of F. mandshurica during nitrogen (N) starvation, the foliage and roots of the annual Wuchang (WC) seedlings with greater C amount and Hailin (HL) seedlings with smaller C amount, which were grown in N-deficient nutrition and complete N, were used for RNA-seq and physiological determination, respectively. One thousand and fifty-seven differentially expressed genes (DEGs) between WC and HL and 8173 DEGs related to N deficiency were identified, respectively. The root of F. mandshurica responded to N deficiency more strongly than foliar. The target genes that responded to N deficiency in roots were mainly regulatory genes (transcription factors, hormones and protein kinases), and their response patterns were upregulated. The growth and N concentration in both WC and HL were reduced by the N deficiency, which might result from the decrease of the leaf Nitrate reductase (NR) and glutamine synthetase (GS) enzyme activity and ABA content, although the root-to-shoot ratio; lateral root number; lignin content; endogenous hormones content (GA, IAA and ZR); root GS and glutamate synthetase activity and transcriptional level of most of the regulatory genes were increased. The C sequestration capacity in WC was greater than that in HL, which related to the higher GS enzymes activity and transcriptional levels of regulatory genes and metabolic genes (terpenes, carbohydrates, and lipid energy). However, the C sequestration advantage of WC was significantly reduced by the N deficiency, which was due to the smaller response to N deficiency compared to HL.

1. Introduction

Numerous studies indicate that many traits have extensive genetic differences between different provenances, such as the density fluctuations, the growth and stem formation [1], radial growth [2] and terpenoid patterns in the needles. Brynjar Skulason et al. found that subalpine fir (Abies lasiocarpa) provenances showed significant differences for all measured traits [3]. In the past, studies on the differences in provenances of forest trees were mainly focused on the growth traits [4,5], physiological and biochemical traits [6], the fitting growth model [7,8] and the identification of molecular markers related to the provenance [9]. However, there were few reports on the differences in the gene transcriptional expression between provenances. Some researchers believe that the differences between provenances are mainly determined by genetic factors [10,11], while others believe that they are mainly caused by the environmental factors, such as soil [12], climate [13,14], temperature [15], etc. In addition, the effects of nutrition on provenance growth have also been extensively studied. Xabier Santiso et al. found that there is only a small difference among Arbutus unedo L. provenances under nitrogen (N) nutrition stress [16]. However, significant differences in growth between different provenances after treatment with nutrition were detected for Picea abies Karst. and Fagus sylvatica L [4].
N is one of the essential nutrients in plant growth and development [17,18]. It is an important component of many macromolecules, including proteins and several plant hormones. Plants often suffer from N deficiency. Fertilization will not only increase the cost of production but also cause environmental pollution. Therefore, it is very important to develop or breed low N tolerant varieties. N in the soil is first absorbed by nitrate transporters (NRTs) and ammonium transporters (AMTs) in an active transport manner in roots. Nitrate is reduced to ammonium by nitrate reductase (NR) and nitrite reductase (NiR), and then, ammonium is transferred to the carbon (C) skeleton to form glutamic acid by glutamine synthetase (GS) and glutamate synthetase (GOGAT). An N deficiency not only affects N metabolism but also C metabolism, such as sucrose phosphate synthase (SPS), sucrose synthase (SS) and soluble acid invertase (AI). In addition, phytohormones also play an important role in N deficiency, especially cytokinins. The more N metabolism we understand, the more tools to increase tolerance to N deficiency in plants we have. Many researchers have conducted extensive and in-depth research on N deficiency in many species from growth, yield, physiology and biochemistry, genes and transcriptional regulation. With the increased accuracy and reduced cost of high-throughput sequencing technologies, RNA-Seq has been used in a growing number of species. RNA-Seq can identify many N deficiency-related genes [19,20] and reveal the mechanism of N deficiency tolerance from the transcriptional expression of genes. However, an RNA-Seq analysis of the differences between Fraxinus mandshurica Rupr. (F. mandshurica) provenances under N deficiency has not been reported yet.
F. mandshurica is distributed in the northwest and northeast of China, the Russian Far East, the northern part of the Korean Peninsula and northern Japan. It is a valuable hardwood species in the forest areas of northeast China. Since this species is distributed widely, the differences of the climate, soil and topography in the distribution area are significant and result in geographical and reproductive isolation. Under long-term natural selection, F. mandshurica becomes divided many provenances. The early research on the provenance of F. mandshurica was mainly carried out by the Jilin Forestry Research Institute, and recently, it has been mainly carried out by Northeast Forestry University. These studies were focused on a good provenance selection based on growth traits in past, but a study on the selection of good provenances based on C sequestration was reported by our research group recently [21]. The C sequestration characteristics of 20 F. mandshurica provenances seedlings were classified into high, middle and low C sequestration groups. Especially, the C amount of the Wuchang (WC) provenance seedlings is 31.20% greater than that of the Hailin (HL). In this study, to explore the mechanism of high C sequestration provenance, the annual WC seedlings with greater C amount and HL seedlings with less C amount were used for RNA-seq determination. What is more, to identify the genes associated with N deficiency in F. mandshurica and explore the differences between WC and HL in response to N deficiency, the two provenance seedlings treated with N deficiency were also used for RNA-seq determination.

2. Materials and Methods

2.1. Plant Cultivation, Nitrogen Treatment, Harvesting and Determination of Dry Weight

After obtaining approval from the owner of the orchard, the F. mandshurica seeds with high C sequestration (Wu Chang, WC) and low C sequestration (Hai Lin, HL) were obtained from the Qingshan Forest Seed Orchard of the Weihe Forestry Bureau and the Hailin Forestry Bureau of Heilongjiang Province, respectively. At May 20th, the seeds were transplanted in plastic pots (800 mm × 400 mm) filled with soil, soil composition and proportion volume (nutritional soil): volume (meteorite) = 3:1, and the incubator was adjusted to maintain the temperature and humidity at 23 ± 2 °C and 60%~80%, along with the fluorescent lamp to ensure sunshine 16 h in length. The seedlings were transplanted in plastic pots (100 mm diameter) filled with fine sand on 30 days after sowing, a pot a tree. The sand was soaked with a solution of 1 M hydrochloric acid for 4 h and then washed with distilled water until the pH of the aqueous solution of sand was 6.5. Two provenances seedlings were divided into three groups with 10 seedlings for each group and were provided with modified LA solution (0.5 mM KCl, 0.9 mM CaCl2, 0.3 mM MgSO4, 0.6 mM KH2PO4, 42 μM KH2PO4,10 μM Fe-EDTA, 2 μM MnSO4, 10 μM H3BO3, 7 μM Na2MoO4, 0.2 μM ZnSO4, 0.05 μM COSO4, and 0.2 μM CuSO4) containing 0 (N deficiency) or 1000 (complete N) μM NH4NO3, respectively, and the nutrient solution was adjusted to pH 5.5. The LA solution was added every 2 days with 1000 mL until 20 August. The roots and foliage samples used for cDNA library construction were collected on 30 days after treatment and each sample was composed of a mixture of 9 trees. All seedlings were measured fresh weight and three seedlings in each group was selected to dry in an oven at 70 °C until the dry weight of the seedlings no longer changed, and the dry weight was record. The dry weight of all seedlings was calculated by multiplying their fresh weight by the ratio of the dry weight to the fresh weight of seedlings dried. The other samples were frozen in liquid nitrogen immediately upon collection and stored at −80 °C.

2.2. cDNA Library Construction and Sequencing

Total RNA was extracted by the Trizol (Invitrogen, Thermo Fisher Scientific Inc., Waltham, MA, USA) method and total RNA concentration was determined by Nanodrop 2000 (Thermo Fisher Scientific, Wilmington, DE, USA). The RNA integrity number (RIN) by Agilent 2100 for assessing RNA quality. Total RNA was extracted from the 8 samples separately with 3 duplications, 24 RNA samples. After total RNA was extracted, mRNA was enriched by Oligo (dT) beads (Epicentre, Madison, WI, USA). Then the enriched mRNA was fragmented into short fragments using fragmentation buffer and reverse-transcripted into cDNA with random primers. Second-strand cDNA were synthesized by DNA polymerase I, RNase H, dNTP and buffer. Then the cDNA fragments were purified with QiaQuick PCR extraction kit, end repaired, poly(A) added, and ligated to Illumina sequencing adapters. The ligation products were size selected by agarose gel electrophoresis, PCR amplified, and sequenced using Illumina HiSeqTM 4000 by Gene Denovo Biotechnology Co. (Guangzhou, China).

2.3. De Novo cDNA Assembly and Functional Annotation

To obtain clean reads, sequencing adaptors and low-quality reads were removed from each library. Transcriptome de novo assembly was carried out with short reads assembling program–Trinity. All raw read data were deposited in the Sequence Read Archive (SRA) in NCBI with the BioProject ID: PRJNA550459. The unigene expression was calculated and normalized to reads per kb per million reads (RPKM). Basic annotation of unigenes includes protein functional annotation, pathway annotation, COG/KOG functional annotation and Gene Ontology (GO) annotation. To annotate the unigenes, we used BLASTx program (http://www.ncbi.nlm.nih.gov/BLAST/), accessed on 28 January 2021, with an E-value threshold of 1e−5 to NCBI non-redundant protein (Nr) database (http://www.ncbi.nlm.nih.gov), 28 January 2021, the SwissProt protein database (http://www.expasy.ch/sprot), 28 January 2021, the Kyoto Encyclopedia of Genes and Genomes (KEGG) database (http://www.genome.jp/kegg), 28 January 2021, and the COG/KOG database (http://www.ncbi.nlm.nih.gov/COG), 28 January 2021. Protein functional annotations could then be obtained according to the best alignment results.

2.4. Differential Gene Expression Analysis

Each of the 24 F. mandshurica cDNA libraries was aligned separately to the transcriptome assemblies using Bowtie [22]. The counting of alignments was estimated using the RSEM package. The RPKM method was then used to calculate the numbers of differentially expressed genes (DEGs) from pairwise comparisons of treatment group (N deficiency) vs. control group (complete N) and HL vs. WC. For the sake of brevity, WCKF, WCKR, HCKF, HCKR indicate cDNA libraries of the Wuchang provenance foliage, Wuchang provenance roots, Hailin provenance foliage, Hailin provenance roots under complete N, respectively. WTF, WTR, HTF, HTR indicate cDNA libraries of the Wuchang provenance foliage, Wuchang provenance roots, Hailin provenance foliage, Hailin provenance roots under N deficiency, respectively. From the biological replicates in this study, DESeq implemented in R package was used to analyze the differential expression between two groups. p values were adjusted using the Benjamini-Hochberg approach to control the false discovery rate (FDR). Genes with an adjusted p-value < 0.05 found by DESeq were usually identified as DEGs. However, genes with FDR < 0.01 and Fold Change (FC) ≥2 served as standards in the screening, and FC represents the specific value between two samples.
KEGG is the major public pathway-related database. Pathway enrichment analysis identified significantly enriched metabolic pathways or signal transduction pathways in DEGs comparing with the whole genome background. All DEGs were first mapped to pathways in KEGG database, then gene numbers were calculated for every pathway. Next, significantly enriched KEGG pathways within the set of DEGs obtained as described above were compared to the genome background using a hyper geometric test to determine a p-value. The calculated p-value was then subjected to a false discovery rate (FDR) correction, taking FDR ≤ 0.05 as a cutoff value of suitability [23]. Pathways meeting this condition were defined as significantly enriched pathways for the set of DEGs under scrutiny.

2.5. Quantitative Real-Time PCR Analysis

Total RNA was extracted in triplicate from the eight samples of F. mandshurica (total of 24 samples) using Trizol® Reagent (Invitrogen, Thermo Fisher Scientific Inc.,USA), and then reversed transcribed into cDNA using a PrimeScript® RT reagent Kit (Takara, Dalian, China). Nine DEGs associated with provenances seedlings of F. mandshurica and six DEGs between complete N and N deficiency were selected to validate the transcriptome data using quantitative real-time PCR (Supplementary Materials: Table S1). The gene-specific primers for the nine unigene sequences were designed with Primer Premier 5 software, and the tubulin gene was used as an internal gene expression control. The amplifications were performed in 20 μL reactions consisting of 10 μL 2×TransStart® Green qPCR SuperMix (TransGen Biotech, Beijing, China), 0.8 μL of a mixture of the forward and reverse primers, 1.0-μL cDNA template, and 7.8 μL sterile dH2O. The amplifications were performed on an ABI Prism7500 real-time PCR system using the following quantitative real-time PCR program: 95 °C for 30 s, followed by 40 cycles of 95 °C for 5 s and 60 °C for 34 s. Each amplification reaction was performed in triplicate.

2.6. Determination of Phytohormone and LigninContent

From each treatment, the fully expanded leaves were selected for the indoleacetic acid (IAA), gibberellin (GA), zeatinriboside (ZR) and abscisic acid (ABA) analyses. For the method of extracting and measuring phytohormone content, please refer to He [24]. The method of extracting and measuring lignin content is the same as phytohormone.

2.7. Determination of the Content and Amount of C and N

The total N concentration was determined using the sulfuric acid-hydrogen peroxide digestion-Kjeldahl method. The total organic matter concentration was determined using the potassium dichromate oxidation-external heating method. The amounts of N and C were calculated by multiplying the dry weight using the concentration of N and C.

2.8. Determination of Physiological Traits

Chlorophyll content was determined using the alcohol extraction method [25]. The soluble sugar content was determined using the enthrone colorimetric method [26]. The free amino acids content was determined as described by Rosen with modifications [27]: 0.5 g fresh leaves or roots were boiled in 20 mL deionized water for 20 min. To remove the solid residue, the extraction solution was filtered with filter paper. To completely extract the remaining amino acids, the boiled solids were rinsed with distilled water 3 times, and the rinse solution was also filtered into the extraction solution. Finally, the volume of the extraction solution was adjusted to 100 mL with distilled water. Then, 0.5 mL extraction solution was added to 1 mL of the measurement solution containing 10 mM sodium acetate and 1.2% (m/v) ninhydrin. After boiling in water for 12 min, 5 mL 95% ethanol was added to the cooled reaction solution. To determine the free amino acid content, the absorbance of the mixed solution was determined at 570 nm.

2.9. Determination of Enzyme Activities

The determination of enzymes activity was divided into the extraction of crude enzymes solution and determination of enzyme activity. The difference in enzyme molecular size and physiological activity led to specific extraction and activity determination methods for each enzyme. The same extraction of crude enzyme solution from frozen tissues following the protocol of Frank et al. [28] and Norbert et al. [29] with slight modifications was used for determination of enzyme activity of both glutamine synthetase (GS) and NADH-GOGAT (EC 1.4.1.14) enzyme. Approximately 0.5 g tissue was ground to a fine powder with a mortar and pestle in liquid nitrogen. The powder was transferred to an ice-cold mortar containing 2 mL extraction buffer (100 mM Tris-HCl, pH 7.6, 1 mM EDTA, 1.0 mM MgCl2, 10 mM β-mercaptoethanol). The samples were incubated on ice for 15–30 min. Debris was removed from the sample by centrifugation at 10000 rpm for 10 min. The supernatant was assayed for GS activity, as described by Guiz et al. with slight modifications [30]. The total volume of the enzyme reaction solution was 2.5 mL (100 mM Tris-HCl, pH 7.8, 50 mM sodium glutamate, 5 mM hydroxylamine hydrochloride, 50 mM magnesium sulfate and 20 mM adenosine triphosphate). Next, 0.3 mL crude enzyme solution was added to start the reaction. After 20 min, 1.5 mL ferric chloride reaction solution (0.67 M ferric chloride, 0.37 M hydrochloric acid and 20% (w/v) trichloroacetic acid) was added to stop the reaction. The absorbance of the supernatant at 540 nm was measured after centrifugation (8000 rpm, 5 min).
The determination liquor of NADH-GOGAT enzyme activity consisted of 5 components: 20 mM L-glutamine (A), 100 mM α-ketoglutarate (B), 10 mM KCl (C), 25 mM Tris-HCl buffer pH 7.6 (D), and 3 mM NADH (now equipped and used now) (E). First, 0.05 mL B, 0.1 mL C and 1.95 mL D were added to the 4 mL centrifuge tube in 30 °C water for 5 min. To determine NADH-GOGAT activity, 0.2 mL E, 0.3 mL enzyme solution and 0.4 mL A were added to the reaction solution. The absorbance of the supernatant at 340 nm was measured and recorded, and when appropriate, it was poured back into the test tube in 30 °C water. The absorbance of the supernatant at 340 nm was measured and record at 340 nm again after 3 min, and the difference between the two absorbance was calculated.
Nitrate reductase (NR) crude enzyme solution was obtained by extracting 0.5 g fresh powder of roots or leaves in 4 mL phosphoric acid buffer (pH 8.7) containing 0.01 mM cysteine and 1 mM EDTA. After centrifugation (4000 rpm, 15 min at 4 °C), to determine the NR enzyme activity, 0.4 mL supernatant was added to 1.6 mL reaction solution (0.05 M KNO3 phosphate buffer and 1 mg/mL NADH) in 25 °C water for 30 min. To terminate the reaction, 1 mL 1% (w/v) yellow amine solution and then 1 mL 0.02% (w/v) naphthyl vinylamine solution were added to the reaction solution sequentially, and the color reaction was developed for 15 min. The absorbance of the supernatant at 540 nm was measured after centrifugation (4000 rpm, 5 min).

2.10. Statistical Analysis and Graphic Production

Analysis of variance, mean, mean error, and multiple comparisons were determined using SPSS19.0. Unless otherwise specified, all significance levels in this study were at the p < 0.05 level. The column charts in this study were drawn using origin8.0. Heat maps of gene expression were drawn with R: pheatmap.

3. Results

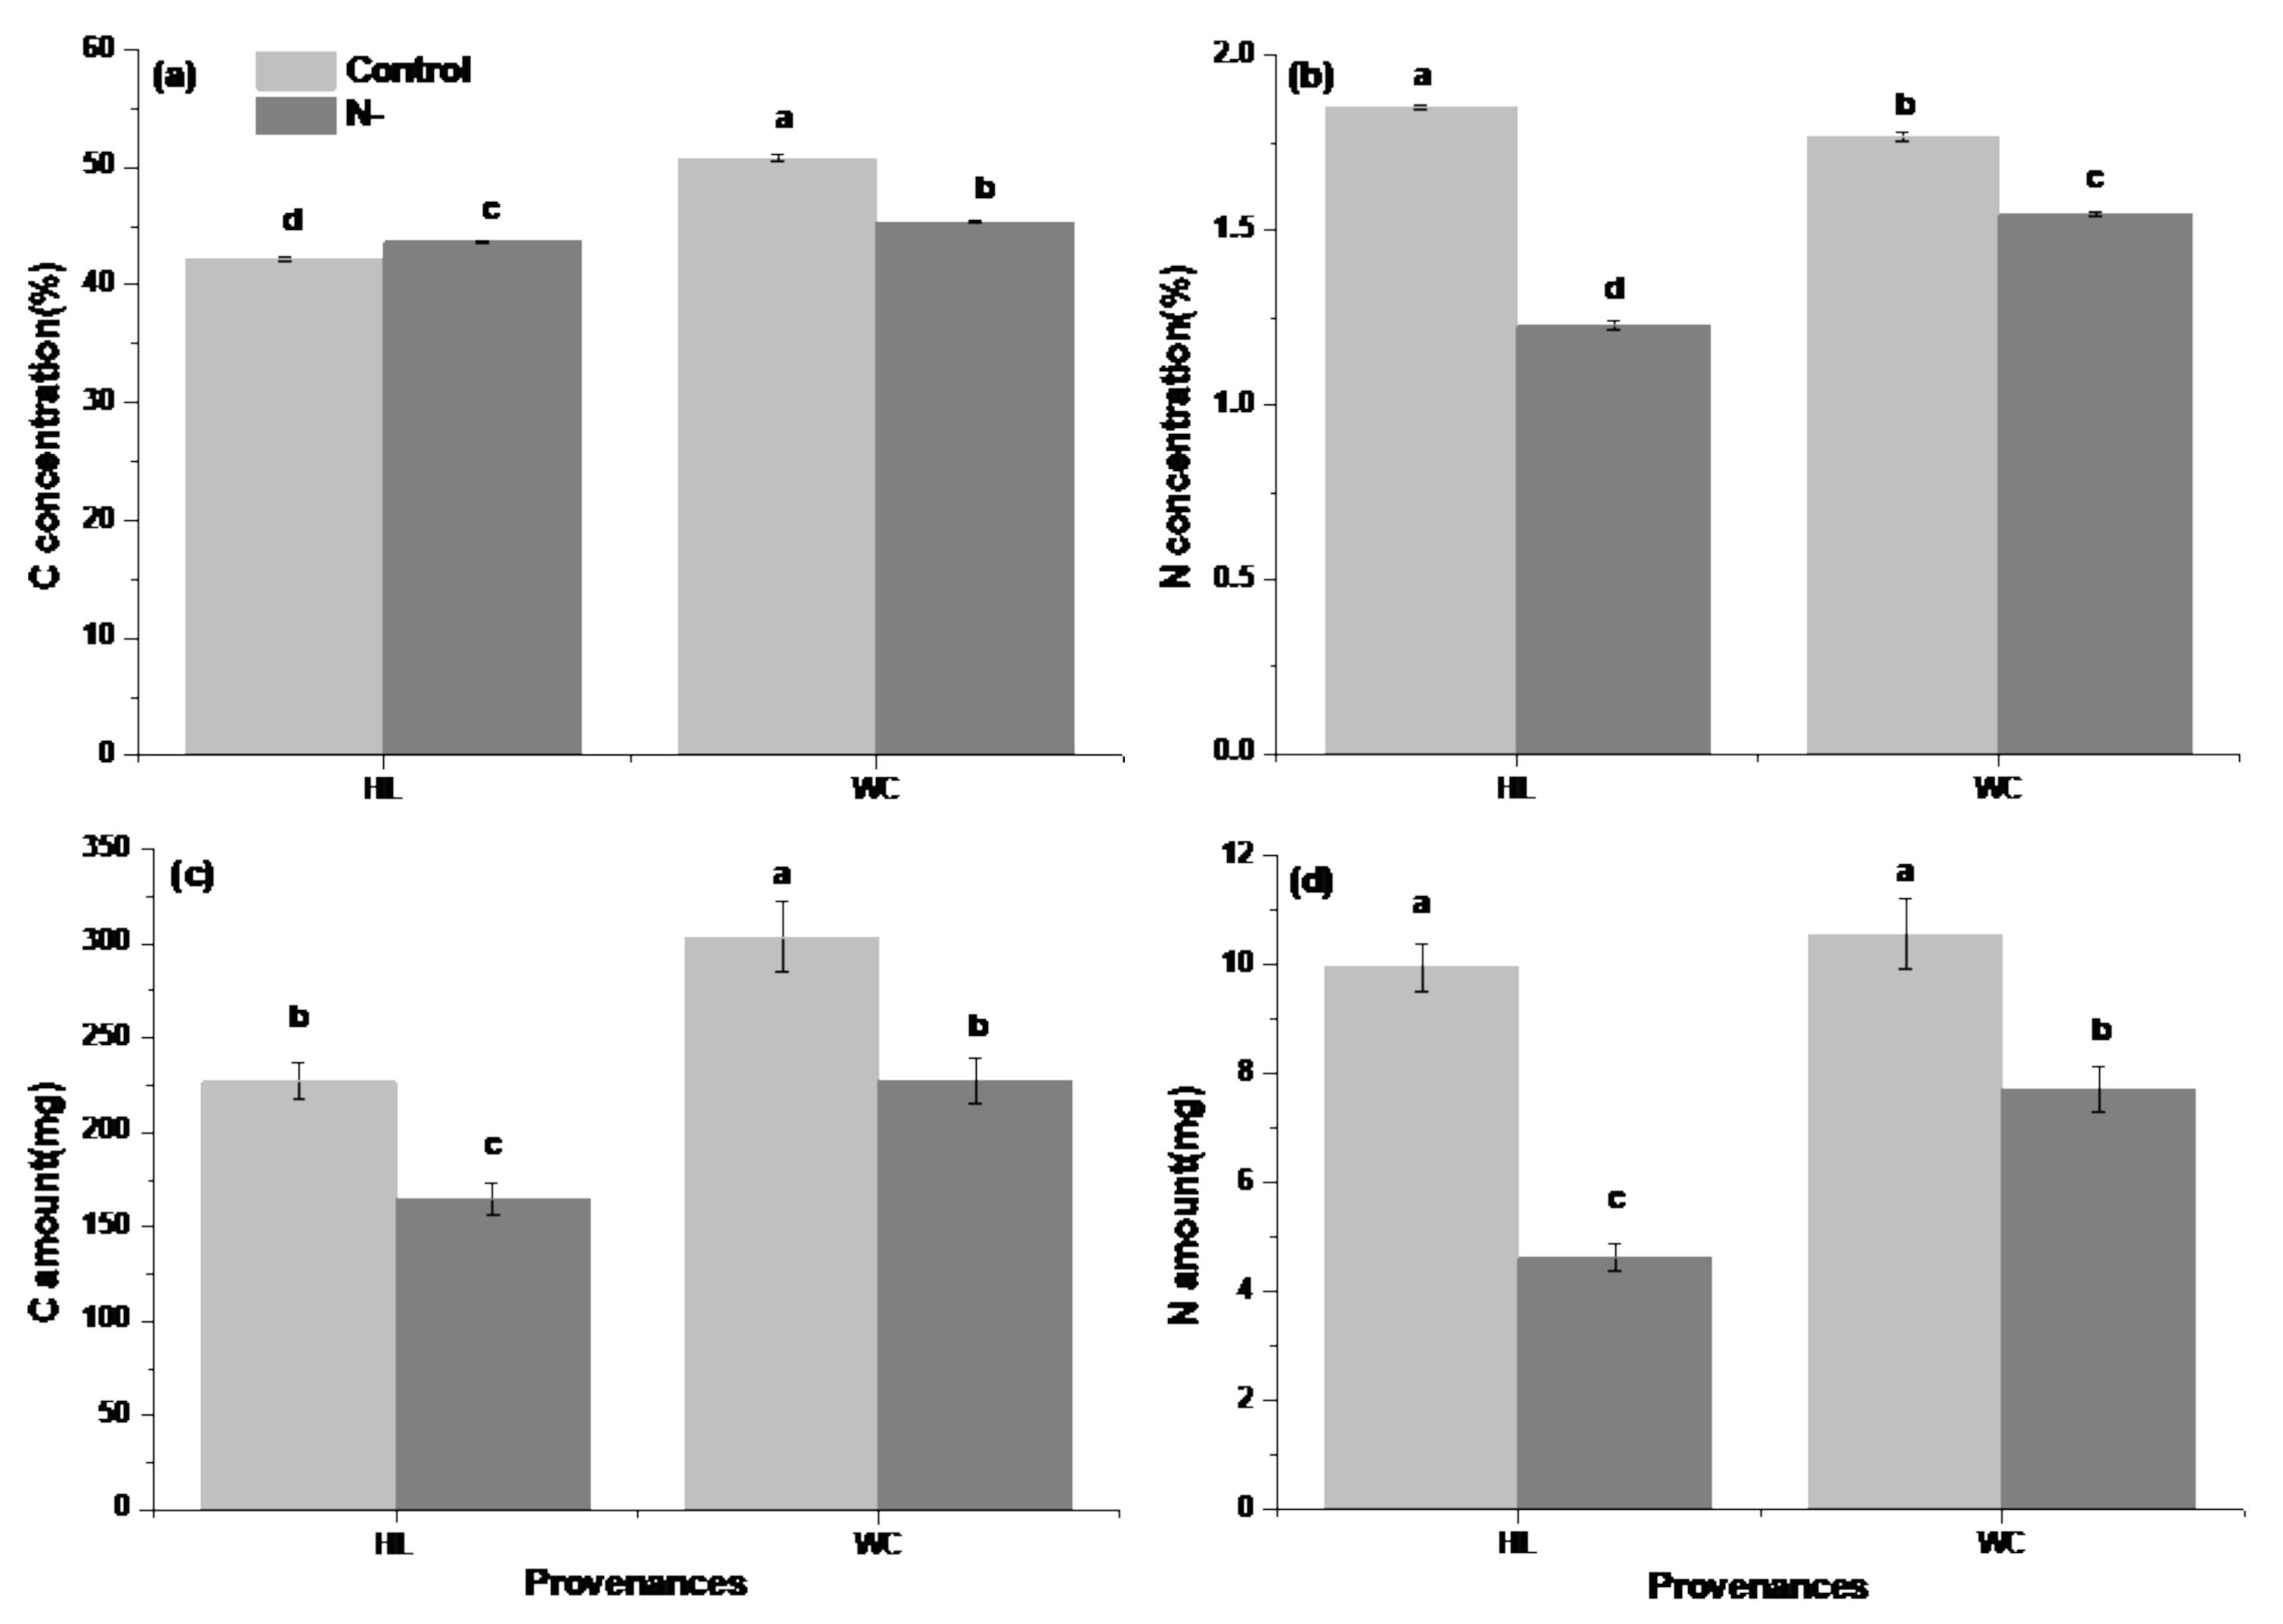
3.1. Analysis of Growth and Physiological Differences between Provenances

The C concentration and C amount in WC were significantly greater than that in HL under both complete N and N deficiency (Figure 1a,c), which related to the greater chlorophyll content (Supplementary Materials: Figure S1b) and more lateral root number (Supplementary Materials: Figure S1c) in WC. Compared to HL, the N concentration in WC was significantly smaller, but the N amount was greater, which was mainly due to the larger dry weight under complete N (Supplementary Materials: Figure S1a). The free amino acid content (Supplementary Materials: Figure S2c,d), glutamate synthase (GOGAT) activity and glutamine synthase (GS) activity (Figure S3) were greater in WC than HL under N deficiency, which led to WC with a larger N concentration and N amount compared to HL. The N deficiency increased the C concentration in HL but decreased in WC. The N concentration, N amount and C amount in the two provenances were decreased by N deficiency.
N deficiency not only reduced the biomass but also weakened the physiological metabolism. For example, dry weight and chlorophyll content was reduced by N deficiency and HL decreased more than WC, but the number of lateral roots was increased by N deficiency and the increase of HL was greater than WC, indicating that the response intensity in HL to N deficiency was greater than that in WC (Supplementary Materials: Figure S1). N deficiency reduced the free amino acid content and WC decreased more greatly, but increased the soluble sugar content and HL increased more (Supplementary Materials: Figure S2). Although the N metabolism enzyme activities (GS, GOGAT and NR) were increased in root but decreased in leaf by N deficiency, whose variation range in HL was greater than that in WC.

3.2. RNA-Seq and de Novo Transcriptome Assembly

To obtain an overall view on the N deficiency transcriptome in the two F. mandshurica provenances, RNA samples were prepared on 30 days after N deficiency. RIN values indicated that RNA quality can be used for cDNA library construction (Supplementary Materials: Table S2). Gene expression profiles of the high C sequestration provenance (WC) and low (HL) roots and foliage under complete N and N deficiency were analyzed. For the eight samples, three biological replicates were performed in sequencing. In total, 1,235,174,984 clean reads originated from the 24 F. mandshurica cDNA libraries were obtained following removal of adaptors and low-quality reads (Supplementary Materials: Table S3). Trinity software was then used to assemble the clean reads into 88,655 unigenes with N50 length of 1259 bp. In the final assemblies there were 48,754 unigenes ranging from 200 to 500 bp in length, which accounted for 55% of the total. There were 19,220 (21.68%) and 20,681 (23.33%) unigenes from 500 to 1000 bp and >1000 bp in length, respectively, and assembled sequences <200 bp were not taken into account (Supplementary Materials: Figure S4).

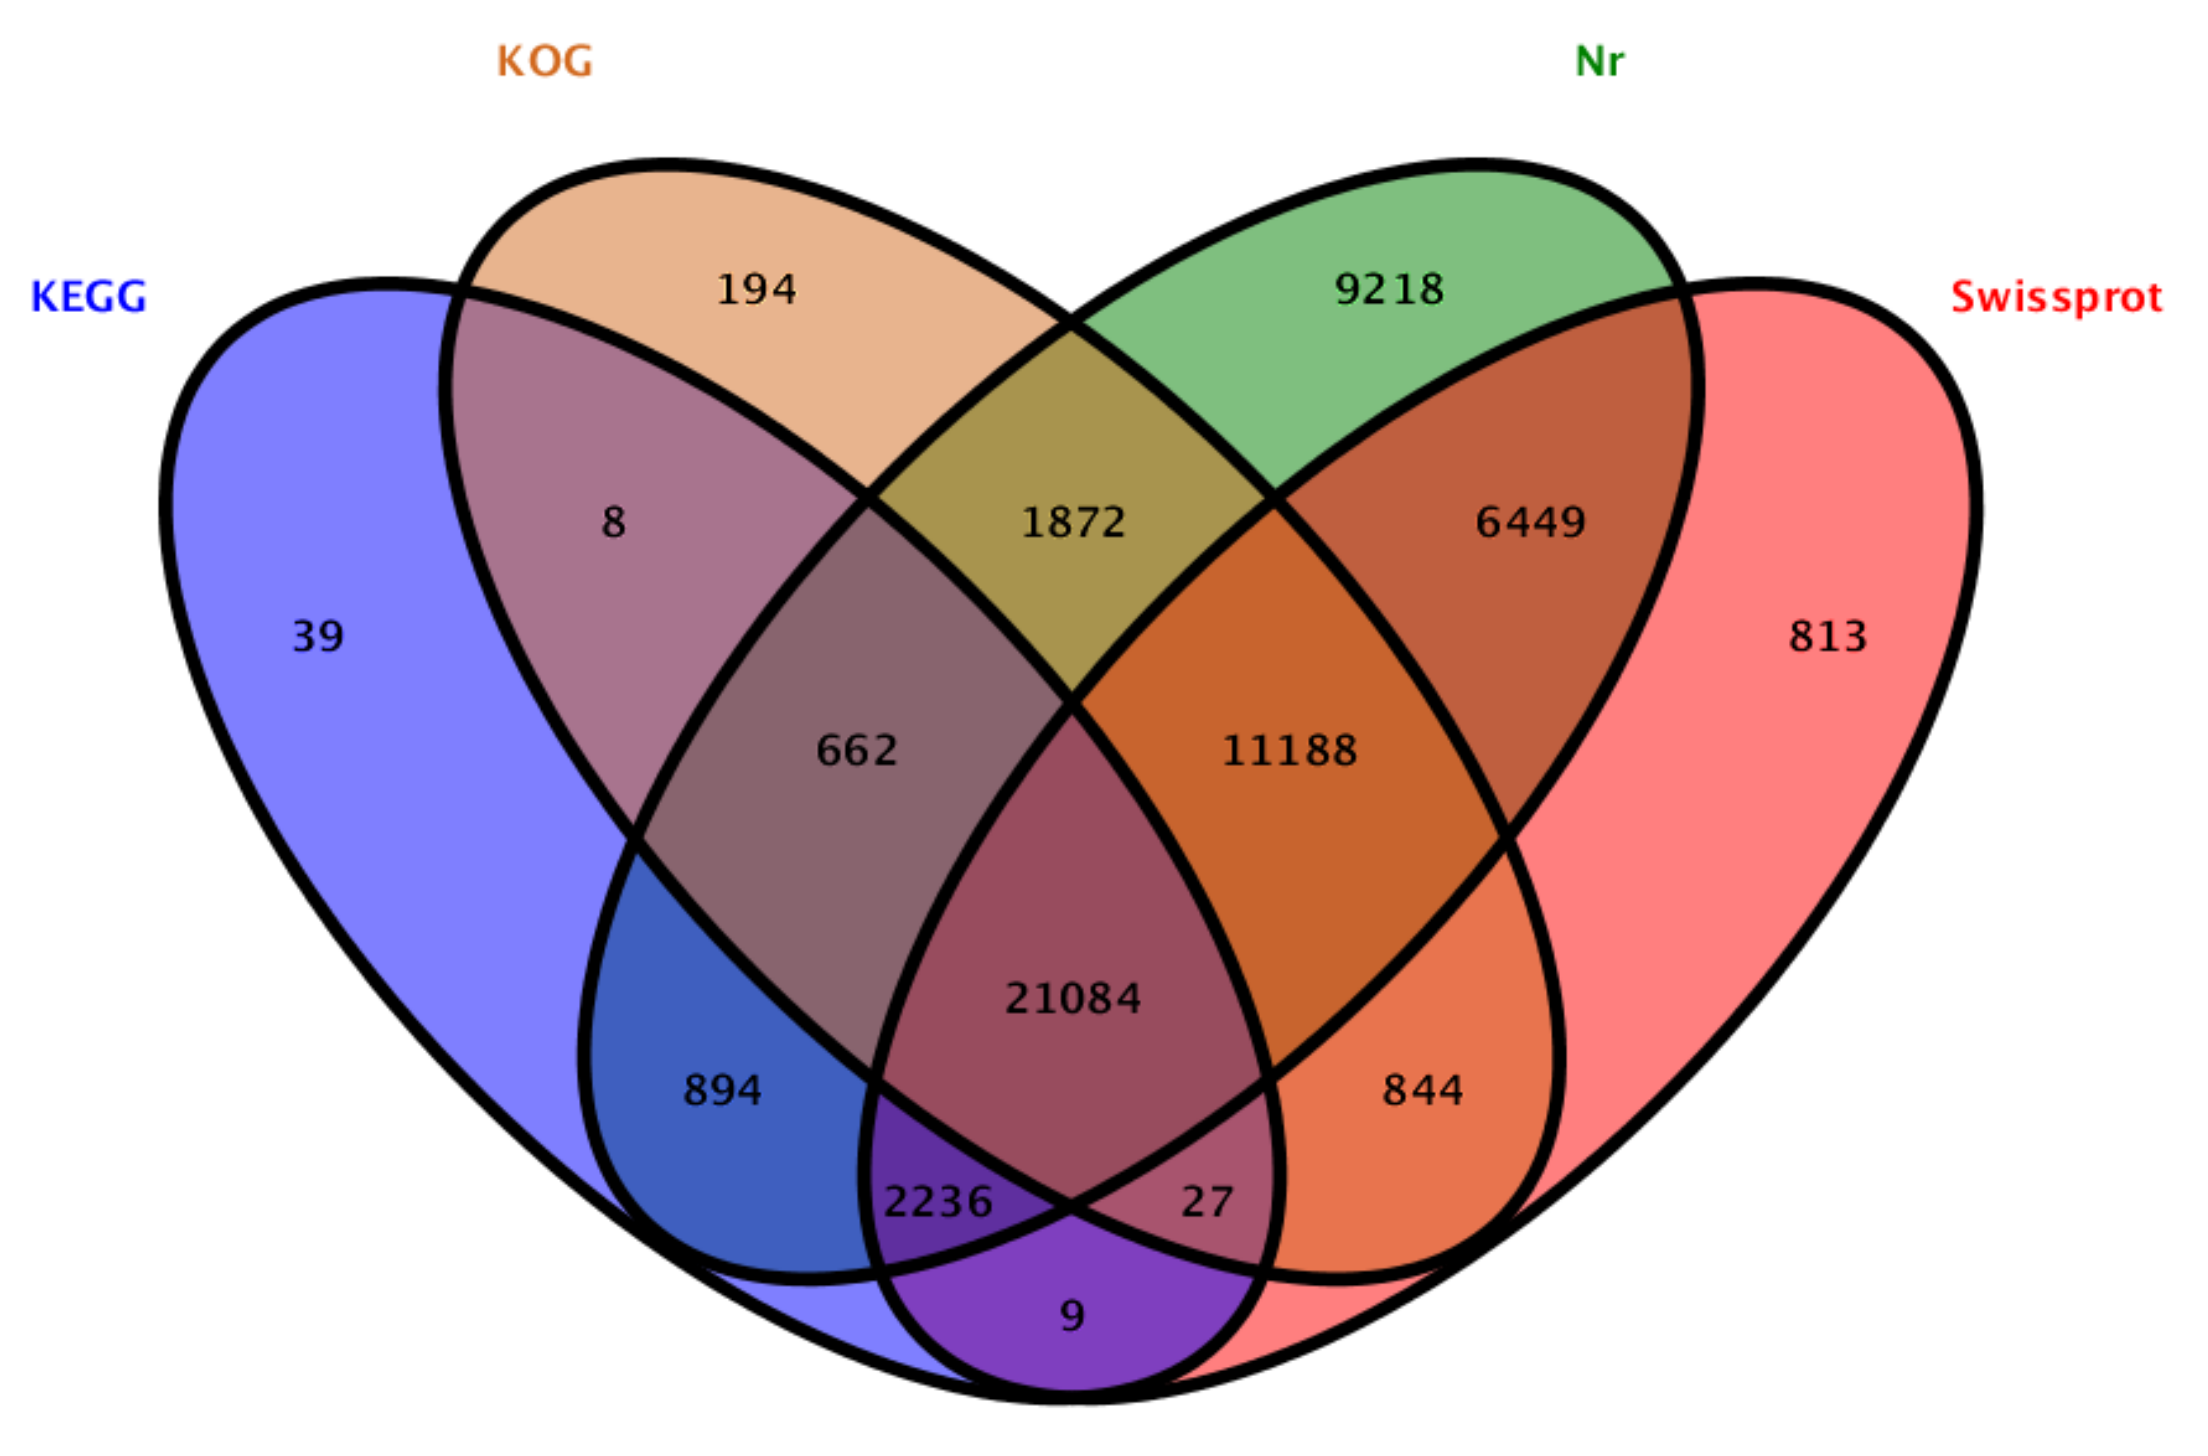
3.3. Annotation and Functional Classification of Unigenes

The assembled sequences were used as queries in BLAST searches (E ≤ 10−5) against the NR, KOG, SwissProt and KEGG databases, and 55,537 unigenes were annotated (Figure 2). The annotated unigenes were initially classified into 25 KOG categories with the largest group being “General function prediction only” (10,345; 28.83%) (Supplementary Materials: Figure S5). The Gene Ontology (GO) was used to assign 15,827 unigenes to the three principal GO domains: “cellular component”, “molecular function” and “biological process” (Supplementary Materials: Figure S6). In the “cellular component” category, “cell” was the most abundant term. For the category of “molecular function”, “catalytic activity” and “binding” were the most prominent. “Metabolic process” and “cellular process” were the most abundant terms in the “biological process” category.

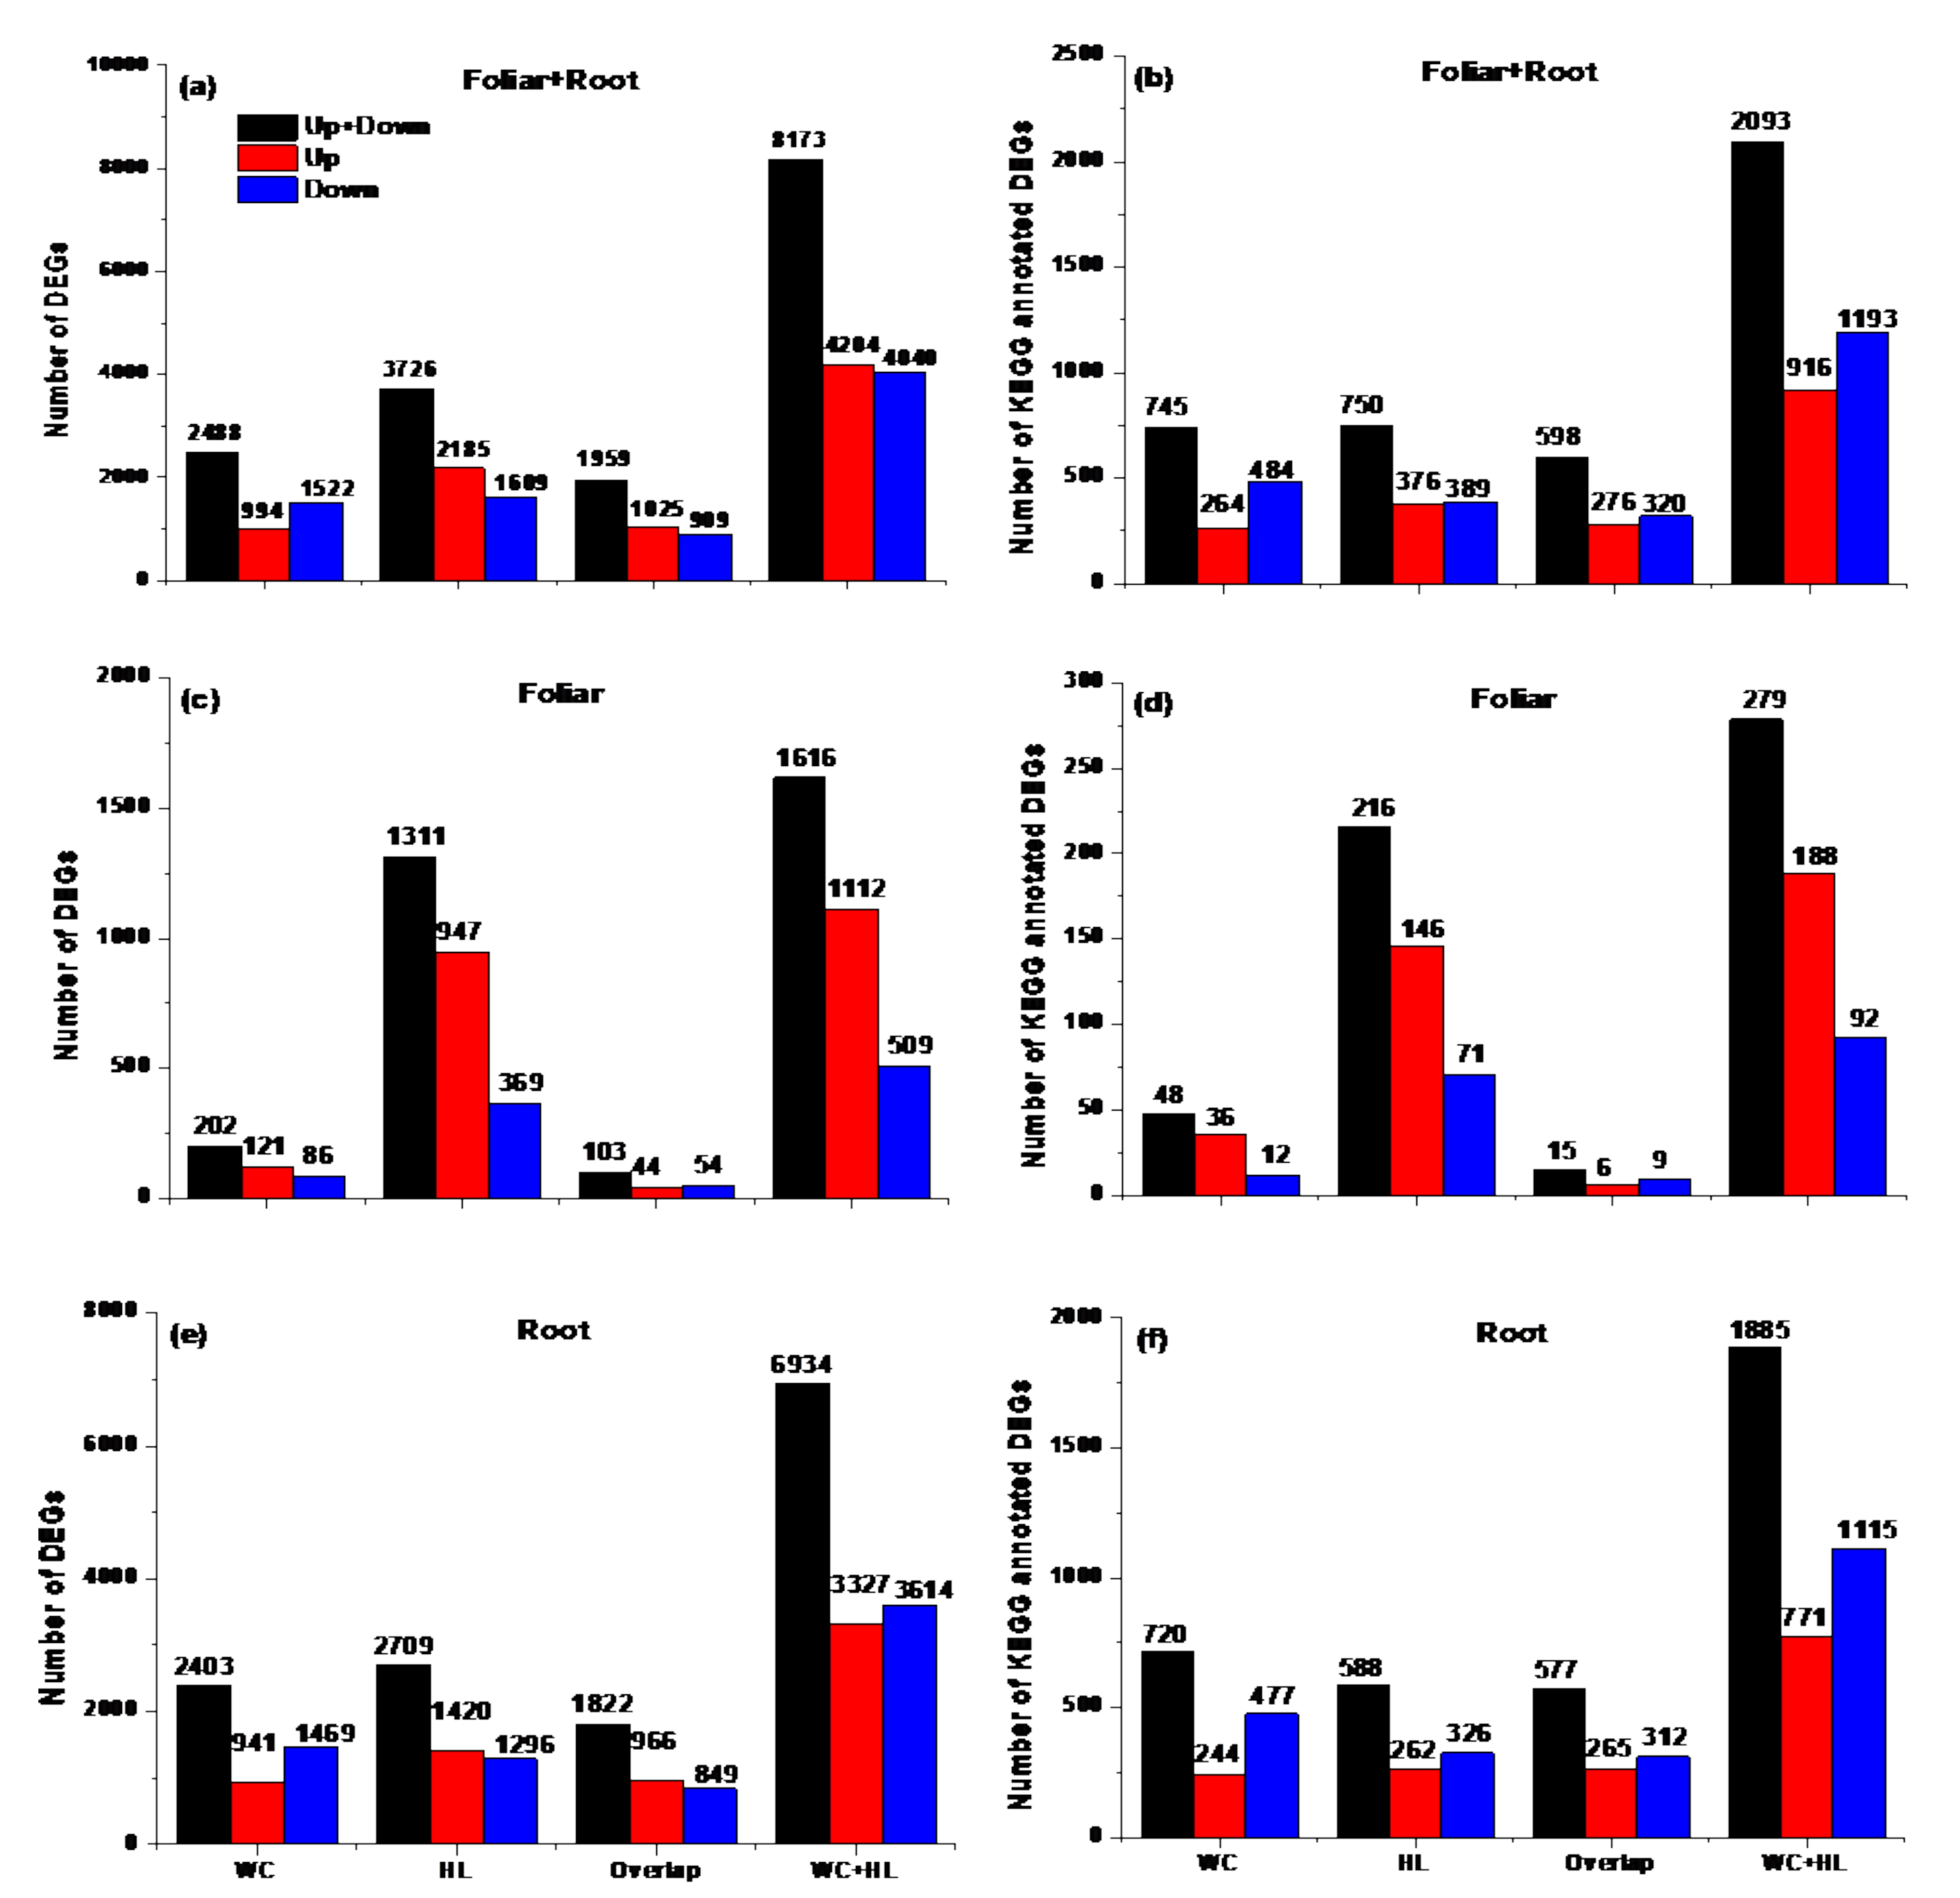
3.4. Identification of Differentially Expressed Genes (DEGs)

The transcriptional levels were normalized using the FPKM method (fragments per kilo-base of exon per million fragments mapped reads). Meanwhile, FDR < 0.05 was used as screening thresholds to test the significance of difference in transcript abundance. A large number of differentially expressed genes (DEGs) were identified from eight comparisons (Table 1).
To validate the gene expression results derived from the transcriptome data, nine DEGs related to transcription factors in CP1 and six DEGs involved in the phenylpropanoid pathway for the biosynthesis of lignin in CP4 and CP5 were selected for qRT-PCR. The results of experiment showed a strong correlation (R = 0.923) with the RNA-Seq data (Supplementary Materials: Figure S7), which indicates that the results of the transcriptomic analysis are reliable.

3.5. KEGG Pathway Analysis for DEGs between the Two F. mandshurica Provenances

To study the potential molecular mechanisms of the difference between two provenances in C trait, the DEGs in CP1, CP2 and CP7, CP8 were analyzed together. Consequently, 1057 DEGs were identified using pair-wise comparison of each accession between WC and HL (Figure 3). 783 DEGs (438 upregulated and 345 downregulated) were identified between WC and HL under complete N (Supplementary Materials: Figure S8a,b). Interestingly, the number of DEGs in the foliage (CP1, 669) were nearly 4.5 times that in the root (CP2, 149) (Table 1). Similarly, 300 DEGs (198 upregulated and 102 downregulated) were identified between WC and HL under N deficiency (Supplementary Materials: Figure S8a,b) and the number of upregulated DEGs in roots (CP8, 134) were nearly twice that in foliar (CP7, 74) (Table 1). Moreover, 126, 19, 21 and 30 DEGs were assigned to 73, 24, 20 and 30 pathways of the KEGG database in CP1, CP2, CP7 and CP8, respectively. The most reliable significantly (p < 0.05) enriched pathways of DEGs were represented as Supplementary Materials: Figure S16.
As only 2 DEGs in CP2 were annotated by KEGG, the DEGs in CP1 were used to analyze the difference between two provenances under complete N. In CP1, there were 9 pathways which could be divided into four metabolism types: Metabolism of terpenoids, Carbohydrate metabolism, Energy metabolism and Lipid metabolism (Supplementary Materials: Figure S9). The number of upregulated DEGs in WC was 30 which was 1.87 time that (16) of downregulated, compared to HL. Six genes involved in “starch and sucrose metabolism” pathway in CP1 showed increased transcript abundance in WC (Supplementary Materials: Figure S9). These genes encoded polygalacturonase (Unigene0056877), beta-glucosidase (Unigene0064953, Unigene0055864, Unigene0054701, Unigene0040728) and trehalose-phosphate phosphatase J (Unigene0037044) and their expressions were increased by 2.3 to 42-fold. Five DEGs involved in “Nitrogen metabolism” pathway showed increased transcript abundance in WC compared to HL (Supplementary Materials: Figure S9). These genes encoded carbonic anhydrase (Unigene0063117, Unigene0054409, Unigene0063118), glutamine synthetase (Unigene0053381), high affinity nitrate transporter 2.5 (Unigene0050395) and their expressions were increased by 3.4 to 16.7-fold. Nine DEGs involved in Lipid metabolism showed increased transcript abundance in WC compared to HL (Supplementary Materials: Figure S9). These genes encoded lipoxygenase (Unigene0062168, Unigene0059365), 3-ketoacyl-CoA synthase (Unigene0041866, Unigene0041868, Unigene0030198), 4-coumarate--CoA ligase (4CL6, Unigene0050299), 3-ketoacyl-CoA thiolase 2 (Unigene0043651), Jasmonic acid carboxyl methyltransferase (Unigene0030475), salicylic acid methyltransferase (SAMT, Unigene0060674) and their expressions were increased by 2.2 to 13.0-fold. Moreover, fifteen (ten upregulated and five downregulated) DEGs related to metabolism of terpenoids were identified in WC compared to HL.
The regulatory genes including plant hormone signal transduction, protein kinases and transcription factors (TFs) were analyzed (Figure 4). Ten DEGs were involved in several plant hormone signal transduction pathways in CP1, such as auxin, cytokinin (CK) and jasmonic acid (JA) (Figure 4). Among them, auxin and JA pathways were predominant and nine DEGs showed greater transcript abundance (2.3 to 13.9-fold) in WC compared to HL. Twenty (18 up- and 2 downregulated) and twenty-eight (17 up- and 11 downregulated) DEGs encoding protein kinases and transcription factors were found in WC compared to HL, respectively (Figure 4). Among DEGs encoding protein kinases, fifteen (14 up- and 1 downregulated) receptor-like serine/threonine-protein kinase (RLKs), two (2 and 0) CBL-interacting serine/threonine-protein kinase 14-like (CIPKs) and two (1 and 1) Serine/threonine-protein kinase (STPKs) were identified, respectively (Figure 4). Among DEGs encoding transcription factors, seven (5 up- and 2 downregulated) ERF, nine (6 and 3) bHLH, one (0 and 1) HSF, four (1 and 3) MYB, two (0 and 2) NAC, two (2 and 0) TCP and two (2 and 0) WRKY were identified, respectively (Figure 4). The results indicated that the protein kinases and transcription factors were more active in WC rather than in HL as the number of upregulated DEGs was more than that of downregulated in WC compared to HL.

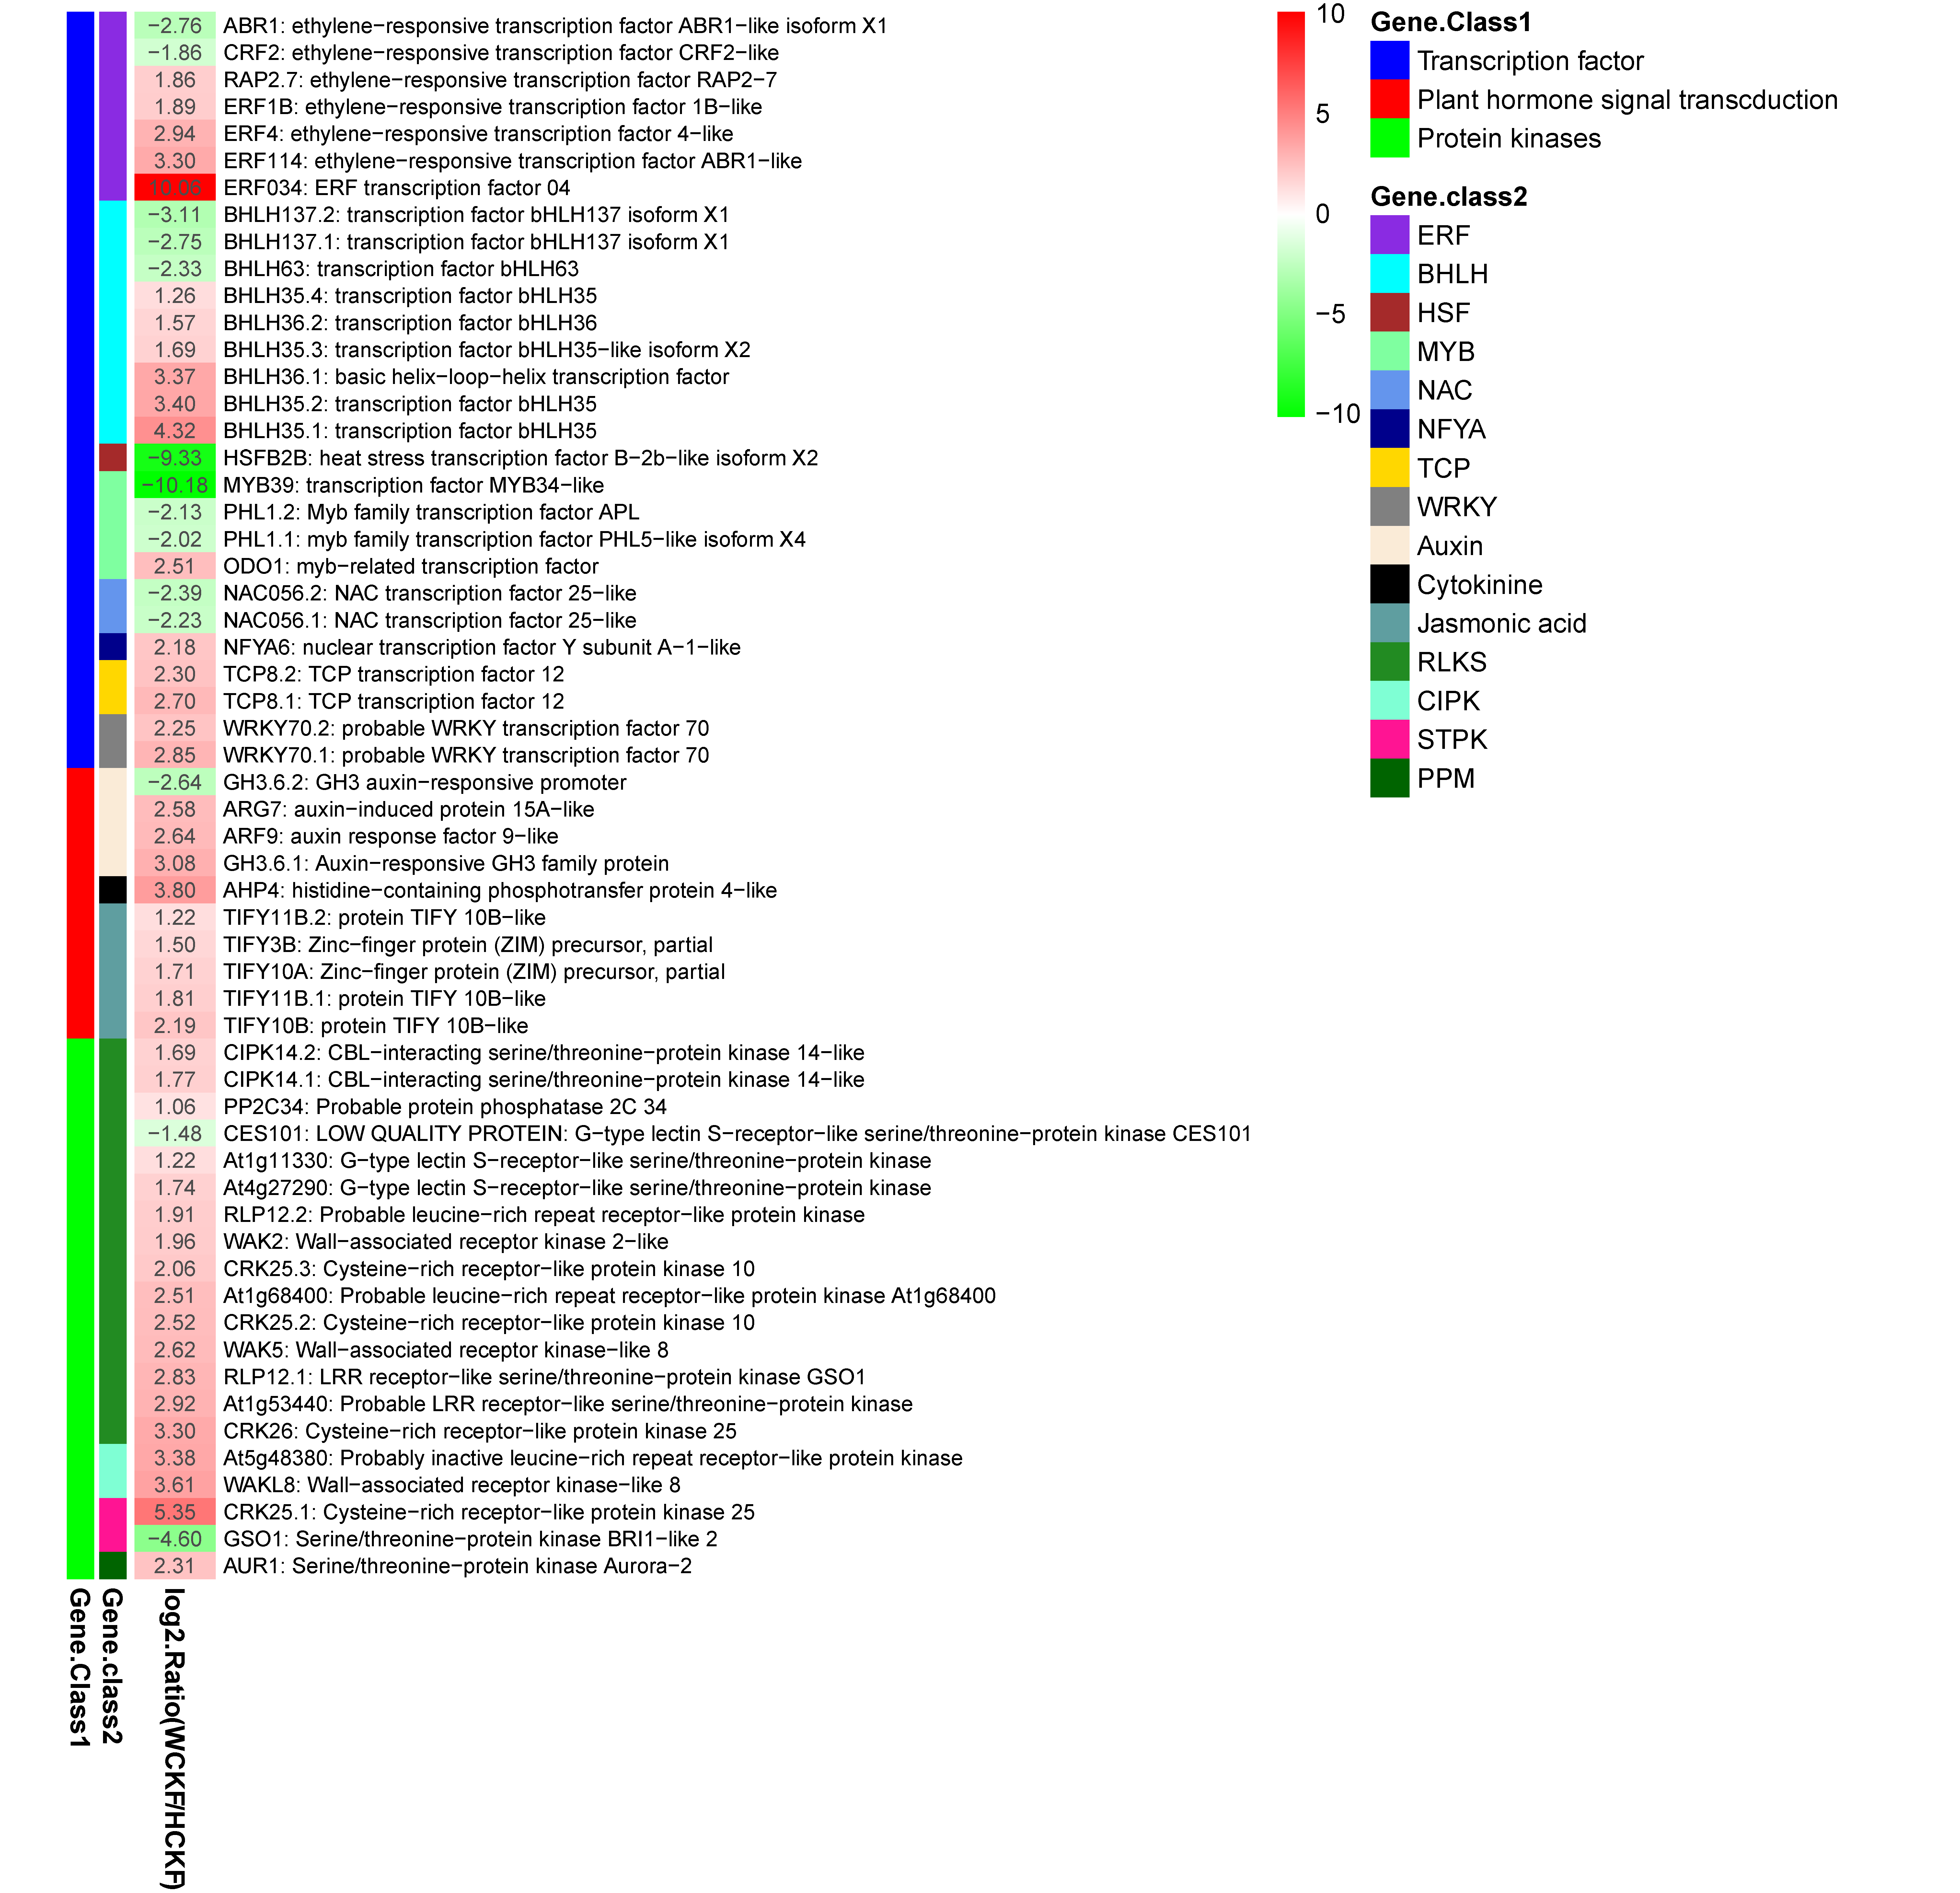
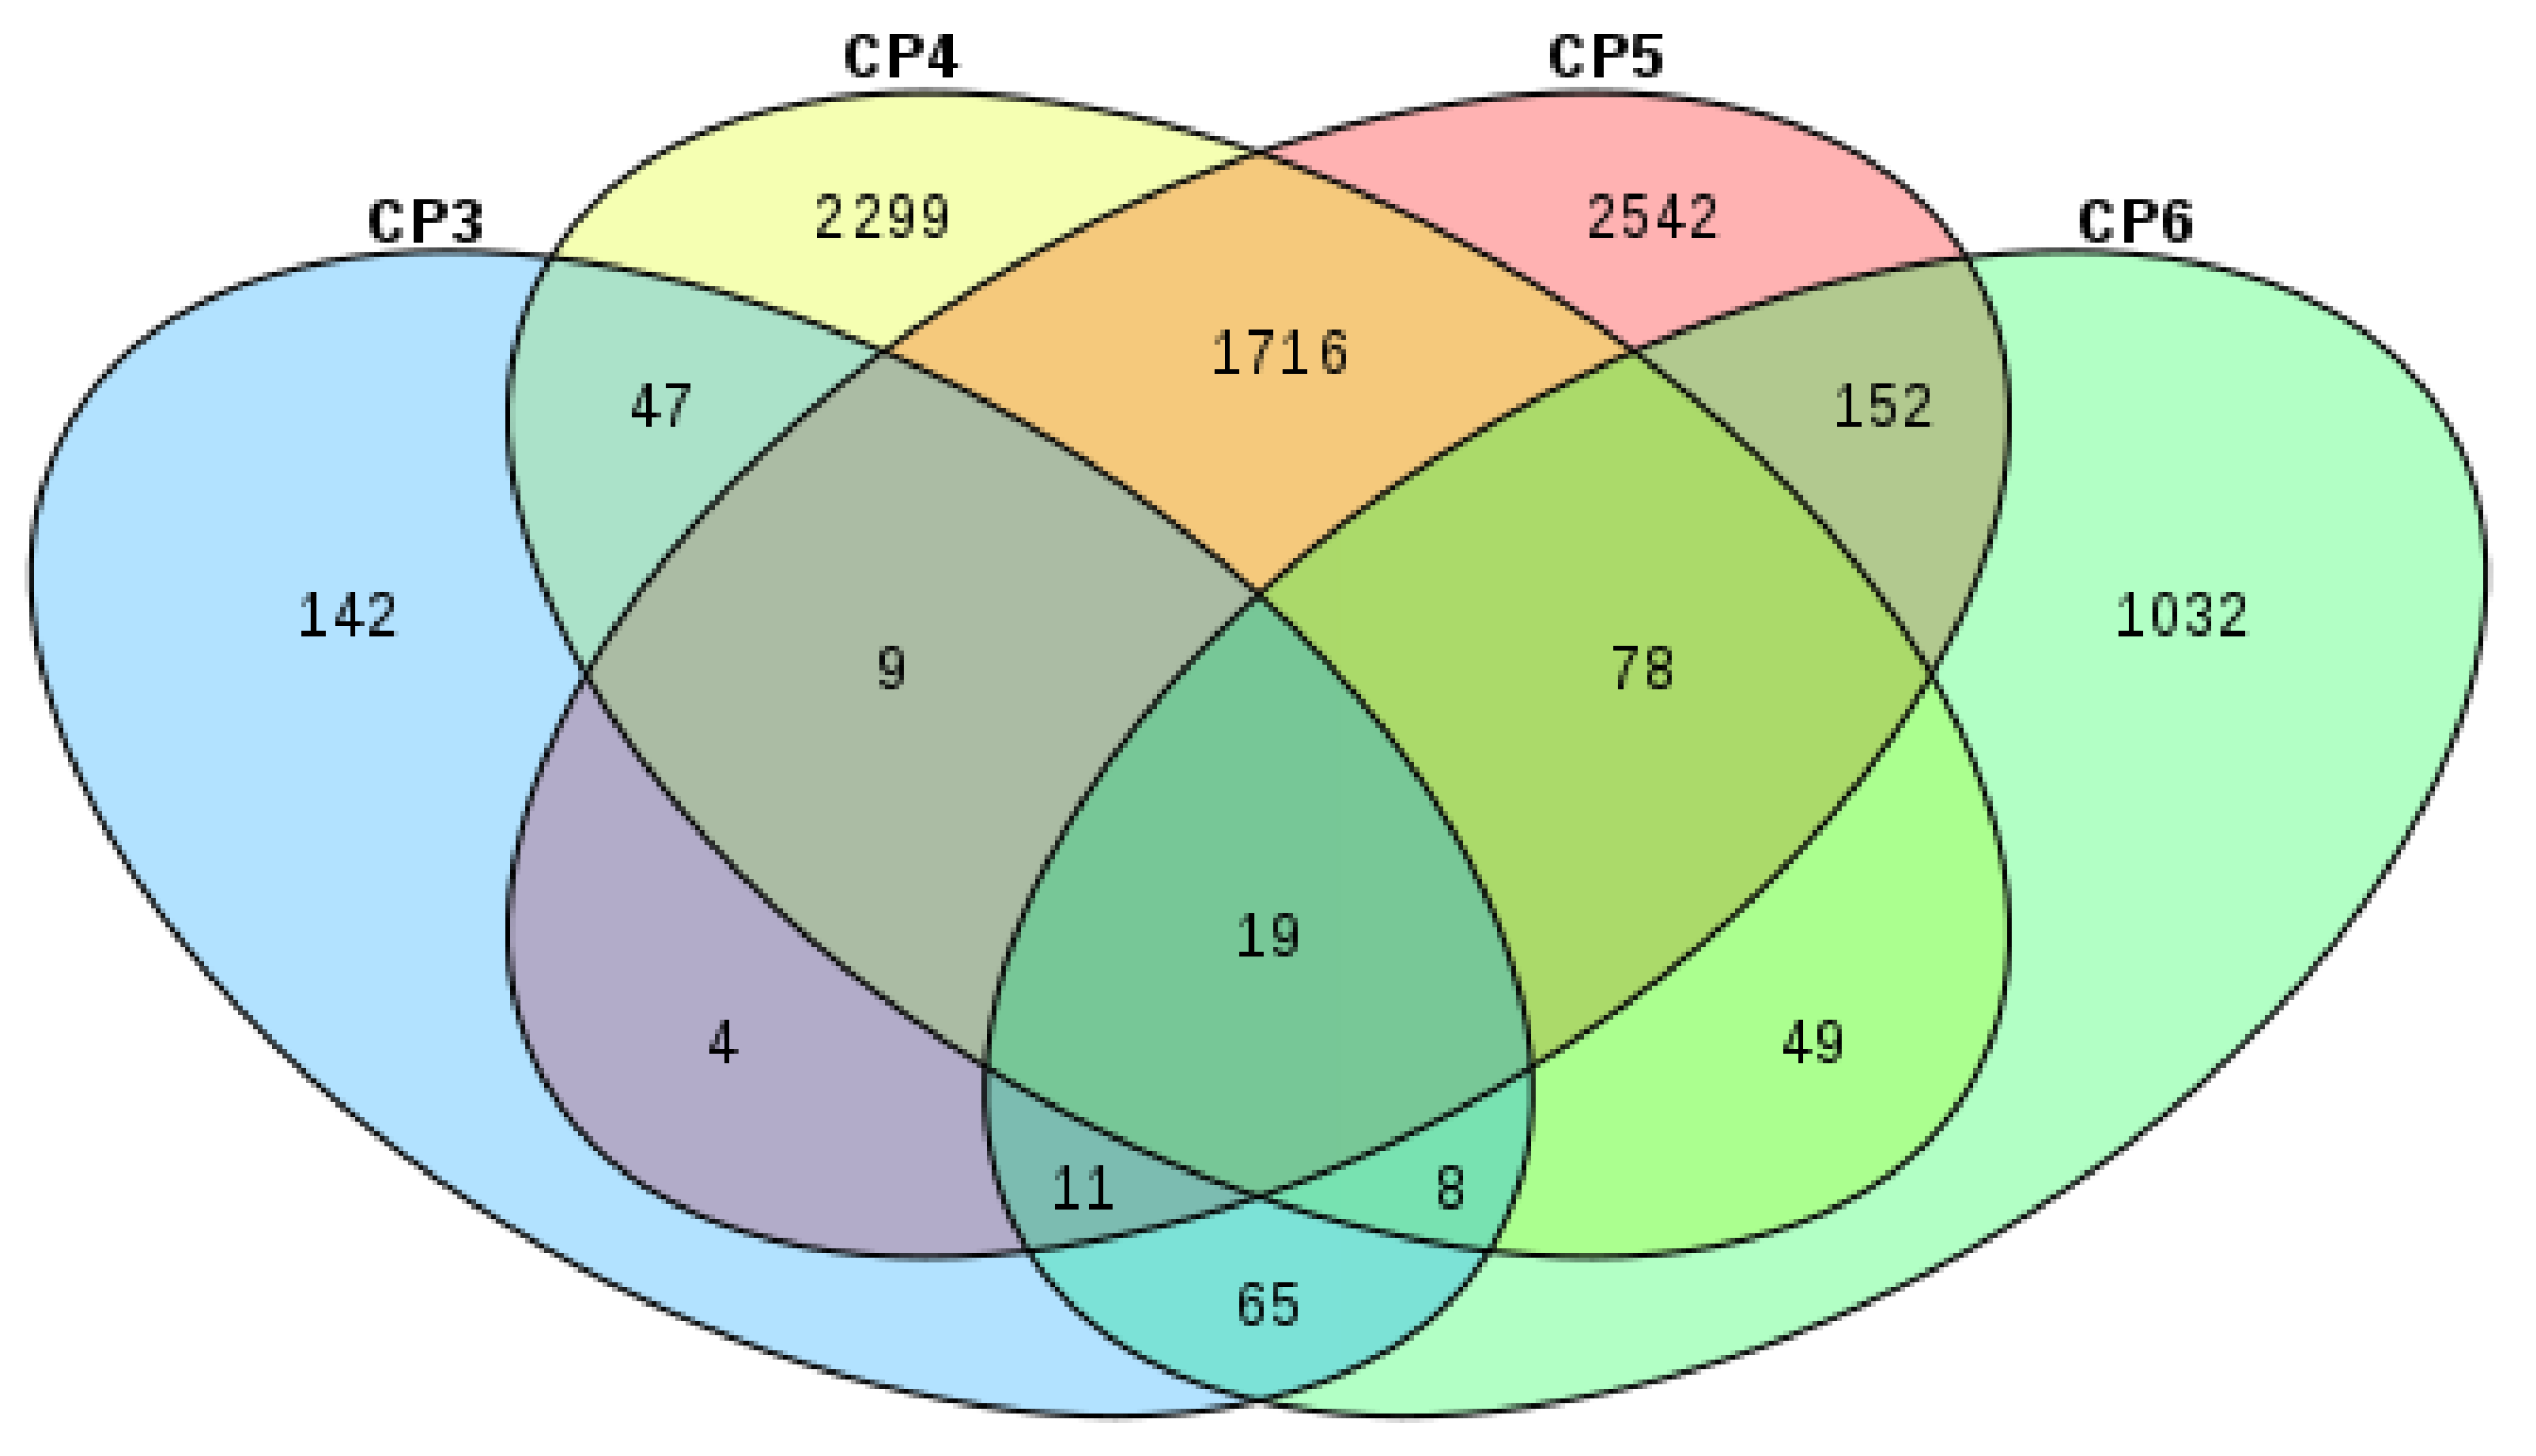
3.6. KEGG Pathway Analysis for DEGs Between the Two F. mandshurica Provenances in Response to Nitrogen Deficiency

To study the two F. mandshurica provenances transcriptional expression difference in response to N deficiency, DEGs between complete N and N deficiency from roots and foliage of WC and HL were obtained, respectively. Consequently, 8173 DEGs related to N deficiency were identified (Figure 5), accounting for 9.22% of all unigenes, indicating that the transcriptional expression levels of genes in F. mandshurica were extensively induced by N deficiency. Upregulated and downregulated DEGs accounted for 51% and 49% (Figure 6a), respectively. The number of DEGs in WC roots (CP4, 4225) (Figure 6e) was nearly 14 times that in WC foliar (CP3, 305) (Figure 6c). Additionally, the number of DEGs in the HL roots (CP5, 4531) (Figure 6e) was nearly 3.2 times that in HL foliar (CP6, 1414) (Figure 6c). Therefore, the root of F. mandshurica responded to N deficiency more strongly than foliar. Moreover, in foliar and roots, the upregulated DEGs accounted for 70.78% and 47.16% (Figure 6c,e), respectively, indicating that patterns of response to N deficiency were different in foliar and roots.
Among the 8173 DEGs induced by N deficiency, 23.97% was shared by two provenances, 30.44% and 45.59% were identified specifically in WC and HL (Figure 6a), respectively. Therefore, the number of DEGs in HL was 15.15% more than that in WC. By comparing the number of DEGs in roots and leaves, respectively, it was found that the DEGs related to N deficiency in HL more than WC were mainly from leaves (Figure 6c). Among the 1616 DEGs induced by N deficiency in foliar, 6.37% was shared by two provenances, 12.50% and 81.13% were identified specifically in WC and HL (Figure 6c), respectively, indicating that HL provenance responded more strongly to N deficiency than WC.
Among the 8173 DEGs induced by N deficiency, 25.61% were annotated by KEGG (Figure 6b). In roots, the proportions of DEGs related to regulatory genes were 17.19%, 34.63%, and 5.11% in total, upregulated and downregulated, including transcription factors (5.52%, 10.51%, 2.06%) (Supplementary Materials: Figure S10 and Figure 7) and kinases (9.12%, 19.07%, 2.24%) (Supplementary Materials: Figure S11 and Figure 7), hormones (2.55%, 5.06%, 0.81%) (Supplementary Materials: Figure S12 and Figure 7), indicating that the target genes that responded to N deficiency in roots were mainly regulatory genes, and their response patterns were upregulated. Moreover, the proportions of DEGs related to regulatory genes in HL were 2.83 times, 2.95 times and 1.16 times those in WC in total, upregulated and downregulated, including hormones (3.83 times, 3.91 times, 1.95 times), transcription factors (3.40 times, 6.12 times, 0.53 times) and kinases (2.38 times, 2.07 times, 1.61 times). Therefore, the proportion of DEGs related to regulation in roots was greater in HL than WC. The number of significantly enriched KEGG pathways was 8 in WC roots (CP4), less than that (17) in HL roots (CP5) (Supplementary Materials: Figure S16). The pathways with a larger number of genes enriched in WC roots (CP4) were “Ribosome”, “Oxidative phosphorylation”, “Phenylpropanoid biosynthesis”, “Cyanoamino acid metabolism” and “Diterpenoid biosynthesis” (Supplementary Materials: Figure S16), however, that in HL roots (CP5) were “Ribosome”, “Starch and sucrose metabolism”, “Oxidative phosphorylation”, “Plant hormone signal transduction”, “Pentose and glucuronate interconversions”, “Tyrosine metabolism” and “Phenylpropanoid biosynthesis” (Supplementary Materials: Figure S16). This indicated the response patterns of WC and HL to N deficiency were also different in roots. In HL foliar, the proportions of DEGs related to hormones (Supplementary Materials: Figure S12), transcription factors (Supplementary Materials: Figure S10) and kinases (Supplementary Materials: Figure S11) were 5.56%, 25.46% and 68.05% in total; the values were 7.53%, 33.56% and 95.89% in upregulated and 1.41%, 8.45% and 9.86% in downregulated, respectively. Therefore, N deficiency significantly induced the upregulated expression of regulatory genes in HL foliar. The pathways with a larger number of genes enriched in WC foliage (CP3) were “Sulfur metabolism” and “Nitrogen metabolism”, however, that in HL foliage (CP6) were “Plant-pathogen interaction”, “Plant hormone signal transduction”, “Protein processing in endoplasmic reticulum”, “Phenylpropanoid biosynthesis” and “Starch and sucrose metabolism” (Supplementary Materials: Figure S16). In summary, the results indicated that the response patterns of WC and HL to N deficiency were different in the foliage.
Many genes involved in N absorption and assimilation are differentially expressed under N deficiency relative to complete N. In the current study, ten DEGs (seven upregulated and three downregulated) encoding nitrate transporters were detected (Supplementary Materials: Table S4). Two upregulated DEGs (Unigene0034112 and Unigene0050395) which encoded NRT3.2 and NRT2.5 and two downregulated DEGs (Unigene0046155 and Unigene0047301) which encoded NRT2.7 and NRT were identified in both WC and HL. In addition, four DEGs (Unigene0018686, Unigene0022313, Unigene0026134, Unigene0050965) which encoded NRT3.1 and NRT2.1 were upregulated and one DEG (Unigene0039451) which encoded NRT3.1 was downregulated only in HL, and one DEG (Unigene0071953) which encoded NRT was upregulated in WC, respectively. Four DEGs encoding ammonium transporters (AMTs) (Unigene0034277, Unigene0045039, Unigene0045040, Unigene0054529) were identified (Supplementary Materials: Table S4). Moreover, fourteen, six and four DEGs encoding amino acid, lysine histidine and oligopeptide transporters were found (Supplementary Materials: Table S4), respectively. There were also three, six, two and two DEGs encoding glutamine synthetase (GS), glutamate dehydrogenase (GDH), nitrite reductases (NiR) and nitrate reductase (NR) which were the key enzymes in nitrate assimilation and their transcription expression were all downregulated except two GS unigenes (Unigene0009471, Unigene0053381).

4. Discussion

There are significant differences in tree growth rate between provenances of the same species, which has been confirmed in many tree species, such as Prosopis africana [31], mangrove species Avicennia marina (Forssk.) Vierh. [32], Eucalyptus tereticornis (Sm.) [33] and Eucalyptus globulus labill. [34]. On one hand, the difference in growth rate between provenances is attributed to the differences in geographical and climatic factors [31,35,36] in the production areas of provenances, which have been widely reported; on the other hand, it is attributed to genetic factors between provenances, such as transcriptional expression of genes, which are rarely reported. To explore the differences in gene transcription expression between provenances with different C amount, this study analyzed the differences in gene transcription expression in the leaves and roots of the provenance (WC) with greater C amount and (HL) with smaller C amount of F. mandshurica and found that the DEGs between provenances mainly existed in leaves rather than roots. To explore the tolerance of provenances with different C amount to N deficiency, seedlings of the two provenances were treated with N deficiency and complete N under sand culture conditions, and found that HL provenance responded to N deficiency more strongly than WC provenance by analyzing the growth, physiology and RNA-seq.

4.1. Growth and Physiological Differences between Provenances

Under complete N, dry weight in WC was larger than that in HL, which related to the higher chlorophyll content, lateral root number, nitrate ion content, free amino acid content, glutamate synthase (GOGAT) activity and glutamine synthase (GS) activity of WC. N deficiency can reduce photosynthetic capacity by reducing chlorophyll content [25]. In this study, N deficiency reduced dry weight and chlorophyll content and HL decreased more than WC, but increased the number of lateral roots and root-to-shoot ratio and the increase in HL was greater than WC, indicating that the response intensity in HL to N deficiency was greater than that in WC. After low-N treatment, it was found that the content of ammonium and nitrate ions in the roots, nitrate reductase activity, the transcription level of most ammonium (AMTs) and nitrate (NRTs) transporter genes are reduced in poplar [37]. Since N metabolism requires plants to provide a C skeleton, the level of N not only affects N metabolism, but also affects C metabolism, especially carbohydrates. Compared to no application of N, the application of N decreased the content of leaves soluble sugar (SS) and increased stems SS in oilseed flax [38]. N deficiency reduced the free amino acid content and WC decreased more greatly, increased the soluble sugar content and HL increased more. On the whole, N metabolism capacity of WC is greater than that of HL under N deficiency.

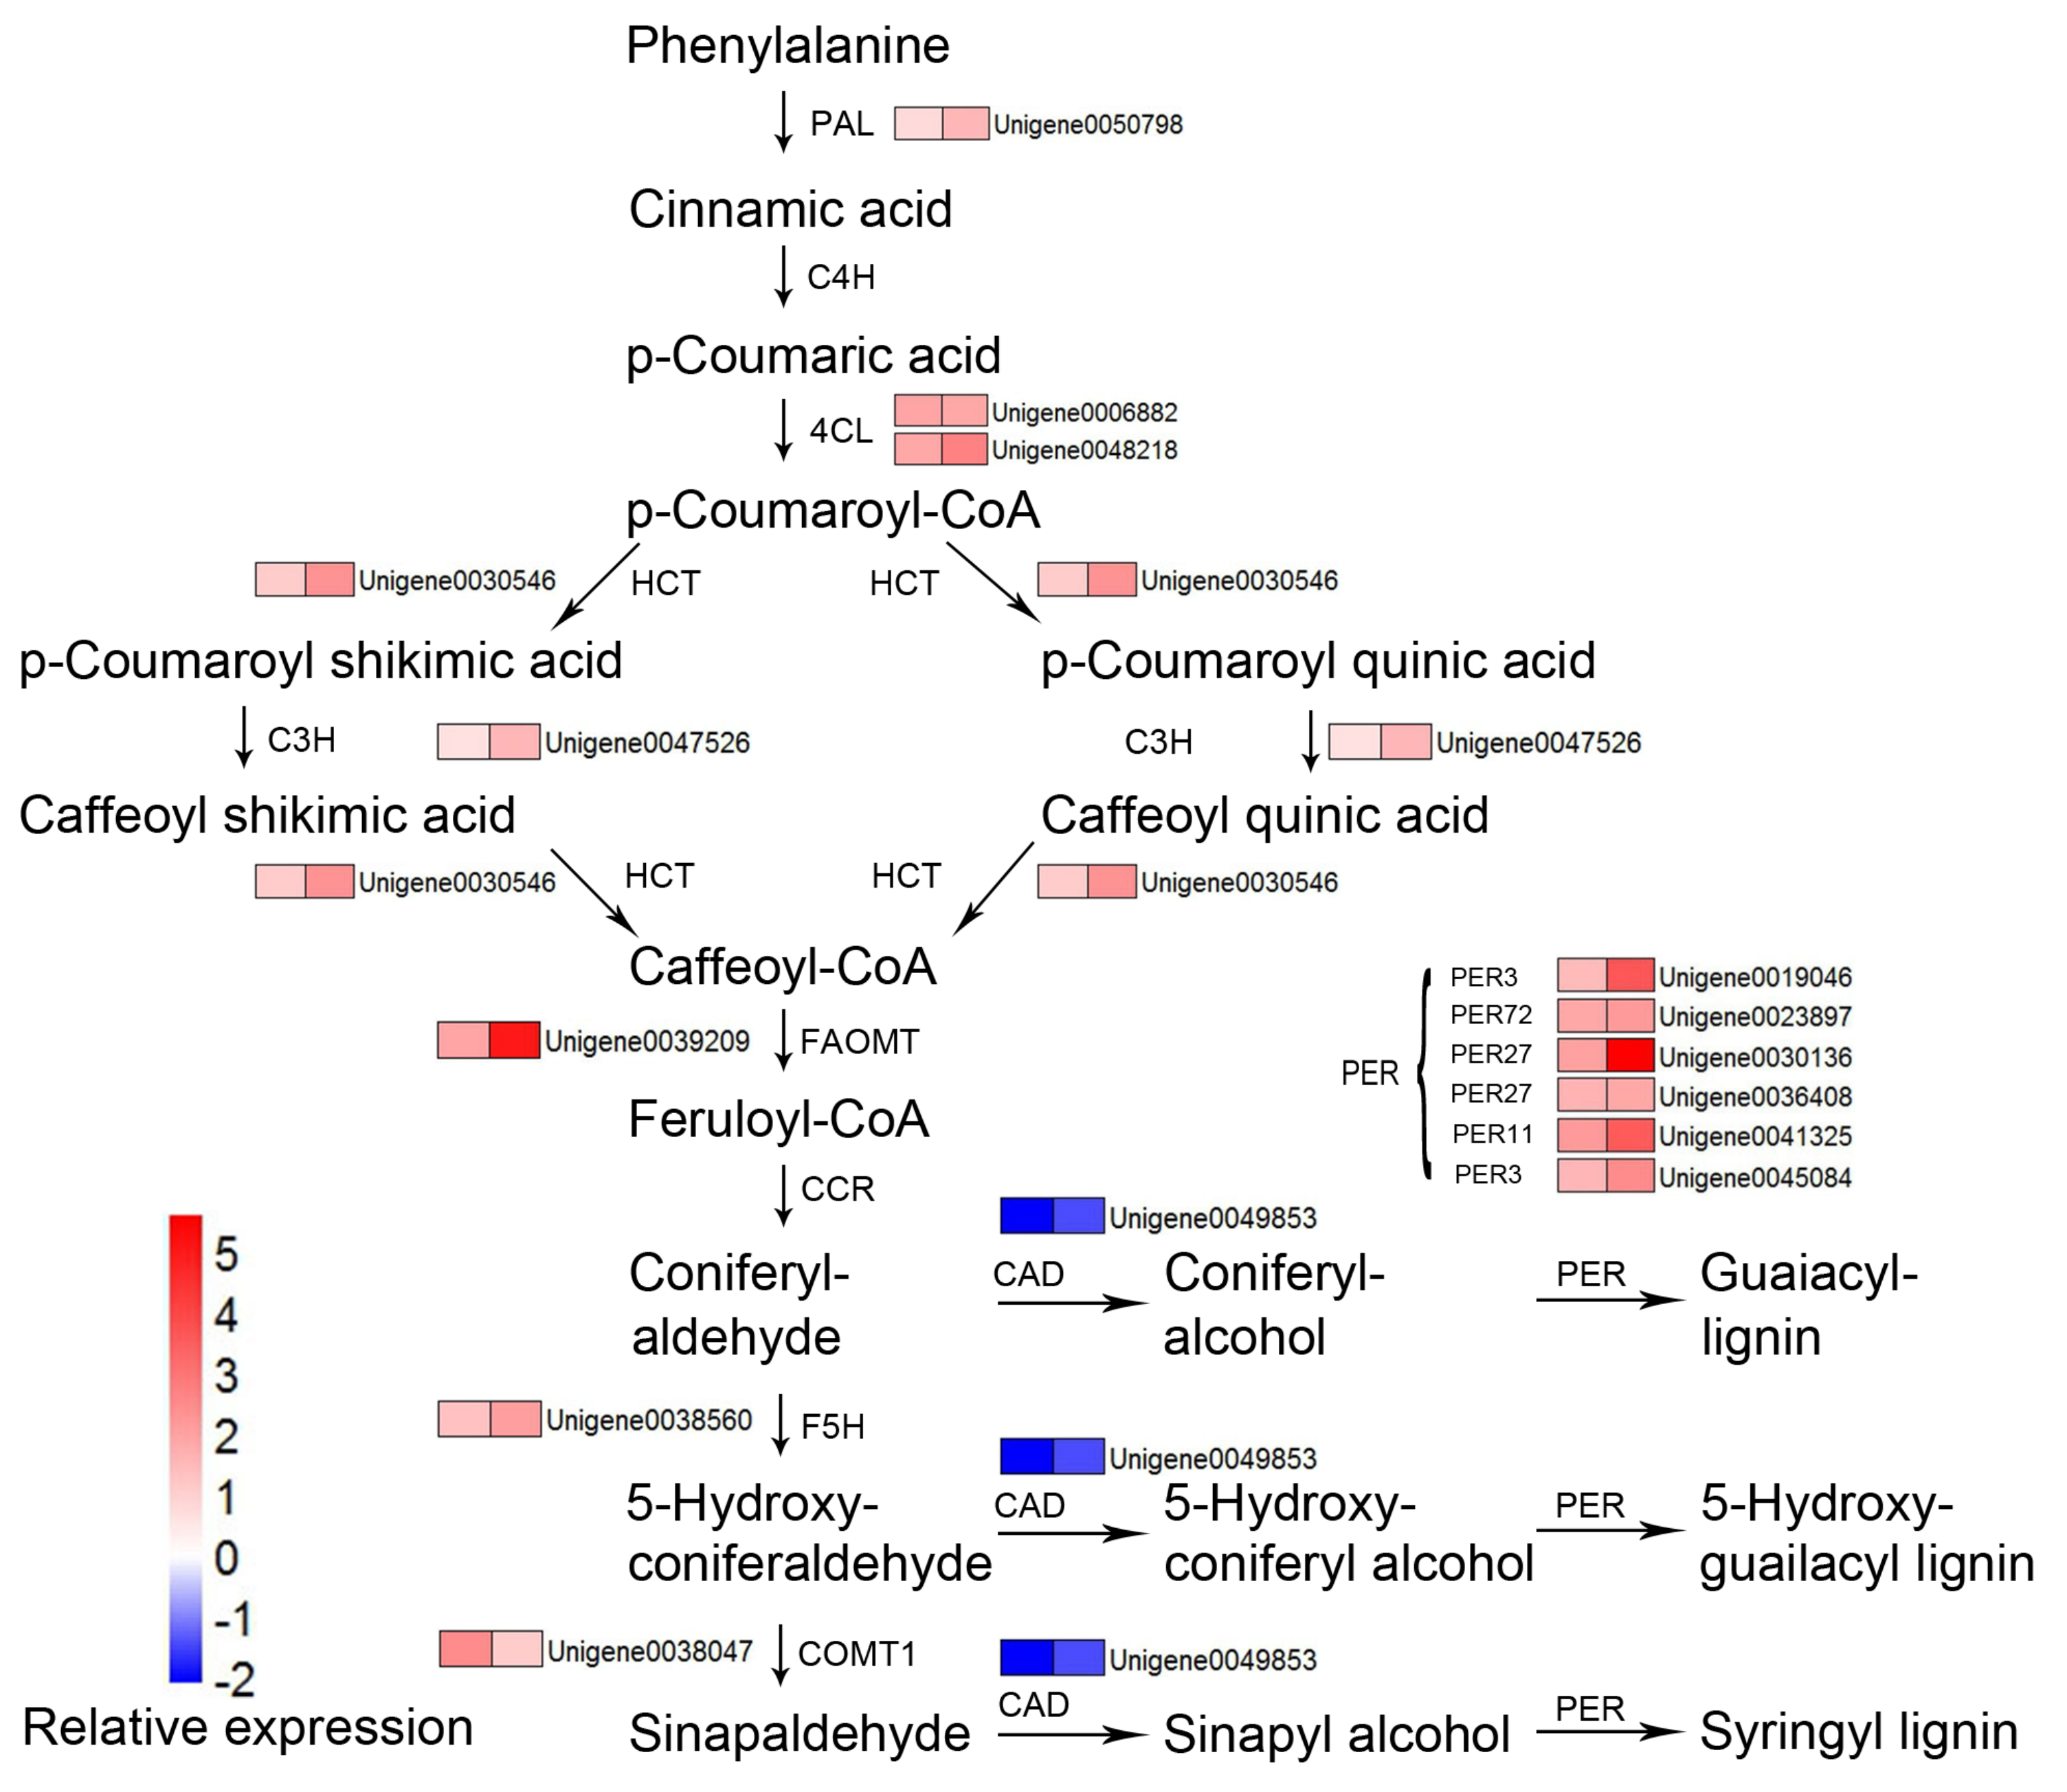
4.2. DEGs Related to C Sequestration

In terms of the number of DEGs, the difference in C amount of the two provenances under complete N was mainly caused by the DEGs in the foliage. The number of upregulated genes in WC provenance foliage was more than that in HL. Through KEGG annotation analysis, the DEGs were significantly enriched in four metabolic processes including metabolism of terpenoids, carbohydrate metabolism, energy metabolism, lipid metabolism, that is, nine metabolic pathways (Supplementary Materials: Figure S9). Further analysis of DEGs on these significant enrichment pathways revealed that among the DEGs related to C metabolism, N metabolism and lipid metabolism, only the number of lipid-related genes in WC provenance was significantly greater than that in HL. Five of the nine lipid metabolism-related DEGs were in the alpha-Linolenic acid metabolism pathway, and the transcription level of four jasmonic acid (JA) synthesis-related genes (4CL5, lipoxygenase 2.1, 3-ketoacyl-CoA thiolase 2, SAMT) was significantly higher in WC than that in HL. In barley leaves, the most abundant lipoxygenase (LOX) (EC 1.13.11.12) is coded by LOX2 [39], which catalyzes the peroxidation of polyunsaturated fatty acids to synthesize JA. A major role of JA is the enhancement of secondary metabolite production [40]. Reported studies have shown that JA and its ester, methyl jasmonate (MeJA) are effective in increasing the biosynthesis of various triterpenoids [41]. Vanholme et al. showed that MeJA can upregulate the transcriptional expression levels of TIFY3b, TIFY5a, TIFY5b, TIFY6b, TIFY7, TIFY9, TIFY10a, TIFY10b, TIFY11a and TIFY11b in Arabidopsis [42]. In this study, the LOX2 and Jasmonic acid carboxyl methyltransferase (JMT) were significantly upregulated in WC compared to HL, which might produce more JA and MeJA, further inducing the transcriptional expression levels of DEGs related to terpenoid backbone biosynthesis, monoterpenoid and diterpenoid biosynthesis significantly upregulation (Supplementary Materials: Figure S9). At the same time, the transcriptional expression levels of TIFY3b, TIFY10a, TIFY10b, TIFY11a and TIFY11b were also significantly upregulated by greater MeJA in WC (Figure 4).
Hormones and transcription factors are integrators of multiple signals in plants [43]. The transcriptional expression levels of most DEGs related to transcription factors and plant hormone signal transduction in WC were significantly greater than those in HL (Figure 4). There were three BHLH, three ERF, three WRKY transcription factors whose expression were greater in WC than that in HL. What is more, the kinase also has a cascade of amplification functions in the growth and signaling process of the plant. There are twelve kinases whose transcription level in the WC provenance were significantly higher than that in HL provenance. Six of the twelve kinases belonged to the serine/threonine protein kinase, two were leucine-rich protein kinases, and two were receptor-associated protein kinases on the cell wall.
Since C amount in WC provenance seedlings were higher than that in HL provenance seedlings, we wanted to find C metabolism-related genes in WC provenance seedlings. Trehalose 6-phosphate (Tre6P) is an essential signal metabolite in plants, linking growth and development to C status [44]. In illuminated leaves, Tre6P influences the partitioning of photo-assimilates between Suc, organic acids, and amino acids via posttranslational regulation of phosphoenolpyruvate carboxylase and nitrate reductase (NR) [44]. Trehalose 6-phosphate (Tre6P) is the intermediate in the two-step pathway of trehalose biosynthesis mediated by Tre6P-synthase (TPS) and Tre6P-phosphatase (TPP) [45]. Figueroa C.M. and Lunn J.E. [44] proposed a Suc-Tre6P nexus model, which may be used to explain the greater C amount in WC compared to HL (Figure 8). In this study, the transcriptional expression level of the TPP gene in WC was significantly greater than that in HL but the TPS gene had no significant difference in transcriptional expression level between WC and HL, which indicated that the Tre6P content in WC might be less than that in HL. The lower Tre6P on the one hand could increase the sucrose content by promoting sucrose synthesis and inhibiting catabolism; on the other hand, it might reduce the demand for C skeletons by reducing NR enzyme activity. What is more, the genes related to the N metabolism (NRT2.4 and NRT2.7) and C metabolism (carbonic anhydrase and β-glucosidase) were downregulated and upregulated, respectively, in WC compared to HL. Finally, the carbohydrates concentration and C amount were greater in WC than HL.

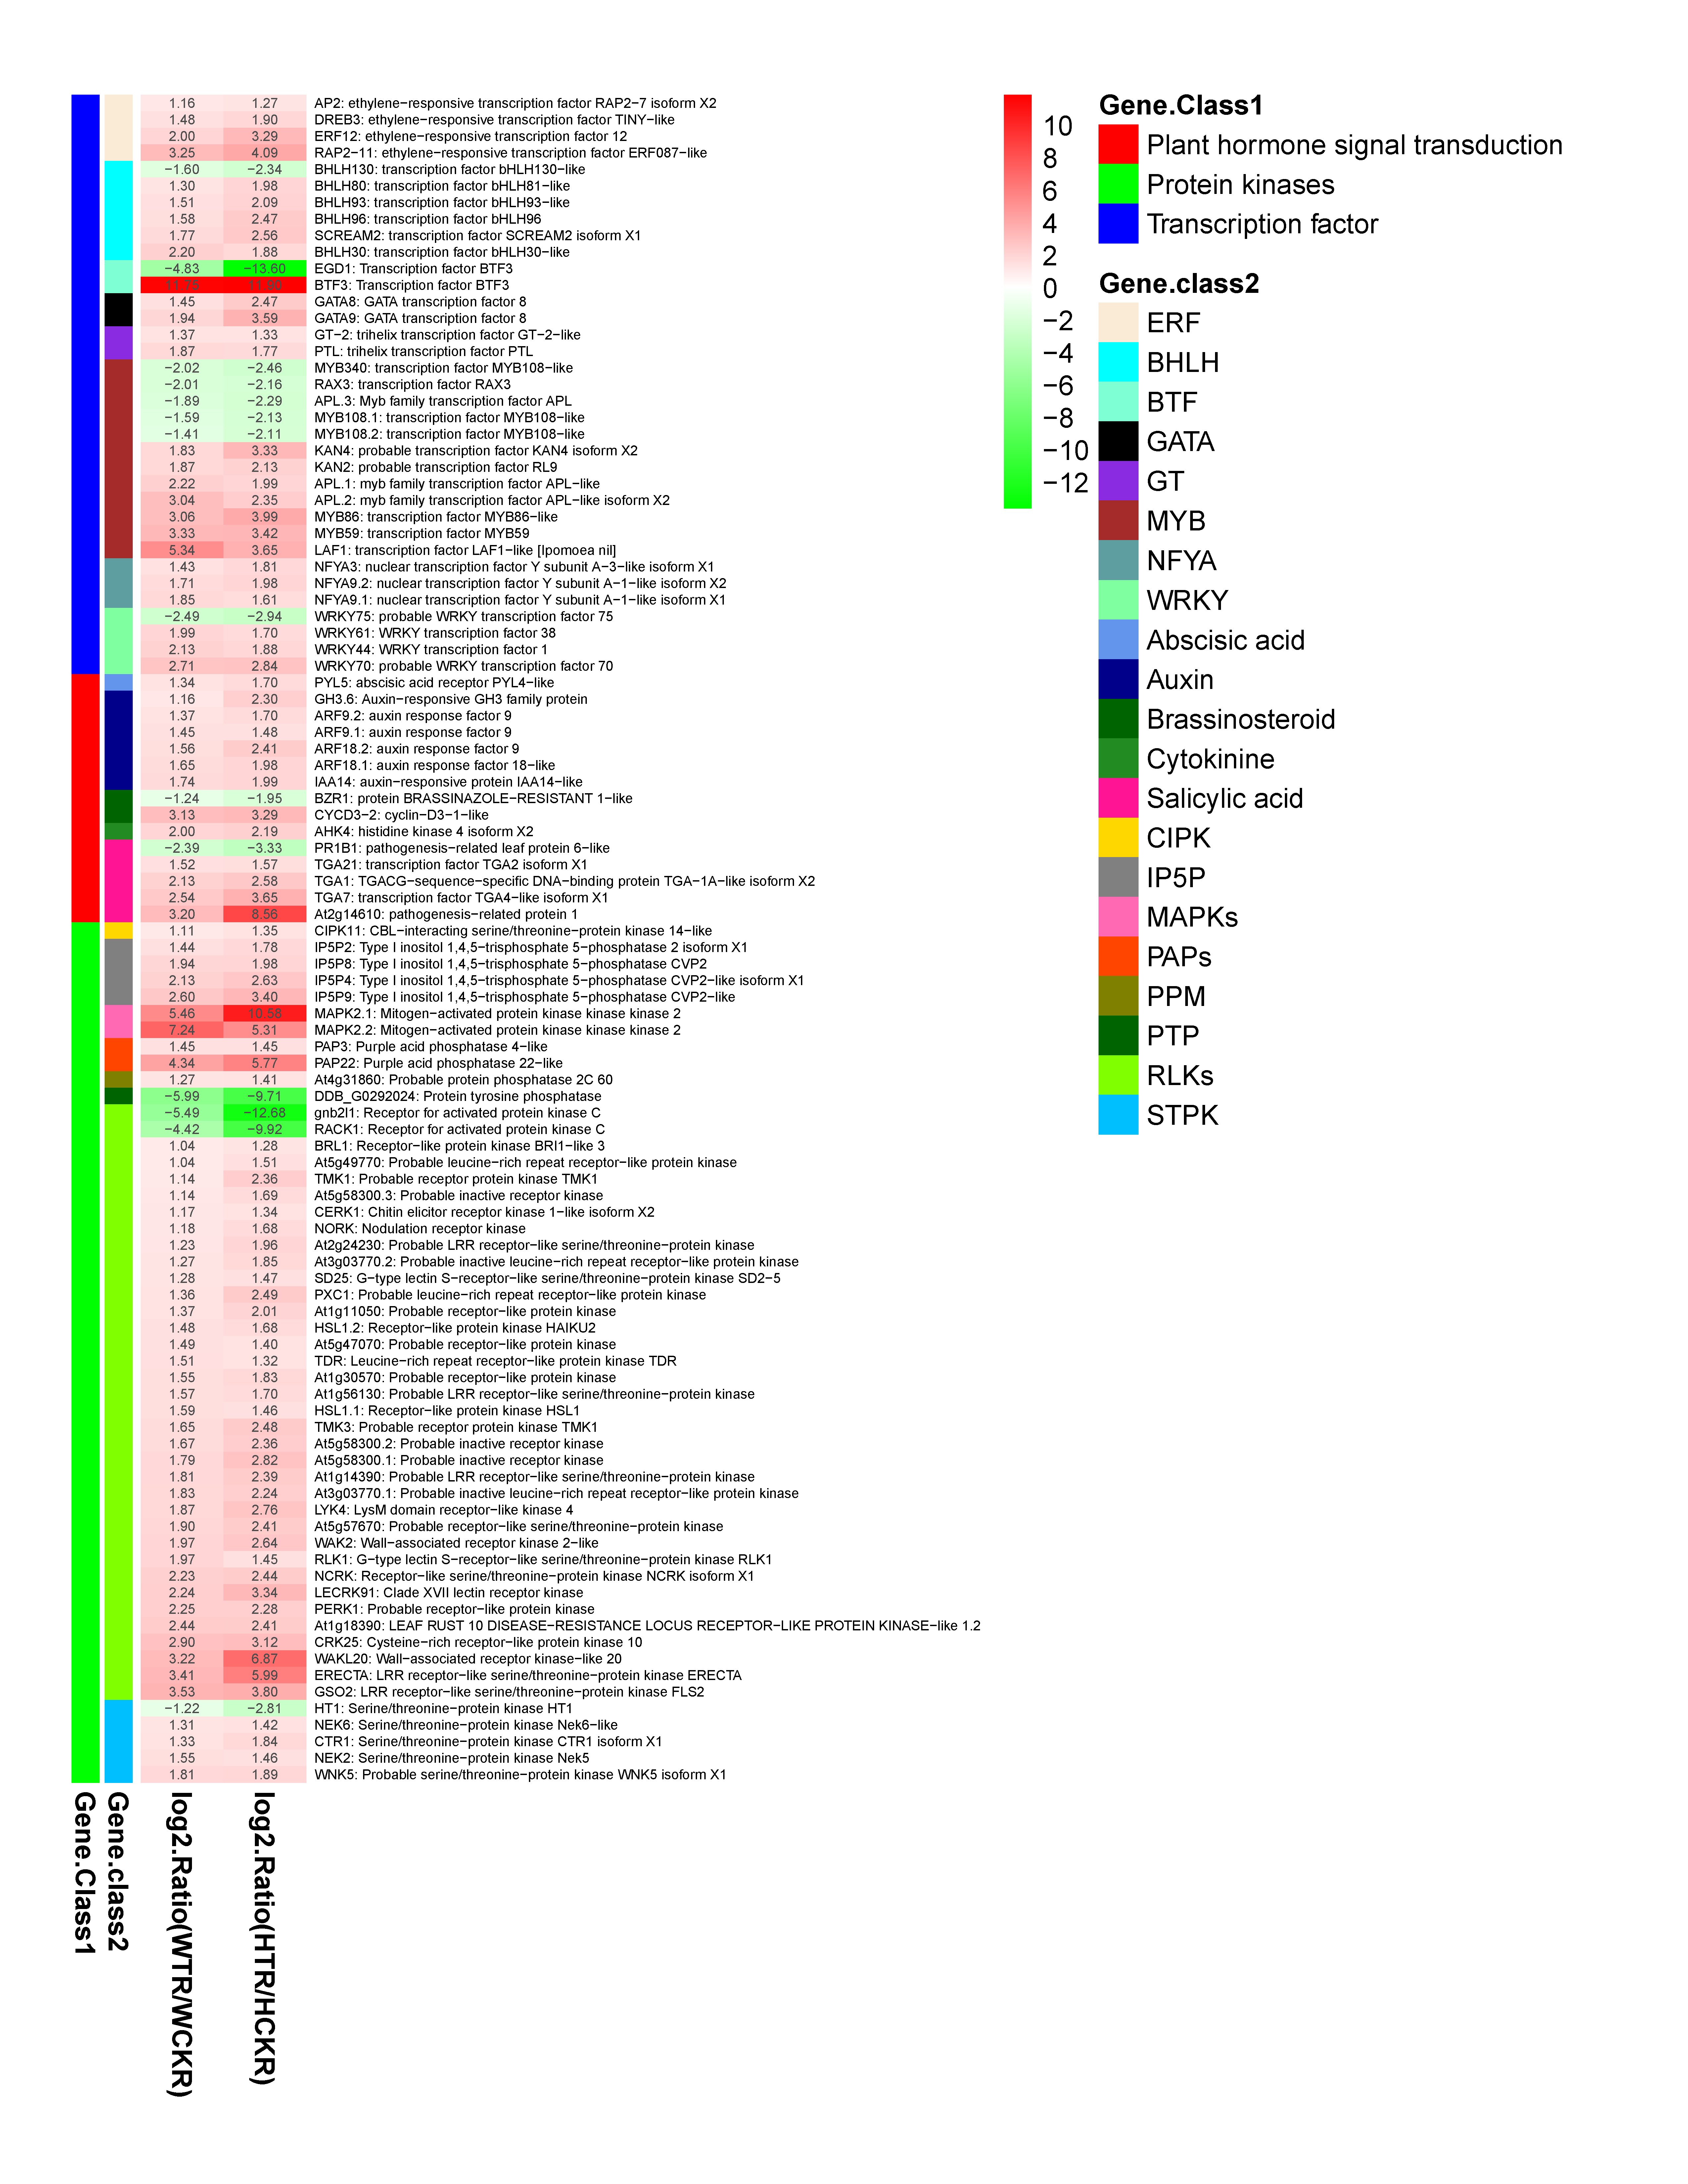
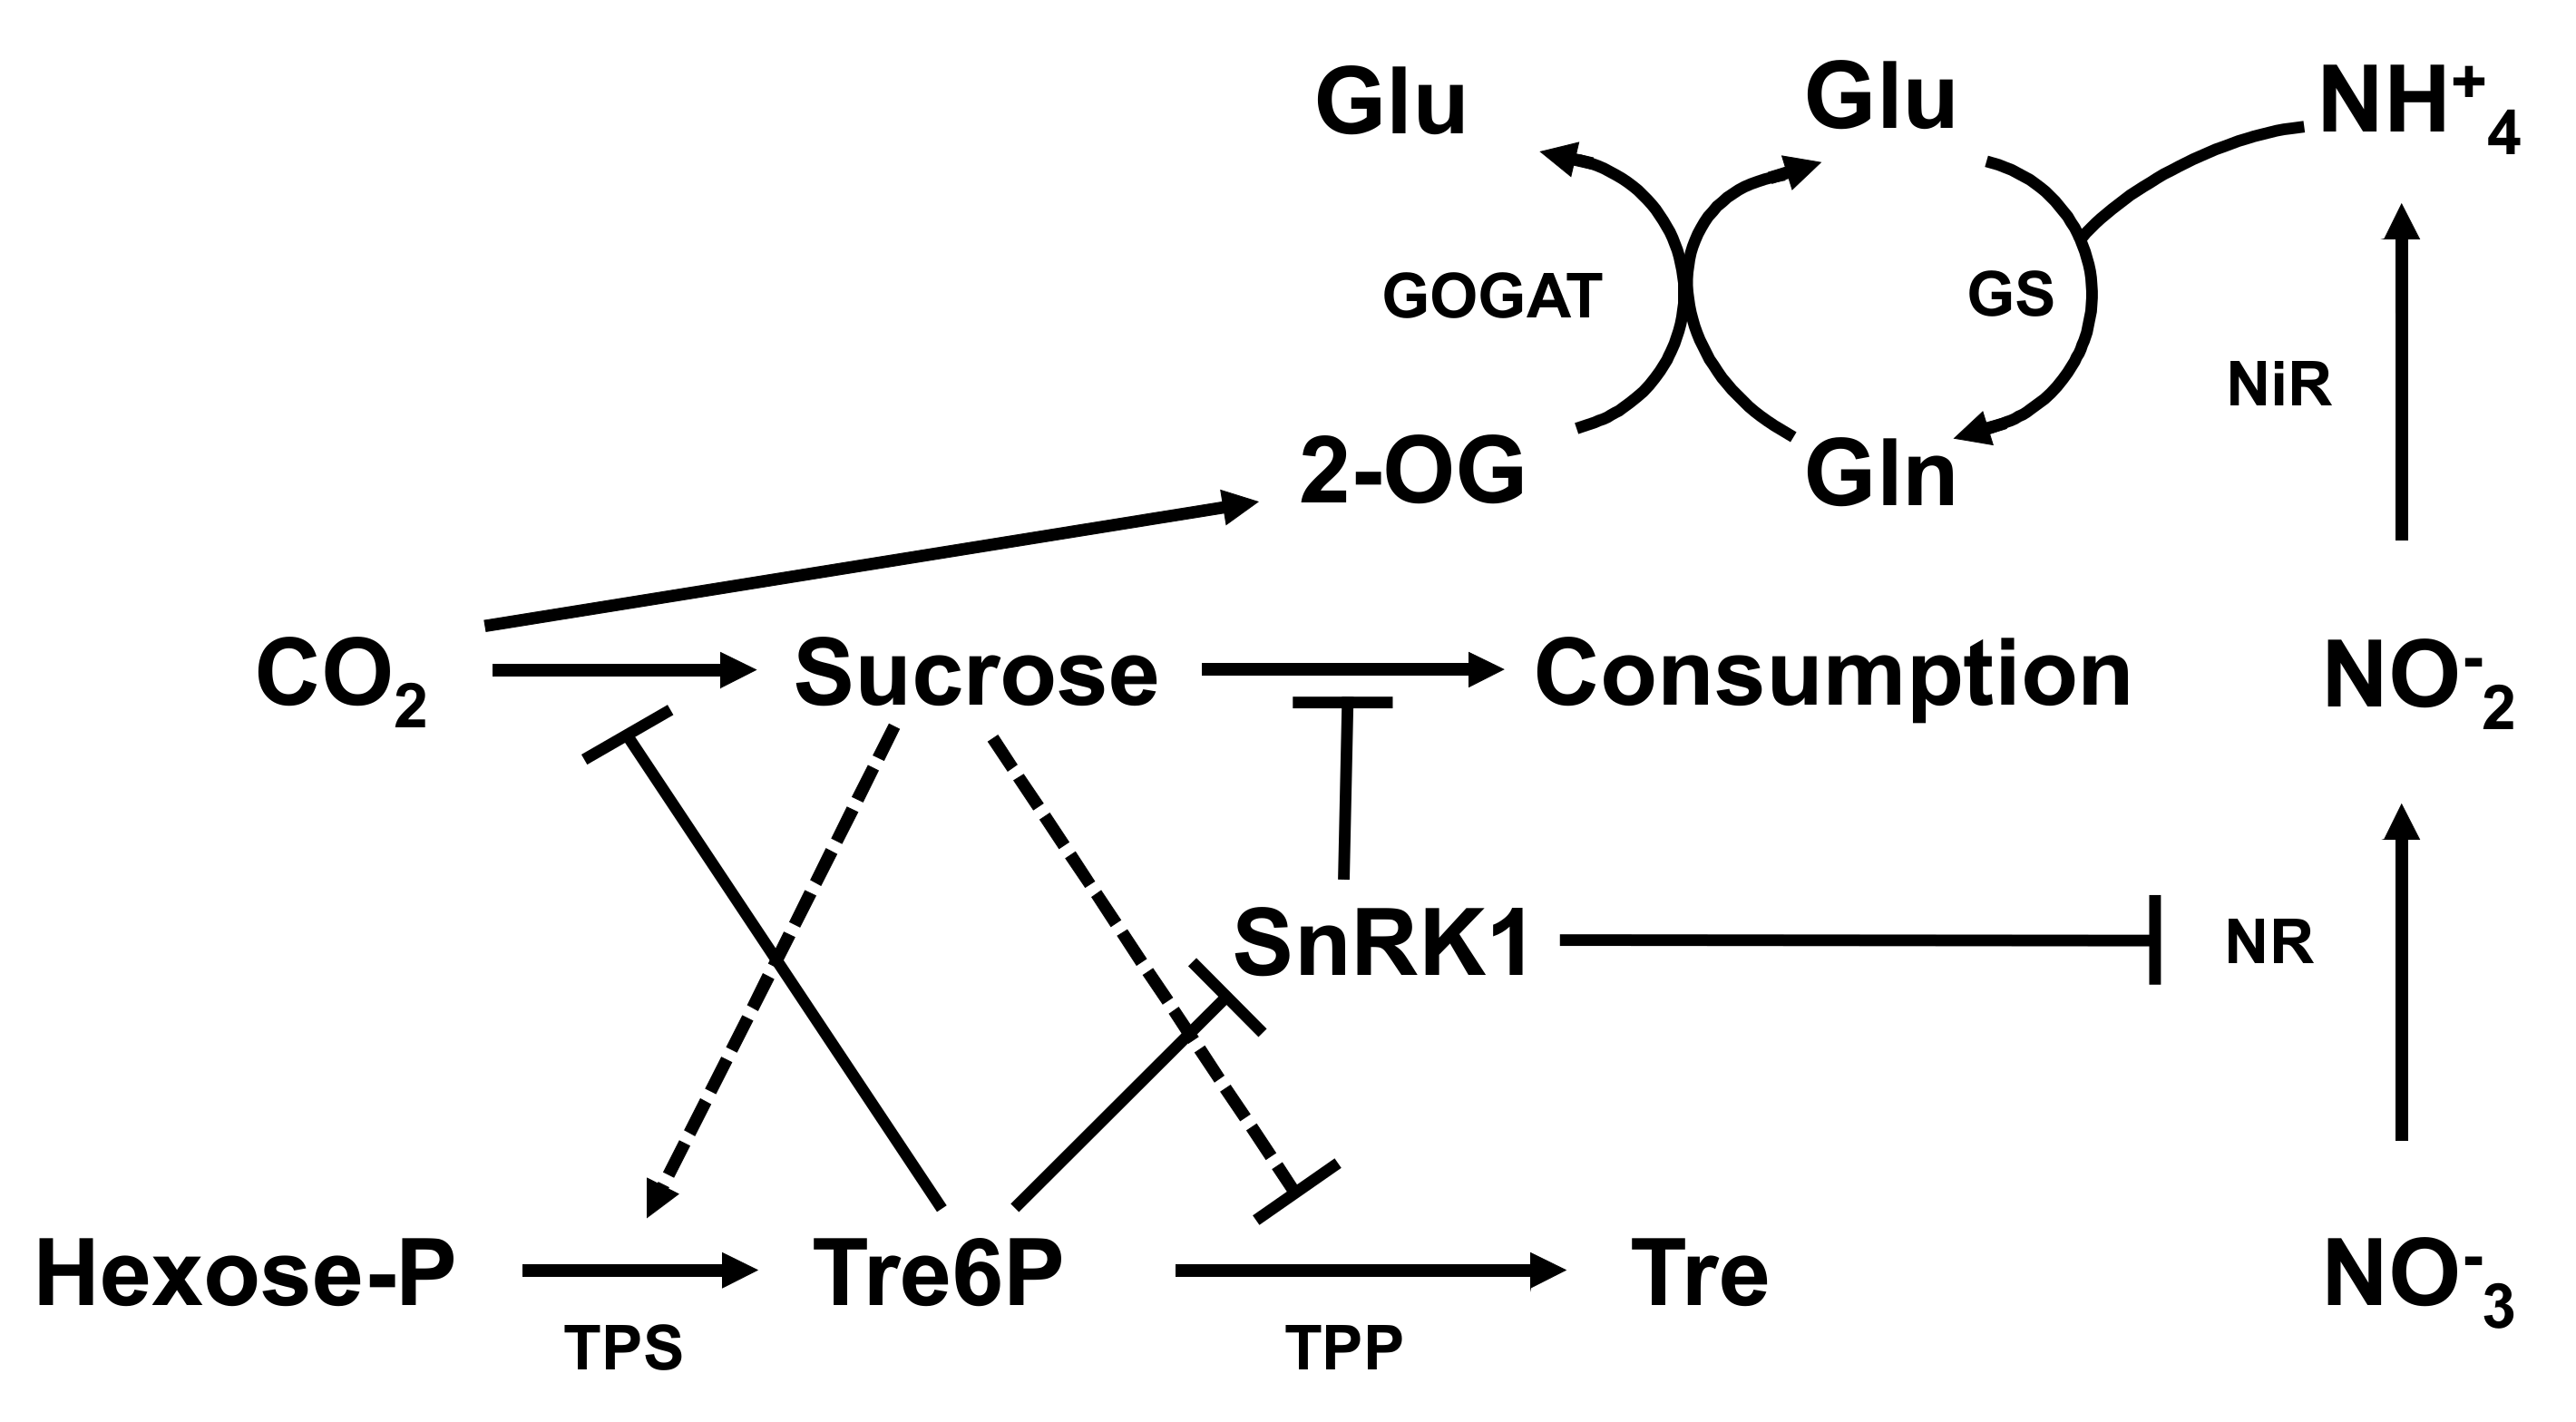
4.3. Identification of DEGs Related to Nitrogen Deficiency

DEGs related to N deficiency have been identified in many species, such as duckweed [46], Magnaporthe oryzae [47], rice (Oryza sativa L.) [23], Tibetan wild barley [23], Maize [48], soybean [20], Arabidopsis [19,49], etc. However, little is known about the DEGs related to N deficiency in F. mandshurica. In current study, analysis of DEGs in CP3, CP4 and CP5, CP6 can be used to identify genes that respond to N deficiency in F. mandshurica. Consequently, 8173 DEGs were identified using pair-wise comparison of each accession between complete N and N deficiency. Different parts of plants respond differently to nutrient stress and the number of DEGs in roots was significantly greater than that in foliage under N deficiency. For example, DEGs in the CP4 (4225) were nearly 14 times as much as that in the CP3 (305) and DEGs in the CP5 (4531) were nearly 3.2 times as much as that in the CP6 (1414).
N deficiency not only significantly reduces plant N markers traits such as chlorophyll content, total N content, amino acid content, and protein content [50], but also reduces nitrate ion transport (NRT) and the transcriptional expression of reduction-related metabolic enzymes (NR, GS, GOGAT) [51]. In plants, N is first actively absorbed by nitrate transporters in roots. In the current study, 10 DEGs encoding nitrate transporters were detected (Supplementary Materials: Table S4). Four, three, six, two and two DEGs encoding AMT, GS, GDH, NiR and NR were identified (Supplementary Materials: Table S4), which were key enzymes in N assimilation. The transcription expression of genes encoding GS, NR and GOGAT was also downregulated under N starvation in duckweed [45].
The N deficiency also has an important impact on the C metabolism [52] and significantly reduces biological processes such as photosynthesis, C assimilation and C metabolism, which reduces the concentration of organic acids in plants [50]. A total of six DEGs encoding CDF4, PYK1, RuBP and INVA were identified under N deficiency in this study. Phenylalanine (Phe) plays an important role in the interconnection of plant primary metabolism and secondary metabolism. The metabolism of Phe plays a central role in the channeling of C from photosynthesis to the biosynthesis of phenylpropanoids and lignin is one of Phe-derived compounds. The reduction of amino acid synthesis induced by N deficiency makes the C skeleton surplus [53], which is used for the synthesis of carbohydrates such as lignin and starch. Studies have shown that the lignin content is inversely proportional to the N fertilizer supply concentration [54]. N deficiency upregulates the transcriptional expression of genes related to lignin synthesis such as PAL, C4H, 4CL, and F5H [55]. In the current study, the DEGs in the phenylpropanoid pathway for the biosynthesis of lignin (Figure 9) were also significantly upregulated such as the 4CL gene and lignin content was increased in roots under N deficiency (Supplementary Materials: Figure S13). Suppression of 4CL gene expression exerted the biggest impact on lignin production of all of the genetic manipulations of phenylpropanoid related genes in conifers [56] and 4CL RNAi lines exhibited a reduced lignin content of approximately 50% [57]. Induction of lignin biosynthesis is an adaptive response of plants subjected to many abiotic stresses [58]. Transcriptional and physiological analyses identify a regulatory role for hydrogen peroxide in the lignin biosynthesis of copper-stressed rice roots [59]. The key genes for lignin synthesis, 4CL and CAD1, are significantly induced by GA, which in turn changes the composition of the cell wall [60]. In this study, the DEGs in the terpenoids and polyketides metabolism pathway for the biosynthesis of abscisic acid (ABA) and gibberellin A4 (GA4) (Figure 10) were also significantly upregulated in roots under N deficiency.
Hormones, transcription factors and kinases are the three major regulators in plants. In this study, among the DEGs related to protein kinases, transcription factors and hormone signaling, the number of upregulated DEGs accounts for 85%, 76% and 81%, respectively. Studies have shown that mitogen-activated protein kinase kinase 9 plays an important role in plant N tolerance [61]. Protein phosphorylation may be induced by N deficiency in F. mandshurica. For example, a total of 14, 92, 132 and 152 DEGs encoding protein kinases were found in CP3, CP4, CP5 and CP6, respectively (Supplementary Materials: Table S5). Transcriptional expression of N metabolism genes may be activated by transcription factors under N deficiency [17]. In this study, for the response to N deficiency, bHLH, MYB and AP2/ERF play a major role in roots, and WRKY plays a major role in foliage. The hormones homeostasis influences plant growth by regulating nutrients metabolism, such as proteins, nucleic acids and soluble carbohydrates [62,63,64]. N deficiency causes a significant decrease in GA and IAA content but increase in ABA content in rice foliage [65]. In this study, Hormone (auxin, ABA, SA, JA and CK) pathways were predominantly induced by N deficiency, especially ABA and GA pathways (Figure 10). Compared to control, endogenous ABA content was reduced by N deficiency (Supplementary Materials: Figure S14), but endogenous ZR, GA and IAA content (Supplementary Materials: Figure S15) was increased. Therefore, F. mandshurica is different from other species in response to N deficiency in endogenous hormones, and the reason for this difference needs further research. In addition, the response patterns of DEGs related to hormones under N deficiency in roots and foliage were different. For example, the hormones that predominantly played a role in the foliage were JA and ABA but in the roots were auxin, SA, CK and ABA.
Studies have shown that N deficiency not only leads to carbohydrates accumulation, but also induces overall stress. When Arabidopsis roots suffer from N deficiency, active oxygen accumulates, due to the reduction of electron transport system carriers [66]. Excessive active oxygen causes oxidative stress [67], which in turn leads to cell damage and death. In this study, the number of DEGs related to oxidative phosphorylation was the most among the significantly enriched KEGG pathways in roots. Plants under low N stress are more sensitive to oxidative damage caused by excessive light and show a significant reduction in photosynthetic capacity [68,69]. Several N deficiency-related metabolic pathways are also identified by KEGG analysis [45]. Integrate CP3, CP4, CP5 and CP6 comparisons, the major pathways involved in N deficiency were “Phenylpropanoid biosynthesis”, “Nitrogen metabolism”, “Diterpenoid biosynthesis”, “Isoquinoline alkaloid biosynthesis”. In addition, the pathway which had the most DEGs in the roots that responded most to N deficiency in both provenances was the “Ribosome” pathway. Studies on Magnaporthe oryzae proteomics have shown that N deficiency induces the synthesis of many extracellular proteins, and protein degradation and translation have also undergone extensive changes [46].

5. Conclusions

The data showed that greater C amount in WC provenance seedlings is mainly attributed to the high transcriptional expression of many metabolic genes in foliage under complete N. The response of HL provenance seedlings to N deficiency is significantly greater than that of WC provenances seedlings, which reduces the difference in C sequestration between the two provenances. Many genes related to N deficiency were identified, which will expand our current understanding of N responses. Many regulatory genes including transcription factors, hormone and protein kinases whose transcription levels were significantly different between WC and HL were identified under complete N and N deficiency.

Supplementary Materials

The following are available online at https://www.mdpi.com/1999-4907/12/2/257/s1: Figure S1: The dry weight, chlorophyll content, number of lateral roots and root to shoot ratio in two Fraxinus mandshurica provenances, WC and HL, under complete nitrogen and nitrogen deficiency. Each data point represents the average of three replicates, and nine seedlings were used for each treatment. Error bars represent mean ± SE. Different lowercase letters indicate significant differences at p < 0.05. Figure S2: The soluble sugar and free amino acids content in foliar and roots of two Fraxinus mandshurica provenances, WC and HL, under complete nitrogen and nitrogen deficiency. Each data point represents the average of three replicates, and nine seedlings were used for each treatment. Error bars represent mean ± SE. Different lowercase letters indicate significant differences at p < 0.05. Figure S3: The nitrogen assimilation enzyme activities (NR, GS and GOGAT) in foliar and roots of two Fraxinus mandshurica provenances, WC and HL, under complete nitrogen and nitrogen deficiency. Each data point represents the average of three replicates, and nine seedlings were used for each treatment. Error bars represent mean ± SE. Different lowercase letters indicate significant differences at p < 0.05. Figure S4: Length distribution of Fraxinus mandshurica unigenes. Figure S5: Histogram of clusters orthologous groups (KOG) classification; a total of 35879 unigenes with lengths more than 300 bp were divided into 25 KOG categories. Figure S6: Functional annotation of assembled sequences based on gene ontology (GO) categorization; 16,028 unigenes were grouped into the three main GO domains: “cellular component”, “molecular function” and “biological process”. Figure S7: The relative expression levels of (a) nine DEGs identified in the comparison CP1 and (b) six DEGs identified in the comparison CP4 and CP5 between RNA-Seq and qRT-PCR. The genes relative expression levels were determined by 2-ΔΔCT as expressed and were normalized to the expression level of TU. Figure S8: A Venn diagram describing overlaps among differentially expressed genes (DEGs) in HL and WC. (a) Upregulated genes in the folium and root. (b) Downregulated genes in the folium and root. (c) Upregulated genes in the folium and root under nitrogen deficiency. (d) Downregulated genes in the folium and root under nitrogen deficiency. Figure S9: Nine significantly enriched KEGG pathways for HL vs. WC in foliar under complete nitrogen. Figure S10: The DEGs related to transcription factors unique to HL and WC in response to nitrogen deficiency. Figure S11: The DEGs related to protein kinases unique to HL and WC in response to nitrogen deficiency. Figure S12: The DEGs related to plant hormone signal transduction unique to HL and WC in response to nitrogen deficiency. Figure S13: The lignin content in root of two Fraxinus mandshurica provenances, WC and HL, under complete nitrogen and nitrogen deficiency. Each data point represents the average of three replicates, and nine seedlings were used for each treatment. Error bars represent mean ± SE. Different lowercase letters indicate significant differences at p < 0.05. Figure S14: The content of endogenous ABA and GA in the foliar and root of two Fraxinus mandshurica provenances, WC and HL, under complete nitrogen and nitrogen deficiency. Each data point represents the average of three replicates, and nine seedlings were used for each treatment. Error bars represent mean ± SE. Different lowercase letters indicate significant differences at p < 0.05. Figure S15: The content of endogenous IAA and ZR in the foliar and root of two Fraxinus mandshurica provenances, WC and HL, under complete nitrogen and nitrogen deficiency. Each data point represents the average of three replicates, and nine seedlings were used for each treatment. Error bars represent mean ± SE. Different lowercase letters indicate significant differences at p < 0.05. Figure S16: Top20 of pathway enrichment between complete nitrogen and nitrogen deficiency in HL foliar (a), HL root (b), WC Foliar (c) and WC root (d). Table S1: Real-time quantitative PCR primers. Table S2: RNA quality assessment of 24 transcripts of Fraxinus mandshurica. Table S3: Summary of sample information and transcriptome sequencing output statistics for the Fraxinus mandshurica root and folium RNA-seq libraries. Table S4: Gene-encoding protein transporters and nitrate assimilation enzymes showing genotypic difference expression in response to nitrogen deficiency. Blank presented in the table means without significant difference in gene expression. Table S5: DEGs related to RLKs in CP3, CP4, CP5 and CP6.

Author Contributions

Data curation, X.Z. (Xingtang Zhao); formal analysis, X.Z. (Xingtang Zhao); funding acquisition, X.Z. (Xingtang Zhao) and Y.Z.; investigation, Z.L.; methodology, L.Y., X.J., X.Z. (Xu Zhang), M.L. and Y.M.; resources, J.L. and F.Z.; supervision, Y.Z. and writing—original draft, X.Z. (Xingtang Zhao). All authors have read and agreed to the published version of the manuscript.

Funding

This research was funded by the Fundamental Research Funds for the Central Universities of China (No. 2572017AA15) and Heilongjiang Province Applied Technology Research and Development Program (GA19B201).

Institutional Review Board Statement

Not applicable.

Informed Consent Statement

Not appliable.

Data Availability Statement

All raw read data were deposited in the Sequence Read Archive (SRA) in NCBI with the BioProject ID: PRJNA550459.

Acknowledgments

We thank the OmicShare forum, a free online platform for data analysis (www.omicshare.com/tools).

Conflicts of Interest

The authors declare that they have no competing interests.

References

  1. Nieto, V.; Giraldo-Charria, D.; Sarmiento, M.; Borralho, N. Effects of provenance and genetic variation on the growth and stem formation of Eucalyptus pellita in Colombia. J. Trop. For. Sci. 2016, 28, 227–234. [Google Scholar]
  2. Chhin, S.; Zalesny, R.S.; Parker, W.C.; Brissette, J. Dendroclimatic analysis of white pine (Pinus strobus L.) using long-term provenance test sites across eastern North America. For. Ecosyst. 2018, 5, 18–32. [Google Scholar] [CrossRef] [Green Version]
  3. Skulason, B.; Hansen, O.K.; Nielsen, U.B. Provenance variation in Christmas tree characteristics in subalpine fir (Abies lasiocarpa) planted in Denmark and Iceland. Scand. J. For. Res. 2018, 33, 222–232. [Google Scholar] [CrossRef]
  4. Pan, W.; Sun, J.; Xia, X.; Liu, R.; Wu, X.; Li, Y. Provenance variation in growth, stem-form, and wood basic density of 24-year-old Liriodendron. Austrian J. For. Sci. 2018, 343–362. [Google Scholar]
  5. Václav, B.; Petr, N.; Jaroslav, D. Results of Czech ash provenance experiment. J. For. Sci. 2017, 63, 263–274. [Google Scholar] [CrossRef] [Green Version]
  6. Zhou, C.B.; Gong, W. Effect of provenance and climate on xylem anatomy of Haloxylon ammodendron (C. A. mey) bunge in the gurbantunggut desert, China. Appl. Ecol. Environ. Res. 2017, 15, 1309–1321. [Google Scholar] [CrossRef]
  7. Lu, P.; Parker, W.C.; Colombo, S.J.; Man, R. Restructuring tree provenance test data to conform to reciprocal transplant experiments for detecting local adaptation. J. Appl. Ecol. 2016, 53, 1088–1097. [Google Scholar] [CrossRef] [Green Version]
  8. Thomson, A.M.; Riddell, C.L.; Parker, W.H. Boreal forest provenance tests used to predict optimal growth and response to climate change: 2. Black spruce. Can. J. Res. 2009, 39, 143–153. [Google Scholar] [CrossRef]
  9. Hebel, I.; Haas, R.; Dounavi, A. Genetic Variation of Common Ash (Fraxinus excelsior L.) Populations From Provenance Regions in Southern Germany by Using Nuclear and Chloroplast Microsatellites. Silvae Genetica 2006, 55, 38–44. [Google Scholar] [CrossRef] [Green Version]
  10. Calvo, L.; Hernández, V.; Valbuena, L.; Taboada, A. Provenance and seed mass determine seed tolerance to high temperatures associated to forest fires in Pinus pinaster. Ann. For. Sci. 2015, 73, 381–391. [Google Scholar] [CrossRef] [Green Version]
  11. Santoni, I.; Callone, E.; Sandak, A.; Sandak, J.; Dire, S. Solid state NMR and IR characterization of wood polymer structure in relation to tree provenance. Carbohydr. Polym. 2015, 117, 710–721. [Google Scholar] [CrossRef] [PubMed]
  12. Spinnler, D.; Egli, P.; Körner, C. Provenance effects and allometry in beech and spruce under elevated CO2 and nitrogen on two different forest soils. Basic Appl. Ecol. 2003, 4, 467–478. [Google Scholar] [CrossRef]
  13. AmusAnt, N.; Digeon, A.; Descroix, L.; BruneAu, O.; BezArD, V.; BeAuchène, J. Planting rosewood for the sustainable essential oil productionInfluence of surrounding forest and seed provenance on tree growth and essential oil yield. Bois Forets des Tropiques 2015, 326, 57–65. [Google Scholar] [CrossRef]
  14. Klisz, M.; Ukalska, J.; Koprowski, M.; Tereba, A.; Puchałka, R.; Przybylski, P.; Jastrzębowski, S.; Nabais, C. Effect of provenance and climate on intra-annual density fluctuations of Norway spruce Picea abies (L.) Karst. in Poland. Agric. For. Meteorol. 2019, 269–270, 145–156. [Google Scholar] [CrossRef]
  15. Montwé, D.; Isaac-Renton, M.; Hamann, A.; Spiecker, H. Cold adaptation recorded in tree rings highlights risks associated with climate change and assisted migration. Nat. Commun. 2018, 9. [Google Scholar] [CrossRef] [Green Version]
  16. Santiso, X.; Retuerto, R. Low among-provenance differences in structural and functional plasticity in response to nutrients in saplings of the circum-Mediterranean tree Arbutus unedo L. Tree Physiol. 2015, 35, 1118–1128. [Google Scholar] [CrossRef] [Green Version]
  17. Jiang, L.; Ball, G.; Hodgman, C.; Coules, A.; Zhao, H.; Lu, C. Analysis of Gene Regulatory Networks of Maize in Response to Nitrogen. Genes 2018, 9. [Google Scholar] [CrossRef] [PubMed] [Green Version]
  18. Wang, Q.; Nian, J.; Xie, X.; Yu, H.; Zhang, J.; Bai, J.; Dong, G.; Hu, J.; Bai, B.; Chen, L.; et al. Genetic variations in ARE1 mediate grain yield by modulating nitrogen utilization in rice. Nat. Commun. 2018, 9, 735–744. [Google Scholar] [CrossRef] [Green Version]
  19. Bi, Y.; Wang, R.; Zhu, T.; Rothstein, S.J. Global transcription profiling reveals differential responses to chronic nitrogen stress and putative nitrogen regulatory components in Arabidopsis. BMC Genom. 2007, 8, 281–298. [Google Scholar] [CrossRef] [Green Version]
  20. Hao, Q.N.; Zhou, X.A.; Sha, A.H.; Wang, C.; Zhou, R.; Chen, S.L. Identification of genes associated with nitrogen-use efficiency by genome-wide transcriptional analysis of two soybean genotypes. BMC Genom. 2011, 12, 525–539. [Google Scholar] [CrossRef] [PubMed] [Green Version]
  21. Zhao, X.; Liang, N.; He, L.; Yu, L.; Cao, Y.; Xia, D.; Xiao, Y.; Zhang, G.; Zeng, F.; Zhan, Y. Variation in carbon traits among Fraxinus mandshurica populations and allometric equations between carbon traits and growth traits. New For. 2021. [Google Scholar] [CrossRef]
  22. Langmead, B.; Trapnell, C.; Pop, M.; Salzberg, S.L. Ultrafast and memory-efficient alignment of short DNA sequences to the human genome. Genome Biol. 2009, 10, R25. [Google Scholar] [CrossRef] [Green Version]
  23. Yang, W.; Yoon, J.; Choi, H.; Fan, Y.; Chen, R.; An, G. Transcriptome analysis of nitrogen-starvation-responsive genes in rice. BMC Plant Biol. 2015, 15. [Google Scholar] [CrossRef] [Green Version]
  24. He, Z.; Zhan, Y.; Zeng, F.; Zhao, X.; Wang, X. Drought physiology and gene expression characteristics of Fraxinus interspecific hybrids. Plant Growth Regul. 2016, 78, 179–193. [Google Scholar] [CrossRef]
  25. Wu, Y.; Jun, R.; Chen, W.; Liu, X.; Kong, F.; Ke, Y.; Shin, H.; Yuan, J. Effect of low-nitrogen stress on photosynthesis and chlorophyll fluorescence characteristics of maize cultivars with different lownitrogen tolerances. J. Integr. Agric. 2019, 18, 1246–1256. [Google Scholar] [CrossRef]
  26. Hao, Y.-Q.; Lu, G.-Q.; Wang, L.-H.; Wang, C.-L.; Guo, H.-M.; Li, Y.-F.; Cheng, H.-M. Overexpression of AmDUF1517 enhanced tolerance to salinity, drought, and cold stress in transgenic cotton. J. Integr. Agric. 2018, 17, 2204–2214. [Google Scholar] [CrossRef]
  27. Rosen, H. A Modfied Ninhydrin Calorimetric Analysis for Amino Acids. Arch. Biochem. Biophys. 1957, 67, 10–15. [Google Scholar] [CrossRef]
  28. Turano, F.J.; Muhitch, M.J. Differential accumulation of ferredoxin- and NADH-dependent glutamate synthase activities, peptides, and transcripts in developing soybean seedlings in response to light, nitrogen, and nodulation. Physiol. Plant. 1999, 107, 407–418. [Google Scholar] [CrossRef]
  29. Brugière, N.; Dubois, F.; Limami, A.M.; Lelandais, M.; Roux, Y.; Sangwan, R.S.; Hirel, B. Glutamine Synthetase in the Phloem Plays a Major Role in Controlling Proline Production. Plant Cell 1999, 11, 1995–2011. [Google Scholar] [CrossRef] [Green Version]
  30. Guiz, C.; Hirel, B.; Shedlofsky, G.; Gadal, P. Occurrence and influence of light on the relative proportions of two glutamine sythetases in rice leaves. Plant Sci. Lett. 1979, 15, 271–277. [Google Scholar] [CrossRef]
  31. Weber, J.C.; Larwanou, M.; Abasse, T.A.; Kalinganire, A. Growth and survival of Prosopis africana provenances tested in Niger and related to rainfall gradients in the West African Sahel. For. Ecol. Manag. 2008, 256, 585–592. [Google Scholar] [CrossRef]
  32. Saenger, P.; West, P.W. Phenotypic variation of the mangrove species Avicennia marina (Forssk.) Vierh. from seven provenances around Australia. Aquat. Bot. 2018, 149, 28–32. [Google Scholar] [CrossRef]
  33. Ginwal, H.S. Provenance and family variation in growth performance of Eucalyptus tereticornis (Sm.) in a provenance cum progeny trial in Midnapore, India. For. Ecol. Manag. 2009, 258, 2529–2534. [Google Scholar] [CrossRef]
  34. Miranda, I.; Almeida, M.H.; Pereira, P. Provenance and site variation of wood density in Eucalyptus globulus labill. At harvest age and its relation to a non-destructive early assessment. For. Ecol. Manag. 2001, 149, 235–240. [Google Scholar] [CrossRef]
  35. Bergin, D.O.; Kimberley, M.O.; Low, C.B. Provenance variation in Podocarpus totara (D. Don): Growth, tree form and wood density on a coastal site in the north of the natural range, New Zealand. For. Ecol. Manag. 2008, 253, 1367–1378. [Google Scholar] [CrossRef]
  36. Fkiri, S.; Guibal, F.; Fady, B.; Khorchani, A.E.; Khaldi, A.; Khouja, M.L.; Nasr, Z. Tree-rings to climate relationships in nineteen provenances of four black pines sub-species (Pinus nigra Arn.) growing in a common garden from Northwest Tunisia. Dendrochronologia 2018, 50, 44–51. [Google Scholar] [CrossRef]
  37. Luo, J.; Li, H.; Liu, T.; Polle, A.; Peng, C.; Luo, Z.-B. Nitrogen metabolism of two contrasting poplar species during acclimation to limiting nitrogen availability. J. Exp. Bot. 2013, 64, 4207–4224. [Google Scholar] [CrossRef] [Green Version]
  38. Yan, B.; Wu, B.; Gao, Y.; Wu, J.; Niu, J.; Xie, Y.; Cui, Z.; Zhang, Z. Effects of nitrogen and phosphorus on the regulation of nonstructural carbohydrate accumulation, translocation and the yield formation of oilseed flax. Field Crop. Res. 2018, 2019, 229–241. [Google Scholar] [CrossRef]
  39. Hause, B.; Vörös, K.; Kogel, K.; Besser, K.; Wasternack, C. A Jasmonate-responsive Lipoxygenase of Barley Leaves is Induced by Plant Activators but not by Pathogens. J. Plant Physiol. 1999, 154, 459–462. [Google Scholar] [CrossRef]
  40. Vargas, J.M.M.; Castillo, K.C.; Gallardo, N.M.; Ortiz, J.J.O.; Frier, J.P.D.; Winkler, R. Modulation of steroidal glycoalkaloid biosynthesis in tomato (Solanum lycopersicum) by jasmonic acid. Plant Sci. 2018, 277, 155–165. [Google Scholar] [CrossRef]
  41. Alsoufi, A.S.M.; Pączkowski, C.; Szakiel, A.; Długosz, M. Effect of jasmonic acid and chitosan on triterpenoid production in Calendula officinalis hairy root cultures. Phytochem. Lett. 2019, 31, 5–11. [Google Scholar] [CrossRef]
  42. Vanholme, B.; Grunewald, W.; Bateman, A.; Kohchi, T.; Gheysen, G. The tify family previously known as ZIM. Trends Plant Sci. 2007, 12, 239–244. [Google Scholar] [CrossRef] [PubMed]
  43. Zarattini, M.; Farjad, M.; Launay, A.; Cannella, D.; Soulié, M.C.; Bernacchia, G.; Fagard, M. Every cloud has a silver lining how abiotic stresses affect gene expression in plant pathogen interactions. J. Exp. Bot. 2020. [Google Scholar] [CrossRef] [PubMed]
  44. Figueroa, C.M.; Lunn, J.E. A Tale of Two Sugars Trehalose 6-Phosphate and Sucrose. Plant Physiol. 2016, 172, 7–27. [Google Scholar] [CrossRef] [Green Version]
  45. Baena-González, E.; Lunn, J.E. SnRK1 and trehalose 6-phosphate—Two ancient pathways converge to regulate plant metabolism and growth. Curr. Opin. Plant Biol. 2020, 55, 52–59. [Google Scholar] [CrossRef] [PubMed]
  46. Yu, C.; Zhao, X.; Qi, G.; Bai, Z.; Wang, Y.; Wang, S.; Ma, Y.; Liu, Q.; Hu, R.; Zhou, G. Integrated analysis of transcriptome and metabolites reveals an essential role of metabolic flux in starch accumulation under nitrogen starvation in duckweed. Biotechnol. Biofuels 2017, 10, 167–180. [Google Scholar] [CrossRef] [Green Version]
  47. Oh, Y.; Robertson, S.L.; Parker, J.; Muddiman, D.C.; Dean, R.A. Comparative proteomic analysis between nitrogen supplemented and starved conditions in Magnaporthe oryzae. Proteome Sci. 2017, 15, 20. [Google Scholar] [CrossRef] [Green Version]
  48. Quan, X.; Zeng, J.; Ye, L.; Chen, G.; Han, Z.; Shah, J.M.; Zhang, G. Transcriptome profiling analysis for two Tibetan wild barley genotypes in responses to low nitrogen. BMC Plant Biol. 2016, 16, 30. [Google Scholar] [CrossRef] [Green Version]
  49. Bi, Y.; Meyer, A.; Downs, G.S.; Shi, X.; El-kereamy, A.; Lukens, L.; Rothstein, S.J. High throughput RNA sequencing of a hybrid maize and its parents shows different mechanisms responsive to nitrogen limitation. BMC Genom. 2014, 15, 77–88. [Google Scholar] [CrossRef] [Green Version]
  50. Gutiérrez, R.A.; Lejay, L.V.; Dean, A.; Chiaromonte, F.; Shasha, D.E.; Coruzzi, G.M. Qualitative network models and genome-wide expression data define carbonnitrogen-responsive molecular machines in Arabidopsis. Genome Biol. 2007, 8, R7. [Google Scholar] [CrossRef] [PubMed] [Green Version]
  51. Amiour, N.; Imbaud, S.; Clément, G.; Agier, N.; Zivy, M.; Valot, B.; Balliau, T.; Armengaud, P.; Quilleré, I.; Cañas, R.; et al. The use of metabolomics integrated with transcriptomic and proteomic studies for identifying key steps involved in the control of nitrogen metabolism in crops such as maize. J. Exp. Bot. 2012, 63, 5017–5033. [Google Scholar] [CrossRef] [Green Version]
  52. Guo, X.; Yu, C.; Luo, L.; Wan, H.; Zhen, N.; Xu, T.; Tan, J.; Pan, H.; Zhang, Q. Transcriptome of the floral transition in Rosa chinensis ‘Old Blush’. BMC Genom. 2017, 18, 199–216. [Google Scholar] [CrossRef] [Green Version]
  53. Ning, P.; Yang, L.; Li, C.; Fritschi, F.B. Post-silking carbon partitioning under nitrogen deficiency revealed sink limitation of grain yield in maize. J. Exp. Bot. 2018, 69, 1707–1719. [Google Scholar] [CrossRef] [PubMed] [Green Version]
  54. PlavcovÁ, L.; Hacke, U.G.; Almeida-Rodriguez, A.M.; Li, E.; Douglas, C.J. Gene expression patterns underlying changes in xylem structure and function in response to increased nitrogen availability in hybrid poplar. Plant Cell Environ. 2013, 36, 186–199. [Google Scholar] [CrossRef]
  55. Sun, Q.; Liu, X.; Yang, J.; Liu, W.; Du, Q.; Wang, H.; Fu, C.; Li, W.X. MicroRNA528 Affects Lodging Resistance of Maize by Regulating Lignin Biosynthesis under Nitrogen-Luxury Conditions. Mol. Plant 2018, 11, 806–814. [Google Scholar] [CrossRef] [Green Version]
  56. Camargo, E.L.O.; Nascimento, L.C.; Soler, M.; Salazar, M.M.; Lepikson-Neto, J.; Marques, W.L.; Alves, A.; Teixeira, P.J.P.L.; Mieczkowsk, P.; Carazzolle, M.F.; et al. Contrasting nitrogen fertilization treatments impact xylem gene expression and secondary cell wall lignification in Eucalyptus. BMC Plant Biol. 2014, 14, 256–272. [Google Scholar] [CrossRef] [PubMed] [Green Version]
  57. Pascual, M.B.; El-Azaz, J.; de la Torre, F.N.; Cañas, R.A.; Avila, C.; Cánovas, F.M. Biosynthesis and Metabolic Fate of Phenylalanine in Conifers. Front. Plant Sci. 2016, 7. [Google Scholar] [CrossRef] [PubMed] [Green Version]
  58. Wagner, A.; Donaldson, L.; Kim, H.; Phillips, L.; Flint, H.; Steward, D.; Torr, K.; Koch, G.; Schmitt, U.; Ralph, J. Suppression of 4-Coumarate-CoA Ligase in the Coniferous Gymnosperm Pinus radiata. Plant Physiol. 2009, 149, 370–383. [Google Scholar] [CrossRef] [Green Version]
  59. Moura, J.C.M.S.; Bonine, C.A.V.; Viana, J.O.F.; Dornelas, M.C.; Mazzafera, P. Abiotic and Biotic Stresses and Changes in the Lignin Content and Composition in Plants. J. Integr. Plant Biol. 2010, 52, 360–376. [Google Scholar] [CrossRef]
  60. Liu, Q.; Zheng, L.; He, F.; Zhao, F.-J.; Shen, Z.; Zheng, L. Transcriptional and physiological analyses identify a regulatory role for hydrogen peroxide in the lignin biosynthesis of copper-stressed rice roots. Plant Soil 2014, 387, 323–336. [Google Scholar] [CrossRef]
  61. García-Rojas, M.; Meneses, M.; Oviedo, K.; Carrasco, C.; Defilippi, B.; González-Agüero, M.; León, G.; Hinrichsen, P. Exogenous gibberellic acid application induces the overexpression of key genes for pedicel lignification and an increase in berry drop in table grape. Plant Physiol. Biochem. 2018, 126, 32–38. [Google Scholar] [CrossRef]
  62. Luo, J.; Wang, X.; Feng, L.; Li, Y.; He, J. The mitogen-activated protein kinase kinase 9 (MKK9) modulates nitrogen acquisition and anthocyanin accumulation under nitrogen-limiting condition in Arabidopsis. Biochem. Biophys. Res. Commun. 2017, 487, 539–544. [Google Scholar] [CrossRef]
  63. Albacete, A.A.; Martínez-Andújar, C.; Pérez-Alfocea, F. Hormonal and metabolic regulation of source–sink relations under salinity and drought: From plant survival to crop yield stability. Biotechnol. Adv. 2014, 32, 12–30. [Google Scholar] [CrossRef]
  64. Hisano, H.; Matsuura, T.; Mori, I.C.; Yamane, M.; Sato, K. Endogenous hormone levels affect the regeneration ability of callus derived from different organs in barley. Plant Physiol. Biochem. 2016, 99, 66–72. [Google Scholar] [CrossRef] [PubMed]
  65. Verbon, E.H.; Liberman, L.M. Beneficial Microbes Affect Endogenous Mechanisms Controlling Root Development. Trends Plant Sci. 2016, 21, 218–229. [Google Scholar] [CrossRef] [Green Version]
  66. Xiong, Q.; Tang, G.; Zhong, L.; He, H.; Chen, X. Response to Nitrogen Deficiency and Compensation on Physiological Characteristics, Yield Formation, and Nitrogen Utilization of Rice. Front. Plant Sci. 2018, 9, 1075. [Google Scholar] [CrossRef] [PubMed] [Green Version]
  67. Grossman, A.; Takahashi, H. Macronutrient Utilization by Photosynthetic Eukaryotes and the Fabric of Interactions. Annu. Rev. Plant Physiol. Plant Mol. Biol. 2001, 52, 163–210. [Google Scholar] [CrossRef] [PubMed] [Green Version]
  68. Mittler, R. Oxidative stress, antioxidants and stress tolerance. Trends Plant Sci. 2002, 7, 405–410. [Google Scholar] [CrossRef]
  69. Diaz, C.; Colombani, V.C.; Loudet, O.; Belluomo, P.; Moreau, L.; Vedele, F.D.; Morot-Gaudry, J.F.; Daubresse, C.M. Leaf yellowing and anthocyanin accumulation are two genetically independent strategies in response to nitrogen limitation in Arabidopsis thaliana. Plant Cell Physiol. 2006, 47, 74–83. [Google Scholar] [CrossRef] [Green Version]
Figure 1. The carbon concentration (a), N concentration (b), carbon amount (c) and nitrogen amount (d) in two Fraxinus mandshurica provenances, Wuchang (WC) and Hailin (HL), under complete nitrogen and nitrogen deficiency.
Forests 12 00257 g001
Figure 2. Venn diagram of the number of unigenes annotated by BLASTx against the protein databases.
Forests 12 00257 g002
Figure 3. A Venn diagram describing overlaps among the differentially expressed genes (DEGs) in HL and WC. CP1: HCKF vs. WCKF, CP2: HCKR vs. WCKR, CP7: HTF vs. WTF and CP8: HTR vs. WTR. WCKF, WCKR, HCKF and HCKR indicate cDNA libraries of the Wuchang provenance foliage, Wuchang provenance roots, Hailin provenance foliage and Hailin provenance roots under normal nitrogen, respectively. WTF, WTR, HTF and HTR indicate cDNA libraries of the Wuchang provenance foliage, Wuchang provenance roots, Hailin provenance foliage and Hailin provenance roots under nitrogen deficiency, respectively.
Forests 12 00257 g003
Figure 4. DEGs related to the transcription factors, plant hormone signal transduction and protein kinases for HL vs. WC in foliar under complete nitrogen.
Forests 12 00257 g004
Figure 5. A Venn diagram describing overlaps among the differentially expressed genes (DEGs) between normal nitrogen and nitrogen deficiency. CP3: WCKF vs. WCTF, CP4: WCKR vs. WTR, CP5: HCKR vs. HTR and CP6: HCKF vs. HTF.
Forests 12 00257 g005
Figure 6. The numbers of DEGs related to nitrogen deficiency and DEGs annotated by the KEGG pathway in two Fraxinus mandshurica provenances, WC and HL, in the foliar and root. The numbers of DEGs related to nitrogen deficiency in foliar and root (a), foiliar (c) and root (e). The numbers of DEGs related to nitrogen deficiency annotated by the KEGG pathway in foliar and root (b), foiliar (d) and root (f).
Forests 12 00257 g006
Figure 7. The DEGs related to the transcription factors, plant hormone, signal transduction and protein kinases shared by both HL and WC in the roots in response to nitrogen deficiency.
Forests 12 00257 g007
Figure 8. The Suc-Tre6P nexus in the foliar. NR, nitrate reductase; NiR, nitrite reductase; GS, glutamine synthetase; GOGAT, glutamate synthetase; 2-OG, Ketoglutarate; Tre6P, Trehalose 6-phosphate; Tre, Trehalose; TPS, Tre6P-synthase and TPP, Tre6P-phosphatase.
Forests 12 00257 g008
Figure 9. The phenylpropanoid pathway for the biosynthesis of a lignin. The relative levels of expression are shown by a color gradient from low (blue) to high (red). For each heatmap from left to right: WCKR vs. WTR (CP4, first column) and HCKR vs. HTR (CP5, second column). PAL, L-phenylalanine ammonia-lyase; C4H, cinnamate 4-hydroxylase; 4CL, 4-coumarate--CoA ligase; HCT, hydroxycinnamoyl CoA: shikimate hydroxycinnamoyl transferase; C3H, 4-coumarate-3-hydroxylase; FAOMT, caffeoyl-CoA O-methyltransferase; COMT1, caffeic acid/5-hydroxyconiferaldehyde 3-O-methyltransferase; F5H, ferulate/coniferaldehyde 5-hydroxylase; CAD, cinnamyl alcohol dehydrogenase and PER, eroxidase.
Forests 12 00257 g009
Figure 10. The terpenoids and polyketides metabolism pathways for the biosynthesis of Abscisic acid (ABA) and Gibberellin A4 (GA4). Relative levels of expression are showed by a color gradient from low (blue) to high (red). For each heatmap, from left to right: WCKR vs. WTR (CP4, first column) and HCKR vs. HTR (CP5, second column). GGPS, geranylgeranyl diphosphate synthase; CPS, ent-copalyl diphosphate synthase; KS, cis-abienol synthase; KO, ent-kaurene oxidase; KAO, ent-kaurenoic acid oxidase; GA20OX, gibberellin 20 oxidase; GA3OX, gibberellin 3 oxidase; PYS1: phytoene synthase; PDS, 15-cis-phytoene desaturase; CYP97A3, beta-ring hydroxylase; ABA2, zeaxanthin epoxidase; NCED, 9-cis-epoxycarotenoid dioxygenase and AAO3, abscisic-aldehyde oxidase.
Forests 12 00257 g010
Table 1. Differentially expressed genes (DEGs) identified in pairwise comparisons.
CodeStage ComparisonLog2 Ratio ()Total DEGsUpregulatedDownregulated
CP1HCKF vs. WCKFWCKF/HCKF669384285
CP2HCKR vs. WCKRWCKR/HCKR1497277
CP3WCKF vs. WCTFWCTF/WCKF305165140
CP4WCKR vs. WTRWTR/WCKR422519072318
CP5HCKR vs. HTRHTR/HCKR453123862145
CP6HCKF vs. HTFHTF/HCKF1414991423
CP7HTF vs. WTFWTF/HTF1417467
CP8HTR vs. WTRWTR/HTR17813444
WCKF, WCKR, HCKF and HCKR indicate cDNA libraries of the Wuchang provenance foliage, Wuchang provenance roots, Hailin provenanc foliage and Hailin provenance roots under normal nitrogen, respectively. WTF, WTR, HTF and HTR indicate cDNA libraries of the Wuchang provenance foliage, Wuchang provenance roots, Hailin provenance foliage and Hailin provenance roots under nitrogen deficiency, respectively.
Publisher’s Note: MDPI stays neutral with regard to jurisdictional claims in published maps and institutional affiliations.

