Article

Seasonal Stabilities of Soil Nematode Communities and Their Relationships with Environmental Factors in Different Temperate Forest Types on the Chinese Loess Plateau

1
College of Natural Resources and Environment, Northwest A&F University, Yangling 712100, China
2
State Key Laboratory of Soil Erosion and Dryland Farming on the Loess Plateau, Northwest A&F University, Yangling 712100, China
3
Institute of Soil and Water Conservation, Chinese Academy of Sciences and Ministry of Water Resources, Yangling 712100, China
*
Author to whom correspondence should be addressed.
Forests 2021, 12(2), 246; https://doi.org/10.3390/f12020246
Submission received: 27 December 2020 / Revised: 16 February 2021 / Accepted: 18 February 2021 / Published: 21 February 2021
(This article belongs to the Section Forest Ecology and Management)

Abstract

:
The bottom-up effects of vegetation have been documented to be strong drivers of the soil food web structure and functioning in temperate forests. However, how the forest type affects the stability of the soil food web is not well known. In the Ziwuling forest region of the Loess Plateau, we selected three typical forests, Pinus tabuliformis Carrière (PT), Betula platyphylla Sukaczev (BP), and Quercus liaotungensis Koidz. (QL), to investigate the soil nematode community characteristics in the dry (April) and rainy (August) season, and analyzed their relationships with the soil properties. The results showed that the characteristics of the soil nematode communities and their seasonal variations differed markedly among the forest types. Compared to P. tabuliformis (PT), the B. platyphylla (BP) and Q. liaotungensis (QL) forests had higher plant diversity and more easily decomposed litters, which were more effective for improving the soil resource availability, thus, leading to more beneficial effects on the soil nematode community. In both the dry and rainy season, the soil nematode abundance was the highest in the BP forest. The Shannon–Wiener diversity index (H’), Pielou’s evenness index (J’), and nematode channel ratio index (NCR) were higher, while the Simpson dominance index (λ) and plant parasite index (PPI) were lower, in the BP and QL forests compared with in the PT forest. From the dry to rainy season, the total nematode abundance and the abundance of fungivores, bacterivores, and omnivore-predators, significantly increased in the QL and PT forests, and the values of the Wasilewska index (WI), maturity index (MI), H’, J’, λ, and NCR showed the most significant seasonal variability in the PT forest, which were mainly driven by changes in the soil labile C and N and the moisture content between the two seasons. Generally, the seasonal stability of the soil nematode communities was the highest in the BP forest and the poorest in the PT forest, probably due to variations in the plant diversity. Our results suggest the importance of tree species and diversity as bottom-up regulating factors of the soil food web structure, function, and seasonal stability, which has important implications for sustainable forest management in the Loess Plateau and other temperate regions.

1. Introduction

As one of the most abundant and diverse groups of soil organisms [1], nematodes are ubiquitous in the soil and occupy key positions at several trophic levels of soil food webs, including bacterivores, fungivores, plant feeders, predators, and omnivores [2]. They play a vital role in driving the important processes of soil ecosystems, such as organic matter decomposition and nutrient cycling [3], exerting significant impacts on soil functions. In addition, nematodes can respond rapidly to local environmental changes [4,5], and provide valuable insights into the compositional, structural, and functional changes of the soil food web, which offers useful indicators for the assessment of the soil quality and ecosystem functioning, particularly in restored ecosystems [2,4,6,7].
In the past several decades, extensive studies have been conducted to investigate soil nematode community characteristics in different types of terrestrial ecosystems, such as forests, grasslands, and farmlands [8,9,10]. Previous studies showed that the highest abundance and diversity of soil nematodes were observed in forest ecosystems, due to their complex environment and heterogeneous vegetation [9,10,11,12]. However, among different types of forests, significant differences existed in the soil nematode abundance and community pattern [12,13,14], as well as in their responses to external environmental changes (such as seasonal climate variations) [15], which might be attributed to the bottom-up effects of vegetation [16,17]. The bottom-up (resource control) effects have been recognized as important regulation forces of the soil food web [18,19,20], which means that changes in the resource entry into soil may trigger bottom-up cascading effects along soil food chains [17,21].
In forest ecosystems, the vegetation characteristics (e.g., the flora composition and diversity) can significantly influence the quality and quantity of resources entering the soil (i.e., litter and rhizodeposits). As a result, the soil physicochemical properties are further affected, which leads to a great impact on the survival environment and food supply for soil organisms [12,18,22]. Therefore, the bottom-up effects mediated by vegetation characteristics can control the soil community composition and structure [12,17,18]. Moreover, they can also modify the responses of soil communities to external environmental changes [18,22]. Studying the soil nematode community patterns and their stability in different types of forests will undoubtedly contribute to a better understanding of the aboveground–belowground associations of forest ecosystems.
The Loess Plateau, located in the upper and middle reaches of the Yellow River in China, is one of the most eroded and degraded land areas in the world [23,24]. Vegetation restoration is considered as one of the most effective strategies to control soil erosion and improve ecological restoration in this region [25,26,27]. Since the 1960s, a series of vegetation restoration projects have been implemented in the Loess Plateau [25], which have led to a substantial increase of the forest area and co-existence of variable forest types in this region through vegetation restoration and afforestation [25,26,27,28]. Numerous studies have reported the effects of forest restoration on plant communities and corresponding belowground parameters, including the soil physicochemical properties and microbial communities [23,25,28,29]. However, there is little information on soil nematode communities in the different forest types of the Loess Plateau, which is essential for an integrated assessment of restored forest vegetation and soil ecosystems and has important implications for the sustainable management of temperate forests.
We selected three typical forests, Pinus tabuliformis Carrière (Pinaceae), Betula platyphylla Sukaczev (Betulaceae), and Quercus liaotungensis Koidz. (Fagaceae), in the largest forest region of the Loess Plateau, Ziwuling mountainous area, to investigate the composition, structure, and ecological indices of soil nematode communities in dry (April) and rainy season (August), and to analyze their relationships with the current vegetation characteristics and soil properties. The objectives of our study were to (1) assess the influence of forest type on soil nematode community in the dry and rainy season, (2) evaluate the seasonal stability of the soil nematode community among different forest types; and (3) determine the relationships among the current vegetation characteristics, soil physicochemical properties, and nematode community for identifying the driving forces of soil nematode communities in forests. We hypothesized that, under different forest types, soil nematode communities not only vary in their community pattern but also show different seasonal stabilities, and these variations are mainly driven by bottom-up effects mediated by the vegetation characteristics and soil properties.

2. Materials and Methods
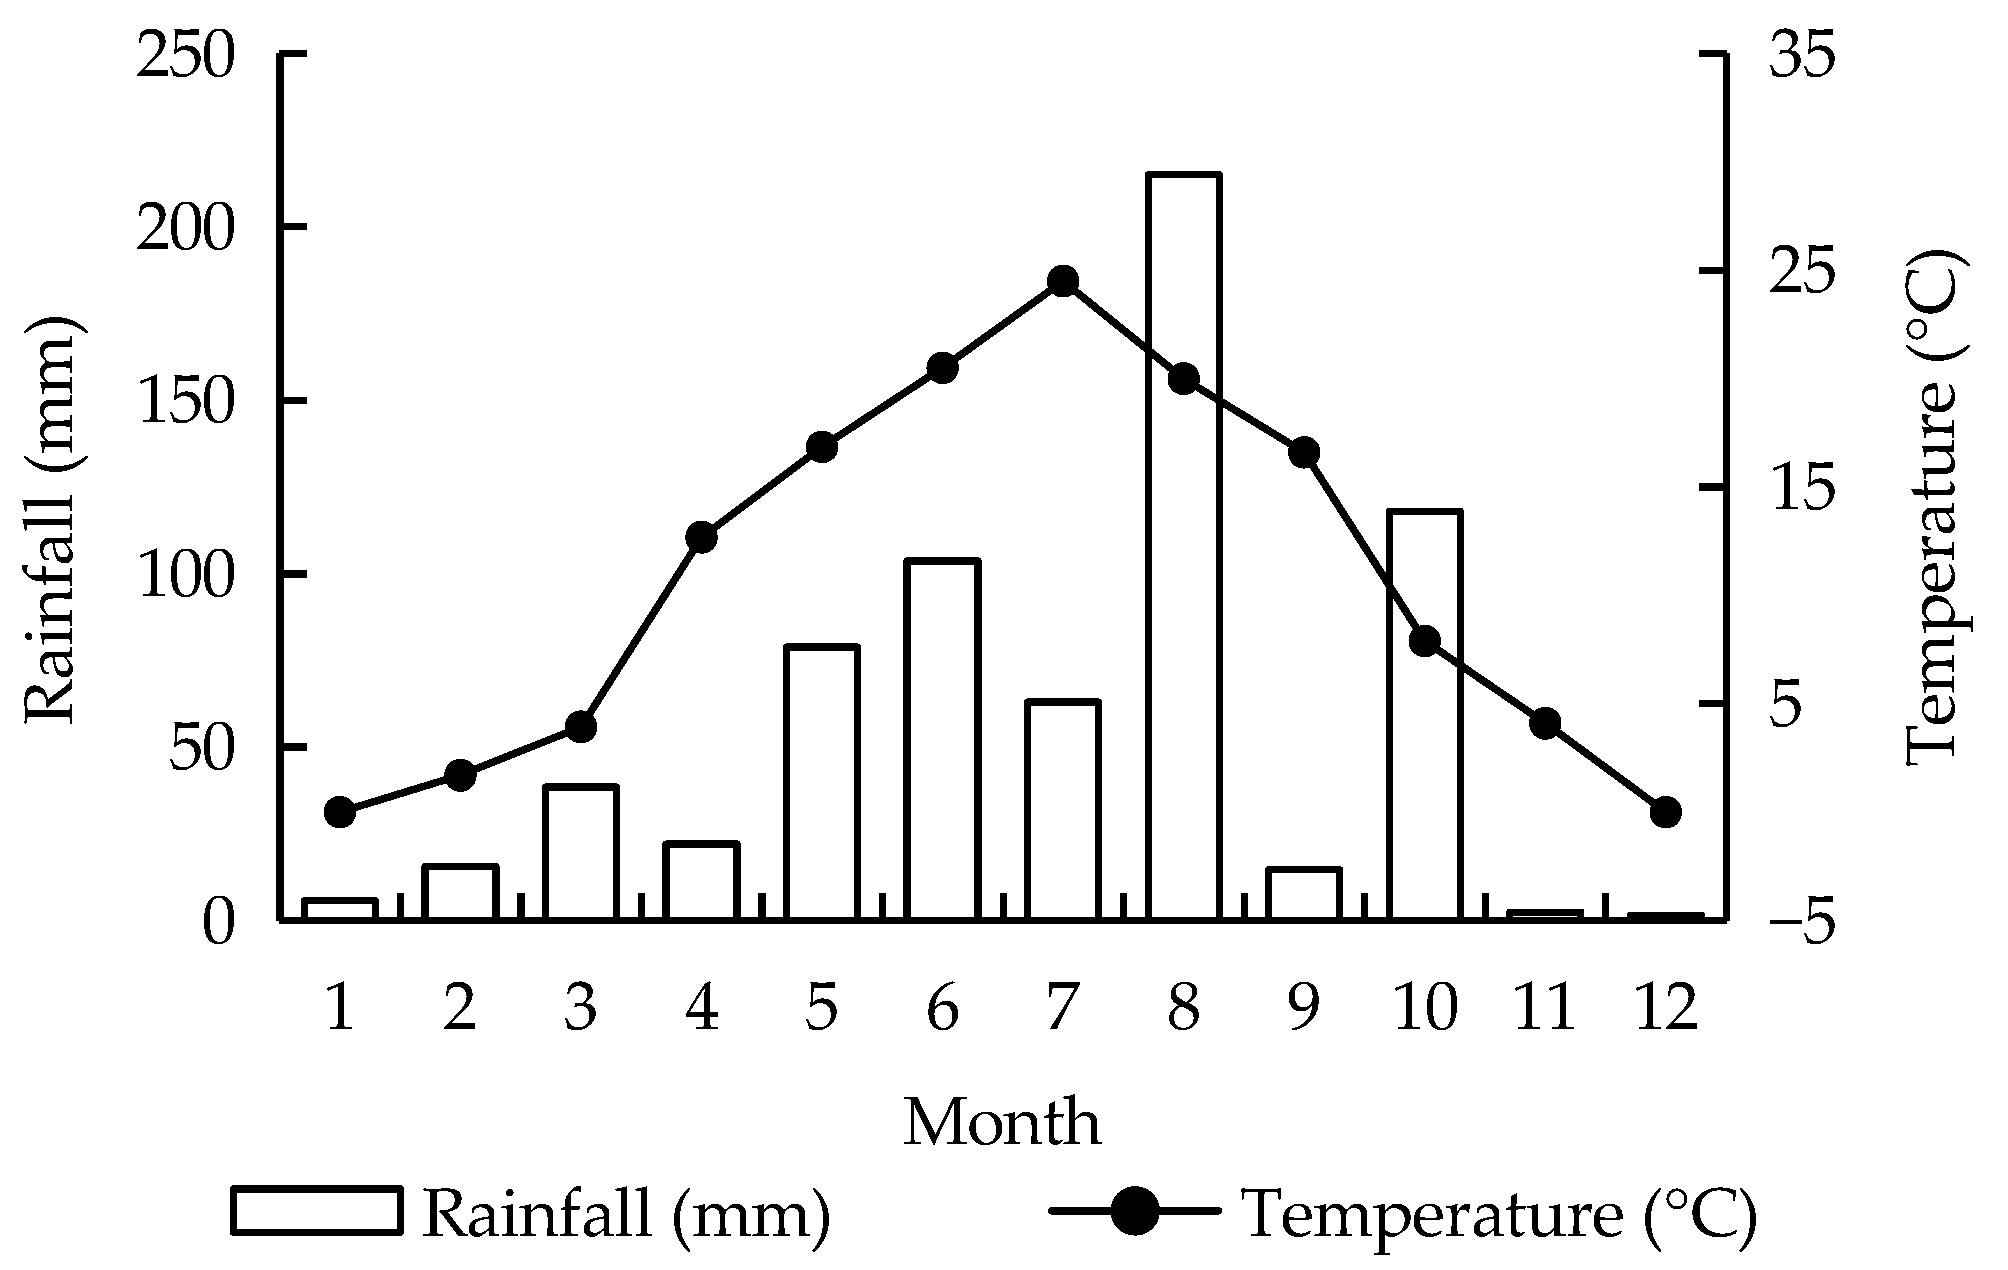
2.1. Study Site

Ziwuling forest area is the largest forest region remaining in the Loess Plateau. The study was conducted in the Lianjiabian Forest Farm in the northern Ziwuling forest region (35°03′–36°37′ N, 108°10′–109°08′ E), which is under the administration of the Heshui General Forest Farm of Qingyang City, Gansu Province, China, and occupies a total area of 2.3 × 10⁴ km2. This forest farm lies in the hilly–gully region of the Loess Plateau with a warm temperate and semi-humid climate.
In this area, the elevation ranges from 1211 to 1453 m, and the relative height difference is about 200 m. The mean annual temperature is 10 °C and the annual accumulated temperature (>10 °C) is 2671 °C. The mean annual precipitation is 587 mm, with about 60% of the precipitation falling in the period of July–August. The frost-free period is 110–150 d each year. The study area is covered by species-rich uniform forests with a forest canopy density ranging within 80%–95% [24,27]. The soil is calcareous cinnamon (Ustalfs) that developed from primary or secondary loess with a depth of 50–100 m [25], and a pH of 7.92–8.31 [27].
In the study area, the natural vegetation was completely destroyed in 1842–1866, when severe conflicts between competing tribal units occurred several times in the border land of Shaanxi and Gansu province of China, and the local inhabitants emigrated [27]. Afterwards, the vegetation in this area gradually rehabilitated on the abandoned cropland mainly through natural succession under low levels of anthropogenic influences.
After about 160 years, natural secondary forests have occupied 74% of the total forest area in this region, and most of them have developed into the climax community dominated by Q. liaotungensis [24,27], while the rest are mainly at the pioneer forest stage, dominated by B. platyphylla or Populus davidiana Dode (Salicaceae) [23,24,29]. The area of the P. davidiana forest is very limited, due to the replacement of the Q. liaotungens forest [30]. P. tabuliformis is one of the main afforestation species in northern China. In the Ziwuling region, the planting of P. tabuliformis forest started in the 1960s and continued until the present. The area of P. tabuliformis forest reached 530 km2 in 2005, occupying 81% of the total artificial forest area in this region [25,31,32].
Therefore, in our study, we selected the following three types of forests as research subjects:
(1) P. tabuliformis forest (PT), the main planted forest. In the Ziwuling forest region, a large area of PT forest was planted in the 1990s [30], which had entered into the mature stage in the sampling year. Therefore, we selected a PT forest of 26 years in age (planted in 1991) as one of our research subjects, which was dominated by P. tabuliformis. There was no anthropogenic disturbance in this forest after it was established.
(2) B. platyphylla forest (BP), the main pioneer forest. The most dominant tree species in this forest was B. platyphylla, followed by Larix gmelinii Kuzen. (Pinaceae). Acer ginnala Maxim. (Aceraceae) dominated in the shrub layer, and Lonicera japonica Thunb. (Caprifoliaceae) dominated in the herbaceous layer. In this forest, the plant communities have undergone more than 120 years of secondary succession, and have gone over four successional stages (abandoned farmland → grassland → shrubland → pioneer forest), [30,33], without anthropogenic disturbance. The pioneer forest stage (B. platyphylla forest) has lasted for about 27 years.
(3) Q. liaotungensis forest (QL), the climax forest. In this forest, the most dominant tree species was Q. liaotungensis. Rosa hugonis Hemsl. (Rosaceae), and Spiraea salicifolia Lour. (Rosaceae) dominated in the shrub layer, while Carex lanceolata Boott (Cyperaceae) dominated in the herbaceous layer. The secondary succession in this forest has lasted for about 150 years, and plant communities have gone through a complete series of successional stages, namely abandoned farmland → grassland → shrubland → pioneer forest → climax forest [25,27,33,34], without anthropogenic disturbance. The climax forest stage (Q. liaotungensis forest) started about 30 years ago.
The basic characteristics of the three forests are listed in Table 1. The vegetation investigation was carried out in April of 2017. The plant community composition, diversity (H’plant), canopy density, and other plant growth parameters (e.g., the crown width (CW), diameter at breast height (DBH), and height of the trees) were investigated and are listed in Table 1.

2.2. Soil Sampling

The climate conditions (monthly average temperature and rainfall amount) of the study area in 2017 are presented in Figure 1. We conducted soil sampling in both the dry season (April) and rainy season (August) of 2017. For each forest, three independent plots (20 m × 20 m) were selected randomly as sampling replicates, and the distance between the two plots was not less than 50 m. The elevation difference between any two sampling plots was within 100 m. In each plot, after removing the litter and humus layers, 12 soil samples were collected along an S-shaped curve at the depth of 0–20 cm using a 5-cm diameter soil drilling sampler combined as one composite sample.
All soil samples were stored in individual plastic bags and immediately brought to the laboratory in iceboxes. Visible plant roots, stones, litter, and debris were picked out manually from the soil samples. Then, each soil sample was divided into two subsamples. One subsample was sieved through a 5-mm mesh and kept at 4 °C for analyzing the soil nematode community and measuring the soil moisture, dissolved organic carbon and nitrogen, microbial biomass carbon and nitrogen, and inorganic nitrogen (NH4+–N and NO3–N). The other subsample was air-dried and used to analyze other soil properties.

2.3. Soil Physicochemical Analysis

The soil pH was measured using an automatic titrator (Metrohm 702, Herisau, Switzerland) in 1:2.5 soil/water suspensions. The soil moisture content (SMC) was measured gravimetrically and expressed as percentage of the soil water to the dry soil weight. The soil bulk density (SBD) was determined using the core method [35,36]. A stainless-steel coring ring (5-cm height, 5-cm diameter) was used to collect undisturbed soil cores, and these core samples were then oven-dried at 105 °C for 24 h. The soil bulk density was calculated by dividing the mass of the oven dried soil by the core volume. The soil organic carbon (SOC) content was determined by the K2Cr2O7–H2SO4 oxidation method [37]. The soil total nitrogen (TN) content was determined using the Kjeldahl method [38].
The ammonium (NH4+–N) and nitrate nitrogen (NO3–N) in the soil were determined following extractions of fresh soil with 2 M KCl and analyzed for concentrations with a Continuous Flowing Analyzer (Skalar San++, Breda, The Netherlands). The Soil microbial biomass carbon (MBC) and nitrogen (MBN) were extracted using the chloroform-fumigation extraction method [39], and the dissolved organic carbon (DOC) and nitrogen (DON) were extracted with ultrapure water. The MBC and DOC concentrations in the soil extracts were analyzed using an automated TOC (Total Organic Carbon) analyzer (Multi C/N 3000, Analytik, Jena, Germany) [40], while the MBN and DON concentrations were determined by the semimicro-Kjeldahl determination method [41].

2.4. Nematode Extraction and Identification

Soil nematodes were extracted from 100 g of fresh soil using a modified cottonwool filter method [42]. Briefly, each soil sample was suspended in 2000 mL tap water and then sieved through a 400-mesh sieve (0.038 mm aperture). The material, including the nematodes collected from the sieve, was transferred to a cottonwool filter (Hygia rapid, Hartmann AG, Heidenheim, Germany) on a sieve in a dish with a layer of tap water. The nematodes were allowed to migrate through the filter into the water for 48 h at 22 °C. The nematodes in the water were concentrated on a 500-mesh sieve (0.025 mm aperture), then collected and fixed in 4% formalin. The number of nematodes was counted using a dissecting microscope (40× magnification), and the total nematode abundance in each soil sample was expressed as the individual number per 100 g dry soil.
For each soil sample, at least 100 nematode individuals were randomly selected and morphologically identified to the genus level using a compound light microscope (400× and 1000× magnification) (Zeiss Primo star, Analytik, Jena, Germany), according to Bongers (1994) [43] and Ahmad and Jairjpuri (2010) [44]. When the number of nematodes did not reach 100 individuals in a sample, all individuals were identified. Subsequently, each nematode genus was assigned to one of the following trophic groups based on feeding habits [1,43]: bacterial feeders (BF), fungal feeders (FF), plant parasites (PP), and omnivore-predators (OP), according to the structural characteristics of their oral parts and head [1].
Bacterial feeders mainly feed on procaryote food sources. They have a narrow or broad mouth without a stylet or spear, which responds quickly to changes in the soil resource conditions [2]. Fungal feeders can feed on saprophytic, pathogenic, and mycorrhizal fungi with a small stomatostyle or odontostyle (stylet or spear) for the penetration of fungal hyphae. Plant parasites mainly feed on vascular plants, and a strong stomatostyle or odontostyle is always present in their bodies [2,43]. Omnivores can feed on bacteria, amoebae, and flagellates, as well as bacterivorous, fungivorous, and plant-parasitic nematodes [2,21]. Predators can feed on all other nematode groups and enchytraeids [2,21]. Omnivore-predators typically have a larger body size than the other trophic groups, [1,45], which are sensitive to environmental disturbance, and can indicate the complexity of the soil food web [4,18].
Each nematode genus was also classified into a functional guild defined as a colonizer–persister (c–p) value from 1 (r-strategist) to 5 (K-strategist), which reflect the gradations between life strategies [1,2,3,4,46]. c–p 1 nematodes are characterized by short life cycles, high rates of reproduction, and better adaptability to environmental perturbation. They often occur in highly disturbed systems. In contrast, c–p 5 nematodes have the opposite characteristics, i.e., relatively long life cycles, low fecundity, and a high sensitivity to disturbance [1,2,3,4,46], which can increase in stable systems [1,2,3,4].

2.5. Nematode Community Analysis

The following ecological diversity indices of nematode community, including the diversity and functional indices, were calculated:
(1) Nematode diversity indices
Shannon–Wiener diversity index (H’), H’ = −ΣPi × ln(Pi) [47].
Pielou’s evenness index (J’), J’ = H’/ln(S) [48].
Simpson dominance index (λ), λ = Σ(Pi)² [49].
where Pi is the proportion of the genus i in the total nematode community and S is the number of taxa identified. These indices can be used to evaluate the soil nematode diversity at genus level.
(2) Nematode functional indices
The functional indices of nematode community, such as the maturity index (MI), plant parasite index (PPI), Wasilewska index (WI), nematode channel ratio (NCR), enrichment index (EI), and structure index (SI), were calculated to investigate functional changes in the soil food web [1,4,50].
MI = Σvi × fi, where vi is the c–p value of a free-living nematode genus and i and fi are the frequencies of that genus in a sample [4]. The MI is calculated to evaluate the successional stage of the free–living nematode community. A low MI indicates a disturbed system or immature succession stage, whereas a high MI indicates a stable system with a higher proportion of persisters (K-strategist) and a lower proportion of colonizer (r-strategist) in a nematode community [1,4], which was related to the resource entry into the soil food web [16,51].
PPI = Σvi × fi, where vi is the c–p value of plant parasites genus, i and fi are the frequencies of the plant parasites genus in a sample [4]. PPI was determined in a similar manner with MI for the plant parasitic genera [4], which indicates the soil ecological health associated with the potential importance of the plant parasites genus in the nematode community. A high PPI indicates that plant parasites have more chances to feed on plants [4,52].
WI = (B + F)/PP [53], where B, F, and PP are the number of bacterivores, fungivores, and plant parasites in the soil nematode community, respectively. A low WI indicates the significant impact of plant-feeding nematodes on nutrient mineralization, which leads to poor soil health [53].
NCR = B/(B + F). NCR indicates the major decomposition pathway. When the NCR index is >0.5, bacteria can utilize the soil organic matter easily, and the decomposition of soil organic matter is mainly driven by a bacterial-mediated pathway [54]. When the NCR index is <0.5, the fungal-mediated pathway is dominant, which indicates that high ratio of soil C/N, and slower rates of nutrient cycling are excepted under the soil environment [54].
EI = 100 × e/(b + e), and SI = 100 × s/(b + s), where e, b, and s are the weighted proportions of the enriched component, basal component, and structured component of the soil food web, respectively [50]. EI describes the resource enrichment in the soil. A low EI suggests that the soil ecosystem is nutrient-depleted, while a high EI indicates that the soil ecosystem is nutrient-enriched. The SI was calculated to indicate the complexity of the soil food web structure. A low SI indicates that a highly disturbed soil ecosystem, while a high SI value indicates a highly structured and largely undisturbed soil ecosystem [50]. Nematode faunal analysis was carried out based on the respective EI and SI values of nematode communities in different forest types. The analysis can provide an indication to the soil food web condition and soil environment [50].
These functional indices are calculated based on the weighed abundances of nematode groups according to specific characteristics (e.g., the feeding habits, life strategy, and functional guild). As different nematode functional groups are associated with specialized niche-related traits, such as the soil moisture and resource availability, combining multiple nematode ecological indices can contribute to a comprehensive evaluation of different aspects of soil food web functions and help identify the bottom-up effects of plants and soils on the nematode community.

2.6. Data Analysis

A repeated measures analysis of variance (RMANOVA) was carried out to analyze the main and interactive effects of forest type and seasonal variability on the soil nematode abundance and community characteristics. One-way ANOVA followed by the Fisher’s least significant difference (LSD) test [26,55] was used to analyze the significance of difference among different forests at the same sampling time. A t-test was used to compare the nematode characteristics between the dry and rainy season. Differences at the level of p < 0.05 were considered to be statistically significant. The Pearson correlation analysis, curve fitting analysis, and redundancy analysis (RDA) were used to analyze the relationship between nematode community characteristics and environmental parameters (plant characteristics and soil physicochemical properties) across all treatments. RDA analysis was performed using the CANOCO software 5.0 version, and the other statistical analyses were performed using the SPSS version 20.0 (SPSS Inc., Chicago, IL, USA).

3. Results

3.1. Vegetation Characteristics and Soil Physicochemical Properties

Among the three types of forests, the species diversity (H’plant) of the plant community differed significantly, and was the highest in the BP forest and the lowest in the PT forest (Table 1). The canopy density, as well as other tree growth indexes (tree height, crown width, and diameter at breast height), also greatly varied among the three forests, showing a decreasing tendency of QL > BP > PT (Table 1).
Both the forest type and sampling season significantly affected the soil physicochemical properties (Table S1 in Supplementary Materials). Among the three forests, the soil pH (7.60–7.72) and bulk density (1.07–1.15 g/cm3) varied little, while the SMC, SOC, TN, MBC, MBN, DOC, and DON significantly differed (Table S1 in Supplementary Materials), showing a decreasing trend for the B. platyphylla (BP) forest > Q. liaotungensis (QL) forest > P. tabuliformis (PT) forest in two seasons (Table 2).
The NH4+–N and NO3–N varied among forest types only in the rainy season (August), and were significantly higher in the BP and QL forests (Table 2). Form the dry season (April) to the rainy season (August), the SMC, MBC, and DOC dramatically increased in all three types of forests, as well as the NH4+–N in BP and QL forests and NO3–N in PT and QL forests (Table 2).

3.2. Composition and Structure of Soil Nematode Communities

In total, 6306 nematode individuals belonging to 47 genera and 25 families were found in all sampling plots (Table 3). Both forest types and the sampling season significantly affected the total abundance of nematodes (Table S2 in Supplementary Materials), which showed a decreasing trend according to the list of BP > PT > QL, despite the sampling season (Table 3), and they increased in all forests from the dry to the rainy season, but the increasing extents were more significant in the QL and PT forests (Table 3).
Neither the forest type nor sampling season significantly affected the number of nematode genera (p > 0.05; Table S2 in Supplementary Materials), but more nematode genera were detected in the BP (36 genera) and QL forests (35 genera) compared with the PT forest (29 genera), and marked differences existed in the nematode community composition among the three forest types (Table 3).
The fungivorous genus Tylencholaimus (FF) was the most dominant genus in all the three types of forests (Table 3). Placodira (BF), Paratylenchus (PP), Diphtherophora (FF), Epidorylaimus (OP), Prionchulus (OP), and Prodorylaimus (OP) were only detected in the BP forest (Table 3), while Psilenchus (PP) and Nothotylenchus (FF) were only detected in the PT and QL forests, respectively (Table 3). Between the dry and rainy season, the nematode community composition differed to some extent. The dominance of Tylencholaimus (FF) substantially increased from the dry season (25.38%) to the rainy season (54.47%) in the PT forest, and similar changes were also observed in the QL forest (from 11.81% to 26.62%).
Differences existed among the four nematode trophic groups in their responses to the forest type and sampling season (Table 3). Both the forest type and sampling season significantly affected the abundance of bacterivores and fungivores, and their interactions also influenced the latter (Table S2 in Supplementary Materials). The abundance of plant parasites was mainly affected by the forest type, while the abundance of omnivore-predators was greatly influenced by the sampling season (Table S2 in Supplementary Materials).
In the dry season, the abundance of fungivores was much higher in the BP forest compared with in the other two forests (Table 3), while in the rainy season, it dramatically increased in the PT and QL forests (Table 3). At both sampling seasons, the abundance of bacterivores was listed according to the order BP > QL > PT, which all increased from the dry to rainy season in the three forests (Table 3). In the dry season, the abundance of plant parasites was the highest in the PT forest, which decreased to the lowest in the rainy season, when the highest abundance was observed in the BP forest (Table 3). For omnivore-predators, their abundance in the BP forest was the highest in the dry season, and did not greatly change in the rainy season (Table 3). However, in the PT and QL forests, the abundance of omnivore-predators clearly increased from the dry to the rainy season (Table 3). Generally, the most dominant trophic group changed from plant parasites in the dry season to fungivores in the rainy season in PT and QL forests (Table 3), while the nematode community structure remained stable in the BP forest, which was constantly dominated by fungivores (Table 3).

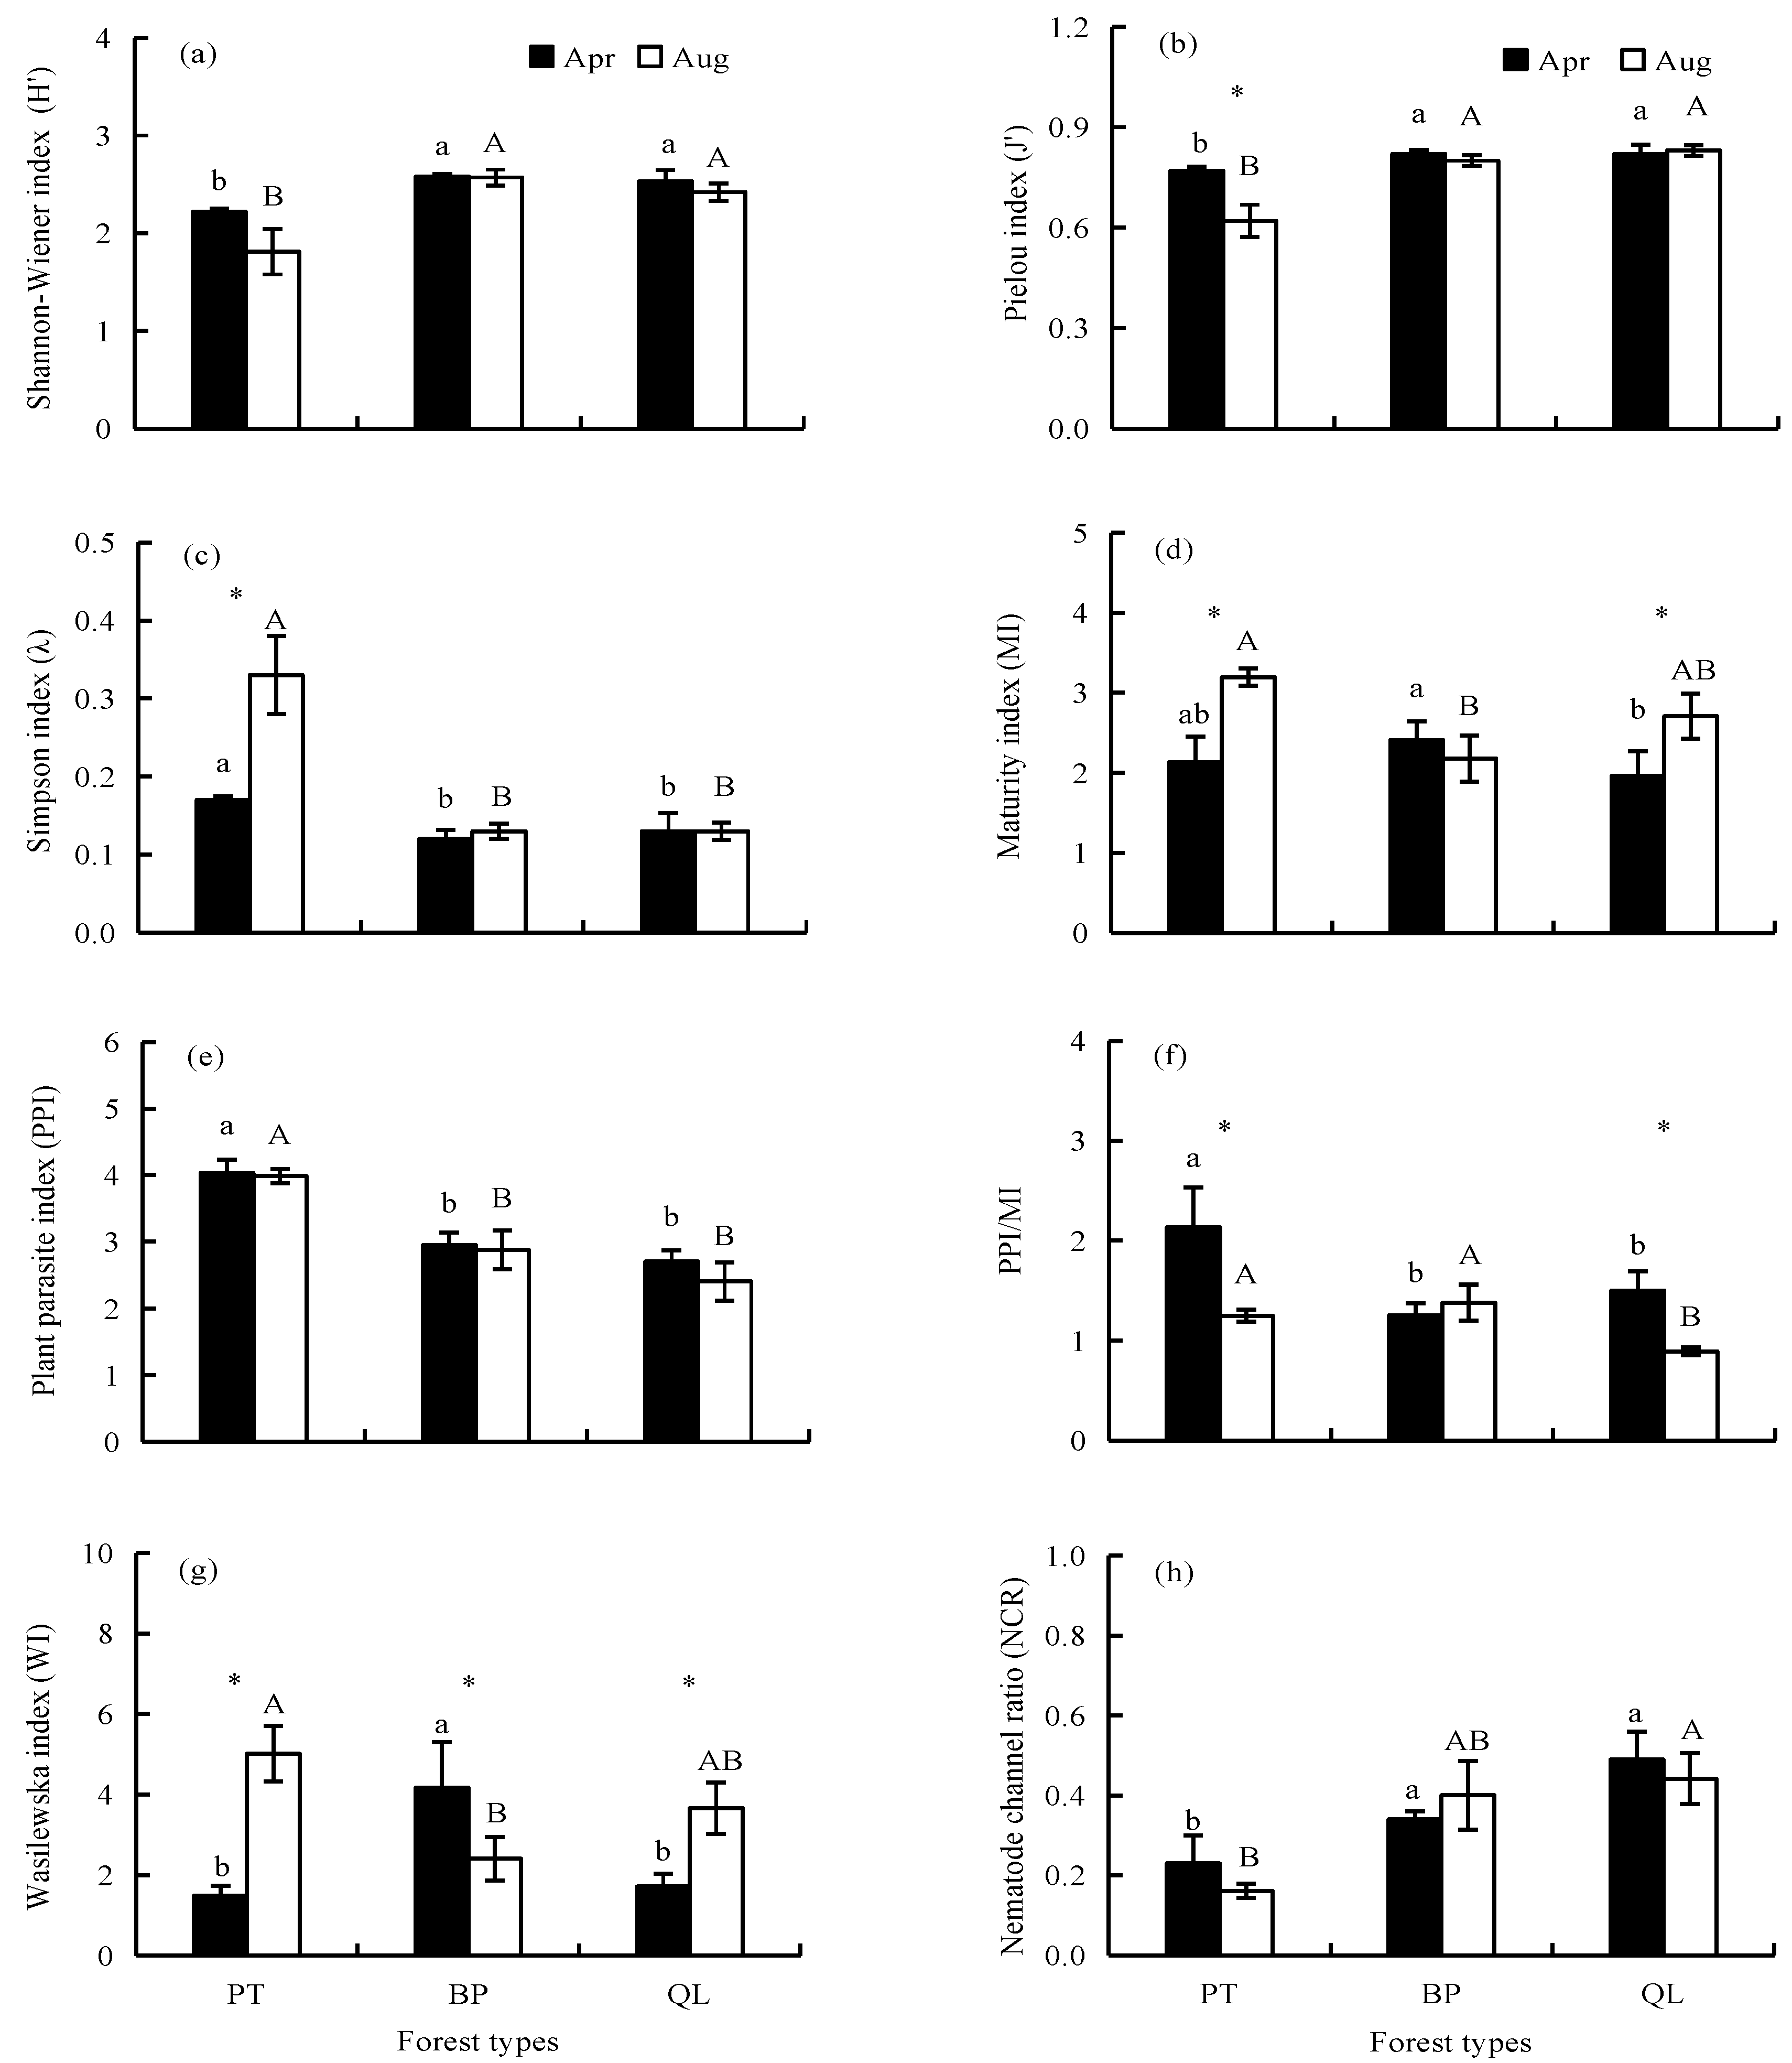
3.3. Ecological Indices of Soil Nematode Communities

The forest type greatly affected all the nematode ecological indices that we measured (Table S2 in Supplementary Materials), while the sampling season significantly affected the H’, J’, λ, MI, PPI/MI, and WI, and the interactive effects of the two factors were also significant for J’, λ, and MI (Table S2 in Supplementary Materials). The values of H’, J’, and NCR were higher in BP and QL forests than in PT forest (Figure 2a,b,h), while λ and PPI showed the opposite change tendency (Figure 2c,e). From the dry to rainy season, J’ significantly decreased, while λ greatly increased, in the PT forest (Figure 2b,c), and the MI and WI indices greatly increased in both the PT and QL forests but relatively decreased in the BP forest (Figure 2d,g). The PPI/MI showed the opposite seasonal change tendency of MI (Figure 2f).
Nematode faunal analysis showed that the profiles of the soil nematode communities in all forests were located in quadrant C, due to their high SI values (>50) and low EI values (<50) values (Figure 3), which reflected that the soil food webs in the study sites were highly structured and moderately enriched, with relatively low primary enrichment and environmental disturbance.

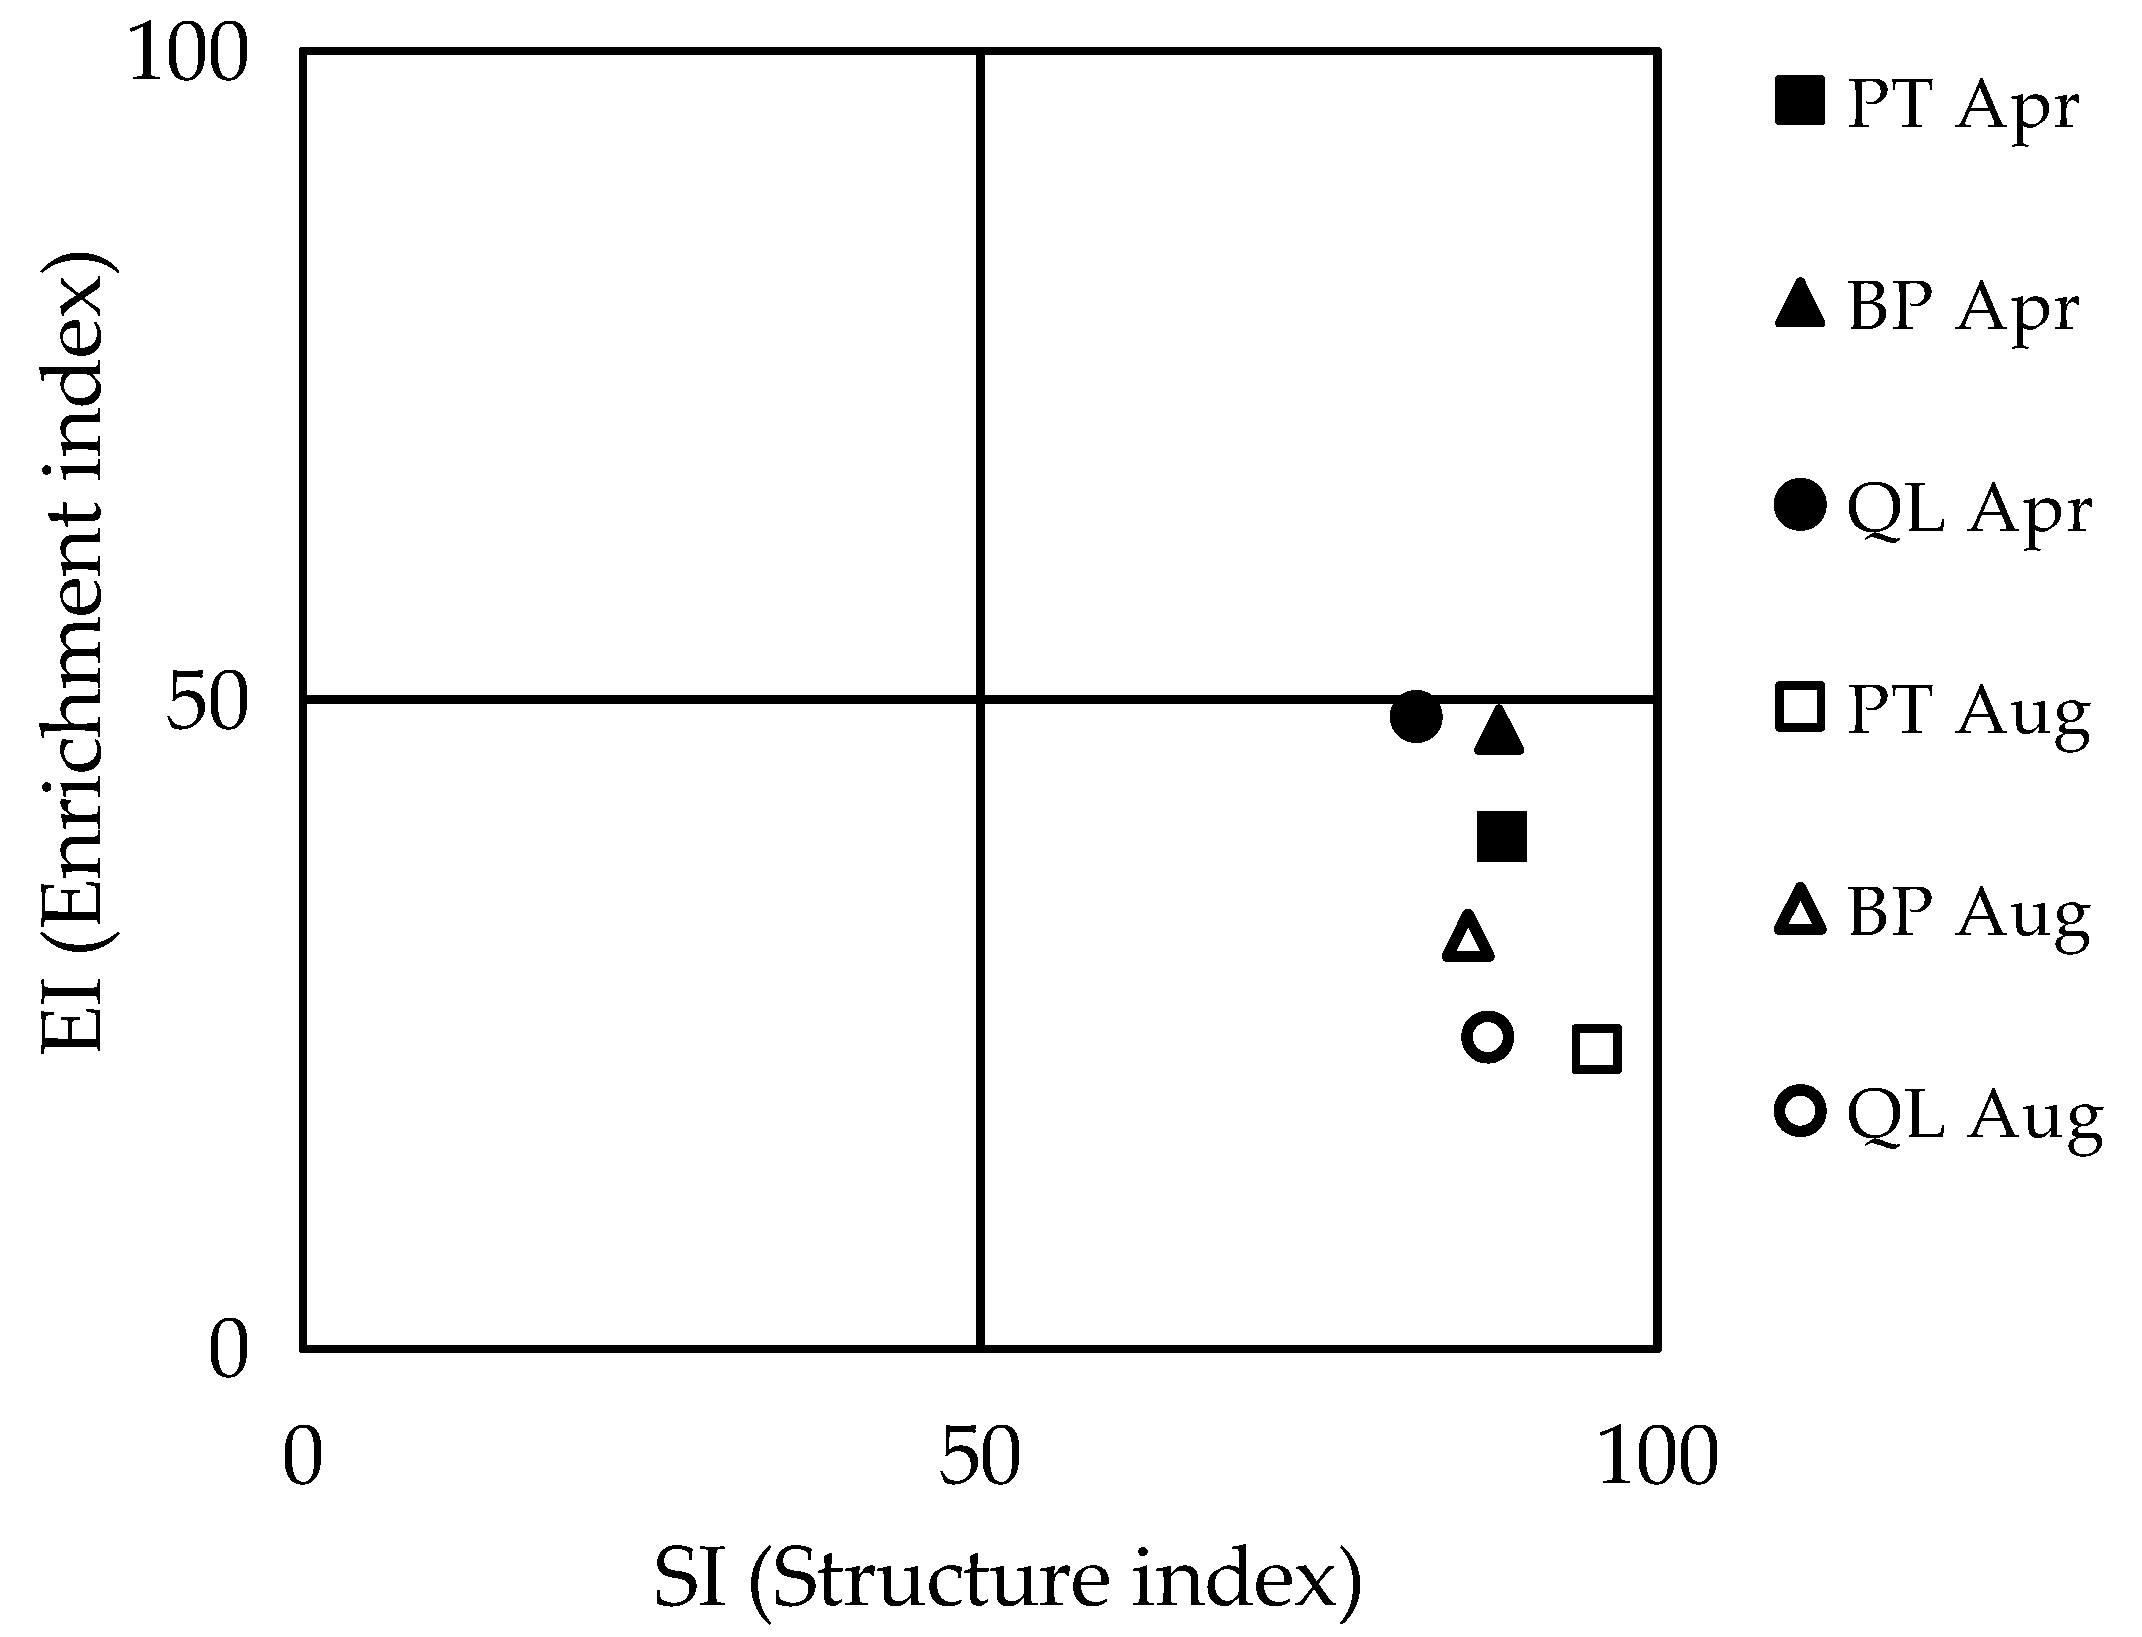
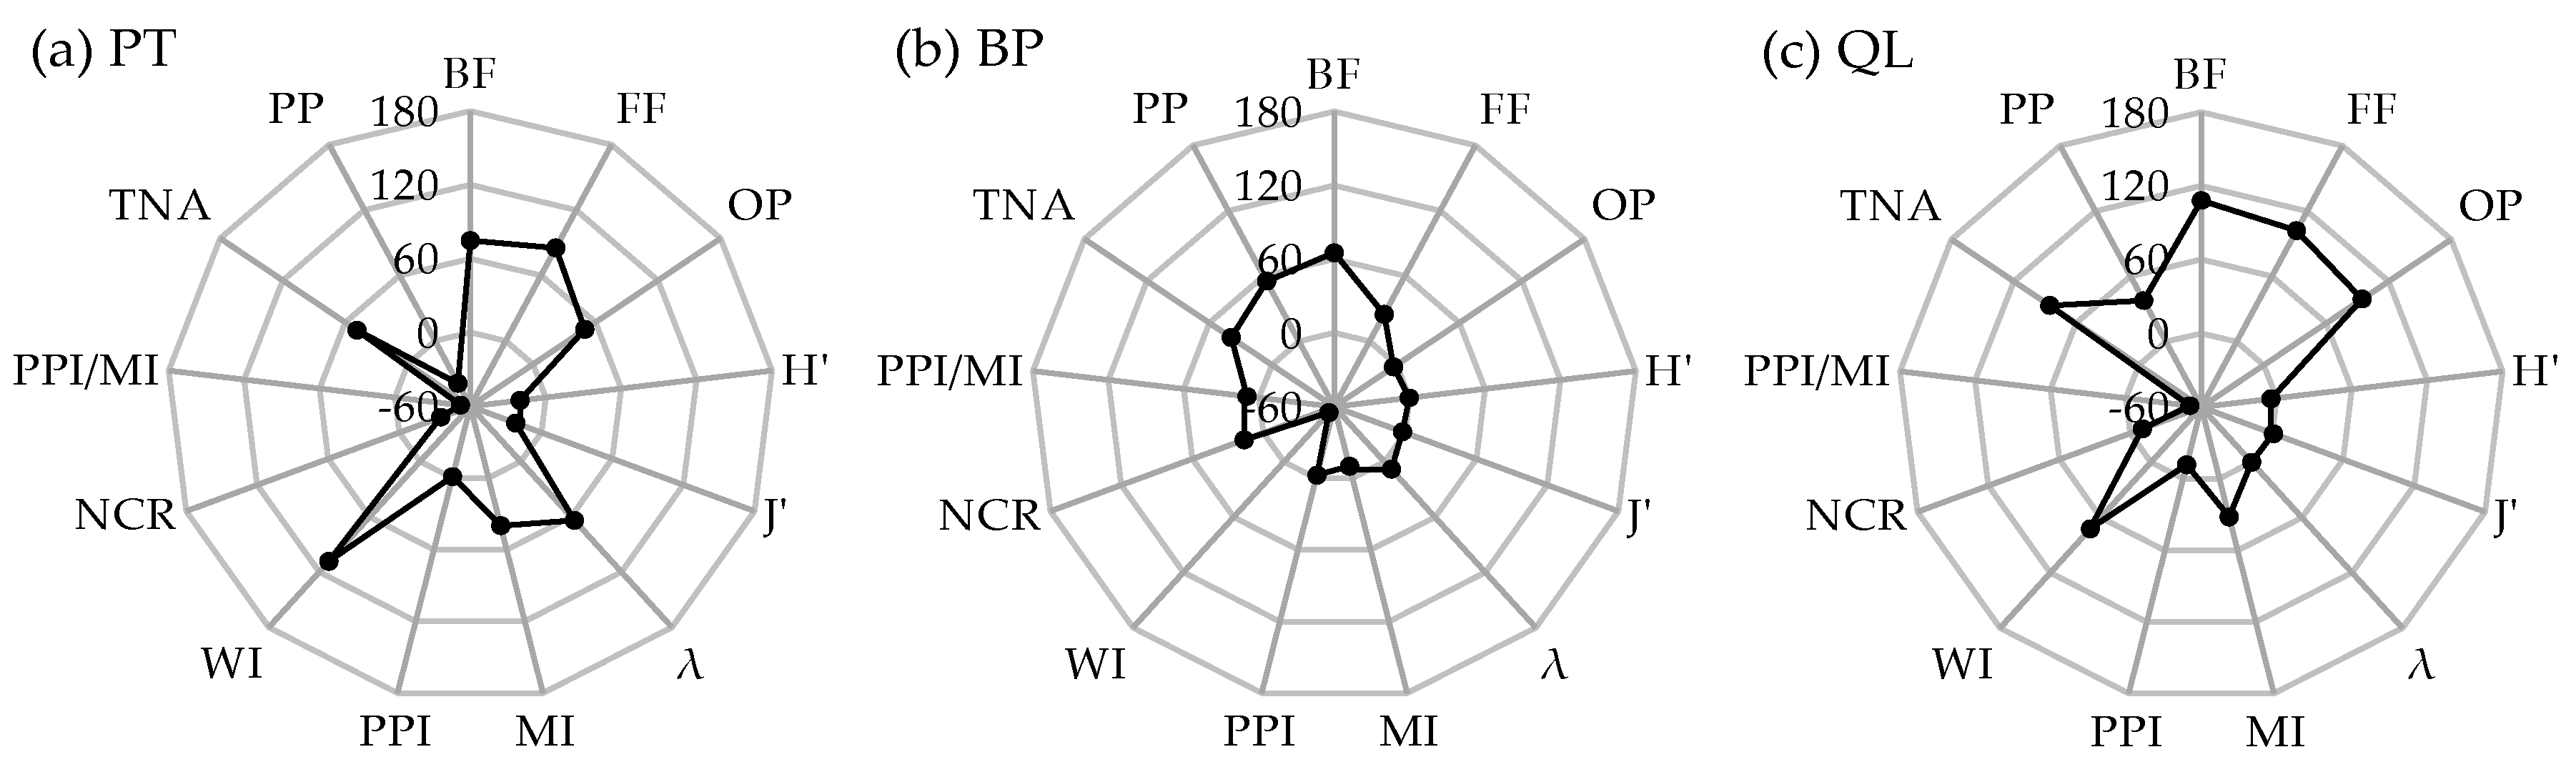
3.4. Seasonal Stability of Soil Nematode Communities under Different Forests

Although the nematode abundance, community structure, and ecological indices all showed seasonal variations (Table S2 in Supplementary Materials, Table 3, Figure 2), the directions and extents of these variations differed among the three forest types, as indicated by the index of seasonal variability (calculation formula: Difference (Rainy season − Dry season)/Average (Two seasons) × 100%) [56] (Figure 4). Concretely, from the dry to rainy season, the total nematode abundance, as well as the abundance of fungivores, bacterivores, and omnivore-predators, showed the largest increasing extents in the QL forest, then in the PT forest (Figure 4).
For nematode ecological indices, the seasonal variability of the WI index was the largest in the PT forest (108.33%) (Figure 4a), followed by the QL forest (72.24%) (Figure 4c). The seasonal variability of the MI index showed a similar trend across the three forests (Figure 4). The H’, J’, λ, and NCR indexes also showed the most significant seasonal variability in the PT forest (Figure 4a). Generally, between the dry and rainy season, the soil nematodes greatly differed in their abundance in the QL and PT forests, and showed the most significant variations in the diversity and functional indices in the PT forest, then in the QL forest, while the nematode community in the BP forest was relatively stable (Figure 4).

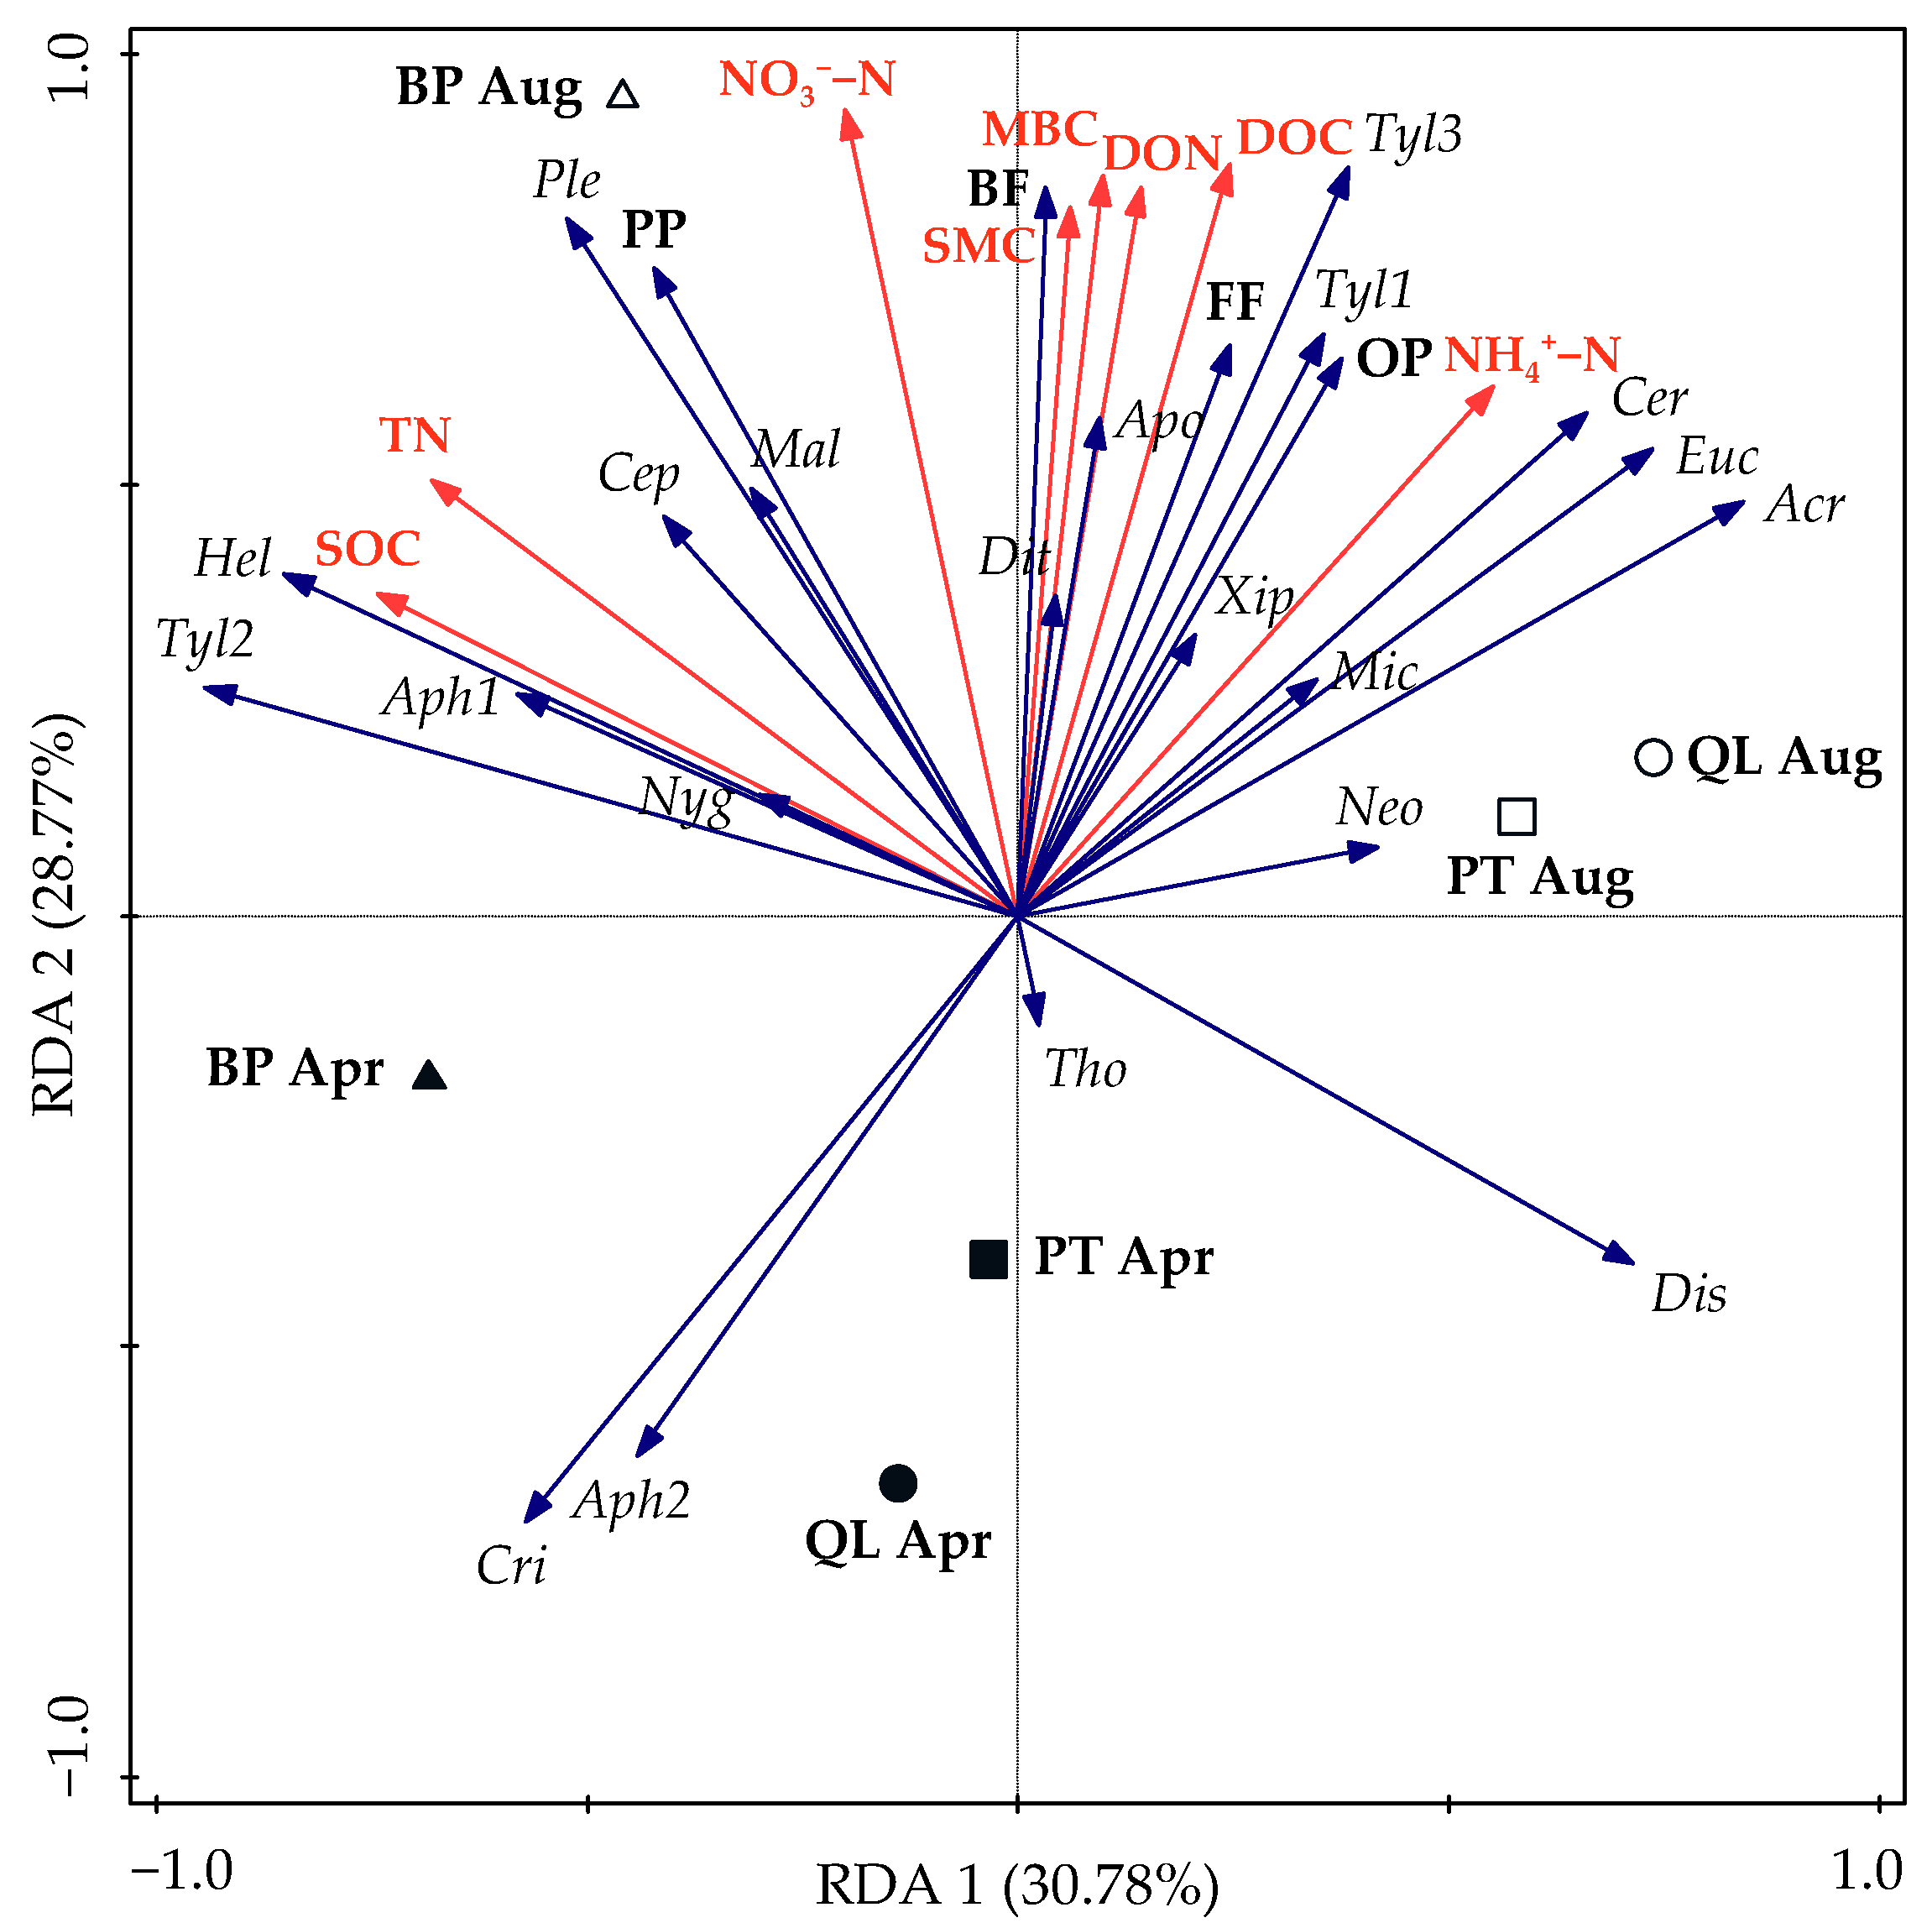
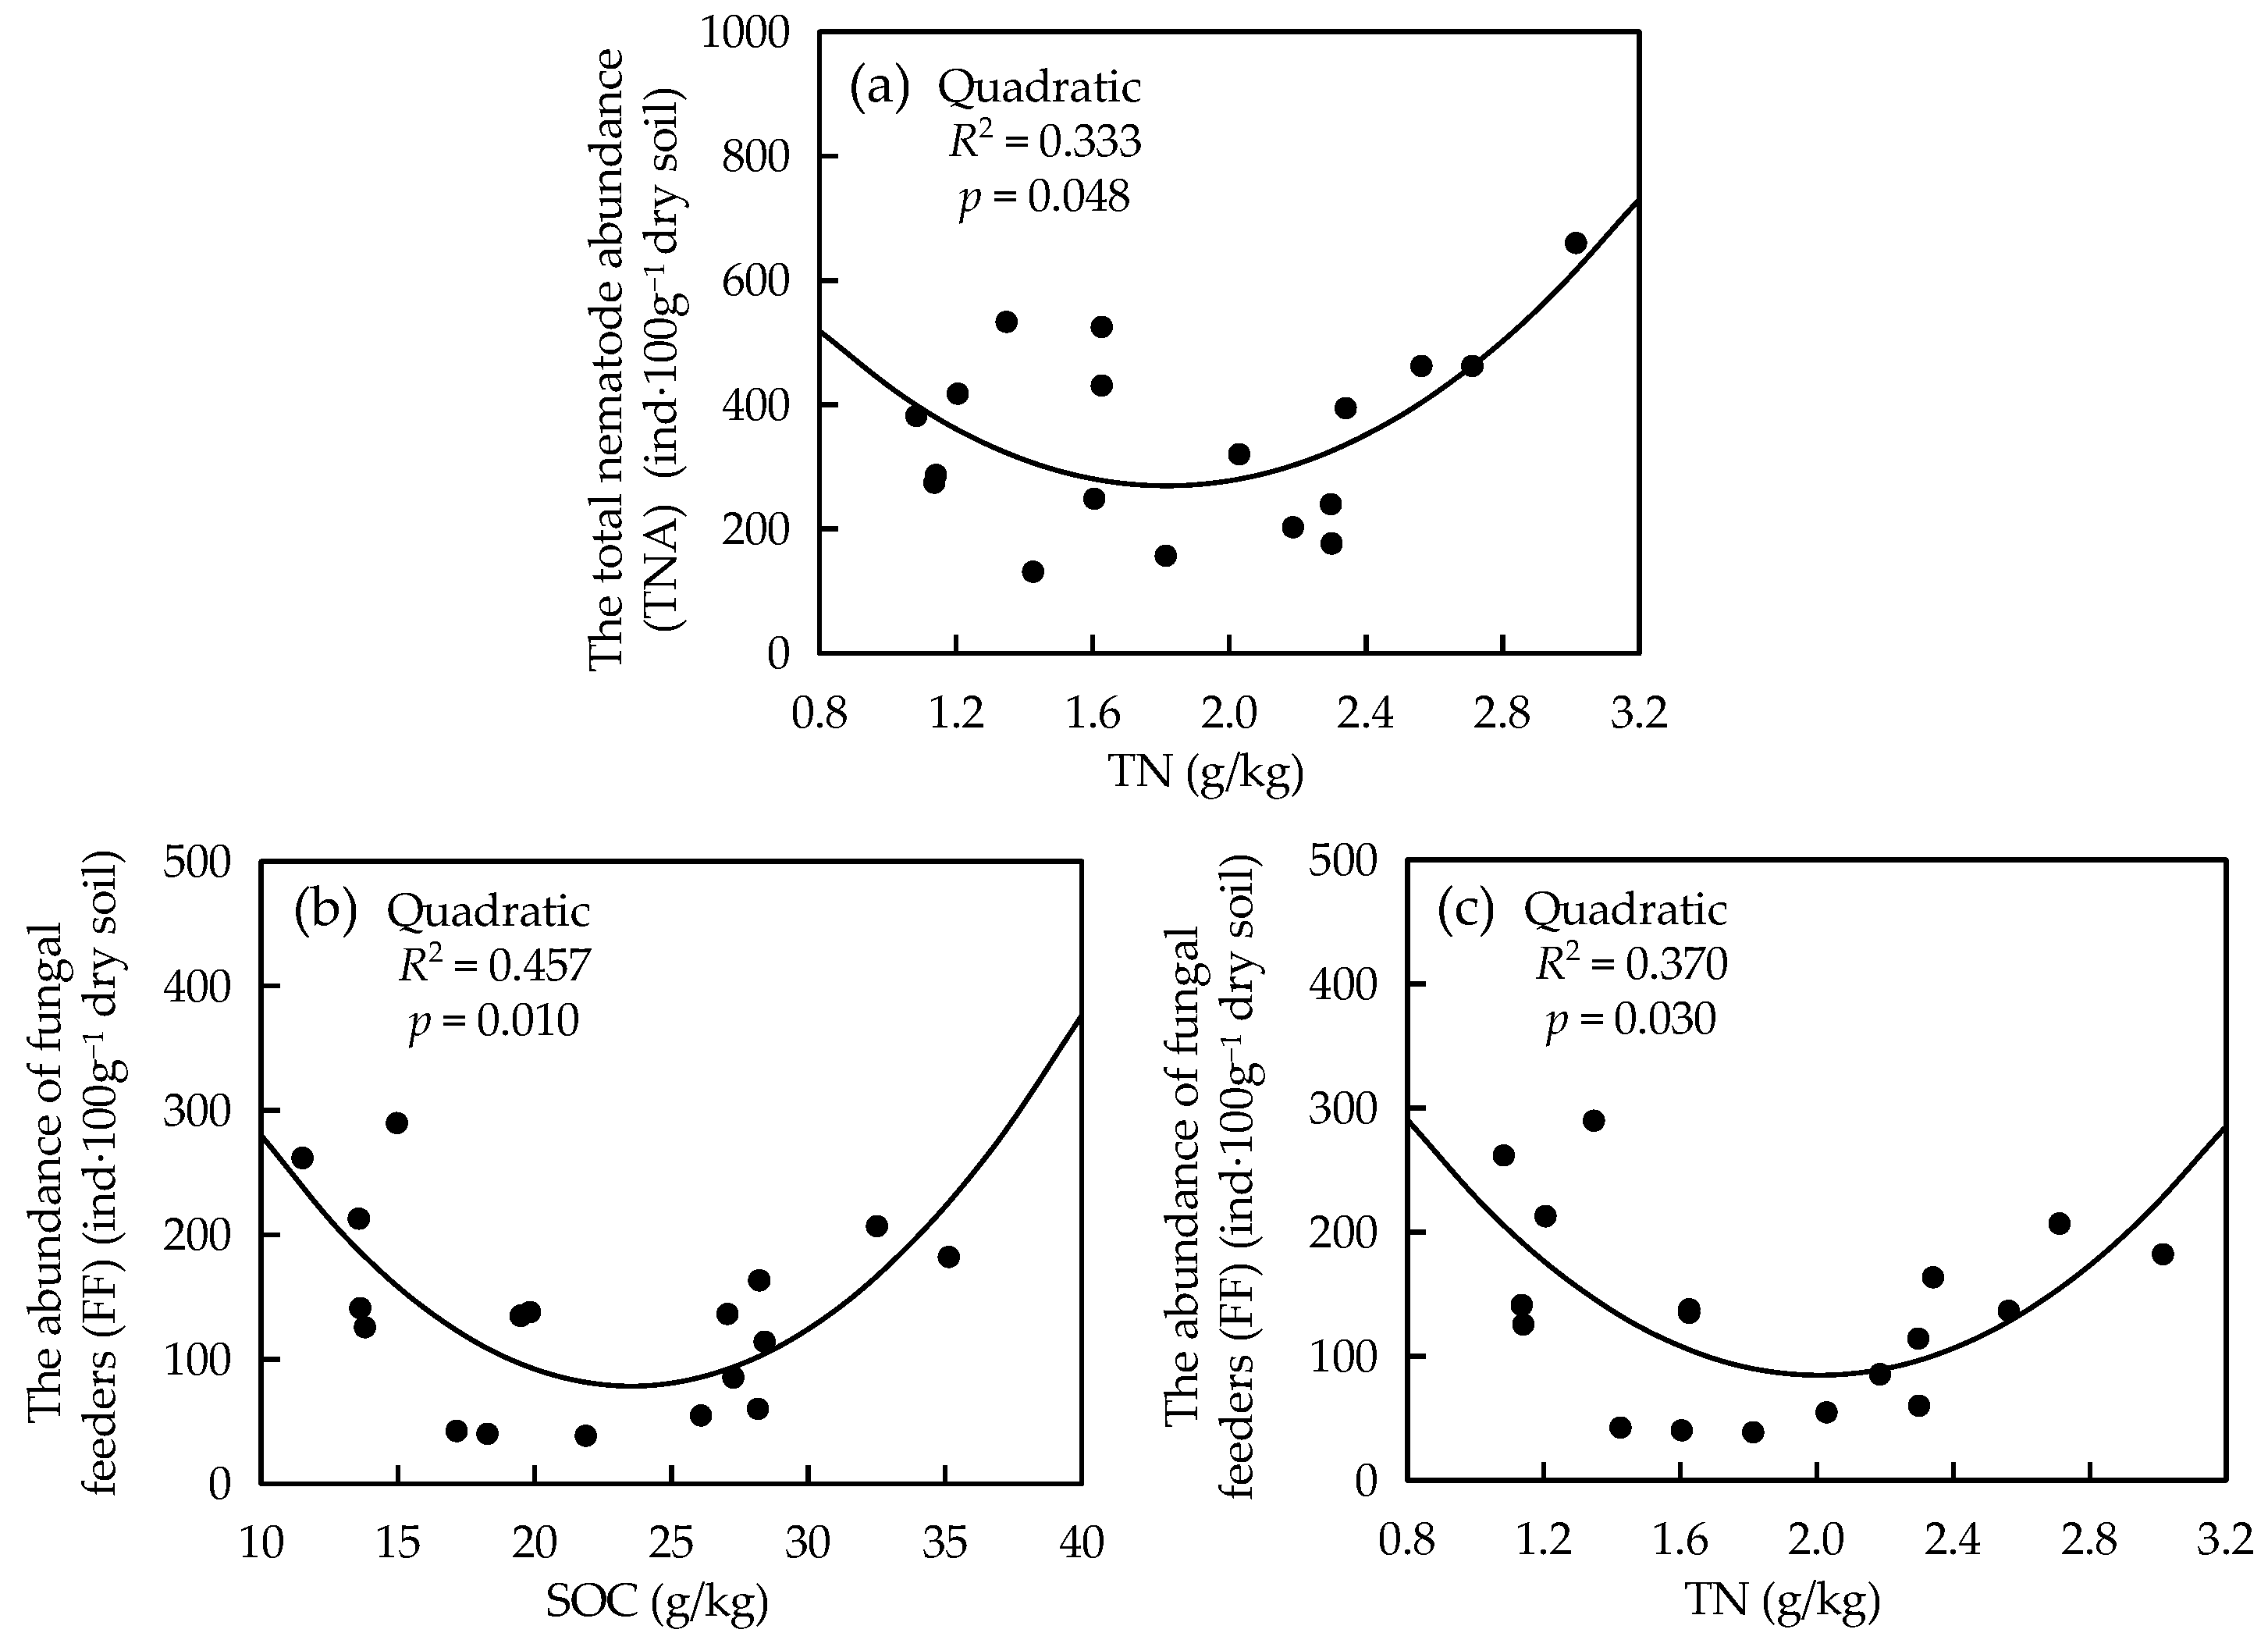
3.5. Relationship among Soil Nematode Communities and Soil Properties

Redundancy analysis (RDA) was used to identify the relationships among the nematode community composition and soil properties (Figure 5). The first two axes explain 59.55% of the total variance, with 30.78% for the first axis and 28.77% for the second axis (Figure 5). In the diagram of RDA, the profiles of the nematode community were clearly different between BP and the other two forests, particularly in the rainy season, which was mainly driven by the TN and SOC (Figure 5). From the dry to rainy season, the soil nematode community in the BP forest showed significant variation along Axis 2, while those in the QL and PT forests greatly changed along both Axis 1 and Axis 2 (Figure 5). NO3–N, DOC, NH4+–N, DON, MBC, and SMC were the most influential factors driving the seasonal variations of the nematode communities (Figure 5).
The Pearson correlation and curve fitting analysis further confirmed the relationships of the nematode community characteristics with the soil properties (Table 4; Figure 6). The results demonstrated that the abundance of total nematodes and bacterial feeders had positive linear correlations with the MBC, DON, DOC, NH4+–N, and SMC (p < 0.05, Table 4), while the abundance of total nematodes also had a quadratic correlation with the TN (Figure 6a). The abundance of fungivores had strong quadratic correlations with the SOC and TN (Figure 6b,c). For the nematode ecological indices, H’ and J’ had positive linear relationships with the SOC and TN, while λ showed the opposite tendency (p < 0.05). The PPI negatively correlated with the SMC, SOC, and TN. The PPI/MI negatively correlated with the SMC, DOC, DON, and NO3–N (Table 4).
Between the two sampling seasons, the plant diversity had negative linear correlations with the seasonal variability (calculation method shown in 3.4) of the NH4+–N (r = 0.720, p = 0.044) and MBN (r = 0.716, p = 0.046), while the seasonal variability of the MBC and DON also showed the opposite change tendency with the plant diversity; however, the negative correlations between them were not significant (p > 0.05). In addition, we analyzed the correlations between the seasonal variability (SV) of the soil properties and nematode community characteristics (Table S3 in Supplementary Materials). The results showed that SV(NH4+–N) had positive linear correlations with SV(MI) and SV(NCR) (Table S3 in Supplementary Materials), while it negatively correlated with SV(PPI/MI) (Table S3 in Supplementary Materials). SV(NO3–N), SV(SOC), and SV(TN) were positively correlated with SV (H’) of the nematode community (Table S3 in Supplementary Materials).

4. Discussion

Our study demonstrated that in the forest region of the Loess Plateau, the abundance and community characteristics of soil nematodes differed significantly among the three forest types in both the dry and rainy season (Table 3; Figure 2). The seasonal stability of soil nematode communities also varied with the forest type (Table 3; Figure 4). Moreover, the vegetation characteristics (i.e., plant species and diversity) and soil properties could regulate the soil nematode abundance and community patterns, as well as their seasonal stabilities, through bottom-up effects (Table 4; Figure 5 and Figure 6; Table S3 in Supplementary Materials). These results supported our hypothesis and corroborated previous findings that the bottom-up effects of vegetation can be strong drivers of the soil food web structure and function in forest ecosystems [12,17,57].

4.1. Effects of Forest Types on the Soil Nematode Community Characteristics

In line with our hypothesis, there were noticeable variations among the three forest types in the abundance and community pattern of soil nematodes in both the dry and rainy season (Table 3, Figure 2). Moreover, as we hypothesized, these variations might be associated with the differences in the plant species and diversity (Table 1). Among the three forest types, the pioneer forest BP had the highest plant species diversity (Table 1), which corroborated previous findings that, in temperate zones, the maximum plant diversity often occurs at the intermediate stage of forest succession [16,17]. The high plant diversity could increase the plant productivity [58] and provide more abundant and diverse food resources for soil organisms [12], therefore, supporting the higher abundance and genera number of the soil nematodes in the BP forest. However, when the forest was developed into the climax community stage (QL forest), the plant diversity dropped (Table 1), accompanied by the decreased resource entry into the soil [27,59,60], which negatively affected the abundance of the four nematode trophic groups through the bottom-up forces.
The plant diversity of the planted forest PT was much lower than those of the two secondary forests (Table 1), which limited the food supply for soil nematodes [61], leading to the decrease of the nematode genera number. However, the total nematode abundance in the PT forest was only slightly lower than that in the BP forest (Table 3). The needle litters of P. tabuliformis contained large amounts of high-molecular compounds with high C/N ratios [62,63,64], which could significantly increase the soil fungi and their consumers, fungal-feeding nematodes, leading to the high dominance of the fungal-mediated pathway in decomposition [65]. Therefore, in the planted forest, both the leaf litter quality of the dominant tree species and plant diversity may play important roles in mediating the bottom-up effects on the soil food web [16,17].
The nematode ecological indices also greatly varied among forest types, especially between the planted forest PT and the other two secondary forests (Figure 2). In the PT forest, the low plant diversity and poor-quality litter of the dominant tree species (P. tabuliformis) could adversely affect the quantity and quality of the resources entering into soil [16,25]. Therefore, the lowest values of the H’ and J’ indexes, as well as the highest value of the dominance index λ, were observed in PT forest, indicating the low nematode diversity in the soil. The nematode channel ratio index (NCR)was the lowest in the PT forest, because of the high importance of the fungal-mediated decomposition channel [54]. We observed the highest values of PPI and PPI/MI in the PT forest, which reflects that plant-parasitic nematodes were likely to cause a more serious impact on the plants [4,52]. The results suggest that planted forests may face a greater risk of suffering infestation of belowground herbivores, as the low species diversity and simple structure of plant communities often leads to poor herbivore resistance [66,67].
Compared to the PT forest, in the two secondary forests (BP and QL), the nematode diversity increased significantly, as indicated by the H’, J’, and λ (Figure 2). In addition, the soil food web increased the importance of the bacterial-mediated decomposition pathway (indicated by NCR) [54,68], and mitigated the influence of plant-parasitic nematodes (indicated by PPI and PPI/MI) [4,52]. Generally, the changes in the nematode ecological indices indicated healthier and more stable soil food webs in the two secondary forests compared with in the planted forest PT [4,5,69].
The RDA and correlation analysis results showed that the differences in the nematode community metrics among forest types were closely associated with changes in the soil properties, especially the SOC and TN (Figure 5 and Figure 6; Table 4). The SOC and TN contents were significantly influenced by the forest type (Table S1 in Supplementary Materials), likely due to the variations in the vegetation characteristics (Table 1), which were consistent with earlier results in the Ziwuling forest region [33,70]. Compared to the artificial coniferous forest PT, the two broad-leaved secondary forests, especially that at the pioneer forest stage (the BP forest), had higher plant species diversity and easily decomposed litters, which could enhance the resource entry into the soil [71,72].
Therefore, the two secondary forests might have contributed to the increases of the soil C and N pools (Table 2), leading to more beneficial effects on the nematode abundance, community structure, and ecological indices [27,33,59]. Our results supported the hypothesis that the variations in the soil nematode communities among different forest types can be driven by the vegetation characteristics (plant species and diversity) and the soil properties through bottom-up effects.

4.2. Effects of Forest Type on the Seasonal Stability of Soil Nematode Communities

Consistent with our hypothesis, in the three types of forests, soil nematode communities responded differently to seasonal climate changes (Table 3; Figure 4), which could mainly be attributed to the differences in the plant diversity (Table 1). It has been reported that variations in the vegetation characteristics among forest types could not only influence belowground communities but also modulate their responses to external environmental changes [73], which supported our results.
From the dry to rain season, the soil nematode abundance increased in all three forests (Table 3; Figure 4), due to the changes of precipitation and temperature. In the study area, the precipitation increased substantially from the dry to rainy season in the sampling year (Figure 1). As a result, the soil moisture content also increased greatly in the three forests (Table 2), which could improve the survival environment of nematodes, as most nematodes, especially free-living nematodes (fungivores, bacterivores, and omnivore-predators), live in water films or water-filled pore spaces in soils [5]. Moreover, in the rainy season, the high precipitation and temperature could prompt plant growth and the development of the soil microbial community [74,75,76], thus, enhancing the food resources for nematodes [2,77].
In the BP forest, the seasonal variation in the total nematode abundance was not as significant as those in the other two forests, and the abundance of the four trophic groups was relatively stable between the two seasons (Table 3; Figure 4), probably because a high plant diversity can enhance resource diversity and habitat heterogeneity [12].
Conversely, in the PT and QL forests, the total nematode abundance showed significant increases from the dry to rainy season, as well as an abundance of fungivores, bacterivores, and omnivore-predators (Table 3; Figure 4). Therefore, the decreases in the plant diversity may enhance the effects of seasonal climatic variations on the abundance of soil nematodes, especially free-living nematodes, probably due to their high sensitivity to the soil moisture content [5].
The seasonal variations of the nematode ecological indices were the most significant in the PT forest and the slightest in the BP forest (Figure 4), which further suggests that high plant diversity may help mitigate the effects of seasonal climatic changes on the soil food web structure and function. In the PT forest, the nematode dominance index (λ) increased, while the evenness index (J’) decreased, from the dry to rainy season (Figure 2), which could be attributed to the high dominance of fungal-feeding nematodes (especially Tylencholaimus) in the rainy season (Table 3). The results imply that the increases of precipitation and temperature tended to decrease the nematode diversity in simple (low diversity) plant communities, which was partially supported by previous findings of Thakur et al. [78]. In both the PT and QL forests, the MI and WI increased, while the PPI/MI decreased from the dry to rainy season (Figure 2). The high MI and low PPI/MI indicate a stable soil food web with high proportions of K-strategists (nematodes with high c–p values, such as omnivore-predators) [1,4], as these nematodes are known to sensitively respond to changes in the environmental conditions (e.g., soil moisture and nutrient contents) [4,50]. The high WI index indicates the smaller impact of plant-feeding nematodes on nutrient mineralization [53]. Generally, from the dry to rainy season, soil ecosystems become more mature and healthier in the PT and QL forests, while it was relatively stable in the BP forest.
According to the RDA and correlation analysis, the seasonal variability of the soil nematode community was mainly driven by the changes in the soil labile C and N (e.g., NO3–N, DOC, NH4+–N, MBC, and DON) and SMC between two seasons, which were influenced by variations in the vegetation characteristics, especially the plant diversity, among different forest types. In the past several decades, the relationships between diversity and stability have gained considerable attention from ecologists [79,80]. Many studies have indicated that high plant diversity not only maintains the stability of plant communities [81,82] but also stabilizes multitrophic animal populations and the communities that the plants support, such as aboveground insects and their predators [83,84].
Our results further confirm and validate that high plant diversity can play an important role in maintaining the stability of the soil food web under seasonal climate changes. Therefore, for artificial forests and secondary forests at later succession stages, actively managing for high plant diversity may have greater than expected benefits for increasing the stability of both the aboveground community and soil food web, which can contribute to the sustainability of the entire forest ecosystem.

5. Conclusions

In conclusion, among the three typical forest types in the Loess Plateau region, the soil nematodes varied significantly in their community characteristics (composition, structure, and ecological indices) and seasonal stability. Compared to the planted coniferous forest PT, the two broad-leaved secondary forests, particularly the BP forest, were more effective for improving soil nematode abundance and community pattern, likely due to their high plant diversity leading to more beneficial effects on the soil properties (e.g., SOC and TN). In the planted forest PT, the poor litter quality of the dominant tree species was also a strong bottom-up regulating factor for the nematode community, which led to the high dominance of the fungal-mediated channel in the soil food web. From the dry to rainy season, the soil nematode abundance and community characteristics changed the most significantly in the PT forest, and then in the QL forest, while they remained relatively stable in the BP forest, implying that high plant diversity helped to offset the effects of seasonal climatic changes on the soil nematode community. The changes in soil labile C and N, as well as the soil moisture, were the main influential factors driving the seasonal variations of the soil nematode communities. Generally, among the different forest types in the Ziwuling region, the bottom-up effects mediated by vegetation characteristics (tree species dominance and diversity) and soil properties play important roles in regulating the soil food web structure, function, and stability. Although the underlying mechanisms are not fully understood, our study contributes to understanding the relationships between the aboveground community and soil food web in restored forest ecosystems, which will be helpful for biodiversity conservation and the sustainable management of temperate forests.

Supplementary Materials

The following are available online at https://www.mdpi.com/1999-4907/12/2/246/s1, Table S1: Repeated measures ANOVA for the effects of forest type and sampling season on soil properties, Table S2: Repeated measures ANOVA for the effects of forest type and sampling season on characteristics of soil nematode communities, Table S3: Correlation between the seasonal variations (%) of soil communities characteristics and soil properties.

Author Contributions

Conceptualization, N.H., S.Z., and J.H.; Data curation, N.H., S.Z., J.H., D.G., and N.W.; Investigation, N.H., S.Z., J.H., D.G., N.W., and P.Y.; Methodology, N.H., S.Z., and J.H.; Resources, S.Z. and J.H.; Supervision, S.Z. and J.H.; Writing—original draft, N.H.; Writing—review and editing, S.Z. and J.H. All authors have read and agreed to the published version of the manuscript.

Funding

This work was financially supported by the National Natural Science Foundation of China (No.31500449) and the Natural Science Foundation of Shaanxi Province (No.2020JQ–435).

Institutional Review Board Statement

Not applicable.

Informed Consent Statement

Not applicable.

Data Availability Statement

Data is contained within the article.

Acknowledgments

This work was supported by the National Natural Science Foundation of China (No.31500449) and the Natural Science Foundation of Shaanxi Province (No.2020JQ–435). The contributions of JingFang Liu, Rentian Ma, and Qingqing Zhang in carrying out the experiment are also gratefully acknowledged.

Conflicts of Interest

None of the authors have conflicts of interest.

References

  1. Bongers, T.; Bongers, M. Functional diversity of nematodes. Appl. Soil Ecol. 1998, 10, 239–251. [Google Scholar] [CrossRef]
  2. Yeates, G.W.; Bongers, T.; Degoede, R.; Freckman, D.W.; Georgieva, S.S. Feeding-habits in soil nematode families and genera—An outline for soil ecologists. J. Nematol. 1993, 25, 315–331. [Google Scholar]
  3. Yeates, G.W.; Bongers, T. Nematode diversity in agroecosystems. Agr. Ecosyst. Environ. 1999, 74, 113–135. [Google Scholar] [CrossRef]
  4. Bongers, T. The maturity index: An ecological measure of environmental disturbance based on nematode species composition. Oecologia 1990, 83, 14–19. [Google Scholar] [CrossRef] [PubMed]
  5. Bongers, T.; Ferris, H. Nematode community structure as a bioindicator in environmental monitoring. Trends Ecol. Evol. 1999, 14, 224–228. [Google Scholar] [CrossRef]
  6. Ferris, H.; Matute, M.M. Structural and functional succession in the nematode fauna of a.soil food web. Appl. Soil Ecol. 2003, 23, 93–110. [Google Scholar] [CrossRef]
  7. Neher, D.A. Role of nematodes in soil health and their use as indicators. J. Nematol. 2001, 33, 161–168. [Google Scholar]
  8. Caixeta, L.B.; Pereira, T.J.; Castaneda, N.E.N.; Cares, J.E. Nematode communities as indicators of the status of a soil ecosystem influenced by mining practices in Brazil. Nematology 2016, 18, 265–276. [Google Scholar] [CrossRef]
  9. Da Silva, J.V.C.D.; Hirschfeld, M.N.C.; Cares, J.E.; Esteves, A.M. Land use, soil properties and climate variables influence the nematode communities in the Caatinga dry forest. Appl. Soil Ecol. 2020, 150, 103474. [Google Scholar] [CrossRef]
  10. Van Den, H.J.; Geisen, S.; Routh, D.; Ferris, H.; Traunspurger, W.; Wardle, D.A.; de Goede, R.G.M.; Adams, B.J.; Ahmad, W.; Andriuzzi, W.S.; et al. Soil nematode abundance and functional group composition at a global scale. Nature 2019, 572, 194. [Google Scholar] [CrossRef] [Green Version]
  11. Hu, N.; Li, H.; Tang, Z.; Li, Z.F.; Tian, J.; Lou, Y.L.; Li, J.W.; Li, G.C.; Hu, X.M. Community diversity, structure and carbon footprint of nematode food web following reforestation on degraded Karst soil. Sci. Rep. 2016, 6, 28138. [Google Scholar] [CrossRef] [PubMed] [Green Version]
  12. Zhang, X.K.; Guan, P.T.; Wang, Y.L.; Li, Q.; Zhang, S.X.; Zhang, Z.Y.; Bezemer, T.M.; Liang, W.J. Community composition, diversity and metabolic footprints of soil nematodes in differently-aged temperate forests. Soil Biol. Biochem. 2015, 80, 118–126. [Google Scholar] [CrossRef]
  13. Shao, Y.H.; Wang, X.L.; Zhao, J.; Wu, J.P.; Zhang, W.X.; Neher, D.A.; Li, Y.X.; Lou, Y.P.; Fu, S.L. Subordinate plants sustain the complexity and stability of soil micro-food webs in natural bamboo forest ecosystems. J. Appl. Ecol. 2016, 53, 130–139. [Google Scholar] [CrossRef] [Green Version]
  14. Zhang, M.; Liang, W.J.; Zhang, X.K. Soil nematode abundance and diversity in different forest types at changbai mountain, China. Zool. Stud. 2012, 51, 619–626. [Google Scholar]
  15. Cardoso, M.S.O.; Pedrosa, E.M.R.; Ferris, H.; Rolim, M.M.; Oliveira, L.S.C. Nematode fauna of tropical rainforest in brazil: A descriptive and seasonal approach. J. Nematol. 2016, 48, 116–125. [Google Scholar] [CrossRef] [PubMed] [Green Version]
  16. De Deyn, G.B.; Raaijmakers, C.E.; van Ruijven, J.; Berendse, F.; van der Putten, W.H. Plant species identity and diversity effects on different trophic levels of nematodes in the soil food web. Oikos 2004, 106, 576–586. [Google Scholar] [CrossRef]
  17. Cesarz, S.; Ruess, L.; Jacob, M.; Jacob, A.; Schaefer, M.; Scheu, S. Tree species diversity versus tree species identity: Driving forces in structuring forest food webs as indicated by soil nematodes. Soil Biol. Biochem. 2013, 62, 36–45. [Google Scholar] [CrossRef]
  18. Cesarz, S.; Reich, P.B.; Scheu, S.; Ruess, L.; Schaefer, M.; Eisenhauer, N. Nematode functional guilds, not trophic groups, reflect shifts in soil food webs and processes in response to interacting global change factors. Pedobiologia 2015, 58, 23–32. [Google Scholar] [CrossRef] [Green Version]
  19. Wardle, D.A.; Yeates, G.W. The dual importance of competition and predation as regulatory forces in terrestrial ecosystems—Evidence from decomposer food–webs. Oecologia 1993, 93, 303–306. [Google Scholar] [CrossRef]
  20. De Ruiter, P.C.; Neutel, A.M.; Moore, J.C. Energetics, patterns of interaction strengths, and stability in real ecosystems. Science 1995, 269, 1257–1260. [Google Scholar] [CrossRef]
  21. Holtkamp, R.; Kardol, P.; van der Wal, A.; Dekker, S.C.; van der Putten, W.H.; de Ruiter, P.C. Soil food web structure during ecosystem development after land abandonment. Appl. Soil Ecol. 2008, 39, 23–34. [Google Scholar] [CrossRef]
  22. Keith, A.M.; Brooker, R.W.; Osler, G.H.R.; Chapman, S.J.; Burslem, D.F.R.P.; van der Wal, R. Strong impacts of belowground tree inputs on soil nematode trophic composition. Soil Biol. Biochem. 2009, 41, 1060–1065. [Google Scholar] [CrossRef]
  23. Kang, D.; Deng, J.; Qin, X.W.; Hao, F.; Guo, S.J.; Han, X.H.; Yang, G.H. Effect of competition on spatial patterns of oak forests on the Chinese Loess Plateau. J. Arid Land 2017, 9, 122–131. [Google Scholar] [CrossRef] [Green Version]
  24. Deng, L.; Wang, K.B.; Chen, M.L.; Shangguan, Z.P.; Sweeney, S. Soil organic carbon storage capacity positively related to forest succession on the Loess Plateau, China. Catena 2013, 110, 1–7. [Google Scholar] [CrossRef]
  25. Jia, G.M.; Cao, J.; Wang, C.Y.; Wang, G. Microbial biomass and nutrients in soil at the different stages of secondary forest succession in Ziwulin, northwest China. Forest Ecol. Manag. 2005, 217, 117–125. [Google Scholar] [CrossRef]
  26. Zhang, C.; Liu, G.B.; Xue, S.; Wang, G.L. Soil bacterial community dynamics reflect changes in plant community and soil properties during the secondary succession of abandoned farmland in the Loess Plateau. Soil Biol. Biochem. 2016, 97, 40–49. [Google Scholar] [CrossRef]
  27. Zhong, Y.Q.W.; Yan, W.M.; Wang, R.W.; Wang, W.; Shangguan, Z.P. Decreased occurrence of carbon cycle functions in microbial communities along with long–term secondary succession. Soil Biol. Biochem. 2018, 123, 207–217. [Google Scholar] [CrossRef]
  28. Ma, R.T.; Hu, F.N.; Liu, J.F.; Wang, C.L.; Wang, Z.L.; Liu, G.; Zhao, S.W. Shifts in soil nutrient concentrations and C:N:P stoichiometry during long–term natural vegetation restoration. Peerj 2020, 8, e8382. [Google Scholar] [CrossRef]
  29. Dang, P.; Ngoc, H.V.; Shen, Z.; Liu, J.L.; Zhao, F.; Zhu, H.L.; Yu, X.; Zhao, Z. Changes in soil fungal communities and vegetation following afforestation with Pinus tabulaeformis on the Loess Plateau. Ecosphere 2018, 9, e24018. [Google Scholar] [CrossRef] [Green Version]
  30. Zou, H.Y.; Liu, G.B.; Wang, H.S. The vegetation development in North Ziwulin forest region in last fifty years. Acta Bot. Boreal. Occident. Sin. 2002, 22, 1–8. [Google Scholar]
  31. Cheng, Y.B.; Xia, Y.D. Soil microbial and enzymatic activities across a chronosequence of chinese pine plantation development on the loess plateau of china. Pedosphere 2012, 22, 1–12. [Google Scholar]
  32. Zhong, Z.K.; Wang, X.; Zhang, X.Y.; Zhang, W.; Xu, Y.D.; Ren, C.J.; Han, X.H.; Yang, G.H. Edaphic factors but not plant characteristics mainly alter soil microbial properties along a restoration chronosequence of Pinus tabulaeformis stands on Mt. Ziwuling, China. For. Ecol. Manag. 2019, 453, 117625. [Google Scholar] [CrossRef]
  33. Liu, Y.L.; Zhu, G.Y.; Hai, X.Y.; Li, J.W.; Shangguan, Z.P.; Peng, C.H.; Deng, L. Long–term forest succession improves plant diversity and soil quality but not significantly increase soil microbial diversity: Evidence from the Loess Plateau. Ecol. Eng. 2020, 142, 105631. [Google Scholar] [CrossRef]
  34. Li, Y.Y.; Shao, M.A. Change of soil physical properties under long-term natural vegetation restoration in the Loess Plateau of China. J. Arid Environ. 2006, 64, 77–96. [Google Scholar] [CrossRef]
  35. Blake, G.R.; Hartge, K.H. Bulk Density. In Methods of Soil Analysis. Part 1, Physical and Mineralogical Methods, 2nd ed.; Klute, A., Ed.; American Society of Agronomy, Inc. and Soil Science Society of America: Madison, WI, USA, 1986; pp. 363–375. [Google Scholar]
  36. Jabro, J.D.; Stevens, W.B.; Iversen, W.M. Comparing two methods for measuring soil bulk density and moisture content. J. Soil Sci. 2020, 10, 233–243. [Google Scholar] [CrossRef]
  37. Nelson, D.W.; Sommers, L.E. Total carbon, organic carbon, and organic matter. In Methods of Soil Analysis. Part 2: Chemical and Microbiological Properties; Page, A.L., Miller, R.H., Keeney, D.R., Eds.; American Society of Agronomy: Madison, WI, USA, 1982; pp. 539–579. [Google Scholar]
  38. Bremner, J.M.; Mulvaney, C.S. Nitrogen–total. In Methods of Soil Analysis. Part 2, Chemical and Microbial Properties; Page, A.L., Miller, R.H., Keeney, D.R., Eds.; Agronomy Society of America, Agronomy Monograph 9: Madison, WI, USA, 1982; pp. 595–624. [Google Scholar]
  39. Wu, J.; O’Donnell, A.G.; He, Z.L.; Syers, J.K. Fumigation–extraction method for the measurement of soil microbial biomass–S. Soil Biol. Biochem. 1994, 26, 117–125. [Google Scholar] [CrossRef]
  40. Vance, E.D.; Brookes, P.C.; Jenkinson, D.S. An extraction method for measuring soil microbial biomass C. Soil Biol. Biochem. 1987, 19, 703–707. [Google Scholar] [CrossRef]
  41. Brookes, P.C.; Landman, A.; Pruden, G.; Jenkinson, D.S. Chloroform fumigation and the release of soil nitrogen: A rapid direct extraction method to measure microbial biomass nitrogen in soil. Soil Biol. Biochem. 1985, 17, 837–842. [Google Scholar] [CrossRef]
  42. Liang, W.J.; Lou, Y.L.; Li, Q.; Zhong, S.; Zhang, X.K.; Wang, J.K. Nematode faunal response to long–term application of nitrogen fertilizer and organic manure in Northeast China. Soil Biol. Biochem. 2009, 41, 883–890. [Google Scholar] [CrossRef]
  43. Bongers, T. De Nematoden van Nederland. In Vormgeving en Technische Realisatie; Uitgeverij Pirola: Schoorl, The Netherlands, 1994; pp. 68–385. [Google Scholar]
  44. Ahmad, W.; Jairjpuri, M.S. Mononchida: The Predaceous Nematodes. In Nematology Monographs and Perspectives; Brill: Plantijnstraat, The Netherlands, 2010; Volume 7, pp. 1–299. [Google Scholar]
  45. Yeates, G.W.; Wardle, D.A. Nematodes as predators and prey: Relationships to biological control and soil processes. Pedobiologia 1996, 40, 43–50. [Google Scholar]
  46. Wagner, D.; Eisenhauer, N.; Cesarz, S. Plant species richness does not attenuate responses of soil microbial and nematode communities to a flood event. Soil Biol. Biochem. 2015, 89, 135–149. [Google Scholar] [CrossRef]
  47. Shannon, C.E.; Weaver, W. The Mathematical Theory of Communication; University of Illinois Press: Urbana, IL, USA, 1949; p. 144. [Google Scholar]
  48. Pielou, E.C. The measurement of diversity in different types of biological collections. J. Theor. Biol. 1966, 13, 131–144. [Google Scholar] [CrossRef]
  49. Simpson, E.H. Measurement of diversity. J. Cardiothor. Vasc. An. 1972, 27, 261. [Google Scholar] [CrossRef]
  50. Ferris, H.; Bongers, T.; de Goede, R. A framework for soil food web diagnostics: Extension of the nematode faunal analysis concept. Appl. Soil Ecol. 2001, 18, 13–29. [Google Scholar] [CrossRef]
  51. De Long, J.R.; Laudon, H.; Blume–Werry, G.; Kardol, P. Nematode community resistant to deep soil frost in boreal forest soils. Pedobiologia 2016, 59, 243–251. [Google Scholar] [CrossRef]
  52. Urzelai, A.; Hernandez, A.J.; Pastor, J. Biotic indices based on soil nematode communities for assessing soil quality in terrestrial ecosystems. Sci. Total Environ. 2000, 247, 253–261. [Google Scholar] [CrossRef] [Green Version]
  53. Wasilewska, L. The effect of age of meadows on succession and diversity in soil nematode communities. Pedobiologia 1994, 38, 1–11. [Google Scholar]
  54. Yeates, G.W. Nematodes as soil indicators: Functional and biodiversity aspects. Biol. Fert. Soils 2003, 37, 199–210. [Google Scholar] [CrossRef]
  55. Lozano, Y.M.; Hortal, S.; Armas, C.; Pugnaire, F.I. Interactions among soil, plants, and microorganisms drive secondary succession in a dry environment. Soil Biol. Biochem. 2014, 78, 298–306. [Google Scholar] [CrossRef]
  56. Li, Z.P.; Wei, Z.F.; Yang, X.D. Seasonal variations of soil nematode community at different secondary succession stages of evergreen broad–leaved forests in Ailao Mountain. Chinese Journal of Ecology. Chin. J. Ecol. 2016, 35, 3023–3031. [Google Scholar]
  57. Ye, Y.Y.; Rui, Y.C.; Zeng, Z.X.; He, X.Y.; Wang, K.L.; Zhao, J. Responses of soil nematode community to monoculture or mixed culture of a grass and a legume forage species in China. Pedosphere 2020, 30, 791–800. [Google Scholar] [CrossRef]
  58. Jourdan, M.; Piedallu, C.; Baudry, J.; Defossez, E.; Morin, X. Tree diversity and the temporal stability of mountain forest productivity: Testing the effect of species composition, through asynchrony and overyielding. Eur. J. Forest Res. 2020. [Google Scholar] [CrossRef]
  59. Deng, L.; Wang, K.B.; Shangguan, Z.P. Long–term natural succession improves nitrogen storage capacity of soil on the Loess Plateau, China. Soil Res 2014, 52, 262. [Google Scholar] [CrossRef]
  60. Deng, L.; Wang, K.B.; Tang, Z.S.; Shangguan, Z.P. Soil organic carbon dynamics following natural vegetation restoration: Evidence from stable carbon isotopes (delta C–13). Agr. Ecosyst. Environ. 2016, 221, 235–244. [Google Scholar] [CrossRef]
  61. Cortois, R.; Veen, G.F.C.; Duyts, H.; Abbas, M.; Strecker, T.; Kostenko, O.; Eisenhauer, N.; Scheu, S.; Gleixner, G.; de Deyn, G.B.; et al. Possible mechanisms underlying abundance and diversity responses of nematode communities to plant diversity. Ecosphere 2017, 8, e01719. [Google Scholar] [CrossRef]
  62. Deng, X.W.; Han, S.J.; Hu, Y.L.; Zhou, Y.M. Carbon and nitrogen transformations in surface soils under ermans birch and dark coniferous forests. Pedosphere 2009, 19, 230–237. [Google Scholar] [CrossRef]
  63. Priha, O.; Grayston, S.J.; Hiukka, R.; Pennanen, T.; Smolander, A. Microbial community structure and characteristicsof the organic matter in soils under Pinus sylvestris, Picea abies and Betula pendula at two forest sites. Biol. Fert. Soils 2001, 33, 17–24. [Google Scholar] [CrossRef]
  64. Zhang, Y.W.; Shangguan, Z.P. The coupling interaction of soil water and organic carbon storage in the long vegetation restoration on the Loess Plateau. Ecol. Eng. 2016, 91, 574–581. [Google Scholar] [CrossRef]
  65. Asplund, J.; Kauserud, H.; Ohlson, M.; Nybakken, L. Spruce and beech as local determinants of forest fungal community structure in litter, humus and mineral soil. Fems Microbiol. Ecol. 2019, 95, fiy232. [Google Scholar] [CrossRef] [PubMed]
  66. Welti, E.; Helzer, C.; Joern, A. Impacts of plant diversity on arthropod communities and plant–herbivore network architecture. Ecosphere 2017, 8, e1983. [Google Scholar] [CrossRef] [Green Version]
  67. Salazar, D.; Jaramillo, A.; Marquis, R.J. The impact of plant chemical diversity on plant–herbivore interactions at the community level. Oecologia 2016, 181, 1199–1208. [Google Scholar] [CrossRef]
  68. Ferris, H.; Bongers, T. Nematode indicators of organic enrichment. J. Nematol. 2006, 38, 3–12. [Google Scholar] [PubMed]
  69. Bongers, T.; Vandermeulen, H.; Korthals, G. Inverse relationship between the nematode maturity index and plant parasite index under enriched nutrient conditions. Appl. Soil Ecol. 1997, 6, 195–199. [Google Scholar] [CrossRef]
  70. Wang, K.B.; Chen, M.L.; Qin, J.; Liu, Y.; An, H.; Shangguan, Z.P. Plant species diversity and the relation with soil properties in natural succession process in Ziwuling area. Acta Bot. Boreal. Occident. Sin. 2007, 27, 2089–2096. [Google Scholar]
  71. Liang, J.; Wang, X.; Yu, Z.; Dong, Z.; Wang, J. Effects of vegetation succession on soil fertility within Farming-Plantation Ecotone in Ziwuling mountains of the Loess Plateau in China. Agr. Sci. China 2010, 9, 1481–1491. [Google Scholar] [CrossRef]
  72. Fu, B.J.; Liu, S.L.; Ma, K.M.; Zhu, Y.G. Relationships between soil characteristics, topography and plant diversity in a heterogeneous deciduous broad–leaved forest near Beijing, China. Plant Soil 2004, 261, 47–54. [Google Scholar] [CrossRef]
  73. Heydari, M.; Eslaminejad, P.; Kakhki, F.V.; Mirab–Balou, M.; Omidipour, R.; Prevosto, B.; Kooch, Y.; Lucas–Borja, M.E. Soil quality and mesofauna diversity relationship are modulated by woody species and seasonality in semiarid oak forest. Forest Ecol. Manag. 2020, 473, 118332. [Google Scholar] [CrossRef]
  74. Bargali, K.; Manral, V.; Padalia, K.; Bargali, S.S.; Upadhyay, V.P. Effect of vegetation type and season on microbial biomass carbon in Central Himalayan forest soils, India. Catena 2018, 171, 125–135. [Google Scholar] [CrossRef]
  75. Kitagami, Y.; Matsuda, Y. Temperature changes affect multi–trophic interactions among pines, mycorrhizal fungi, and soil nematodes in a microcosm experiment. Pedobiologia 2020, 78, 150595. [Google Scholar] [CrossRef]
  76. Wang, X.L.; Yu, S.Q.; Zhou, L.X.; Fu, S.L. Soil microbial characteristics and the influencing factors in subtropical forests. Acta Ecol. Sin. 2016, 36, 8–15. [Google Scholar] [CrossRef]
  77. Guan, P.T.; Zhang, X.K.; Yu, J.; Cheng, Y.Y.; Li, Q.; Andriuzzi, W.S.; Liang, W.J. Soil microbial food web channels associated with biological soil crusts in desertification restoration: The carbon flow from microbes to nematodes. Soil Biol. Biochem. 2018, 116, 82–90. [Google Scholar] [CrossRef]
  78. Thakur, M.P.; Tilman, D.; Purschke, O.; Ciobanu, M.; Cowles, J.; Isbell, F.; Wragg, P.D.; Eisenhauer, N. Climate warming promotes species diversity, but with greater taxonomic redundancy, in complex environments. Sci. Adv. 2017, 3, e1700866. [Google Scholar] [CrossRef] [PubMed] [Green Version]
  79. Johnson, K.H.; Vogt, K.A.; Clark, H.J.; Schmitz, O.J.; Vogt, D.J. Biodiversity and the productivity and stability of ecosystems. Trends Ecol. Evol. 1996, 11, 372–377. [Google Scholar] [CrossRef]
  80. Zhang, X.; Huang, Y.T.; Liu, S.R.; Fu, S.L.; Ming, A.G.; Li, X.Z.; Yao, M.J.; Li, H.; Tian, C. Mixture of tree species enhances stability of the soil bacterial community through phylogenetic diversity. Eur. J. Soil Sci. 2019, 70, 644–654. [Google Scholar] [CrossRef]
  81. Morin, X.; Fahse, L.; de Mazancourt, C.; Scherer–Lorenzen, M.; Bugmann, H. Temporal stability in forest productivity increases with tree diversity due to asynchrony in species dynamics. Ecol. Lett. 2014, 17, 1526–1535. [Google Scholar] [CrossRef]
  82. Geng, S.B.; Shi, P.L.; Song, M.H.; Zong, N.; Zu, J.X.; Zhu, W.R. Diversity of vegetation composition enhances ecosystem stability along elevational gradients in the Taihang Mountains, China. Ecol. Indic. 2019, 104, 594–603. [Google Scholar] [CrossRef]
  83. Haddad, N.M.; Crutsinger, G.M.; Gross, K.; Haarstad, J.; Tilman, D. Plant diversity and the stability of foodwebs. Ecol. Lett. 2011, 14, 42–46. [Google Scholar] [CrossRef]
  84. Borer, E.T.; Seabloom, E.W.; Tilman, D. Plant diversity controls arthropod biomass and temporal stability. Ecol. Lett. 2012, 15, 1457–1464. [Google Scholar] [CrossRef]
Figure 1. The monthly average air temperature (°C) and rainfall amount (mm) in the study area from January to December of 2017.
Forests 12 00246 g001
Figure 2. Ecological indices of the soil nematode community of three forest types in the dry (April) and rainy (August) season (mean ± SE). (a) Shannon–Wiener diversity index, H’; (b) Pielou’s evenness index, J’; (c) Simpson dominance index, λ; (d) maturity index, MI; (e) plant parasite index, PPI; (f) plant parasite index/maturity index, PPI/MI; (g) Wasilewska index, WI; and (h) nematode channel ratio index, NCR. PT: Pinus tabuliformis forest; BP: Betula platyphylla forest; QL: Quercus liaotungensis forest. Different lowercase letters above error bars indicate significant differences among forest types in April (dry season) (p < 0.05), and different capital letters above error bars indicate significant differences among forest types in August (rainy season) (p < 0.05). The asterisk * between chart columns represents significant differences between two seasons under the same forest type.
Forests 12 00246 g002
Figure 3. Nematode faunal analysis of three forest types in the Ziwuling region. PT: P. tabuliformis forest; BP: B. platyphylla forest; and QL: Q. liaotungensis forest. The solid icons represent the nematode faunal profiles in April (dry season), and the hollow icons represent those in August (rainy season).
Forests 12 00246 g003
Figure 4. The seasonal variability (%) of soil nematode community characteristics of three forest types in the Ziwuling region. (a) PT: P. tabuliformis forest; (b) BP: B. platyphylla forest; and (c) QL: Q. liaotungensis forest. TNA, total nematode abundance; BF, PP, FF, and OP represent the abundance of bacterial feeders, plant parasites, fungal feeders, and omnivore-predators; H’, Shannon–Wiener diversity index; J’, Pielou’s evenness index; λ, Simpson dominance index; MI, maturity index; PPI, plant parasite index; PPI/MI, plant parasite index/maturity index; WI, Wasilewska index; and NCR, nematode channel ratio index.
Forests 12 00246 g004
Figure 5. Redundancy analysis (RDA) of soil nematode community and soil environmental factors under different forest types. PT: P. tabuliformis forest; BP: B. platyphylla forest; and QL: Q. liaotungensis forest. The solid icons represent the nematode communities in April and the hollow icons represent those in August. Acr, Acrobeles; Aph1, Aphelenchoides; Aph2, Aphelenchus; Apo, Aporcelaimellus; Cep, Cephalobus; Cer, Cervidellus; Cri, Criconemoides; Dis, Discolaimium; Dit, Ditylenchus; Euc, Eucephalobus; Hel, Helicotylenchus; Mal, Malenchus; Mic, Microdorylaimus; Neo, Neopsilenchus; Nyg, Nygolaimus; Ple, Plectus; Tho, Thonus; Tyl1, Tylencholaimus; Tyl2, Tylenchorhynchus; Tyl3, Tylenchus; and Xip, Xiphinema. BF, bacterial feeders; PP, plant parasites; FF, fungal feeders; and OP, omnivore-predators. Soil environmental factors: SMC, soil moisture content; SOC, soil organic carbon; TN, soil total nitrogen; MBC, soil microbial biomass carbon; MBN, soil microbial biomass nitrogen; DOC, soil dissolved organic carbon; DON, soil dissolved organic nitrogen; NO3–N, soil nitrate nitrogen; and NH4+–N, soil ammonium nitrogen.
Forests 12 00246 g005
Figure 6. Relationships between the nematode community characteristics and environmental properties (n = 18). (a) The relationship between TNA and TN; (b) the relationship between FF and SOC; and (c) the relationship between FF and TN. Each data point corresponds to the value of one sampling site. Quadratic regressions best fit the data. Regression coefficients are reported if p < 0.05. TNA, total nematode abundance; FF, the abundance of fungal feeders; SOC, soil organic carbon; and TN, soil total nitrogen.
Forests 12 00246 g006
Table 1. The geographical features and vegetation characteristics of the sampling sites in the three forests.
Forest TypesForest AgeLocationAltitude (m)Tree CW (m)Tree DBH (cm)Tree Height (m)Canopy Density (%)H’plantMain Plant Species
PT26y36°04′05″ N
108°32′03″ E
13771.63 ± 0.25c27.30 ± 0.80b6.56 ± 0.15ab 60.33 ± 3.18c0.59 ± 0.07cPinus tabuliformis Carrière, Acer ginnala Maxim., Lonicera japonica Thunb.
BP27y36°04′22″ N
108°31′41″ E
13412.95 ± 0.20b30.79 ± 6.08b5.97 ± 1.37b74.67 ± 2.73b1.43 ± 0.05aBetula platyphylla Sukaczev, Larix gmelinii Kuzen., Acer ginnala, Lonicera japonica
QL30y36°02′57″ N
108°32′13″ E
14353.88 ± 0.74a64.83 ± 17.51a8.46 ± 0.98a85.33 ± 3.18a1.02 ± 0.05bQuercus liaotungensis Koidz., Rosa hugonis Hemsl., Spiraea salicifolia Lour., Carex lanceolata Boott
PT: Pinus tabuliformis forest; BP: Betula platyphylla forest; QL: Quercus liaotungensis forest. Tree CW: average crown width of trees. Tree DBH: average diameter at breast height of trees. H’plant: Shannon–Wiener diversity index of plant community. The values of the tree CW, tree DBH, tree height, canopy density, and H’plant are the mean ± SE (standard error). Different letters in the same column indicate significant differences among forest types (p < 0.05).
Table 2. The soil physicochemical properties of different forest types in the dry (April) and rainy (August) season (mean ± SE).
Soil PropertiesSeasonPTBPQL
SBD (g/cm3)April1.07 ± 0.07a1.02 ± 0.07a1.14 ± 0.09a
August1.09 ± 0.08A1.15 ± 0.09A1.07 ± 0.14A
p value0.970.6610.732
SMC (%)April7.05 ± 0.35b14.93 ± 1.55a16.29 ± 2.41a
August16.54 ± 0.85B30.34 ± 2.02A25.06 ± 1.70A
p value0.0010.0040.041
pHApril7.60 ± 0.01a7.64 ± 0.04a7.65 ± 0.03a
August7.71 ± 0.02A7.70 ± 0.01A7.72 ± 0.02A
p value0.0550.2040.127
SOC (g/kg)April18.23 ± 2.52b28.99 ± 1.88a22.39 ± 2.70ab
August13.35 ± 1.00B30.13 ± 2.52A22.19 ± 2.54AB
p value0.1460.7370.960
TN (g/kg)April1.29 ± 0.16b2.35 ± 0.20a1.85 ± 0.25ab
August1.21 ± 0.08B2.64 ± 0.20A1.81 ± 0.19B
p value0.6610.3540.920
MBC (mg/kg)April627.08 ± 23.65b1010.90 ± 49.91a902.87 ± 69.99a
August1178.89 ± 154.73A1385.54 ± 120.17A1218.70 ± 153.36A
p value0.0240.0450.032
MBN (mg/kg)April95.23 ± 0.98c164.48 ± 3.44a145.18 ± 4.82b
August129.54 ± 18.24A125.39 ± 15.29A108.89 ± 1.86A
p value0.1340.0670.052
DOC (mg/kg)April107.05 ± 2.19b163.55 ± 4.49a145.09 ± 8.21a
August199.34 ± 9.06B286.77 ± 6.86A273.09 ± 5.09A
p value0.0010.0010.001
DON (mg/kg)April20.25 ± 0.76c32.29 ± 0.67a26.84 ± 0.27b
August34.90 ± 5.44A41.74 ± 1.96A37.43 ± 4.38A
p value0.0560.0100.073
NO3−–N (mg/kg)April0.91 ± 0.48a1.49 ± 0.50a0.83 ± 0.11a
August1.41 ± 0.10B5.67 ± 1.04A2.60 ± 0.18B
p value0.3650.0220.001
NH4+–N (mg/kg)April2.07 ± 0.42a4.10 ± 0.40a3.43 ± 1.01a
August5.62 ± 0.44B6.06 ± 1.00B9.00 ± 2.33A
p value0.0040.1440.006
PT: P. tabuliformis forest; BP: B. platyphylla forest; QL: Q. liaotungensis forest. Different lowercase letters in the same row indicate significant differences among forest types in April (dry season) (p < 0.05), and different capital letters in the same row indicate significant differences among forest types in August (rainy season) (p < 0.05). The p value represents the difference of soil properties between two seasons under the same arbor forest. SBD, soil bulk density; SMC, soil moisture content; SOC, soil organic carbon; TN, soil total nitrogen; MBC, soil microbial biomass carbon; MBN, soil microbial biomass nitrogen; DOC, soil dissolved organic carbon; DON, soil dissolved organic nitrogen; NO3–N, soil nitrate nitrogen; and NH4+–N, soil ammonium nitrogen.
Table 3. The mean abundance (individuals/100 g dry soil) and dominance of all soil nematode genera and trophic groups in three forests in the dry (April) and rainy (August) season.
GenusFamilyTrophic Groupc–p ValueAprilAugust
PTBPQLPTBPQL
AcrobelesCephalobidaeBF24.11 II0.76 I2.50 II11.52 II7.75 II34.70 II
AcrobeloidesCephalobidaeBF26.94 II2.64 II7.19 II4.75 I1.99 I
CephalobusCephalobidaeBF26.56 II10.13 II10.98 II3.74 I20.52 II13.34 II
CervidellusCephalobidaeBF25.02 II5.92 II2.92 II10.64 II7.39 II15.67 II
ChiloplacusCephalobidaeBF23.70 II1.81 II5.36 II5.93 II
EucephalobusCephalobidaeBF23.52 II0.76 I2.91 II7.39 II10.13 II35.42 II
PanagrolaimusPanagrolaimidaeBF10.42 I1.47 I
PlacodiraCephalobidaeBF24.06 II
RhabditisRhabditidaeBF10.91 I10.49 II4.73 II2.65 I4.32 II
ProtorhabditisRhabditidaeBF11.31 I1.19 I
AlaimusAlaimidaeBF40.91 I7.11 II0.97 I1.19 I
PlectusPlectidaeBF210.38 II2.94 I56.70 III0.66 I
WilsonemaPlectidaeBF21.82 I3.30 I1.81 II5.38 II
Bacterivores22.86 ± 6.28b63.56 ± 19.11a31.68 ± 2.93b50.09 ± 9.38B125.04 ± 49.14A106.11 ± 36.47AB
AphelenchoidesAphelenchoididaeFF228.58 III22.74 II3.06 II3.04 I21.72 II7.99 II
AphelenchusAphelenchidaeFF24.39 II17.30 II16.11 III5.67 II3.84 I5.05 II
FilenchusTylenchidaeFF20.87 I5.27 II0.69 I4.15 I6.84 II3.66 I
NothotylenchusAnguinidaeFF20.56 I
DiphtherophoraDiphtherophoridaeFF31.47 I4.12 I
TylencholaimusLeptonchidaeFF468.55 III78.54 III18.31 III241.96 III124.28 III102.81 III
Fungivores102.40 ± 31.39ab125.32 ± 44.24a38.73 ± 13.68b254.81 ± 22.46A160.80 ± 13.29B119.51 ± 17.03C
CriconemoidesCriconematidaePP33.64 II12.42 II3.89 II0.66 I
DitylenchusAnguinidaePP21.66 I3.55 II1.95 II6.50 II20.78 II
HelicotylenchusHoplolaimidaePP318.18 II24.58 II7.23 II6.08 II42.64 II4.18 II
MalenchusTylenchidaePP25.15 II2.48 I7.37 II6.88 II20.52 II1.99 I
NeopsilenchusTylenchidaePP20.87 I6.74 II20.05 III8.21 II6.77 II39.22 III
PararotylenchusHoplolaimidaePP33.50 II
ParatylenchusTylenchulidaePP214.67 II17.4 II
PratylenchusPratylenchidaePP32.77 II2.10 I1.39 I
PsilenchusTylenchidaePP20.87 I
RotylenchusHoplolaimidaePP34.90 II3.05 I5.96 II
TylenchorhynchusDolichodoridaePP31.58 I15.13 II4.85 II25.15 II
TylenchusTylenchidaePP23.28 II0.76 I1.11 I5.98 II16.97 II9.32 II
XiphinemaLongidoridaePP562.52 III4.51 II1.95 II42.02 II23.26 II6.24 II
Plant parasites102.65 ± 24.35a91.41 ± 38.38ab57.13 ± 20.48b69.16 ± 20.03B161.31 ± 51.87A83.78 ± 37.06AB
AporcelaimellusAporcelaimidaeOP51.70 I19.22 II7.49 II14.87 II18.44 II23.85 II
DorydorellaQudsianematidaeOP43.49 II0.42 I
EpidorylaimusQudsianematidaeOP41.02 I
EudorylaimusQudsianematidaeOP42.62 I2.93 I 5.26 II5.93 II0.66 I
KochinemaQudsianematidaeOP40.56 I5.67 II7.31 II
MicrodorylaimusQudsianematidaeOP40.87 I4.06 II4.31 II14.37 II4.19 I4.00 II
ParaxonchiumParaxonchidaeOP50.76 I0.42 I1.72 I0.66 I
ProdorylaimusThornenematidaeOP56.29 II
ThonusQudsianematidaeOP49.33 II23.00 II1.80 II2.63 I2.37 I20.86 II
DiscolaimiumDiscolaimidaeOP512.36 II4.97 II4.03 II19.65 II1.19 I9.78 II
DiscolaimusDiscolaimidaeOP50.87 I1.67 II1.21 I2.10 I
NygolaimusNygolaimidaeOP510.91 II4.46 II6.11 II1.72 I10.40 II7.63 II
ParavulvusNygolaimidaeOP50.69 I1.31 I5.59 II0.66 I
PrionchulusMononchidaeOP42.10 I
TrischistomaTripylidaeOP31.72 I1.39 I
Omnivore-predators42.15 ± 9.10ab60.41 ± 14.76a27.49 ± 7.15b70.15 ± 30.18A58.58 ± 18.14A76.81 ± 16.81A
Total270.06 ± 11.30ab340.69 ± 65.03a155.02 ± 13.13b444.21 ± 45.60AB505.73 ± 79.63A386.21 ± 95.66B
Genus number293535283629
PT: P. tabuliformis forest; BP: B. platyphylla forest; QL: Q. liaotungensis forest. BF, PP, FF, and OP represent bacterial feeders, plant parasites, fungal feeders, and omnivore-predators. I, the dominance of rare genera (<1%); II, the dominance of common genera (1%–10%); III, the dominance of dominant genera (>10%). The mean values and standard errors of the abundances of all soil nematodes and different nematode trophic groups of three forest types are shown. Different lowercase letters in the same row indicate significant differences of the soil nematode abundance among forest types in April (dry season) (p < 0.05). Different capital letters in the same row indicate significant differences of soil nematode abundance among forest types in August (rainy season) (p < 0.05).
Table 4. The Pearson correlation coefficients between the soil nematode community characteristics and soil physicochemical properties.
Nematode CharacteristicsSMCSOCDOCMBCTNDONMBNNH4+–NNO3–N
TNA0.529 *0.1790.596 **0.688 **0.2580.623 **−0.0840.634 **0.391
PP0.2730.2370.2760.2520.3330.224−0.2770.404 0.125
BF0.659 **0.4570.668 **0.729 **0.476*0.623 **0.1430.803 **0.367
FF0.208−0.1960.3090.461−0.1260.439−0.0040.2270.247
OP0.3040.0710.3540.3470.0530.336−0.1010.2500.357
H’0.3740.807 **0.119−0.0670.748 **0.2510.1810.314−0.008
J’0.2480.634 **0.063−0.0730.564 *0.0550.0440.2260.049
λ−0.261−0.655 **−0.0490.132−0.598 **−0.1060.013−0.2540.021
MI0.120−0.2090.1960.231−0.2330.2320.078−0.0170.328
PPI−0.563 *−0.619 **−0.449−0.254−0.578 *−0.463−0.222−0.307−0.365
PPI/MI−0.483 *−0.234−0.472 *−0.443−0.187−0.548 *−0.284−0.194−0.494 *
WI0.090−0.0210.1960.199−0.0450.2030.3200.0660.216
NCR0.3180.4420.2600.2320.4090.1700.2410.3520.044
* p < 0.05; ** p < 0.01. Soil nematode community characteristics: TNA, total nematode abundance; BF, PP, FF, and OP represent the abundance of bacterial feeders, plant parasites, fungal feeders, and omnivore-predators, respectively; H’, Shannon–Wiener diversity index; J’, Pielou’s evenness index; λ, Simpson dominance index; MI, maturity index; PPI, plant parasite index; PPI/MI, plant parasite index/maturity index; WI, Wasilewska index; and NCR, nematode channel ratio index. Soil physicochemical properties: SMC, soil moisture content; SOC, soil organic carbon; TN, soil total nitrogen; MBC, soil microbial biomass carbon; MBN, soil microbial biomass nitrogen; DOC, soil dissolved organic carbon; and DON, soil dissolved organic nitrogen.
Publisher’s Note: MDPI stays neutral with regard to jurisdictional claims in published maps and institutional affiliations.

