Article

Soil Carbon, Nitrogen, and Phosphorus Storages and Their Stoichiometry Due to Mixed Afforestation with Hippophae rhamnoides in the Loess Hilly Region, China

1
College of Resources and Environment, Shanxi Agricultural University, Taigu, Jinzhong 030801, China
2
State Key Laboratory of Soil Erosion and Dryland Farming on the Loess Plateau, Institute of Soil and Water Conservation, Chinese Academy of Sciences and Ministry of Water Resources, Yangling, Xianyang 712100, China
3
Institute of Soil and Water Conservation, Northwest A&F University, Yangling, Xianyang 712100, China
*
Author to whom correspondence should be addressed.
Forests 2021, 12(12), 1718; https://doi.org/10.3390/f12121718
Submission received: 14 October 2021 / Revised: 29 November 2021 / Accepted: 4 December 2021 / Published: 7 December 2021
(This article belongs to the Special Issue Nutrient Cycling through the Forest and Soil System)

Abstract

:
Mixed-species tree plantations have additional ecological benefits over single-species tree plantations, such as habitat restoration and increasing biodiversity. However, changes in the soil carbon, nitrogen, and phosphorus storages and stoichiometry after mixed afforestation with the N-fixing tree species under the “Grain for Green Project” in the Loess Plateau of China are not well understood. Typical restoration types, including the mixed plantations of Pinus tabuliformis with Hippophae rhamnoides (HrPt) and Robinia pseudoacacia with H. rhamnoides (HrRp), as well as the pure forests of P. tabuliformis (Pt) and R. pseudoacacia (Rp), were chosen to examine changes in the storages and stoichiometry of soil organic carbon (SOC), total nitrogen (TN), and total phosphorus (TP) in 0–100 cm soil layers. The results showed that compared with the corresponding pure forest, HrRp significantly increased the SOC content in the 0–20 cm soil layer and the SOC storage in the 0–100 cm layer, while HrPt significantly increased the SOC content in the 0–10 cm layer, but there was no significant difference for SOC storage in the 0–100 cm layer between Pt and HrPt. Similarly, HrRp significantly increased the TN content in the 0–10 cm layer and the TN storage in the 0–100 cm layer, but there was no significant difference in TN storage between Pt and HrPt. Furthermore, HrRp significantly increased the TP content in the 0–100 cm layer and TP storage was higher than that of Rp, while there were no significant differences in TP content and storage between Pt and HrPt. In the 0–10 cm soil layer, HrRp significantly reduced C:N and increased N:P, but HrPt significantly increased C:P. In addition, compared with the pure forest, the soil physical and chemical properties had a stronger control effect on the soil storages and stoichiometric ratios in the mixed forests. In summary, compared with P. tabuliformis, the introduction of N-fixing tree species into the R. pseudoacacia forest was more conducive to the accumulation of SOC, TN, and TP reserves and the improvement of the N and P utilization efficiency. These results have important implications for the restoration of degraded vegetation and scientific management of mixed plantations on the Loess Plateau and can provide basic data for the assessment of soil quality at the regional scale.

1. Introduction

Nitrogen (N) and phosphorus (P) are important nutrient elements for tree growth, where these nutritive element storages in soil may represent the crucial ecological factors that affect the primary productivity of a forest ecosystem [1]. Meanwhile, as the largest carbon (C) pool in the terrestrial biosphere, any minor change in soil C content and storage will have a significant impact on global warming [2]. Afforestation was acknowledged as an atmospheric CO2 sequestration measure through the storage of C in soil and improving the nutrient status [3,4]. However, large-scale and high-density planting of pure forests, which may easily cause problems, such as soil fertility decline and slow nutrient turnover, eventually affecting the accumulation of soil C, N, and P, and even the ecosystem functions [5]. Ecological stoichiometry addresses the equilibrium or interactions of the main elements, as well as the correlations between elements and ecosystem functioning, which can help to determine the responses of soil quality to afforestation [6].
Mixed-species tree planting has received intensive interest and is increasingly established throughout the world due to its potential influence on soil quality improvement [7]. Conversely, changes in soil nutrient storage and stoichiometry will affect ecosystem functions and processes. A clear evaluation of soil nutrients in ecological restoration areas is essential for understanding the ecological consequences of mixed afforestation and may have meaningful implications for long-term nutrient availability and the sustainable management of plantations [8].
Different tree species have different effects on soil stoichiometric characteristics in a mixed forest [9]. The soil organic carbon (SOC), total nitrogen (TN), and total phosphorus (TP) contents of a Eucalyptus grandis plantation could be changed significantly by the introduction of Acacia mearnsii [10]. Mixing in a Prunus davidiana forest had a significant effect on soil SOC, TN, C:P, and N:P in the south Taihang Mountains, but had a minor effect on TP [11]. The mixing of Fraxinus chinensis and Robinia pseudoacacia led to a decrease in soil SOC [12], while the mixing of Ailanthus altissima and R. pseudoacacia significantly increased the soil SOC content [13]. It can be seen that a reasonable mixing mode can effectively improve the soil nutrient status. However, the current research on the effect of mixed afforestation mainly focuses on the changes in nutrient content [8]. In terms of soil nutrient availability, nutrient cycling, and balance mechanisms, understanding of the impacts on SOC, TN, and TP storages and their ecological stoichiometric characteristics also need to be strengthened.
Indigenous Chinese pine (Pinus tabuliformis) and N-fixing black locust (R. pseudoacacia) are the dominant tree species for afforestation in the Loess Plateau, which play an important role in regional soil erosion control and landscape maintenance. However, due to the lack of scientific guidance in the initial stage of ecological restoration, large areas of pure artificial forests have been built, resulting in poor growth and low carbon sink function [14]. After long-term afforestation practices, Hippophae rhamnoides (N-fixing tree species) are often included in these pure plantations to improve the stability of an ecosystem through a process of facilitation [15]. The introduction of N-fixing tree species may help to increase the soil SOC and TN contents [16], while the mixing of dual N-fixing tree species was found to be beneficial to the increase of soil TP content [17]. Therefore, it is speculated that the introduction of H. rhamnoides has different effects on these two typical forests, but the specific response characteristics are unclear. Furthermore, little is currently known about whether soil under dual N-fixing trees contained more nutrient storage than the N-fixing and non-N-fixing trees in the mixed planting [18].
In this study, we investigated the response of SOC, TN, and TP storages and stoichiometry in P. tabuliformis and R. pseudoacacia to mixed afforestation with N-fixing tree species by measuring SOC, TN, and TP content in 0–100 cm soil profiles. Our aims were to (1) analyze the differences in SOC, TN, and TP storages and their stoichiometric ratios between pure and mixed forests, and (2) determine the main influencing factors of storage and stoichiometry to identify the differential response. This study contributes to the ecological restoration of degraded vegetation and the sustainable management of mixed forests on the Loess Plateau.

2. Materials and Methods

2.1. Site Description

The study was conducted at the Ansai National Ecological Experimental Station (36°51′ N, 109°19′ E), which is located in Shaanxi province, China. The region belongs to a typical temperate semi-arid climate with a mean annual temperature of 10.4 °C. The mean annual rainfall is approximately 500 mm, where about 60% falls from July to September. The main soil type is Huangmian soil, which was developed from wind-deposited loessial parent material. The dominant woody plants are P. tabulaeformis, Platycladus orientalis, R pseudoacacia, H. rhamnoides, and Caragana korshinskii.

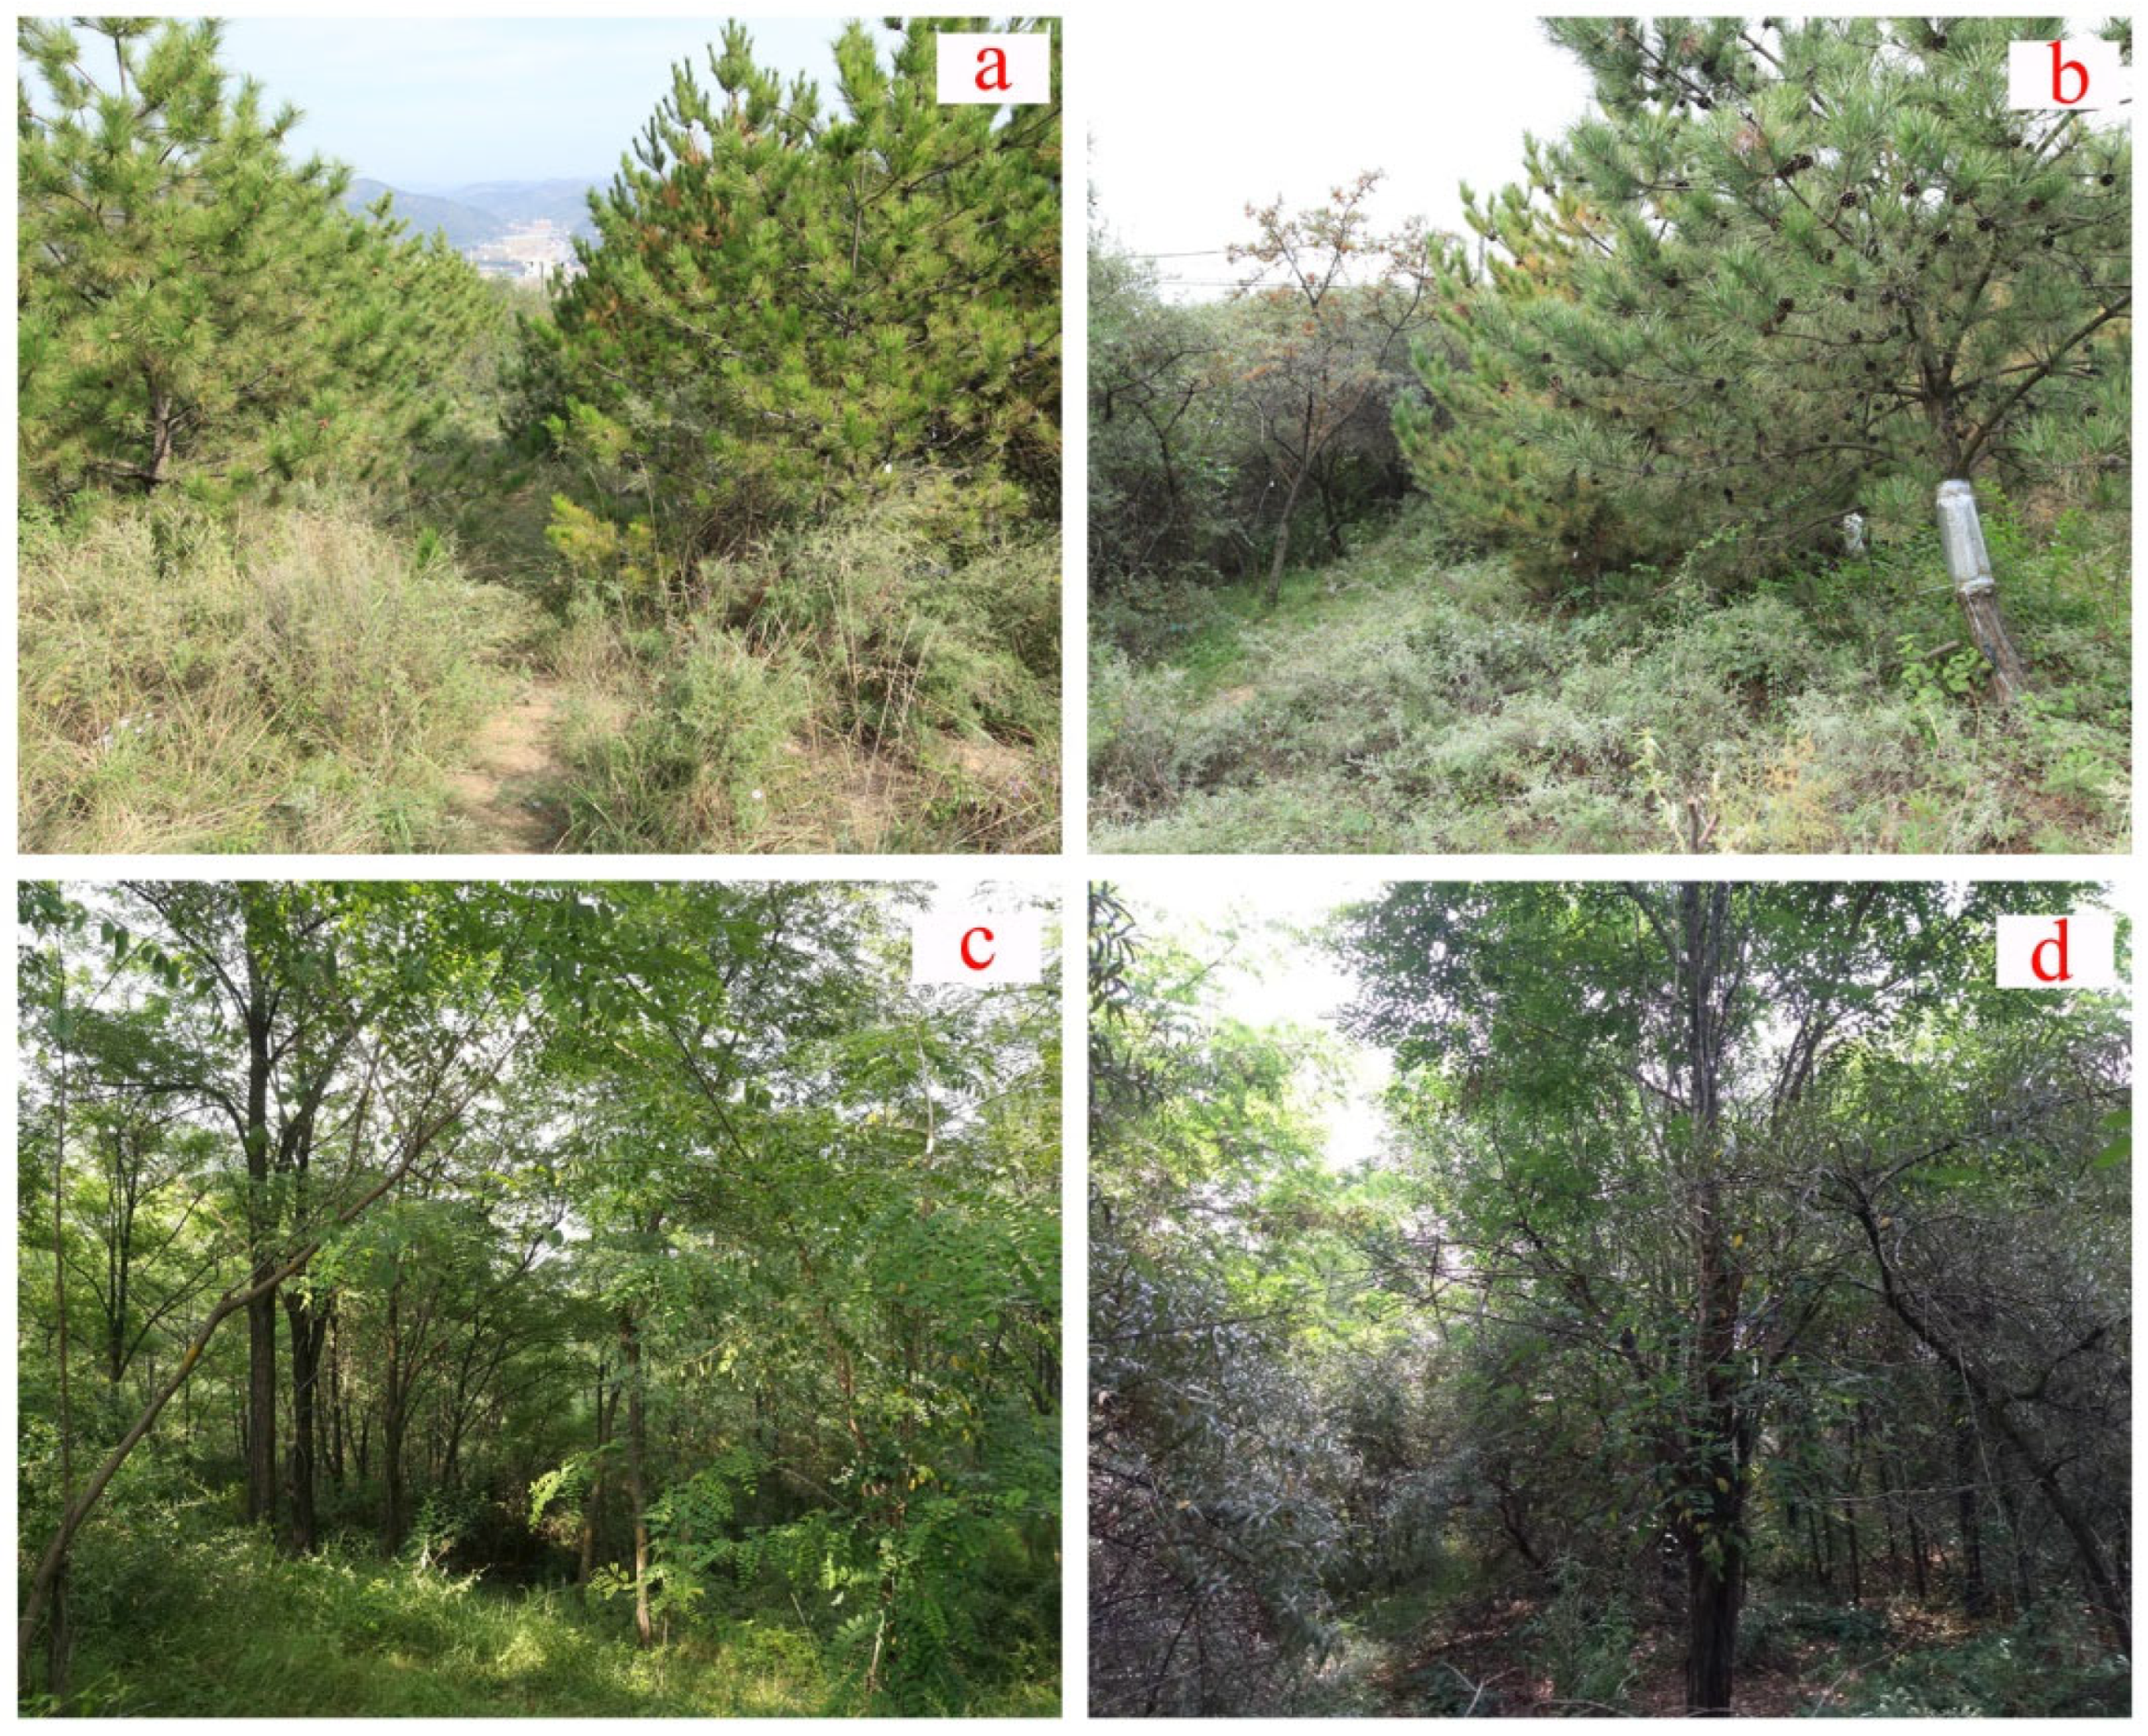
2.2. Experimental Material

Based on the long-term fixed monitoring forest land in the field of the mountain test site, the pure plantations of P. tabulaeformis (Pt) and R pseudoacacia (Rp) and the mixed plantations of P. tabulaeformis with H. rhamnoides (HrPt) and R pseudoacacia with H. rhamnoides (HrRp) were selected as the research objects (Figure 1). For each forest type, three 20 m × 20 m study plots were selected as the sample. The original plantation density was widely used in the central part of the Loess Plateau: stem densities of Pt and Rp in pure plantations were 1667 and 1000 stems ha−1, respectively. The stem densities in the corresponding mixed plantation were 1111 and 833 stems ha−1. In addition, the initial afforestation density in the pure H. rhamnoides plantation was 3300 stems ha−1, and the stem density in the corresponding mixed plantations was 1900 stems ha−1.
According to a survey conducted in 2017, a similar stem density was observed among three replicate plots in the same plantation type. The mean densities of P. tabuliformis and R. pseudoacacia in pure plantations were 1175.8 and 897.3 stems ha−1, respectively. The stem densities of HrPt were 850 and 1775 stems ha−1, respectively, and for HrRp, the stem densities were 800 and 1617 stems ha−1, respectively. The basic characteristics of the sample plots are shown in Table 1.

2.3. Soil Sampling and Laboratory Analyses

With the aim to examine changes in the storages and stoichiometry of SOC, TN, and TP in P. tabuliformis and R. pseudoacacia after mixed afforestation with H. rhamnoides, field soil sampling was conducted in August 2017. A total of 36 soil profiles were collected from 12 plots (three soil profiles per plot along the diagonal). Soil samples were taken from each profile at depth ranges of 0–10, 10–20, 20–50, and 50–100 cm, which were brought back to the laboratory and divided into two parts. One part was naturally air-dried; the plant residues and rocks were removed; and the soil was sieved before measuring the SOC, TN, TP contents and available P. The other part was stored in a refrigerator at 4 °C to be analyzed for other indicators.
The soil bulk density (BD), total porosity, and field capacity of each depth were measured using the cutting ring method. Soil water content (SWC) was obtained using oven-dried at 105 °C for 48 h until a constant weight was achieved. SOC was determined using the wet oxidation method, TN was measured using the Kjeldahl method, and TP and the available P were measured using the HCLO4-H2SO4 colorimetric and NaHCO3-H2SO4 colorimetric methods, respectively. Nitrate N and ammonium N were determined using continuous flow injection analysis [19]. The basic soil physicochemical properties of the test soil are shown in Table 2.

2.4. Data Processing

The SOC, TN, and TP storages of each soil layer were calculated as follows [20]:
SOCiStorage = SOCi × BDi × Di/10
TNiStorage = TNi × BDi × Di/10
TPiStorage = TPi × BDi × Di/10
where SOCi, TNi, and TPi are the SOC, TN, and TP contents of the ith layer of soil (g kg−1), respectively. BDi is the soil bulk density of the ith layer (g cm−3) and Di is the soil depth of the ith layer (cm). The soil storages of the 0–100 cm layer were equal to the sum of the four layers.
One-way analysis of variance (ANOVA) was used to compare significant differences in the SOC, TN, and TP contents, storages, and stoichiometry between the pure and mixed forests. Two-way analysis of variance was used to determine the impact of tree species, the mixing, and their interaction on SOC, TN, TP content and storages and the C:N, C:P, and N:P ratios. Stepwise regression was employed to study the relationships between the SOC, TN, and TP storages and stoichiometric ratios and their influencing factors, and a P-P plot was used to test the normality of the regression residuals (Figure S1). All statistical analyses were performed with SPSS 19.0. Figures were plotted using SigmaPlot 12.5.

3. Results

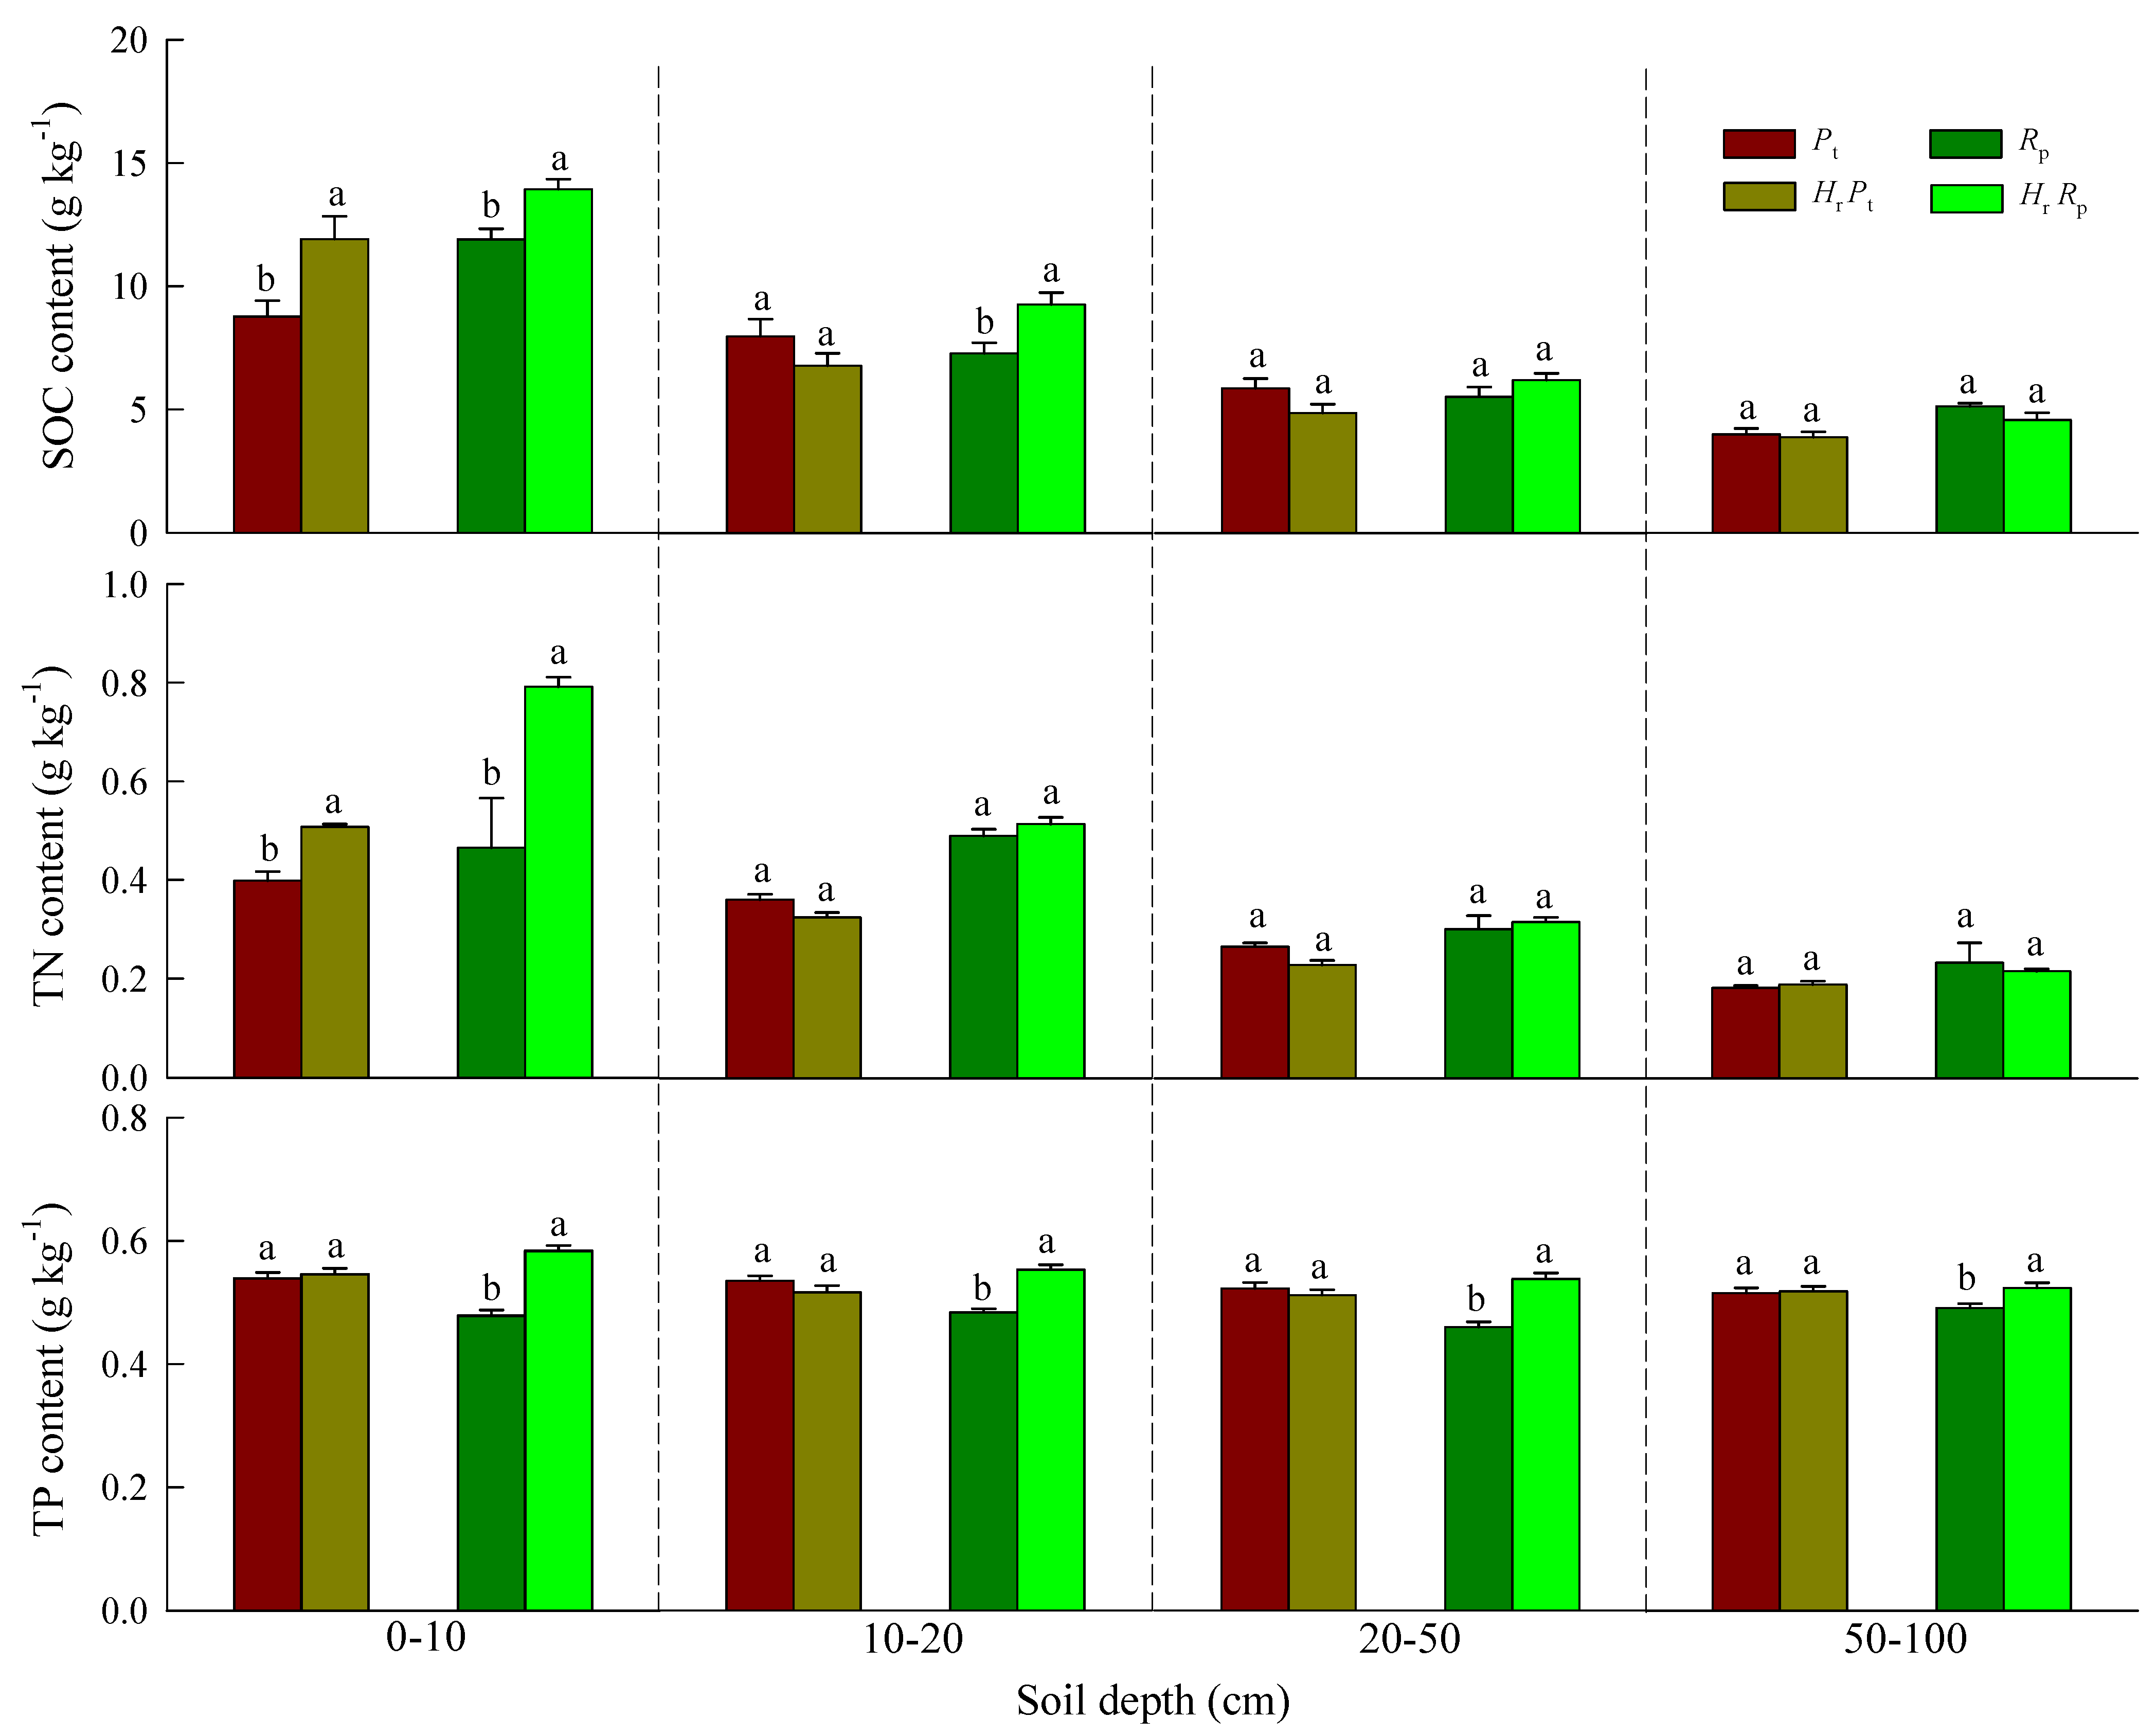
3.1. Soil Physical and Chemical Properties and SOC, TN, and TP Contents

There were different significance variations in the physical and chemical indexes among pure and mixed forests (Table 2). SWC ranged from 0.08 to 0.14 m3 m−3, and there was no significant difference in the same soil layer between pure and mixed forests. BD ranged from 1.11 to 1.39 g cm−3. BD in the mixed forest was lower than that of the pure forest, and the significant differences were concentrated in the 10–20 cm layer. The field capacity and soil total porosity ranged from 13.72 to 19.01% and 45.39 to 55.41%, respectively. These two indexes of the mixed forest were higher than that of the pure forest, and significant differences were observed in the 0–10 and 10–20 cm layers. The content (g kg−1) of soil nutrient elements in pure and mixed forests ranged from 0.12 to 0.86 for nitrate N, 1.14 to 1.98 for ammonium N, and 0.16 to 0.50 for available P. Compared with Pt, HrPt significantly increased the nitrate N and available P contents in the 0–10 cm layer, with increases of 83.06 and 31.01%. Compared with Rp, HrRp significantly increased the ammonium N content of the 0–10 cm layer and available P of the 0–10, 10–20, and 20–50 cm layers, with increases of 71.70, 58.62, 93.75, and 86.75%, respectively.
The contents (g kg−1) of soil elements in the pure and mixed plantations ranged from 3.87 to 13.92 for SOC, 0.18 to 0.79 for TN, and 0.46 to 0.58 for TP. Compared with Pt, HrPt significantly increased the SOC and TN contents of the 0–10 cm soil layer, with increases of 35.84 and 27.50%, and in the same soil layer, there was no significant difference in TP between Pt and HrPt. By contrast, compared with Rp, HrRp significantly increased the SOC content of the 0–10, 10–20 cm soil layers, with increases of 17.07 and 27.16%, as well as the TN content of the 0–10 cm soil layer, with an increase of 68.09%. Furthermore, the TP content in the 0–10, 10–20, 20–50, and 50–100 cm layers of HrRp was increased by 20.83, 14.58%, 17.39, and 6.12%, respectively (p < 0.05) (Figure 2). The mixing and tree species had significant effects on SOC in the 0–10 cm layer, and the 10–20 cm layer was mainly affected by their interaction (p < 0.05). TN in the 0–10 cm layer was influenced by the mixing, tree species, and their interaction (p < 0.01). Except for the mixing, which had a significant influence on TP in the 50–100 cm layer (p < 0.05), other soil layers were mainly affected by the mixing and their interaction (p < 0.01) (Table 3).

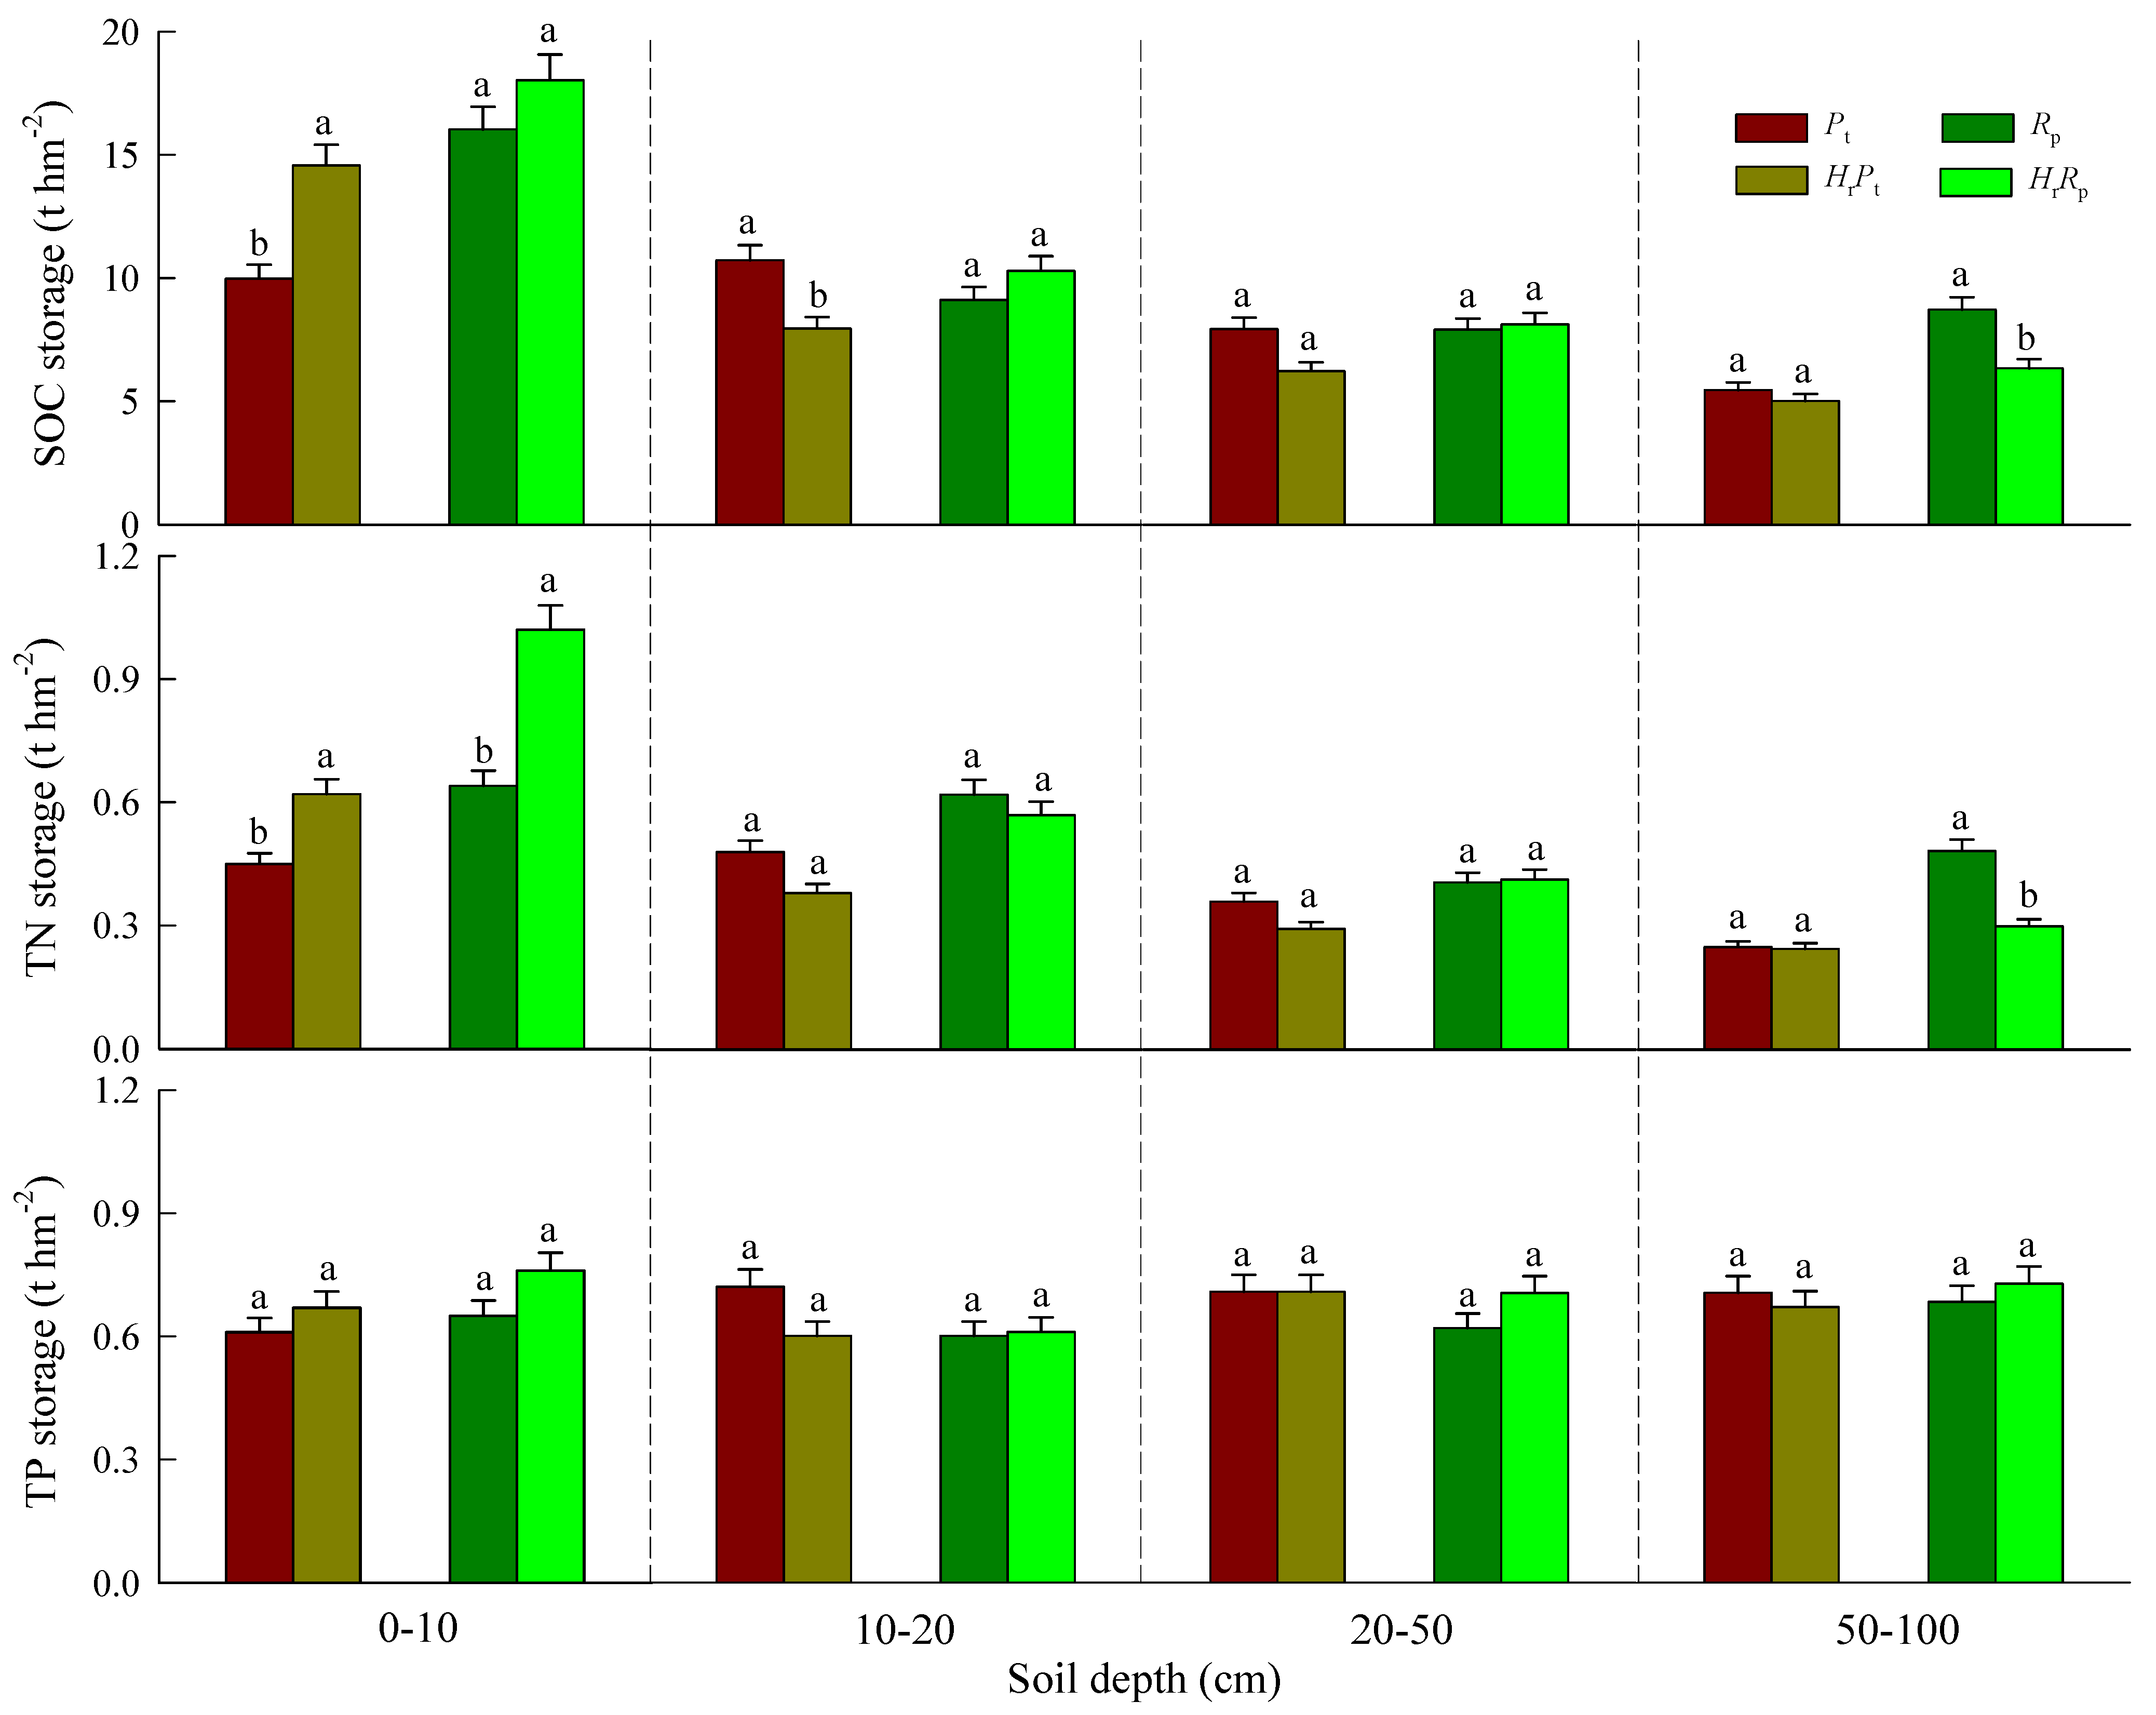
3.2. SOC, TN, and TP Storages

The mean storage (t hm−2) of 10 cm thickness in soil layers of pure and mixed plantations ranged from 5.01 to 18.03 for SOC, 0.24 to 1.02 for TN, and 0.60 to 0.73 for TP. Compared with Pt, HrPt significantly increased the SOC and TN storages of the 0–10 cm soil layer, with increases of 46.14 and 37.78%, respectively, but in the other soil layers, there was a decreasing trend, and a significant difference in SOC storage in the 10–20 cm soil layer was observed. In contrast, compared with Rp, HrRp significantly increased the TN storage of the 0–10 cm soil layer, with an increase of 59.38%, but significantly decreased the SOC and TN storages of the 50–100 cm soil layer (p < 0.05). Moreover, there was no significant difference due to mixed afforestation on TP storage in each soil layer (Figure 3). SOC storage in the 0–10 cm layer was affected by the mixing and tree species (p < 0.01); in the 20–50 cm layer, SOC was mainly influenced by their interaction (p < 0.01); and in the 50–100 cm layer, SOC was affected by the mixing, tree species, and their interaction (p < 0.05). The mixing, tree species, and their interaction had significant effects on the TN storage in the 0–10 (p < 0.05) and 50–100 cm layers (p < 0.01) (Table 4).
To further elucidate the impact of the mixed afforestation on the soil storages, data sets of SOC, TN, and TP storages in the 0–100 cm layers were analyzed. The results indicated that the SOC and TN storages in the 0–100 cm layers in HrRp were significantly higher than that of Rp (p < 0.05); there were no significant differences between Pt and HrPt; and the SOC, TN, and TP storages in 0–100 cm layers of R. pseudoacacia were greater than that of P. tabulaeformis (Table 5).

3.3. SOC, TN, and TP Stoichiometry

The ratios of the soil stoichiometry in the pure and mixed plantations ranged from 15.64 to 25.05 for C:N, 7.54 to 24.82 for C:P, and 0.35 to 1.36 for N:P. In the same soil layer, there was no significant difference in soil C:N between Pt and HrPt. Compared with Pt, HrPt significantly increased the C:P and N:P of the 0–10 cm soil layer, with increases of 31.58 and 25.15%. By contrast, compared with Rp, HrRp significantly decreased C:N of the 0–10 cm soil layer, with a decrease of 29.42%, but significantly increased N:P of the 0–10 cm soil layer, with an increase of 40.07%. In addition, in the same soil layer, there was no significant difference in soil C:P between Rp and HrRp (Figure 4). In the 0–10 cm layer, the mixing and their interaction had significant effects on C:N (p < 0.01), C:P was influenced by the tree species and their interaction (p < 0.05), and the mixing and tree species had significant effects on N:P (p < 0.001) (Table 6).

3.4. Correlations between the Soil Storages, Stoichiometry, and Physical and Chemical Properties

For the pure plantation, the SOC storage was positively correlated with the SOC, TN, and nitrate N contents (p < 0.05), but significantly negatively correlated with BD (p < 0.01). The TN storage was positively correlated with the SOC, TN, and nitrate N contents (p < 0.01), but significantly negatively correlated with BD, SWC, ammonium N, and available P (p < 0.05). The TP storage was positively correlated with total porosity, field capacity, and the TP content (p < 0.05). Soil C:N was negatively correlated with BD (p < 0.05), but significantly positively correlated with total porosity (p < 0.01). Soil C:P and N:P were negatively correlated with SWC, ammonium N, and available P (p < 0.05), but significantly positively correlated with the SOC, TN, and nitrate N contents (p < 0.01) (Table 7). For the mixed plantation, the SOC and TN storages were positively correlated with the SOC, TN, TP, nitrate N, and ammonium N contents (p < 0.05). The TP storage was positively correlated with the TP, ammonium N, and available P contents (p < 0.05), but significantly negatively correlated with BD (p < 0.01). Soil C:N was negatively correlated with the SWC and TN and nitrate N contents (p < 0.05), but significantly positively correlated with total porosity and field capacity (p < 0.05). Soil C:P and N:P were negatively correlated with the TP content (p < 0.05), but significantly positively correlated with the SOC, TN, nitrate N, and ammonium N contents (p < 0.05) (Table 7).
To further reveal the influence of the mixed afforestation on soil storage and stoichiometry, stepwise regression equations were established (Table 8). The results indicated that for the pure plantation, the main factors that affected the SOC storage was the SOC content, TN storage was affected by the SWC and TN content, TP storage was affected by the total porosity and available P, C:N was affected by the total porosity, C:P was affected by the field capacity and TP content, and N:P was affected by the TN content and total porosity. In comparison, for the mixed plantation, the main factors that affected the SOC storage were BD, SWC, and the SOC content; TN storage was affected by the BD and TN, TP, and nitrate N contents; TP storage was affected by BD, field capacity, and the TP and nitrate N contents; C:N was affected by BD, total porosity, field capacity, and the TN content; C:P was affected by the SOC, TP, and nitrate N contents; and N:P was affected by the TN and nitrate N contents.

4. Discussions

4.1. Effects of Mixed Afforestation on the SOC, TN, and TP Storages

SOC, TN, and TP storages are important soil quality evaluation indicators in the process of vegetation restoration and reconstruction in forest ecosystems. Mixed afforestation restoration modes are increasingly being built and were acknowledged as contributing to the improvement of soil nutrient conditions, especially in ecologically fragile regions [21]. Our research found that the mixing species to provide N-fixing significantly changed the SOC content and storage in surface soil (Figure 2 and Figure 3). However, due to the differences in tree species properties, the responses of the selected tree species to mixing were different. Compared with the pure forest, HrPt significantly increased the SOC content and storage of the 0–10 cm soil layer. In contrast, HrRp significantly increased the SOC content of the 0–20 cm soil layers, while in the same soil layer, no significant difference for the SOC storage was observed (Figure 2 and Figure 3). This might have been related to the transfer of C to the soil through the roots of ground vegetation and the decomposition of soil organic matter [22]. The decomposition rate of conifer litter is lower than that of the deciduous tree litter. Therefore, there is more accumulation of conifer litter and the SOC is also greater [23]. Previous studies showed that the mixing of N-fixing and non-N-fixing tree species contributed to accelerating the decomposition rate of litter in non-N-fixing tree species [24], indicating that more organic matter was returned to the soil per unit mass from coniferous tree species. In addition, the amount of litter may also be an important reason for the sensitive response differences to mixed afforestation among tree species. The amount of litter in HrRp was significantly higher than that of HrPt in the Loess Plateau region [25]. Therefore, we speculated that although the mixed N-fixer was beneficial regarding an increase in the return of organic matter in HrPt, no significant increase in SOC storage of the 0–100 cm soil layer in HrPt was found, and its storage was significantly lower than that of HrRp (Table 5).
Similarly, the mixing with N-fixing tree species significantly affected the soil TN content and storage, but there was no significant difference in TP storage between these two pure forests and their mixed forests (Figure 2 and Figure 3). This was mainly due to the differences in the source of N and P in the soil. N-fixing trees could directly fix N from the atmosphere to support their own growth, giving them more of an advantage over non-N-fixing tree species, especially in ecosystems with limited N [15]. The non-N-fixers may benefit from lowered competition for the available soil N through root exudates or the establishment of interconnected mycorrhizal networks between the N-fixing tree species [26,27]. As a result, the introduction of N-fixers in mixed woody plants may have had an important impact on the N dynamics of these two plantations (Table 5). In contrast, the source of P was relatively singular, which was mainly affected by the soil parent material. However, the mixing of N-fixing and N-fixing tree species is beneficial to the release of P in soil [17]. In addition, due to the increase in the amount of litter after mixing, the available P produced by the decomposition of litter was quickly absorbed by the plants [28]. As the soil parent material and environment condition were similar for all plantations, the variability and mobility of soil TP were not as obvious as those of SOC and TN, and mixed afforestation had little effect on soil TP.

4.2. Effect of Mixed Afforestation on Stoichiometric Ratios

Since the stoichiometric rates can be used as the indexes of soil nutrient status [6], clarifying its differential response to mixed afforestation is essential for revealing ecosystem functions. In this study, the mixed species of N-fixing significantly changed the stoichiometric ratios of the 0–10 cm soil layer (Figure 4), which may have been due to the susceptibility of topsoil layer environmental factors and litter decomposition [29]. Generally, soil C:N is not only a sensitive index of the C and N storage but also the quality of the soil in the forest ecosystem [30,31]. In our experiment, the average C:N ratio was 20.79 in the selected plantations, which was higher than the global average C:N of 14.3 [32]. In addition, there was no significant difference in C:N between Pt and HrPt, but HrRp significantly reduced the soil C:N ratio, which indicated that HrRp was helpful for accelerating the mineralization rate of organic matter. This could be due to the mixing of N-fixing and N-fixing tree species, which can provide a sufficient N source for soil microorganisms [33]. Soil C:P represents the ability of soil P mineralization, and a lower ratio indicates that it was more favorable for microorganisms to decompose litter, thereby increasing the available P content in the soil [34]. In this study, the average ratios of C:P for these four plantations were lower than China’s average of 61.0 [34]. Additionally, HrPt significantly increased the value of soil C:P, but HrRp reduced the soil C:P, which indicated that HrRp was helpful for alleviating the limitation of P on plant growth to some extent. This may have been because the roots of N-fixing tree species were beneficial in terms of secreting organic acids and other substances, activating the insoluble P in soil, and promoting the accumulation of the soil TP content [35]. The N:P ratio in soil reflects the saturation state of N and is used to judge the threshold of soil nutrient limitation [30,36]. In this research, the averages of soil N:P in the examined plantations were lower than that of the global and Chinese average (9.3 and 13.1, respectively) [32]. Insufficient or lower contents of N and P lead to an increase in the ratios of C:N and C:P, while their excessive content might lead to insufficient C content [37]. Furthermore, N:P in HrPt and HrRp were significantly higher than that of Pt and Rp, which may have been because of the relatively higher soil TN content in mixed plantations.

4.3. Influencing Factors of the Storage of SOC, TN, and TP, and the Stoichiometric Ratios

The soil’s physical and chemical properties significantly affected the SOC, TN, and TP storages in the pure and mixed forests (Table 7). The SOC and TN storages were significantly positively correlated with the nitrate N but negatively correlated with BD. This was consistent with the research results of [38,39]. In addition, both soil C:P and N:P were negatively correlated with SWC. This may have been because the higher SWC could affect soil organic matter decomposition via its negative impact on the biological activity of microorganisms [40]. It is generally believed that the lack of P in the soil in semi-arid regions, which seriously affects the growth of plants and the development of forest ecosystems [41]. There is no unified conclusion on the phenomenon that soil TP decreased synchronously with SOC and TN after afforestation [41]. In the present study, the SOC and TN storages were significantly positively correlated with the SOC and TN contents, while the TP storage was significantly positively correlated with the TP content. This may have been due to the variations of SOC and TN, which were affected by the litter decomposition and biological N-fixation, but TP was mainly affected by the soil parent materials. The soil C:N ratio was positively correlated with the total porosity, and the soil C:P and N:P ratios were significantly positively correlated with the SOC, TN, and nitrate N contents. Furthermore, compared with the pure forests, soil physical and chemical properties had a stronger control effect on the soil nutrient storages and stoichiometric ratios in the mixed forests (Table 8). Mixed afforestation can significantly change the environmental conditions, such as light and water in the forest, and changes the microbial activity, which may ultimately lead to differences in the stoichiometric characteristics of the forest soil [42,43].

5. Conclusions

Artificial afforestation is an important measure for achieving vegetation construction in the Loess Plateau of China. This paper discussed the effects of mixed afforestation on soil storage and stoichiometry in two dominant tree species in this region. The results revealed that HrRp and HrPt significantly increased the SOC content in the 0–20 cm and 0–10 cm soil layers, respectively. Meanwhile, HrRp and HrPt significantly increased the TN content in 0–10 cm. The TP contents in the 0–10, 10–20, 20–50, and 50–100 cm layers of HrRp were significantly higher than that of Rp, but there were no significant differences between Pt and HrPt. Compared with Rp, the SOC and TN storages in the 0–100 cm layer of HrRp significantly increased and the TP storage was higher than that of Rp; in contrast, no significant differences between Pt and HrPt were observed. In the 0–10 cm layer, HrRp significantly reduced C:N and increased N:P, while HrPt significantly increased C:P. There were no significant differences in the stoichiometric ratios between pure and mixed forests in other soil layers. Compared with the pure forest, soil physical and chemical properties had stronger control effects on the soil nutrient storages and stoichiometric ratios in the mixed forests. This study provides a theoretical basis for the scientific and sustainable management of regional artificial mixed-species restoration plantings. However, due to the complexity and variability of the internal ecological environment of mixed forest ecosystems, sampling data only during the period of vigorous growth may have limited our understanding of the nutrient mechanisms. Therefore, in further study, the frequency of the inter-annual or intra-annual observations, combined with isotope technology, should be improved to explore the influence mechanism of the introduction of nitrogen-fixing tree species on soil reserves and stoichiometric characteristics.

Supplementary Materials

The following are available online at https://www.mdpi.com/article/10.3390/f12121718/s1, Figure S1: Normal P-P plots of the standardized regression residuals.

Author Contributions

Y.C., Y.N. and Y.T. conceived and designed the experiments; M.X. and J.J. performed the experiments; X.W. analyzed the data and wrote the paper. All authors have read and agreed to the published version of the manuscript.

Funding

The research was funded by the Scientific and Technological Innovation Programs of Higher Education Institutions in Shanxi (2020L0141 and 2020L0146), Scientific and Technological Innovation Foundation of Shanxi Agricultural University (Ph.D. Research Startup) (2020BQ38 and 2020BQ44), and the Award for Excellent Doctoral Work in Shanxi (SXYBKY2019029 and SXYBKY2020007).

Institutional Review Board Statement

Not applicable.

Informed Consent Statement

Not applicable.

Data Availability Statement

Not applicable.

Acknowledgments

Many thanks to Chen Chen and Chang Jia for their technical assistance in the laboratory work.

Conflicts of Interest

All the authors declare no conflict of interest.

References

  1. Reed, S.C.; Yang, X.; Thornton, P.E. Incorporating phosphorus cycling into global modeling efforts: A worthwhile, tractable endeavor. New Phytol. 2015, 208, 324–329. [Google Scholar] [CrossRef]
  2. Wang, Q.; Song, J.; Cao, L.; Li, X.; Yuan, H.; Li, N. Distribution and storage of soil organic carbon in a coastal wetland under the pressure of human activities. J. Soils Sediments 2017, 17, 11–22. [Google Scholar] [CrossRef]
  3. Sardans, J.; Peñuelas, J. The Role of Plants in the Effects of Global Change on Nutrient Availability and Stoichiometry in the Plant-Soil System. Plant Physiol. 2012, 160, 1741–1761. [Google Scholar] [CrossRef] [Green Version]
  4. Nejidat, A.; Potrafka, R.M.; Zaady, E. Successional biocrust stages on dead shrub soil mounds after severe drought: Effect of micro-geomorphology on microbial community structure and ecosystem recovery. Soil Biol. Biochem. 2016, 103, 213–220. [Google Scholar] [CrossRef]
  5. Lang, A.C.; von Oheimb, G.; Scherer-Lorenzen, M.; Yang, B.; Trogisch, S.; Bruelheide, H.; Ma, K.; Härdtle, W. Mixed afforestation of young subtropical trees promotes nitrogen acquisition and retention. J. Appl. Ecol. 2014, 51, 224–233. [Google Scholar] [CrossRef]
  6. Bing, H.; Wu, Y.; Zhou, J.; Sun, H.; Luo, J.; Wang, J.; Yu, D. Stoichiometric variation of carbon, nitrogen, and phosphorus in soils and its implication for nutrient limitation in alpine ecosystem of Eastern Tibetan Plateau. J. Soils Sediments 2016, 16, 405–416. [Google Scholar] [CrossRef]
  7. Smal, H.; Ligęza, S.; Pranagal, J.; Urban, D.; Pietruczyk-Popławska, D. Changes in the stocks of soil organic carbon, total nitrogen and phosphorus following afforestation of post-arable soils: A chronosequence study. For. Ecol. Manag. 2019, 451, 117536. [Google Scholar] [CrossRef]
  8. Deng, L.; Shangguan, Z. Afforestation Drives Soil Carbon and Nitrogen Changes in China. Land Degrad. Dev. 2016, 28, 151–165. [Google Scholar] [CrossRef] [Green Version]
  9. Hoogmoed, M. Soil Carbon and Nitrogen Cycling Following Afforestation with Mixed-Species Tree Plantings. Ph.D. Thesis, Monash University, Melbourne, Australia, 2014. [Google Scholar]
  10. Forrester, D.I.; Bauhus, J.; Cowie, A. On the success and failure of mixed-species tree plantations: Lessons learned from a model system of Eucalyptus globulus and Acacia mearnsii. For. Ecol. Manag. 2005, 209, 147–155. [Google Scholar] [CrossRef]
  11. Cui, Q.F.; Cheng, Q.; Yang, X.T. Soil ecological stoichiometry characteristics of the Platycladus orientalis forest in the South Taihang Mountain. J. West China For. Sci. 2020, 49, 20–30. (In Chinese) [Google Scholar]
  12. Huang, Y.L.; Tian, Q.; Qin, G.H. Effects of a mixed plantation of Robinia pseudoacacia and Fraxinus velutina on soil bacterial structure and diversity in the Yellow River Delta. Acta Ecol. Sin. 2018, 38, 3859–3867. (In Chinese) [Google Scholar]
  13. Ding, X.J.; Xie, G.L.; Jing, R.Y. Decomposition characteristics of litters in different mixed forest of Robinia pseudoacacia in Yellow River Delta. J. Soil Water Conserv. 2016, 30, 249–253. [Google Scholar]
  14. Wang, T.; Xue, X.; Zhou, L.; Guo, J. Combating Aeolian Desertification in Northern China. Land Degrad. Dev. 2015, 26, 118–132. [Google Scholar] [CrossRef]
  15. Galiana, A.; Gnahoua, G.M.; Chaumont, J. Improvement of nitrogen fixation in Acacia mangium through inoculation with rhizobium. Agrofor. Syst. 1998, 40, 297–307. [Google Scholar] [CrossRef]
  16. Hoogmoed, M.; Cunningham, S.C.; Baker, P.J. Is there more soil carbon under nitrogen-fixing trees than under non-nitrogen-fixing trees in mixed-species restoration plantings? Agric. Ecosyst. Environ. 2014, 188, 80–84. [Google Scholar] [CrossRef]
  17. Li, X.; Sun, K.; Li, F.Y. Variation in leaf nitrogen and phosphorus stoichiometry in the nitrogen-fixing Chinese sea-buckthorn (Hippophae rhamnoides L. subsp. sinensis Rousi) across northern China. Ecol. Res. 2014, 29, 723–731. [Google Scholar] [CrossRef]
  18. Kasel, S.; Singh, S.; Sanders, G.J.; Bennett, L.T. Species-specific effects of native trees on soil organic carbon in biodiverse plantings across north-central Victoria, Australia. Geoderma 2011, 161, 95–106. [Google Scholar] [CrossRef]
  19. Xu, H.; Qu, Q.; Li, P.; Guo, Z.; Wulan, E.; Xue, S. Stocks and Stoichiometry of Soil Organic Carbon, Total Nitrogen, and Total Phosphorus after Vegetation Restoration in the Loess Hilly Region, China. Forests 2019, 10, 27. [Google Scholar] [CrossRef] [Green Version]
  20. Xie, Z.; Zhu, J.; Liu, G.; Cadisch, G.; Hasegawa, T.; Chen, C.; Sun, H.; Tang, H.; Zeng, Q. Soil organic carbon stocks in China and changes from 1980s to 2000s. Glob. Chang. Biol. 2007, 13, 1989–2007. [Google Scholar] [CrossRef]
  21. Deng, L.; Liu, G.B.; Shangguan, Z.P. Land use conversion and changing soil carbon stocks in China’s ‘Grain-for-Green’ Program: A synthesis. Glob. Chang. Biol. 2014, 20, 3544–3556. [Google Scholar] [CrossRef]
  22. Pérez-Cruzado, C.; Mansilla-Salinero, P.; Rodríguez-Soalleiro, R.; Merino, A. Influence of tree species on carbon sequestration in afforested pastures in a humid temperate region. Plant Soil 2012, 353, 333–353. [Google Scholar] [CrossRef]
  23. Silver, W.L.; Kueppers, L.M.; Lugo, A.E.; Ostertag, R.; Matzek, V. Carbon sequestration and plant community dynamics following reforestation of tropical pasture. Ecol. Appl. 2004, 14, 1115–1127. [Google Scholar] [CrossRef]
  24. Fyles, J.; Fyles, I. Interaction of Douglas-fir with red alder and salal foliage litter during decomposition. Can. J. For. Res. 1993, 23, 358–361. [Google Scholar] [CrossRef]
  25. Zhu, Q.K.; Zhao, Y.M.; Wang, L.L.; Ma, H.; Liu, L.L. Influence of stand mixed pattern on growth of Hippophae rhamniodes L. subsp. sinensis in semi-arid region of Loess Plateau in North Shaanxi, China. J. Northeast For. Univ. 2013, 41, 1–4. (In Chinese) [Google Scholar]
  26. He, X.-H.; Critchley, C.; Bledsoe, C. Nitrogen Transfer Within and Between Plants Through Common Mycorrhizal Networks (CMNs). Crit. Rev. Plant Sci. 2003, 22, 531–567. [Google Scholar] [CrossRef]
  27. Forrester, D.I.; Bauhus, J.; Cowie, A.; Vanclay, J. Mixed-species plantations of Eucalyptus with nitrogen-fixing trees: A review. For. Ecol. Manag. 2006, 233, 211–230. [Google Scholar] [CrossRef] [Green Version]
  28. Fang, X.-M.; Zhang, X.-L.; Zong, Y.-Y.; Zhang, Y.; Wan, S.-Z.; Bu, W.-S.; Chen, F.-S. Soil phosphorus functional fractions and tree tissue nutrient concentrations influenced by stand density in subtropical Chinese fir plantation forests. PLoS ONE 2017, 12, e0186905. [Google Scholar] [CrossRef]
  29. Feng, D.; Bao, W.; Pang, X. Consistent profile pattern and spatial variation of soil C/N/P stoichiometric ratios in the subalpine forests. J. Soils Sediments 2017, 17, 2054–2065. [Google Scholar] [CrossRef]
  30. Tessier, J.T.; Raynal, D.J. Vernal nitrogen and phosphorus retention by forest understory vegetation and soil microbes. Plant Soil 2003, 256, 443–453. [Google Scholar] [CrossRef]
  31. Dong, C.; Qiao, Y.; Cao, Y.; Chen, Y.; Wu, X.; Xue, W. Seasonal Variations in Carbon, Nitrogen and Phosphorus Stoichiometry of a Robinia pseudoacacia Plantation on the Loess Hilly Region, China. Forests 2021, 12, 214. [Google Scholar] [CrossRef]
  32. Yue, K.; Fornara, D.; Yang, W.; Peng, Y.; Li, Z.; Wu, F.; Peng, C. Effects of three global change drivers on terrestrial C:N:P stoichiometry: A global synthesis. Glob. Chang. Biol. 2017, 23, 2450–2463. [Google Scholar] [CrossRef]
  33. Chen, F.-S.; Feng, X.; Liang, C. Endogenous versus exogenous nutrient affects C, N, and P dynamics in decomposing litters in mid-subtropical forests of China. Ecol. Res. 2012, 27, 923–932. [Google Scholar] [CrossRef]
  34. Tian, H.; Chen, G.; Zhang, C.; Melillo, J.M.; Hall, C.A.S. Pattern and variation of C:N:P ratios in China’s soils: A synthesis of observational data. Biogeochemistry 2010, 98, 139–151. [Google Scholar] [CrossRef]
  35. Li, M.; Zhou, X.; Zhang, Q.; Cheng, X. Consequences of afforestation for soil nitrogen dynamics in central China. Agric. Ecosyst. Environ. 2014, 183, 40–46. [Google Scholar] [CrossRef]
  36. De Feudis, M.; Cardelli, V.; Massaccesi, L.; Lagomarsino, A.; Fornasier, F.; Westphalen, D.J.; Cocco, S.; Corti, G.; Agnelli, A. Influence of Altitude on Biochemical Properties of European Beech (Fagus sylvatica L.) Forest Soils. Forests 2017, 8, 213. [Google Scholar] [CrossRef] [Green Version]
  37. Güsewell, S.; Jewell, P.L.; Edwards, P.J. Effects of heterogeneous habitat use by cattle on nutrient availability and litter decomposition in soils of an Alpine pasture. Plant Soil 2005, 268, 135–149. [Google Scholar] [CrossRef]
  38. Liao, C.; Luo, Y.; Fang, C.; Chen, J.; Li, B. The effects of plantation practice on soil properties based on the comparison between natural and planted forests: A meta-analysis. Glob. Ecol. Biogeogr. 2011, 21, 318–327. [Google Scholar] [CrossRef]
  39. Pizzeghello, D.; Francioso, O.; Concheri, G.; Muscolo, A.; Nardi, S. Land Use Affects the Soil C Sequestration in Alpine Environment, NE Italy. Forests 2017, 8, 197. [Google Scholar] [CrossRef] [Green Version]
  40. Rachid, C.; Balieiro, F.; Peixoto, R.; Pinheiro, Y.; Piccolo, M.D.C.; Chaer, G.; Rosado, A. Mixed plantations can promote microbial integration and soil nitrate increases with changes in the N cycling genes. Soil Biol. Biochem. 2013, 66, 146–153. [Google Scholar] [CrossRef]
  41. Chen, C.R.; Condron, L.M.; Davis, M.R.; Sherlock, R.R. Effects of afforestation on phosphorus dynamics and biological properties in a New Zealand grassland soil. Plant Soil 2000, 220, 151–163. [Google Scholar] [CrossRef]
  42. Hoogmoed, M.; Cunningham, S.C.; Thomson, J.R.; Baker, P.J.; Beringer, J.; Cavagnaro, T.R. Does afforestation of pastures increase sequestration of soil carbon in Mediterranean climates? Agric. Ecosyst. Environ. 2012, 159, 176–183. [Google Scholar] [CrossRef]
  43. Song, B.-L.; Yan, M.-J.; Hou, H.; Guan, J.-H.; Shi, W.-Y.; Li, G.-Q.; Du, S. Distribution of soil carbon and nitrogen in two typical forests in the semiarid region of the Loess Plateau, China. Catena 2016, 143, 159–166. [Google Scholar] [CrossRef]
Figure 1. Four typical restoration types: (a) the pure forest of Pinus tabuliformis (Pt), (b) the mixed forest of P. tabuliformis and Hippophae rhamnoides (HrPt), (c) the pure forest of Robinia pseudoacacia (Rp), and (d) the mixed forest of R. pseudoacacia and H. rhamnoides (HrRp).
Forests 12 01718 g001
Figure 2. Soil organic carbon, total nitrogen, and total phosphorus contents in the 0–100 cm layers of the pure and mixed forests. Different lowercase letters indicate that there are significant differences between pure and mixed forests in the same soil layer at 0.05 levels.
Forests 12 01718 g002
Figure 3. The storage of soil organic, total nitrogen and total phosphorus in the 0–100 cm layers of the pure and mixed forests. Different lowercase letters indicate that there are significant differences between pure and mixed forests in the same soil layer at 0.05 levels.
Forests 12 01718 g003
Figure 4. Soil carbon, nitrogen, and phosphorus stoichiometric ratios in the soil profile of pure and mixed forests. Different lowercase letters indicate that there are significant differences between pure and mixed forests in the same soil layer at 0.05 levels.
Forests 12 01718 g004
Table 1. The general information of the study plots.
Sample PlotTree SpeciesAltitude
(m)
Stand Age (a)Tree Height
(m)
DBH/DGH
(cm)
Crown Diameter of
(EW × SN) (m × m)
PtP. tabuliformis1189173.69 ± 0.097.43 ± 0.27(2.96 ± 0.12) × (3.36 ± 0.11)
RpR. pseudoacacia1287177.59 ± 0.659.40 ± 1.50(4.36 ± 0.39) × (4.24 ± 0.32)
HrPtP. tabuliformis1270174.01 ± 0.177.11 ± 0.48(2.01 ± 0.09) × (2.04 ± 0.11)
H. rhamnoides3.08 ± 0.145.43 ± 0.33(2.62 ± 0.12) × (2.60 ± 0.14)
HrRpR. pseudoacacia1302175.92 ± 0.527.80 ± 1.02(1.79 ± 0.10) × (1.80 ± 0.09)
H. rhamnoides2.69 ± 0.104.63 ± 0.32(3.36 ± 0.35) × (3.25 ± 0.34)
Note: Pt and Rp represent the pure plantations of P. tabuliformis and R. pseudoacacia, respectively. HrPt and HrRp represent the mixed plantations of P. tabuliformis with H. rhamnoides and R. pseudoacacia with H. rhamnoides, respectively. DBH and DGH represent the diameters at the breast and ground heights, respectively. The abbreviations mean the same below.
Table 2. Physicochemical properties in the soil profile under pure and mixed forests.
Soil Depth (cm)Sample PlotSWC
(m3 m−3)
Field Capacity (%)BD
(g cm−3)
Soil Total Porosity (%)Nitrate N
(g kg−1)
Ammonium N
(g kg−1)
Available P
(g kg−1)
0–10Pt0.14 ± 0.00217.94 ± 0.241.23 ± 0.0151.49 ± 0.590.21 ± 0.01 b1.86 ± 0.110.31 ± 0.02 b
HrPt0.13 ± 0.00417.14 ± 0.201.22 ± 0.0351.86 ± 0.600.39 ± 0.02 a1.49 ± 0.090.41 ± 0.02 a
Rp0.11 ± 0.00113.72 ± 0.16 b1.35 ± 0.0246.94 ± 0.54 b0.86 ± 0.051.13 ± 0.06 b0.31 ± 0.02 b
HrRp0.11 ± 0.00315.47 ± 0.18 a1.29 ± 0.0150.49 ± 0.58 a0.85 ± 0.051.93 ± 0.11 a0.50 ± 0.02 a
10–20Pt0.12 ± 0.00215.51 ± 0.31 b1.34 ± 0.02 a47.11 ± 0.82 b0.26 ± 0.041.86 ± 0.320.36 ± 0.06
HrPt0.13 ± 0.00518.21 ± 0.32 a1.17 ± 0.03 b51.77 ± 0.90 a0.33 ± 0.061.41 ± 0.240.37 ± 0.06
Rp0.09 ± 0.00215.72 ± 0.27 b1.25 ± 0.02 a50.99 ± 0.88 b0.56 ± 0.101.14 ± 0.200.19 ± 0.03 b
HrRp0.12 ± 0.00519.01 ± 0.33 a1.11 ± 0.03 b55.41 ± 0.96 a0.46 ± 0.081.42 ± 0.250.37 ± 0.06 a
20–50Pt0.13 ± 0.00215.45 ± 0.221.35 ± 0.0247.66 ± 0.690.15 ± 0.021.73 ± 0.200.30 ± 0.04
HrPt0.11 ± 0.00416.56 ± 0.241.28 ± 0.0350.27 ± 0.730.15 ± 0.021.27 ± 0.150.37 ± 0.04
Rp0.09 ± 0.00114.39 ± 0.211.35 ± 0.0247.38 ± 0.680.45 ± 0.051.34 ± 0.160.18 ± 0.02 b
HrRp0.11 ± 0.00615.93 ± 0.231.31 ± 0.0347.83 ± 0.730.37 ± 0.041.32 ± 0.150.33 ± 0.04 a
50–100Pt0.11 ± 0.00315.51 ± 0.311.37 ± 0.0348.38 ± 0.980.12 ± 0.031.72 ± 0.400.35 ± 0.08
HrPt0.08 ± 0.00516.08 ± 0.371.29 ± 0.0450.91 ± 1.070.17 ± 0.041.36 ± 0.320.36 ± 0.08
Rp0.10 ± 0.00216.06 ± 0.321.39 ± 0.0345.39 ± 0.920.33 ± 0.071.16 ± 0.230.21 ± 0.05
HrRp0.08 ± 0.00916.29 ± 0.291.38 ± 0.0446.79 ± 1.010.27 ± 0.061.28 ± 0.330.29 ± 0.07
Note: Different lowercase letters indicate that there are significant differences between pure and mixed forests in the same soil layer at 0.05 levels. These lowercase letters mean the same below.
Table 3. Variance analysis of the mixed effect and tree species type on the SOC, TN, and TP concentrations in the soil profile.
Soil Depth
(cm)
SOC (g kg−1)TN (g kg−1)TP (g kg−1)
METSME × TSMETSME × TSMETSME × TS
0–105.13 *19.52 ***3.2257.60 ***40.19 ***13.84 ***35.74 ***1.4127.67 ***
10–200.562.828.75 **0.291.983.509.12 **0.7527.68 ***
20–500.673.422.641.403.043.7313.38 ***3.8923.34 ***
50–1000.992.753.802.171.993.125.10 *1.453.61
Note: ME represents the mixing effect, TS represents the tree species, and ME × TS represents the interaction between the mixing effect and tree species, respectively. * Indicates the significance level of p < 0.05, ** indicates the significance level of p < 0.01, and *** indicates the significance level of p < 0.001. The abbreviations and significance levels mean the same below.
Table 4. Variance analysis of the mixing effect and tree species type on the storages of SOC, TN, and TP at varying depths in the soil profile.
Soil Depth
(cm)
SOC Storage (t hm−2)TN Storage (t hm−2)TP Storage (t hm−2)
METSME × TSMETSME × TSMETSME × TS
0–1014.62 **30.41 **2.2845.26 ***50.27 ***7.06 *4.542.370.51
10–202.060.4412.70 **3.352.040.882.042.042.83
20–502.924.594.821.911.202.920.180.263.16
50–10013.95 **37.10 ***6.53 *23.73 **56.27 ***21.75 **0.020.180.96
Note: * Indicates the significance level of p < 0.05, ** indicates the significance level of p < 0.01, and *** indicates the significance level of p < 0.001.
Table 5. SOC, TN, and TP storages of the 0–100 cm layers in pure and mixed forests.
Sample PlotSOC Storage (t hm−2)TN Storage (t hm−2)TP Storage (t hm−2)
Pt86.46 ± 5.003.92 ± 0.236.87 ± 0.40
HrPt85.19 ± 4.923.88 ± 0.226.50 ± 0.38
Rp104.47 ± 6.03 b5.39 ± 0.31 b6.83 ± 0.37
HrRp108.34 ± 6.26 a5.86 ± 0.34 a7.01 ± 0.41
ME0.050.590.12
TS13.60 **37.84 ***0.00
ME×TS6.21 *0.831.69
Note: Different lowercase letters indicate that there are significant differences between pure and mixed forests in the same soil layer at 0.05 levels. * Indicates the significance level of p < 0.05, ** indicates the significance level of p < 0.01, and *** indicates the significance level of p < 0.001.
Table 6. Variance analysis of the mixing effect and tree species type on the stoichiometric ratios in the soil profile.
Soil Depth
(cm)
C:NC:PN:P
METSME × TSMETSME × TSMETSME × TS
0–108.76 **0.2716.59 ***3.2718.64 ***6.68 *28.43 ***35.95 ***3.45
10–200.201.862.110.001.882.162.961.030.74
20–500.091.530.012.362.840.141.912.060.01
50–1000.070.010.312.301.113.893.353.623.85
Note: * Indicates the significance level of p < 0.05, ** indicates the significance level of p < 0.01, and *** indicates the significance level of p < 0.001.
Table 7. Correlation between the different soil physicochemical properties; SOC, TN, and TP storages; and stoichiometric ratios in the study area.
Forest TypeSoil PropertyBDSWCTotal PorosityField CapacitySOCTNTPNitrate NAmmonium NAvailable P
Pure forestCs−0.937 ** 0.999 **0.939 ** 0.816 *
Ns−0.831 *−0.804 * 0.981 **0.993 ** 0.928 **−0.757 *−0.746 *
Ps 0.887 **0.846 * 0.867 *
C:N−0.791 * 0.979 **
C:P −0.850 * 0.963 **0.999 ** 0.955 **−0.807 *−0.796 *
N:P −0.915 ** 0.917 **0.995 ** 0.987 **−0.882 *−0.873 *
Mixed forestCs−0.820 * 0.970 **0.919 **0.946 **0.904 **0.979 **
Ns 0.999 **0.981 **0.854 *0.974 **0.913 **
Ps−0.995 ** 0.979 ** 0.945 **0.873 *
C:N −0.871 *0.822 *0.997 ** −0.804 * −0.825 *
C:P−0.761 * 0.990 **0.954 **−0.908 **0.943 **0.954 **
N:P −0.731 *0.992 **0.999 **−0.767 *0.997 **0.842 *
Note: Cs, Ns, and Ps represent the SOC, TN, and TP storages, respectively. * Indicates the significance level of p < 0.05, ** indicates the significance level of p < 0.01.
Table 8. Stepwise regression analysis of the soil physicochemical properties; SOC, TN, and TP storages; and stoichiometric ratios in the study area.
Forest TypeSoil PropertyEquationR2
Pure forestCsCs = 22.79SOC − 85.460.996
NsNs = 11.53SWC + 22.61TN − 5.330.998
PsPs = 0.43X1 + 4.87X4 − 15.690.987
C:NC:N = 0.80X1 − 17.310.948
C:PC:P = 0.12X2 − 39.42TP − 0.880.998
N:PN:P = 2.91TN − 0.01X1 + 0.270.986
Mixed forestCsCs = 142.89BD − 165.37SWC + 9.07SOC − 145.370.989
NsNs = 4.20BD + 6.01TN + 4.08TP + 2.50X3 − 6.230.996
PsPs = 2.48BD + 24.38TP + 0.30X2 − 10.51X3 − 10.720.999
C:NC:N = 14.26BD + 0.90X1 − 21.29TN − 0.87X2 − 19.240.993
C:PC:P = 0.69SOC − 30.25TP + 12.45X3 + 1.250.999
N:PN:P = 1.08TN + 0.36X3 + 0.210.995
Note: X1, X2, X3, and X4 represent the soil total porosity, field capacity, and nitrate N and ammonium N contents, respectively.
Publisher’s Note: MDPI stays neutral with regard to jurisdictional claims in published maps and institutional affiliations.

