Article

Genetic Characterisation of Chestnut Cultivars in Crete

by
Mohamad Ali El Chami
1,2,†,
Nikolaos Tourvas
2,
George Kazakis
3,
Panagiotis Kalaitzis
1 and
Filippos A. Aravanopoulos
2,*
1
Department of Horticultural Genetics & Biotechnology, Mediterranean Agronomic Institute of Chania, P.O. Box 85, 73100 Chania, Greece
2
Faculty of Agriculture, Forest Science & Natural Environment Aristotle University of Thessaloniki, P.O. Box 238, 54006 Thessaloniki, Greece
3
Department of Geo-Information in Environmental Management, Mediterranean Agronomic Institute of Chania, P.O. Box 85, 73100 Chania, Greece
*
Author to whom correspondence should be addressed.
Present address: Laboratorio de Selvicultura, Dendrocronología y Cambio Climático, DendrodatLab-ERSAF, Departamento Ingeniería Forestal, Universidad de Córdoba, Campus de Rabanales, Ctra. N. IV, km. 396, 14071 Córdoba, Spain.
Forests 2021, 12(12), 1659; https://doi.org/10.3390/f12121659
Submission received: 30 October 2021 / Revised: 18 November 2021 / Accepted: 22 November 2021 / Published: 29 November 2021
(This article belongs to the Special Issue Current Applications of Genetics to Forestry)

Abstract

:
(1) Background and objectives: Cretan chestnut belongs to sweet chestnut (Castanea sativa Mill.) and has been historically associated with the lifestyle of rural communities with great economic importance. However, chestnut genetic resources in Crete have rarely been studied and assessed, while chestnuts are threatened by several anthropogenic factors. This study assessed the genetic variability of the Cretan sweet chestnut using 59 trees corresponding to the four best-known chestnut cultivars (Strovliani, Rogdiani, Koutsakera and Katharokastania). (2) Materials and Methods: The trees were evaluated using seven simple sequence repeat markers (SSRs): three nSSRs and four EST-SSRs. (3) Results: Genomic SSR results revealed notable genetic diversity in terms of expected heterozygosity, level of polymorphism and effective number of alleles. Moreover, in the four chestnut cultivars, twenty-two unique genotypes were identified, deeming each cultivar to be in fact a multiclonal variety. Genetic differentiation among cultivars was relatively low, though highly significant. Four different groups of synonymies were found: two homonymy groups in Katharokastania and Strovliani, six in Rogdiani and eight in Koutsakera. The cluster analysis and PCoA results reveal two main clusters, one corresponding to the Rogdiani cultivar and the other to Katharokastania, while the other two could not be assigned to a particular group. (4) Conclusions: The null hypothesis of single-clone genotype-to-cultivar correspondence was tested and could not be accepted.

1. Introduction

Originating in the Caucasus and Asia Minor, where it was first domesticated and spread throughout southern Europe, sweet (or European) chestnut, Castanea sativa Mill., is the only native species of the Castanea genus in Europe [1]. During the Middle Ages, sweet chestnut was considered the “mountain cereal”, and today it occupies three climatic sub-regions, growing from sea level up to 1800 m over a wide range of climatic conditions [2,3].
Historically, chestnut has been used as an important ingredient in many nutrient products due to its richness in various nutriments [4]. Moreover, chestnut trees have been distributed widely throughout mainly southern Europe, forming high-density forests in France and Italy, indicating the importance of this tree economically and environmentally [5]. Like many European forest species, chestnut has notable potential in reducing pollution and climate change effects [6]. The potential multi-use value of chestnut in the past is still valid today and new uses have proven to be economically important.
From a sustainable arboricultural point of view, it is crucial to combine increased productivity and competitiveness with the maintenance of biodiversity. Landraces and local varieties are saved simply because they fill ecological, cultural and local socioeconomic positions not occupied by modern varieties [2]. Thus, it is very important to assess the genetic diversity of traditional local varieties. However, assessing their diversity is very difficult, due to the absence of standard references, confusion of “variety” names (homonymy and synonymy) and the existence of multiclonal varieties as a result of the richness of chestnut genetic heritage [7,8].
Traditional chestnut varieties are characterised according to the geographical origin, morphology, ripening period and type of use [
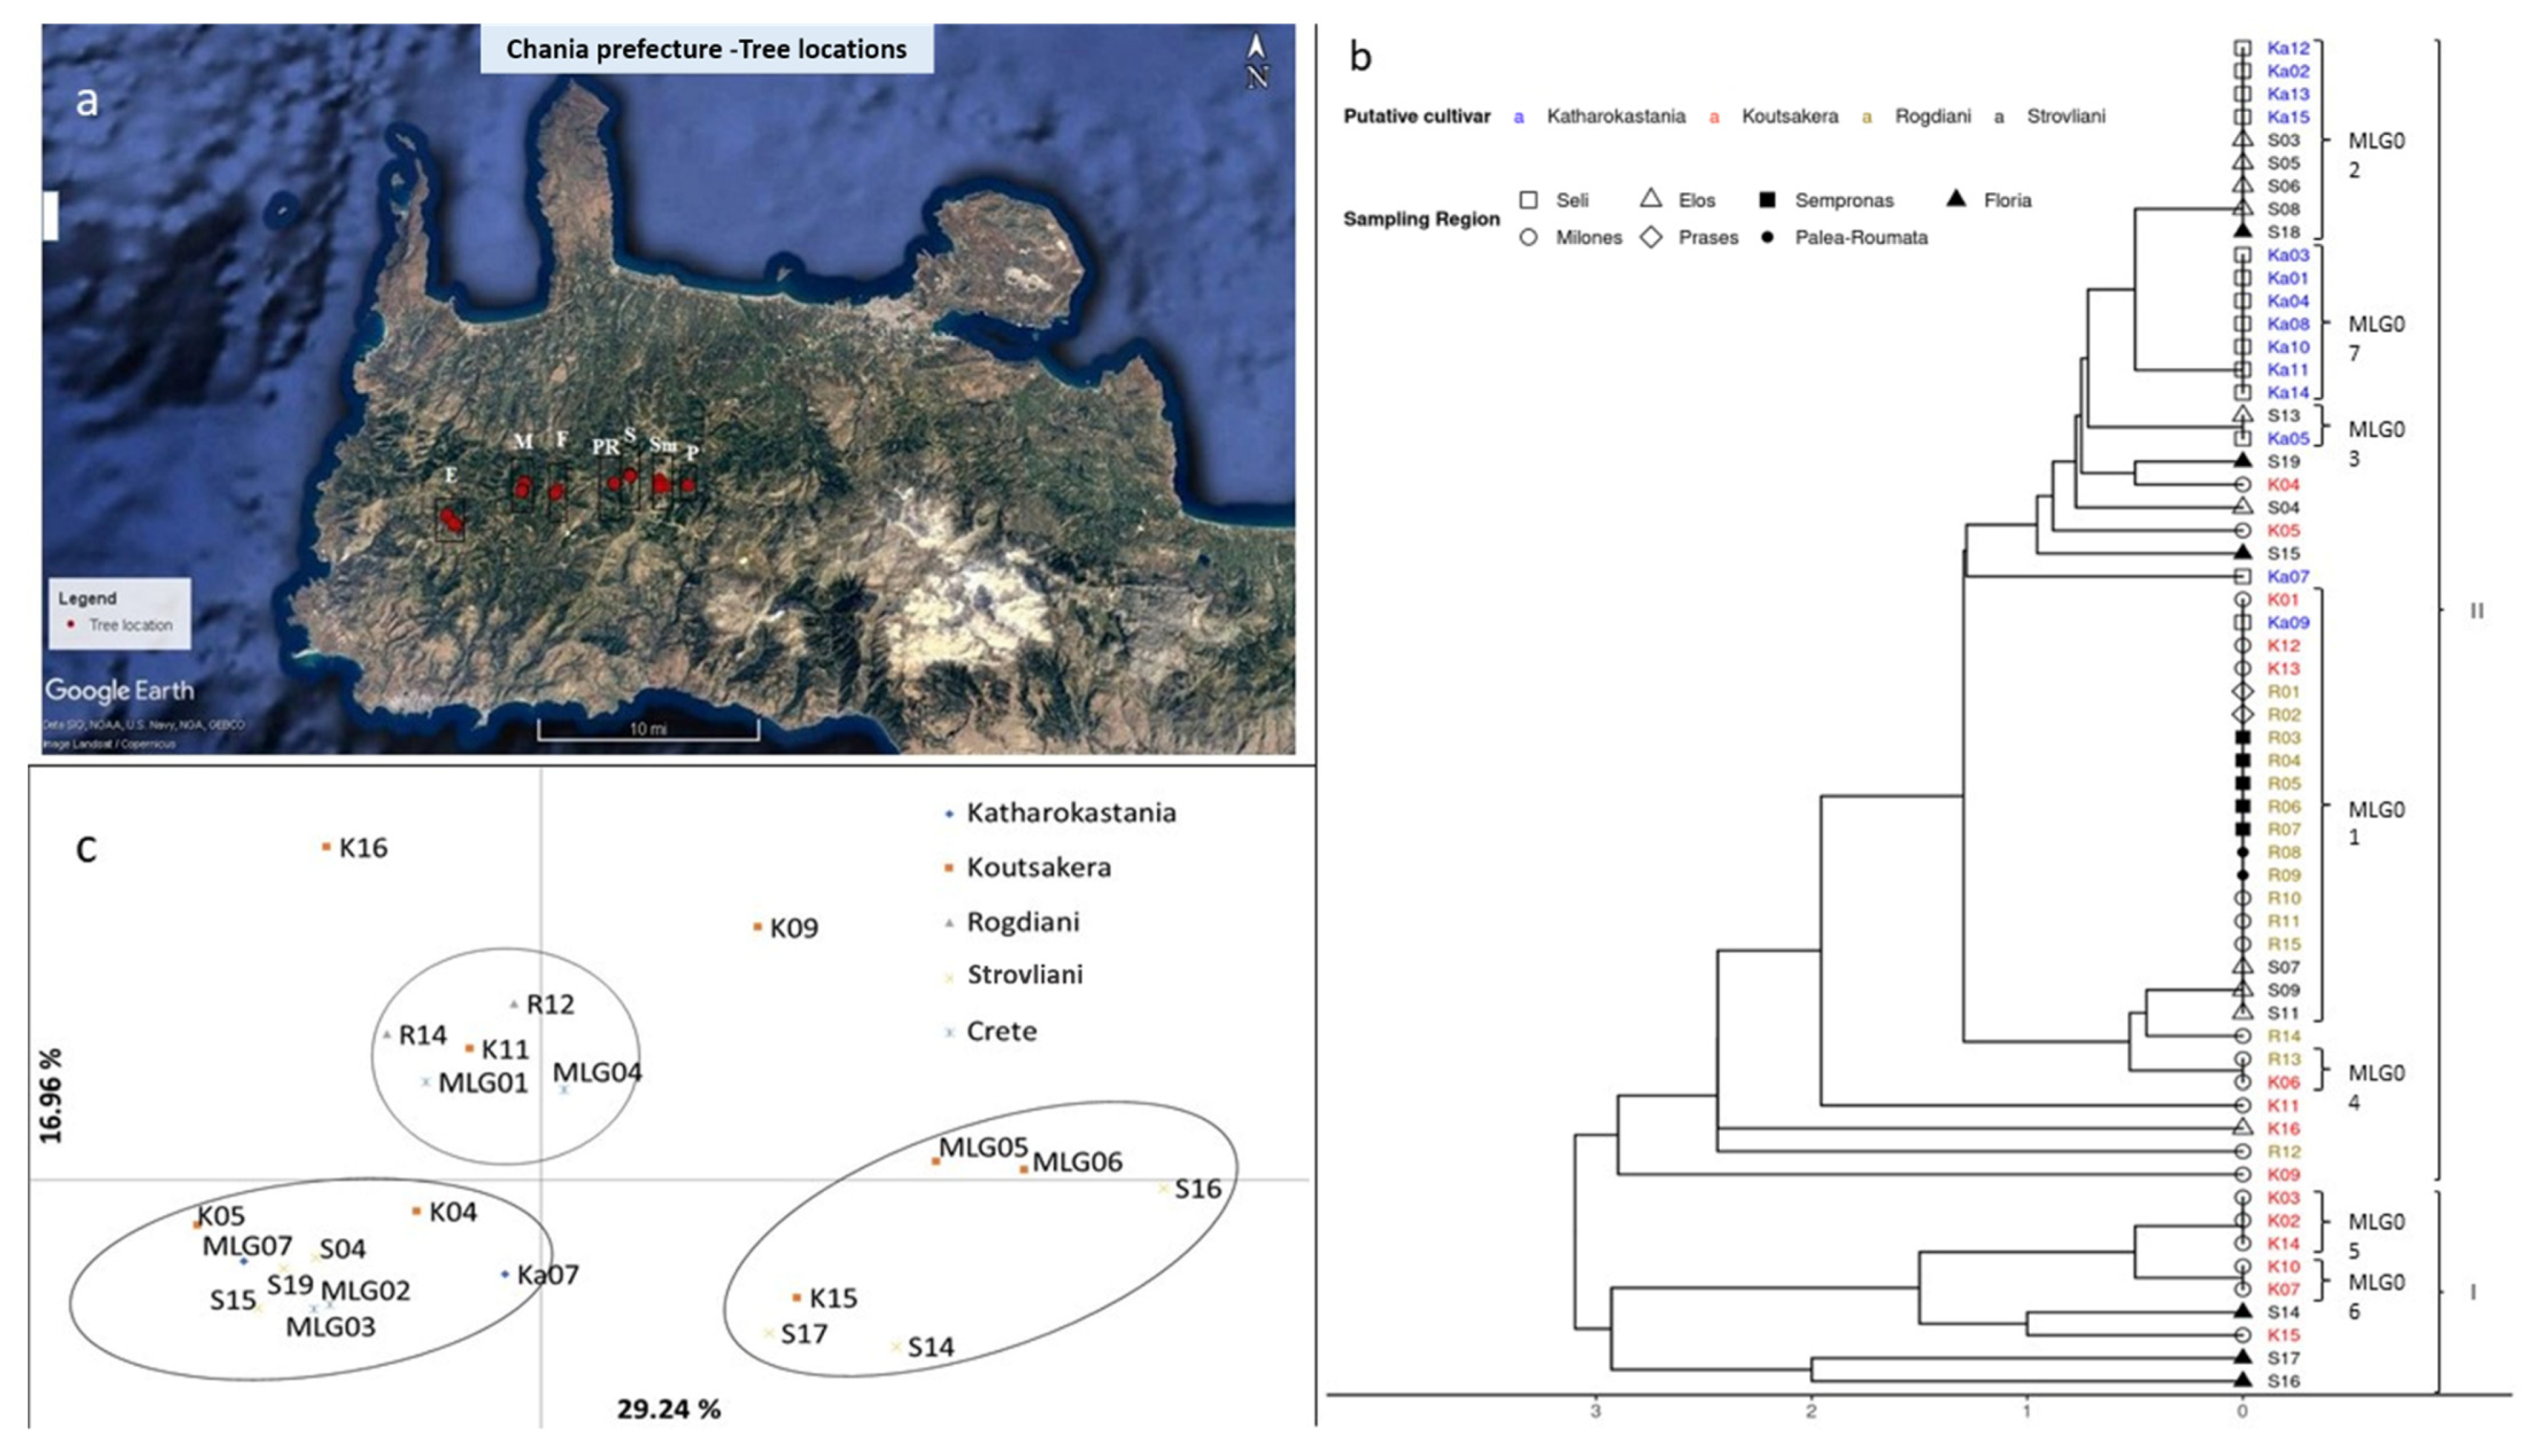
8]. In Crete, four traditional varietal names have been reported (Katharokastania, Koutsakera, Rogdiani and Strovliani); nevertheless, their classification is unclear due to the absence of pertinent studies.
This study reports the use of nSSR and EST-SSR markers for the identification of chestnut cultivars present in Crete. The null hypothesis of single-clone genotype-to-cultivar correspondence was tested. The main objective was to characterise the Cretan chestnut varieties genetically and to detect possible homonymies and synonymies.

2. Materials and Methods

2.1. Plant Material

Plant material of the four best-known and most widely spread Cretan chestnut varieties, Strovliani (S), Rogdiani (R), Koutsakera (K) and Katharokastania (Ka), was collected from the Chania region, Crete, during 2017. A total of 59 trees, each assumed to be one accession, were sampled and their GPS coordinates were registered (Table A1). The trees are located in chestnut orchards spread over seven main geographical areas: Elos (E), Milones (M), Floria (F), Palea Roumata (PR), Prases (P), Selli (S) and Sempronas (Sm) (Figure 1a). During field work, 15 to 20 leaves were collected and preserved in hermetically sealed plastic bags which were stored in an ice box and then transferred to a −80 °C fridge in the laboratory. Samples were grinded by liquid nitrogen using porcelain mortar and pestle prior to DNA extraction. Total genomic DNA was isolated according to the NucleoSpin® Plant II kit MACHEREY-NAGEL protocol. DNA quality and concentration were determined using a Thermo Scientific™ spectrophotometer Nanodrop™ 2000/2000 c.

2.2. Polymerase Chain Reaction (PCR) Amplification and Electrophoresis

Seven genomic labelled microsatellites (three SSRs and four EST-SSRs; Table 1), designed and used in previous Castanea sativa studies [9,10,11,12,13], were employed. The PCR was performed on a final volume of 23 µL containing 50 ng DNA, 0.5 U Taq DNA polymerase (Thermo Scientific™), the supplied buffer reaction with MgCl2 (15 mM), 5 µM of each primer and 10 µM of dNTPs. A Bio-Rad DNA ENGINE DYAN (Bio-Rad) was used, programmed to follow: (1) a denaturation step (at 94 °C for 2 min, followed by 94 °C for 45 s); (2) annealing (30 s at the optimal temperature tested for Castanea sativa for each primer pair and ranging from 50 °C to 56 °C); (3) extension (20 s at 72 °C); and (4) final elongation step (72 °C for 10 min). Each amplified PCR product was checked in an agarose gel (using 3 µL of the product) along with a negative control to validate the presence of the expected amplified band and eliminate contaminations, before running in a capillary electrophoresis (Figure A1). The final PCR products were separated on an ABI PRISM 3500 Genetic Analyzer (Applied Biosystems, Inc. (ABI), Carlsbad, CA, USA), together with the GeneScanTM-500 LIZ Size Standard (ABI) as internal size standard. Alleles were sized and individuals genotyped using the software STRand 2.4.59.

2.3. Data Analysis

The number of alleles (Na), the effective number of alleles (Ne), the observed (Ho) and expected (He) heterozygosity, the number of migrants (Nm), the fixation index (Fst), the Shannon index (I), F-statistics and probability of identity (PI) were processed using GeneAlEx 6.503 [14]. The probability of identity was calculated following [15]. An analysis of molecular variance [16] was also performed using the same software [17]. To examine whether the resulting structure was correlated with geographical distribution, the matrices of the pairwise codom–genotypic genetic distances between all samples and the respective geographical distances were compared using a Mantel test [18,19]. Allelic richness was calculated using HP-Rare [20].
UPGMA cluster analysis was performed in R 4.1.0, based on relative dissimilarity distance matrix and visualised using the ggtree R package [21]. For the identification of unique genotypes, a multilocus genotype analysis (MLG) for the 59 chestnut trees was performed in R 4.1.0 software (R Core Team, Vienna, Austria) [22] using the poppr 2.9.2 package [23]. As a result, a number of unique genotypes were found and therefore a principal coordinates analysis (PCoA) was performed in GenAlEx.

3. Results

As a result of the multilocus genotype analysis, 22 unique genotypes were identified in the 4 chestnut Cretan cultivars (Table 2). For the 59 chestnut orchard trees studied, 4 different groups of synonymies (genetically identical cultivars with different names), namely, MLG01 to MLG04, were identified. Regarding homonymies (genetically different cultivars with the same name), two homonymy groups were found in both Katharokastania and Strovliani, six in Rogdiani and eight in Koutsakera (Table 2).
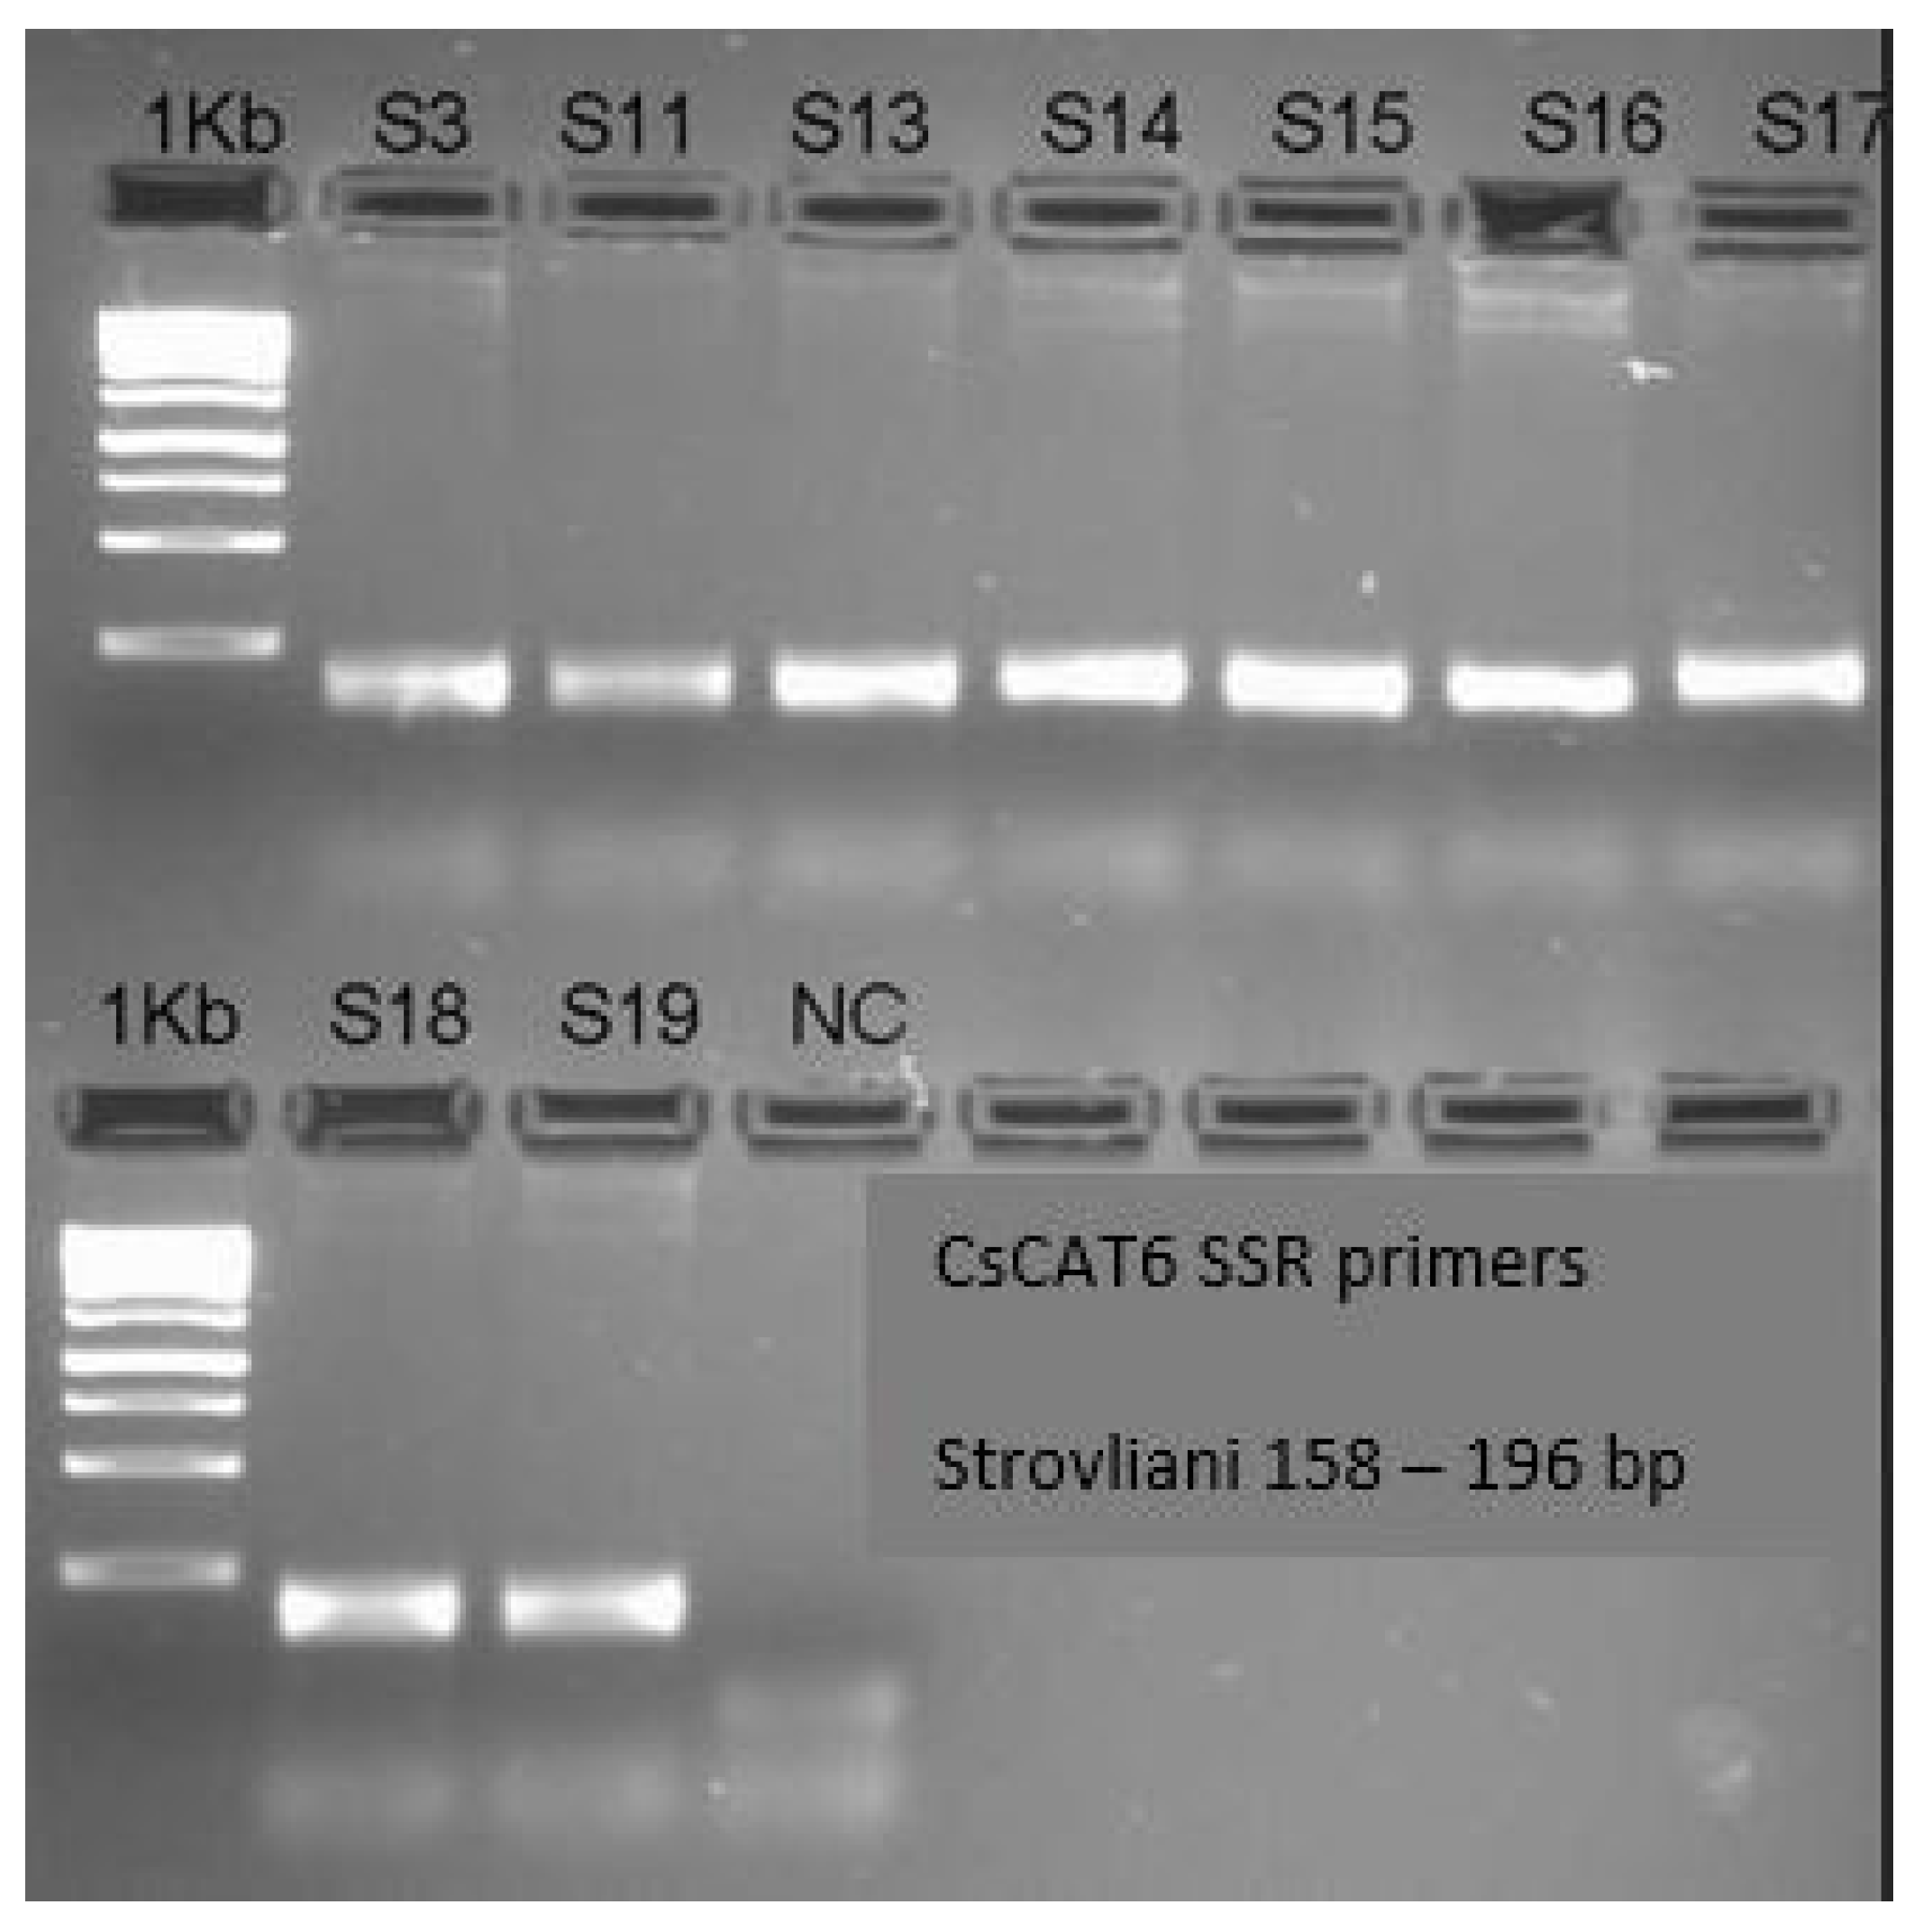
In total, 26 alleles were detected in the 7 microsatellite loci. The number of alleles per locus varied between two and seven (average of 3.7 alleles per locus). The most polymorphic locus was GOT021 that presented an observed heterozygosity (Ho) of 0.982 followed by FIR110 and CsCAT6, which presented 0.917 (Table 3). The probability of identity (PI) ranged between 0.615 and 1.000 for WAG004 and CsCAT3, respectively (Table 3).
The fixation index (Fst = 0.065) shows a relatively low level of differentiation between the cultivars. The average number of migrants ranged between 1.542 for CsCAT3 and 161.8 for GOT021 (Table 3). According to the AMOVA, 73% of the total diversity resides within cultivars and 27% among cultivars (Table A2 and Table A3).
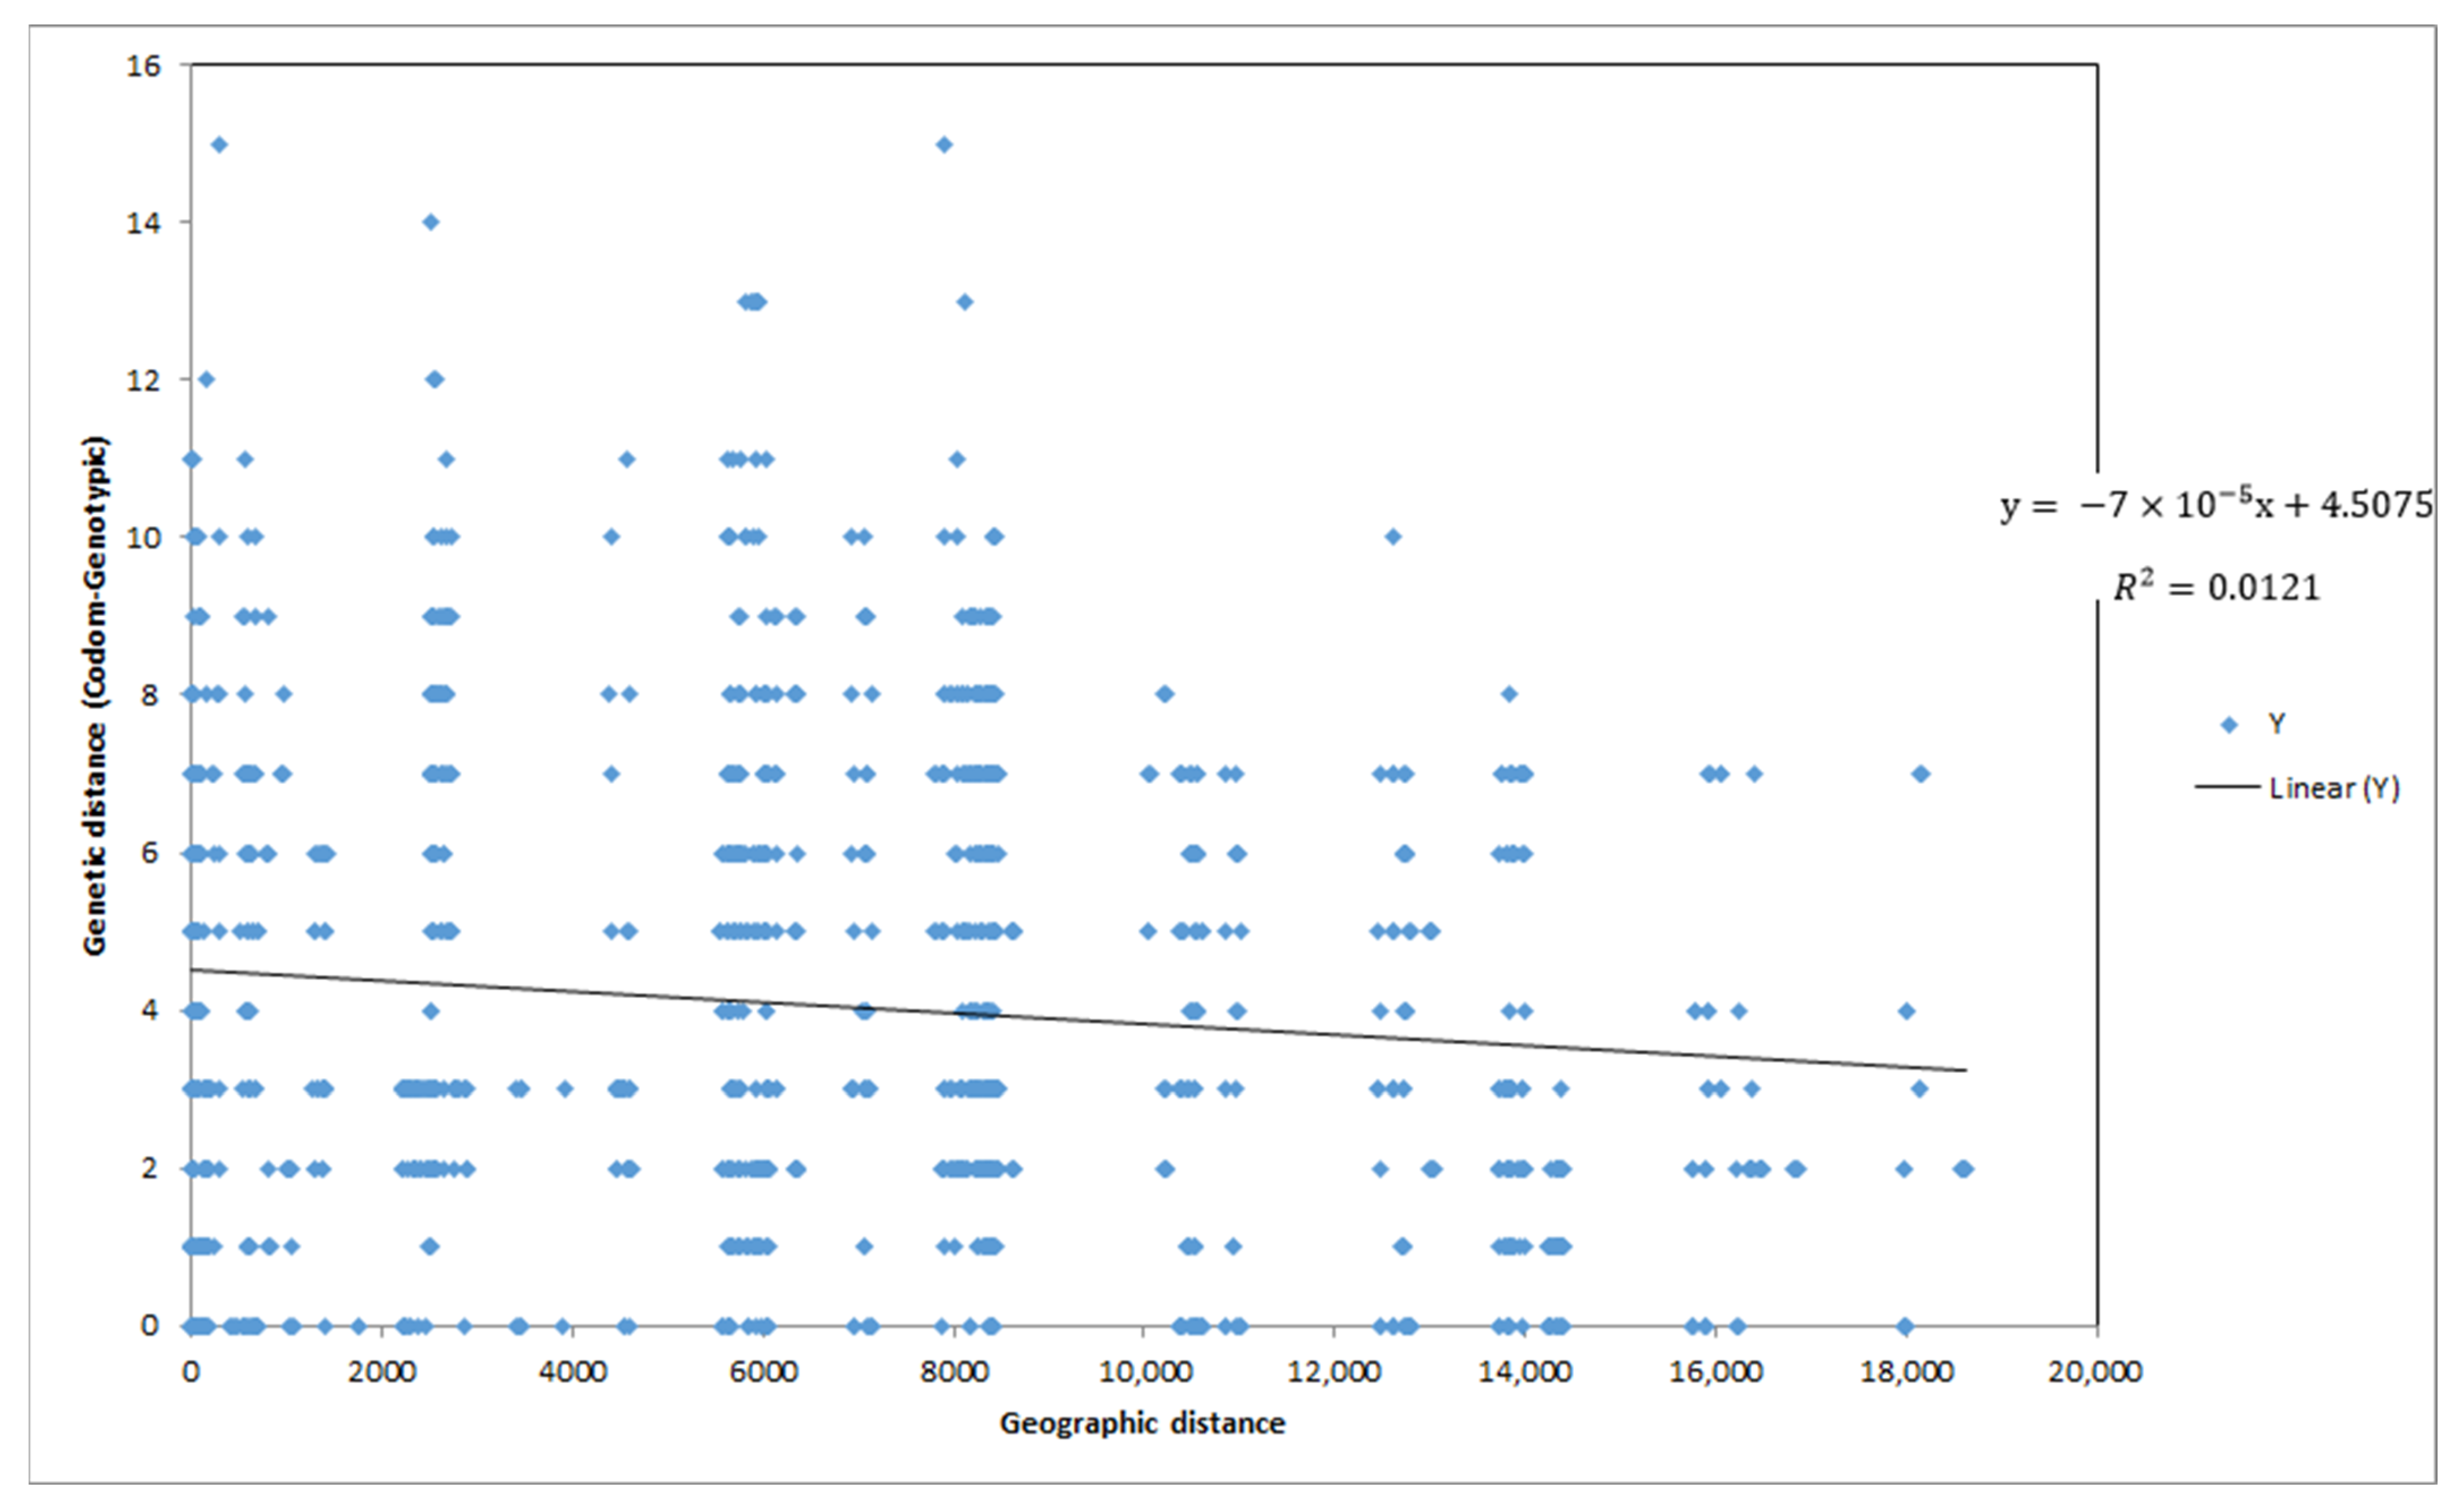
A very weak (Pearson’s r = 0.11), but statistically significant (p = 0.04) relationship was found between genetic and geographic distances (Figure A2).
Moreover, the genetic diversity analysis of the separate nSSR and EST-SSR data sets showed that there are no significant differences in the genetic diversity parameters between them (Table A4).
The UPGMA dendrogram distributes the 59 Cretan chestnut individuals across two main clusters at the six allele difference point (Figure 1b). In general, cluster analysis shows a certain Rogdiani group. Moreover, most Katharokastania trees are also clustered together in two MLGs, which differ by only one allele. On the other hand, no clear classification could be made for Koutsakera and especially Strovliani.
In particular, cluster I, represented by a small number of individuals, gathers six putative Koutsakera trees, out of which five are distributed across MLG05 and MLG06 and differ by one allele and one more sample that bears a three allele difference to both MLGs. Cluster I also contains three putative Strovliani trees. Cluster II, which contains the rest of the 59 individuals studied, is represented as follows: (a) 12 Rogdiani individuals, sampled from four different areas, are present as one genotype (MLG01); (b) two other Rogdiani samples separated from the previous by only one allele; (c) an outlier Rogdiani individual “R12”, which differed from the main Rogdiani MLG by a five allele difference is also present; (d) Katharokastania individuals, sampled from the Seli region, grouped together in two MLGs (MLG02, MLG07) (MLG02 contains four Katharokastania individuals with only one allele difference from MLG07, which has seven Katharokastania trees); (e) three separated outlier Katharokastania trees, Ka05, Ka07 and Ka09, with a two to three allele difference from the two other Katharokastania MLGs; (f) Strovliani individuals, which show no clear grouping, present a first group of five individuals being genotypically identical to Katharokastania MLG02, a second group of three Strovliani individuals (S07, S09 and S11) present in the putative Rogdiani cluster group (MLG01), while four remaining Strovliani samples (S13, S19, S04 and S15) are scattered with differences of up to three alleles from MLG01 and MLG02. On the other hand, the remaining Koutsakera individuals are dispersed without an obvious pattern across various subgroups of cluster II (Figure 1b).
A PCoA was carried out on the 22 clone-corrected data set. The first two components account for 59.73% of the total variance (Figure 1c). Three different groups could be differentiated. Group I is represented by Rogdiani samples, with two Rogdiani individuals (R12 and R14), in addition to two MLG groups, MLG04 (K06 and R13) and MLG01 (mostly Rogdiani samples) (Table 2; Figure 1c). Group II is dominated by Katharokastania trees, containing Ka07, MLG07 (Katharokastania individuals), MLG02 (three Katharokastania individuals and five Strovliani individuals), MLG3 (Ka05 and S13), K05 and three Strovliani (S04, S15, S19) (Table 2; Figure 1c). Group III, consisting of Koutsakera and Strovliani cultivars, where Koutsakera dominates with two MLGs (MLG05 and MLG06) and one individual (K15), while Strovliani is represented by three individuals (S14, S16 and S17) (Table 2; Figure 1c).
As far as the sampling regions are concerned, diversity statistics are displayed in Table 4. Allelic richness is reported (results for four gene copies) instead of the number of alleles, in order to account for the unbalanced sampling. The highest allelic richness value occurred in Floria (AR = 2.10) and the lowest in Sempronas (AR = 1.82). An interesting finding was the detection of five private alleles in the Milones region. An AMOVA partitioned the genetic diversity as 22% between regions and 78% within regions (Table 5).

4. Discussion

In Crete, chestnut has always been an important component of the natural landscape and traditional agroforestry systems, but it has rarely been assessed genetically before. The present work offers a first genetic assessment of the main Cretan chestnut cultivar germplasm that consists of four widespread cultivars, by using a set of SSR primers. The multilocus genotype analysis showed that in these four Cretan chestnut cultivars there are twenty-two unique genotypes identified. Therefore, each cultivar appears to be a multiclonal variety. This result has also been found regarding other varieties and cultivars, for instance, in Greece [7] and Spain [2].
The results obtained with both nSSR and EST-SSR markers showed high levels of diversity for the Cretan chestnut cultivars, confirming the results obtained in previous studies conducted in European chestnut populations [9,12]. AMOVA revealed that the cultivars are genetically different (presenting some unique allele combinations) but share a common gene pool. These results are in agreement with the relevant literature on chestnut, where most of the variation (~70%) accounted for intracultivar differences [24]. Moreover, the study of Poljak et al. [25] on sweet chestnut wild germplasm and cultivated varieties sampled in central Europe and the western part of the Balkan Peninsula showed that most of the genetic diversity was attributed to the differences between individuals within populations (84.1%), which also supports our findings regarding the partitioning of variation within chestnut cultivars.
The Cretan cultivars exhibit a high level of gene diversity with an observed heterozygosity (Ho = 0.7). These findings are in accordance with the results of Martín et al. [26], who used nine EST-SSR markers for evaluating Spanish and Italian cultivars (Ho = 0.5 and Ho = 0.6, respectively). On a cultivar basis, both allelic number and observed heterozygosity differ, a finding reflecting the presence of different numbers of genotypes per cultivar. The inbreeding coefficient (F) presents a negative value for all cultivars indicative of a high heterozygosity, and perhaps in relation to cultivar selection for fitness-related traits (such as growth and nut production). Heterozygosity has on numerous occasions been associated with growth and fructification, a phenomenon documented for several years now [27]. In this case, it could be a result attributable to the repeated artificial selection process for higher growth and nut production.
Despite analysing 59 genotypes from a rather restricted geographic area (~2380 km2), the polymorphism level was notable. The number of alleles per locus was lower compared to the results of other sweet chestnut studies, which nevertheless refer to wider areas. Martín et al. [2] genotyped 100 chestnut trees grown in Andalusia (Huelva and Malaga) with seven microsatellites and detected an average of 5.4 and 7.4 alleles per locus for Huelva and Malaga, respectively. Torello Marinoni et al. [9] genotyped 68 chestnut trees collected in different valleys in northwestern Italy with 10 SSRs and identified 80 alleles with an average of 8 alleles per locus. Moreover, Martín et al. [28] genotyped 239 chestnuts trees in the north, centre and south (Andalusia) of Spain with seven microsatellites and found 13.14 alleles per locus.
The fixation index (Fst) of GOT021 is extremely low compared to the other EST-SSRs (Fst = 0.002), while the number of migrants shows a high value compared to the other EST-SSRs (Nm = 161.8), which indicates that this EST-SSR marker is an outlier marker. Moreover, as a functional marker, it is associated with loci involved in response to drought stress or trait of particular interest [13,29]. This result is in accordance with the findings of numerous relevant studies on Castanea sativa and several Quercus species, where GOT021 was one of the EST-SSR markers associated with abiotic stress. It was shown, for instance, to be under divergent selection in Quercus species [13,30]. Moreover, [13,28,29] did not find strong evidence that this marker is under selection, but they detected private alleles for both tolerant and susceptible Castanea sativa trees under drought stress. Additional sampling on a larger area and further analysis (such as a water stress experiment using dedicated genotypes) could provide better insight on GOT021 into adaptation of Cretan chestnut populations.
Cluster analysis revealed a clear connection between some cultivar names as provided by the farmers and the molecular result, while, for some others, no clear correspondence was found. In fact, the Rogdiani cultivar individuals with the same genetic profile sampled from four different regions showed a high degree of confidence regarding cultivar identity. However, it should be pointed out that putative samples from the other three cultivars were also shown to have the same genotype (MLG01). The Katharokastania cultivar samples were almost exclusively grouped into two closely related MLGs (MLG02, MLG07); however, sampling Katharokastania individuals from only one region (Seli), in addition to the presence of some outlier Katharokastania individuals within other cultivar groups, blurs the assertion for cultivar identity. Regarding the Koutsakera and Strovliani cultivars, no clear molecular identification was possible, as individuals from both cultivars are dispersed across various subgroups. Nevertheless, it is worth noting that a subsample of putative Koutsakera samples was grouped into a unique cluster identified in the dendrogram (cluster I) as well as in the PCoA.
The PCoA results are in accordance with the cluster analysis results, revealing the Rogdiani and Katharokastania cultivar identity (the latter with less confidence, as some individuals from other cultivars were grouped within the Katharokastania group). On the other hand, no clear differentiation for the Koutsakera and Strovliani cultivars was seen. As the chestnut cultivars studied are classified as widespread traditional varieties in Crete, it is not uncommon to have cases where misnaming of some trees can occur between farmers, especially if those cultivars share some fruit characteristics.
There were 18 homonym and 4 synonym groups distinguished in this study. As the original cultivar identification by name was given during sampling by the respective owners of the orchards where these traditional varieties are present, there appears to be some confusion in practice as to cultivar identity. The same was observed in Spain; [2] reported two homonym and four synonym groups found among the Spanish cultivars studied. Given the amount of genetic variation found and the cases of homonyms and synonyms, the sample size per nominal cultivar to assess intracultivar variation should be increased in future studies. The four cultivars could be distinguished in two groups. Katharokastania and Rogdiani are relatively low-number multilocus genotype cultivars (five and four MLGs, respectively), while Koutsakera and Strovliani can be considered as high-number multilocus genotype cultivars (10 and 9 MLGs, respectively). In terms of chestnut crop uniformity, the nuts produced from Katharokastania and Rogdiani are expected to be more uniform given their low MLG number. On the other hand, Koutsakera and Strovliani present low uniformity which reduces the market value of their chestnut crop. In fact, Koutsakera, a low uniformity variety, has the highest standard deviation in nut area, while Katharokastania, a high uniformity variety, has the least (El Chami et al., unpublished results). Nevertheless, under strong environmental pressure (for example, under climatic change), more MLGs within a cultivar should offer better long-term orchard stability.
No relationship was found between genetic and geographic distances, similar to the results reported for Spanish cultivars [2,24]. Due to isolation by distance, in typical natural populations, genetic and spatial distances are usually positively correlated. On the other hand, an orchard where the placement of cultivars on the ground is an anthropogenic exercise explains the absence of a relation between genetic and geographic distance. This finding has also been observed in a similar study in Greece [10]. This result also indicates that the chestnut orchards in the Chania region are either planted or grafted onto wild rootstock; the presence of any remnants of old-growth natural chestnut forest in the studied region is not supported by our results. Groups of trees from all regions exhibited similar levels of genetic diversity. Surprisingly, five out of the six private alleles detected in this study originated in Milones, which might reflect a greater significance of this area as a centre of traditional chestnut cultivar diversity. However, some caution should be exercised in this interpretation, due to the unbalanced sampling design. The fact that AMOVA partitioned most of the genetic variation within regions (78% within regions, 22% between regions) points towards the employment of similar cultivation and/or domestication practices in the past centuries throughout the investigated area.

5. Conclusions

The null hypothesis of no significant genetic diversity within a cultivar denomination is rejected. The considerable genetic variation found indicates that the Cretan chestnut germplasm may form a gene pool that warrants further investigation. Future research could employ more intense sampling schemes and/or a holistic approach to exploring this important germplasm by integrating the study of flowering characteristics [10] and chemical quality attributes [31] in addition to detailed genetic evaluation. Such analyses will complement the assessment of the performance and real value of this genetic heritage, prior to undertaking actions for its conservation and sustainable utilisation in prebreeding and breeding programmes.

Author Contributions

Conceptualisation, P.K. and F.A.A.; methodology, F.A.A. and P.K.; experimentation, M.A.E.C., G.K. and P.K.; biostatistics, N.T., M.A.E.C. and F.A.A.; validation, F.A.A., N.T. and M.A.E.C.; writing—original draft preparation, M.A.E.C., F.A.A. and N.T.; writing—review and editing F.A.A., N.T., M.A.E.C., G.K. and P.K.; supervision, F.A.A. and P.K.; funding acquisition, P.K. and F.A.A. All authors have read and agreed to the published version of the manuscript.

Funding

This study was partially supported by the General Secretariat of Research and Innovation, Greece, through the Aristotle University of Thessaloniki project “Crown Genome” and from the Ministry of Environment and Energy, General Directorate of Development, Forests Protection and Agro-environment, Directorate of Planning and Forest Policy, Department of Forestry Studies, Applications and Research, Program “Protection and Enhancement of Forests 2016”—Green Fund, Priority Axis 7 “Applied Research”.

Data Availability Statement

Molecular data will become available from the Dryad Digital Repository upon paper publication.

Acknowledgments

The COST Action CA18201 ConservePlants is gratefully acknowledged for an STSM to M.A.E.C. in order to visit the Lab of F.A.A. A. Chtioui is thanked for assistance in the laboratory. Z. Zaiter is thanked for his assistance in producing the map of the sampled regions.

Conflicts of Interest

The authors declare no conflict of interest.

Appendix A

Table A1. WGS84 GPS coordinates for the surveyed Cretan chestnut trees representing local varieties.
Tree CodeCultivarRegionLat.Long.
Ka01KatharokastaniaP. ROUMATA35.3862223.79691
Ka02KatharokastaniaP. ROUMATA35.3862023.79706
Ka03KatharokastaniaP. ROUMATA35.3862723.79714
Ka04KatharokastaniaP. ROUMATA35.3861323.79702
Ka05KatharokastaniaP. ROUMATA35.3860623.79695
Ka07KatharokastaniaP. ROUMATA35.3858323.79660
Ka08KatharokastaniaP. ROUMATA35.3857823.79645
Ka09KatharokastaniaP. ROUMATA35.3864223.79558
Ka10KatharokastaniaP. ROUMATA35.3864523.79558
Ka11KatharokastaniaP. ROUMATA35.3865323.79565
Ka12KatharokastaniaP. ROUMATA35.3874723.79630
Ka13KatharokastaniaP. ROUMATA35.3875223.79636
Ka14KatharokastaniaP. ROUMATA35.3874723.79618
Ka15KatharokastaniaP. ROUMATA35.3874423.79652
K01KoutsakeriMYLONES35.3757523.70544
K02KoutsakeriMYLONES35.3758323.70548
K03KoutsakeriMYLONES35.3759223.70554
K04KoutsakeriMYLONES35.3758623.70563
K05KoutsakeriMYLONES35.3759923.70560
K06KoutsakeriMYLONES35.3760523.70570
K07KoutsakeriMYLONES35.3759523.70538
K09KoutsakeriMYLONES35.3811023.70666
K10KoutsakeriMYLONES35.3812323.70668
K11KoutsakeriMYLONES35.3813323.70668
K12KoutsakeriMYLONES35.3814223.70667
K13KoutsakeriMYLONES35.3814923.70667
K14KoutsakeriMYLONES35.3760123.70529
K15KoutsakeriMYLONES35.3758623.70521
K16KoutsakeriELOS35.3527623.65008
R01RogdianiPRASSES35.3793623.84548
R02RogdianiPRASSES35.3796323.84559
R03RogdianiSEMPRONAS35.3782623.82102
R04RogdianiSEMPRONAS35.3793323.82069
R05RogdianiSEMPRONAS35.3831723.82118
R06RogdianiSEMPRONAS35.3830823.82122
R07RogdianiSELLI35.3786723.82611
R08RogdianiP. ROUMATA35.3807923.78319
R09RogdianiP. ROUMATA35.3807923.78308
R10RogdianiMYLONES35.3754123.70487
R11RogdianiMYLONES35.3753623.70486
R12RogdianiMYLONES35.3752923.70483
R13RogdianiMYLONES35.3761023.70535
R14RogdianiMYLONES35.3763223.70527
R15RogdianiMYLONES35.3765323.70510
S03StrovlianiELOS35.3588323.64221
S04StrovlianiELOS35.3587423.64238
S05StrovlianiELOS35.3587623.64248
S06StrovlianiELOS35.3587423.64259
S07StrovlianiELOS35.3519623.65058
S08StrovlianiELOS35.3521323.65052
S09StrovlianiELOS35.3522623.65044
S11StrovlianiELOS35.3531923.64848
S13StrovlianiELOS35.3533423.64834
S14StrovlianiFLORIA35.3762423.73497
S15StrovlianiFLORIA35.3762423.73487
S16StrovlianiFLORIA35.3739223.73303
S17StrovlianiFLORIA35.3739123.73321
S18StrovlianiFLORIA35.3739223.73331
S19StrovlianiFLORIA35.3740223.73326

Appendix B

Figure A1. Agarose gel picture of Strovliani chestnut variety samples using the CsCAT6 SSR primer.
Forests 12 01659 g0a1

Appendix C

Table A2. Results of the Analysis of Molecular Variance regarding of the Cretan chestnut varieties studied.
Sourced.f.S.S.M.S.Est. Var.%
Among Cultivars331.16410.3880.59727%
Within Cultivars5586.9381.5811.58173%
Total58118.102 2.178100%
Table A3. PhiPT estimation based on the Analysis of Molecular Variance of the Cretan chestnut varieties studied.
StatisticValuep Value
PhiPT0.274<0.001

Appendix D

Figure A2. Correlation between genetic data with geographical data of the studied Cretan chestnut cultivars.
Forests 12 01659 g0a2

Appendix E

Table A4. Diversity parameters for the nSSRs and EST-SSRs of the studied Cretan chestnut cultivars.
(I)HoHeNaAMOVAFPCoA
nSSR0.7610.660.453.0872% within 28% among−0.3766.13% Axe1 and Axe2
ESTSSR0.7450.870.52.4473% within 27% among−0.7353.77% Axe1 and Axe2
t-test0.8790.090.410.13 0.055

References

  1. Lauteri, M.; Monteverdi, M.C.; Sansotta, A.; Cherubini, M.; Spaccino, L.; Villani, F.; Küçük, M. Adaptation to drought in european chestnut. evidences from a hybrid zone and from controlled crosses between drought and wet adapted populations. Acta Hortic. 1999, 494, 345–354. [Google Scholar] [CrossRef]
  2. Martin, M.A.; Alvarez, J.B.; Mattioni, C.; Cherubini, M.; Villani, F.; Martin, L.M. Identification and Characterisation of Traditional Chestnut Varieties of Southern Spain Using Morphological and Simple Sequence Repeat (SSRs) Markers. Ann. Appl. Biol. 2009, 154, 389–398. [Google Scholar] [CrossRef]
  3. Rivas-Martínez, S.; Gandullo Gutiérrez, J.M.; Allué Andrade, J.L.; Montero de Burgos, J.L.; González Rebollar, J.L. Instituto Nacional para la Conservación de la Naturaleza (Espanya) Mapa de Series de Vegetación de España 1: 400 000 y Memoria; ICONA: Madrid, Spain, 1987. [Google Scholar]
  4. Borges, O.; Gonçalves, B.; de Carvalho, J.L.S.; Correia, P.; Silva, A.P. Nutritional Quality of Chestnut (Castanea sativa Mill.) Cultivars from Portugal. Food Chem. 2008, 106, 976–984. [Google Scholar] [CrossRef]
  5. Liu, H.; Zhou, D.; Tong, J.; Vaddella, V. Influence of Chestnut Tannins on Welfare, Carcass Characteristics, Meat Quality, and Lipid Oxidation in Rabbits under High Ambient Temperature. Meat Sci. 2012, 90, 164–169. [Google Scholar] [CrossRef] [PubMed]
  6. Bussotti, F.; Pollastrini, M.; Holland, V.; Brüggemann, W. Functional Traits and Adaptive Capacity of European Forests to Climate Change. Environ. Exp. Bot. 2015, 111, 91–113. [Google Scholar] [CrossRef]
  7. Aravanopoulos, F.A.; Drouzas, A.D. Multilocus Genetic Structure of European Chestnut (Castanea sativa) Hellenic Clones and Genetic Diversity of Orchard Populations. Acta Hortic. 2005, 693, 447–452. [Google Scholar] [CrossRef]
  8. Gobbin, D.; Hohl, L.; Conza, L.; Jermini, M.; Gessler, C.; Conedera, M. Microsatellite-Based Characterization of the Castanea sativa Cultivar Heritage of Southern Switzerland. Genome 2007, 50, 1089–1103. [Google Scholar] [CrossRef] [Green Version]
  9. Torello Marinoni, D.; Akkak, A.; Beltramo, C.; Guaraldo, P.; Boccacci, P.; Bounous, G.; Ferrara, A.M.; Ebone, A.; Viotto, E.; Botta, R. Genetic and Morphological Characterization of Chestnut (Castanea sativa Mill.) Germplasm in Piedmont (North-Western Italy). Tree Genet. Genomes 2013, 9, 1017–1030. [Google Scholar] [CrossRef]
  10. Aravanopoulos, F.A.; Bucci, G.; Akkak, A.; Silva, R.B.; Botta, R.; Buck, E.; Cherubini, M.; Drouzas, A.D.; Fernández-LÓpez, J.; Mattioni, C.; et al. Molecular Population Genetics and Dynamics of Chestnut (Castanea sativa) in Europe: Inferences for Gene Conservation and Tree Improvement. Acta Hortic. 2005, 693, 403–412. [Google Scholar] [CrossRef]
  11. Buck, E.J.; Hadonou, M.; James, C.J.; Blakesley, D.; Russell, K. Isolation and Characterization of Polymorphic Microsatellites in European Chestnut (Castanea sativa Mill.). Mol. Ecol. Notes 2003, 3, 239–241. [Google Scholar] [CrossRef]
  12. Martin, M.A.; Mattioni, C.; Cherubini, M.; Taurchini, D.; Villani, F. Genetic Diversity in European Chestnut Populations by Means of Genomic and Genic Microsatellite Markers. Tree Genet. Genomes 2010, 6, 735–744. [Google Scholar] [CrossRef]
  13. Sullivan, A.R.; Lind, J.F.; McCleary, T.S.; Romero-Severson, J.; Gailing, O. Development and Characterization of Genomic and Gene-Based Microsatellite Markers in North American Red Oak Species. Plant Mol. Biol. Report. 2013, 31, 231–239. [Google Scholar] [CrossRef]
  14. Peakall, R.; Smouse, P.E. Genalex 6: Genetic Analysis in Excel. Population Genetic Software for Teaching and Research. Mol. Ecol. Notes 2006, 6, 288–295. [Google Scholar] [CrossRef]
  15. Paetkau, D.; Strobeck, C. Microsatellite Analysis of Genetic Variation in Black Bear Populations. Mol. Ecol. 1994, 3, 489–495. [Google Scholar] [CrossRef]
  16. Michalakis, Y.; Excoffier, L. A Generic Estimation of Population Subdivision Using Distances Between Alleles With Special Reference for Microsatellite Loci. Genetics 1996, 142, 1061–1064. [Google Scholar] [CrossRef]
  17. Smouse, P.E.; Peakall, R. Spatial Autocorrelation Analysis of Individual Multiallele and Multilocus Genetic Structure. Heredity 1999, 82, 561–573. [Google Scholar] [CrossRef] [PubMed] [Green Version]
  18. Mantel, N. The Detection of Disease Clustering and a Generalized Regression Approach. Cancer Res. 1967, 27, 209–220. [Google Scholar] [PubMed]
  19. Smouse, P.E.; Long, J.C. Matrix Correlation Analysis in Anthropology and Genetics. Am. J. Phys. Anthropol. 1992, 35, 187–213. [Google Scholar] [CrossRef]
  20. Kalinowski, S.T. Hp-Rare 1.0: A Computer Program for Performing Rarefaction on Measures of Allelic Richness. Mol. Ecol. Notes 2005, 5, 187–189. [Google Scholar] [CrossRef]
  21. Yu, G.; Smith, D.K.; Zhu, H.; Guan, Y.; Lam, T.T.-Y. Ggtree: An r Package for Visualization and Annotation of Phylogenetic Trees with Their Covariates and Other Associated Data. Methods Ecol. Evol. 2017, 8, 28–36. [Google Scholar] [CrossRef]
  22. R Core Team R: A Language and Environment for Statistical Computing; R Foundation for Statistical Computing: Vienna, Austria, 2021.
  23. Kamvar, Z.N.; Tabima, J.F.; Gr, N.J. Poppr: An R Package for Genetic Analysis of Populations with Clonal, Partially Clonal, and/or Sexual Reproduction. PeerJ 2014, 2, e281. [Google Scholar] [CrossRef] [Green Version]
  24. Quintana, J.; Contreras, A.; Merino, I.; Vinuesa, A.; Orozco, G.; Ovalle, F.; Gomez, L. Genetic Characterization of Chestnut (Castanea sativa Mill.) Orchards and Traditional Nut Varieties in El Bierzo, a Glacial Refuge and Major Cultivation Site in Northwestern Spain. Tree Genet. Genomes 2015, 11. [Google Scholar] [CrossRef]
  25. Poljak, I.; Idžojtić, M.; Šatović, Z.; Ježić, M.; Ćurković-Perica, M.; Simovski, B.; Acevski, J.; Liber, Z. Genetic Diversity of the Sweet Chestnut (Castanea sativa Mill.) in Central Europe and the Western Part of the Balkan Peninsula and Evidence of Marron Genotype Introgression into Wild Populations. Tree Genet. Genomes 2017, 13, 18. [Google Scholar] [CrossRef]
  26. Martín, M.A.; Mattioni, C.; Cherubini, M.; Villani, F.; Martín, L.M. A Comparative Study of European Chestnut Varieties in Relation to Adaptive Markers. Agroforest Syst 2017, 91, 97–109. [Google Scholar] [CrossRef]
  27. Aravanopoulos, F.A.; Zsuffa, L. Heterozygosity and Biomass Production in Salix Eriocepala. Heredity 1998, 81, 396–403. [Google Scholar] [CrossRef]
  28. Martín, M.A.; Mattioni, C.; Molina, J.R.; Alvarez, J.B.; Cherubini, M.; Herrera, M.A.; Villani, F.; Martín, L.M. Landscape Genetic Structure of Chestnut (Castanea sativa Mill.) in Spain. Tree Genet. Genomes 2012, 8, 127–136. [Google Scholar] [CrossRef]
  29. Alcaide, F.; Solla, A.; Mattioni, C.; Castellana, S.; Martín, M.Á. Adaptive diversity and drought tolerance in Castanea sativa assessed through EST-SSR genic markers. Forestry 2019, 92, 287–296. [Google Scholar] [CrossRef] [Green Version]
  30. Lind, J.F.; Gailing, O. Genetic Structure of Quercus rubra L. and Quercus ellipsoidalis E. J. Hill Populations at Gene-Based EST-SSR and Nuclear SSR Markers. Tree Genet. Genomes 2013, 9, 707–722. [Google Scholar] [CrossRef]
  31. How a Flower Becomes a Chestnut: Morphological Development of Chinese Chestnuts (Castanea mollissima). Available online: https://www.acf.org/wp-content/uploads/2014/04/flower-to-chestnut-PA-chapter.pdf (accessed on 30 October 2021).
Figure 1. (a) Location of the Cretan chestnut sampling sites where the four cultivars were surveyed (Elos (E), Milones (M), Floria (F), Palea Roumata (PR), Prases (P), Selli (S) and Sempronas (Sm)); (b) UPGMA tree of the 59 individuals; (c) PCoA biplot of the Cretan chestnut trees.
Forests 12 01659 g001
Table 1. Characterisation of the seven loci used to identify the Cretan chestnut varieties. Reproduced from [9,10,11,12,13].
MicrosatellitesReferenceSequence 5′ → 3′DyeSize RangeTm °C
SSRs
EMCs38Buck et al. (2003)TTTCCCTATTTCTAGTTTGTGATGROX214–27053
ATGGCGCTTTGGATGAACUnlabeled214–27053
CsCAT3Martín et al. (2010)CACTATTTTATCATGGACGGFAM169–27550
CGAATTGAGAGTTCATACTCUnlabeled169–27550
CsCAT6Martín et al. (2010)AGTGCTCGTGGTCAGTGAGROX158–20050
CAACTCTGCATGATAACUnlabeled158–20050
EST–SSRs
GOT021Sullivan et al. (2012)AGAAAGTTCCAGGGAAAGCAFAM93–10354
CTTCGTCCCCAGTTGAATGTUnlabeled93–10354
FIR110Sullivan et al. (2012)ACTTGCTCGCTTCAACCTTCTAMRA166–23056
ATTCCTCCTCATCAGGCTCAUnlabeled166–23056
POR042Martín et al. (2010)CCACCTGAATCACACGATCTHEX111–14356
AGTGCATGAATCTCGGGAAGUnlabeled111–14356
WAG004Martín et al. (2010)AAAGCAATTCAACTGGGACGTAMRA260–28854
ACGACACCGTTTGTTCCTTCUnlabeled260–28854
Table 2. Multilocus genotype identified among the 59 chestnut accessions of the Cretan chestnut varieties.
MLGKaKRS
MLG0191–2–131–2–3–4–5–6–7–8–9–10–11–157–9–11
MLG022–12–13–15 3–5–6–8–18
MLG035 13
MLG04 613
MLG05 2–3–14
MLG06 7–10
MLG071–3–4–8–10–11–14
MLG087
MLG09 4
MLG10 5
MLG11 9
MLG12 11
MLG13 15
MLG14 16
MLG15 12
MLG16 14
MLG17 4
MLG18 14
MLG19 15
MLG20 16
MLG21 17
MLG22 19
Table 3. Genetic diversity of simple sequence repeat loci used on the 59 chestnut cultivars of the Cretan chestnut varieties.
NaHoHePIFisFstNmI
nSSRs
CsCAT370.8330.6140.239−0.3580.1401.5421.077
CsCAT630.9170.5290.335−0.7330.0396.1420.747
EMCS3850.2180.2140.652−0.0190.0653.6020.685
EST-SSRs
FIR11040.9170.5700.284−0.6070.1221.8060.955
GOT02130.9820.5160.351−0.9040.002161.8000.756
WAG00420.8000.4590.403−0.7430.0445.4340.615
POR04220.7750.4600.401−0.6850.0455.2810.660
Mean −0.5780.06526.515
SE 0.1120.01822.558
Na: number of alleles; Ho: observed heterozygosity; He: expected heterozygosity; PI: probability of identity; Fis: inbreeding coefficient; Fst: fixation index; Nm: number of migrants; I: Shannon index.
Table 4. Genetic diversity statistics for the seven regions sampled.
PopulationNARPAIHoHeF
Selli141.8400.6710.7960.455−0.699
Milones202.0850.8760.7550.540−0.453
Prases21.8600.5940.8570.571−1.000
Sempronas51.8200.5940.8570.476−1.000
Palea Roumata21.8600.5940.8570.619−1.000
Elos101.9710.7440.8140.509−0.629
Floria62.1000.8110.6190.556−0.257
Overall592.04 0.8680.7760.522−0.479
N: number of samples; AR: allelic richness; PA: private alleles; I: Shannon Index; Ho: observed heterozygosity; He: expected heterozygosity; F: inbreeding coefficient.
Table 5. Analysis of Molecular Variance (AMOVA) for the seven regions sampled.
SourcedfSSMSEst. Var.%ΦPTp-Value
Among Regions631.7475.2910.47322%
Within Regions5286.3551.6611.66178%0.222<0.001
Total58118.102 2.134100%
Publisher’s Note: MDPI stays neutral with regard to jurisdictional claims in published maps and institutional affiliations.

