Article

Longer Growing Seasons Cause Hydrological Regime Shifts in Central European Forests

1
Department of Landscape Management, Faculty of Forestry and Wood Technology, Mendel University in Brno, Zemědělská 3, 61300 Brno, Czech Republic
2
Department of Aquatic Sciences and Assessment, Swedish University of Agricultural Sciences, P.O. Box 7070, SE-75007 Uppsala, Sweden
*
Author to whom correspondence should be addressed.
Forests 2021, 12(12), 1656; https://doi.org/10.3390/f12121656
Submission received: 19 July 2021 / Revised: 20 November 2021 / Accepted: 25 November 2021 / Published: 29 November 2021
(This article belongs to the Special Issue Forest Management, Hydrology and Biogeochemistry Modelling)

Abstract

:
In this study, we present evidence for a hydrological regime shift in upland central European forests. Using a combination of long-term data, detailed field measurements and modelling, we show that there is a prolonged and persistent decline in annual runoff:precipitation ratios that is most likely linked to longer growing seasons. We performed a long term (1950–2018) water balance simulation for a Czech upland forest headwater catchment calibrated against measured streamflow and transpiration from deciduous and coniferous stands. Simulations were corroborated by long-term (1965–2018) borehole measurements and historical drought reports. A regime shift from positive to negative catchment water balances likely occurred in the early part of this century. Since 2007, annual runoff:precipitation ratios have been below the long-term average. Annual average temperatures have increased, but there have been no notable long term trends in precipitation. Since 1980, there has been a pronounced April warming, likely leading to earlier leaf out and higher annual transpiration, making water unavailable for runoff generation and/or soil moisture recharge. Our results suggest a regime shift due to second order effects of climate change where increased transpiration associated with a longer growing season leads to a shift from light to water limitation in central European forests. This will require new approaches to managing forests where water limitation has previously not been a problem.

Graphical Abstract

1. Introduction

1.1. Europe Drought-Regime Shift Caused by Temperature/Transpiration

The effects of anthropogenic climate change on hydrology are seen across central Europe [1,2]. Several Czech studies have reported changes in the annual water balance with increased drought frequency and/or severity [3,4,5,6,7]. Unlike in the past, when droughts were typically associated with low precipitation, droughts today seem to be more related to a greater fraction of precipitation returning to the atmosphere via increased evapotranspiration [6,8,9,10,11]. Warmer temperatures are leading to a longer growing season across central Europe [12] which is manifested both in earlier onset in the spring and later senescence in autumn. Warmer winters may also lead to earlier leaf out [13]. A longer growing season may change catchment water balances as there is the potential for an increase in annual transpiration that would make less water available for runoff and groundwater recharge. This potential shift in catchment water balances is a concern given the long-term declines in groundwater levels observed across Europe (e.g., [9,14,15,16]).

1.2. Elevational Aspects of Water Scarcity

Present and future water scarcity in Central Europe has distinct elevational components; lowlands are dependent on water from higher elevation regions. To date, there has been little change in the water balance of montane catchments [17]. However, declining flows [17,18] and other indicators of increasing drought [19] have been observed in upland forest catchments. Changes in the water balance may induce a regime shift in the Central European uplands [20] where a regional precipitation surplus with precipitation greater than potential evapotranspiration is gradually changing to a precipitation deficit where potential evapotranspiration exceeds precipitation. This slow but inexorable move towards a different, drier hydrological regime in the Central European uplands may be representative of future conditions in much of Europe [15]. Upland areas have traditionally been used for forestry and there is a strong link between European uplands and their forests. Historically, given their long-term positive water balance, forests have been considered as a source of water for agricultural production and human consumption [21]. Central European uplands have previously been characterized by active water balances (precipitation surplus; excess water for most parts of the year) with the potential to supply water to drier regions at lower elevations [21,22]. Upland forests, which were long considered as a stable source of water and wood, may be approaching a tipping point where ongoing drought decreases the resilience of individual trees, making them more susceptible to other stressors, and ultimately leading to forest dieback [23]. Forest dieback will drastically limit the potential for uplands to further deliver ecosystem services related to timber production and carbon sequestration in the same way they have done in the past [24]. Furthermore, these changes mean that we can no longer count on Central European upland forests as potential sources of water for the landscape unless more attention is given to the management of these important areas.

1.3. Central European Uplands Forests–The Changing Role

Land cover in the upland regions of the Czech Republic (CR), and most of Central Europe, is dominated by temperate forests with stands comprised predominantly of Norway spruce, European beech and Scots pine with mostly monocultures of even-aged trees. They are less stable and more susceptible to disturbance than natural forests with diverse ages and species structures, which formerly occurred in central Europe [25]. Apart from their important economic function, Central European upland temperate forests are the primary control on the regional water cycle [22]. Thus, sustainable future production forest management must consider both wood production and water security issues. Central European forests are affected by multiple anthropogenic stressors. Near the end of the twentieth century, widespread forest dieback associated with acidification and other stressors was seen [26]. Today, climate change is significantly altering growing conditions. Warmer temperatures during the last two decades have lengthened the growing season by up to 20 days in the Central European uplands [27,28,29]. Longer growing seasons facilitate an increase in transpiration and subsequent changes in the water balance. At the same time, mild winters without extended periods of soil frost in combination with air temperatures above the freezing point mean that coniferous stands (e.g., Norway spruce) might not become fully dormant or may start transpiring during winter warm periods [30,31]. As spruce is currently the main cultivated tree species in Central European uplands, it may contribute to further increasing water stress, which is not limited to forest stands but in principle leads to the drying of the whole landscape.

1.4. Climate Change Impact Studies

There have been several modelling studies of possible future climate change impacts in the water balance of Central European forest catchments, specifically declines in groundwater recharge [32,33]. However, a study of a German forest catchment suggested summer groundwater recharge would increase until the middle of this century, at which point it would start to decline [34]. A Hungarian study suggested minimal future change in the moisture content of forest soils [35]. Another study modelled the present day (1961–2017) development of drought conditions and noted that the frequency and severity of summer droughts increased while winter drought remained relatively unchanged [36].
Other studies suggest declining runoff relative to 1961–1990 conditions throughout the Czech Republic by late in the 21st century as small increases in precipitation will be offset by larger increases in evapotranspiration [37]. A modelling study of future water balances at 13 semi-natural forest headwater catchments showed no trends in precipitation but declines in runoff prior to 2011 associated with increased evapotranspiration [18]. However, a study of a single wet forest catchment in southern Bohemia suggested a slight increase in future runoff as any increase in evapotranspiration would be less than the projected increase in precipitation [38].

1.5. Forest Management Paradigm Change—From Light Limitation to Water Deficits

In closed-canopy stands typical of Central European production forests, light is typically the most limiting factor for growth [39]. Current forest management approaches and silvicultural procedures based on light limitation as the dominant controlling factor include, e.g., gap dynamics and understory treatment [40,41,42]. As water availability has not previously been a limit to forest growth or economic returns (given the history of positive water balances), the need for water management in forest upland areas has not been previously recognized as a priority. Today, upland forests in Central Europe are increasingly subject to water stress associated with climate change. Simultaneously, forest managers are not adequately prepared to respond to this shift in the growth limiting factor. The interaction of increasing water stress due to a changing climate and inadequate management response may cause, and in some regions already contributes to, significant negative impacts on forest health, including bark beetle calamities and stand dieback [26,43,44,45]. The increasing water stress in upland forests poses a significant hidden risk to the stability of current ecosystems and may also become a challenge to many human activities, most notably agriculture, forestry, water, and land use management.
For more than 100 years, Central European forests have been managed to overcome light limitation. Until the end of the last century, the forests were managed according to the principles of uniform forest science and related cultivation methods [46], resulting in young, homogeneous, even-aged stands comprised of a limited number of tree species [47]. During the past 25 years, conservation and enhancement of biological diversity has become a critical part of forest management. The dominant principle of modern sustainable forest management in Central Europe is nature-oriented silviculture in the forms of Continuous Cover Forestry (CCF) or the Dauerwald concept [48], sometimes called “structure-rich forest”. Regardless of the name, the leading thought in both historical production-oriented forest management and modern ecosystem-based approaches is the utilization of natural processes, e.g., competition and regeneration, primarily being mutual competition between individual trees, with light as the primary limit to growth [49].

1.6. Summary of the Paper Approach

Here, we show that there is an ongoing phenologically-induced hydrological regime shift occurring in central European forests and that these ecosystems may be approaching a drought-induced tipping point at a rate much faster than previously expected based on climate impact studies. This is manifested as a greater fraction of incoming precipitation being returned to the atmosphere via increased transpiration that is likely associated with a longer growing season. We document the development of long term drought in a Central European forest headwater catchment over the last 70 years (since 1950) using the PERSiST [50] rainfall-runoff model calibrated against one year (2016) of observed streamflow and measured transpiration in deciduous and coniferous stands. These results were validated by comparing modelled changes in groundwater levels in the headwater catchment to long-term (1965–2018) borehole measurements made in the same region.

2. Materials and Methods

2.1. Study Area

2.1.1. South Moravian Region (SMR)

The South Moravian Region (SMR) is an administrative unit in the southern part of the Czech Republic with a total area of 7188 km2, of which 59% is agricultural land and 49% arable land specifically. Forests occupy 2016 km2 (28%). Elevations range from 150–819 m above sea level (masl). Long-term (1981–2010) mean annual temperature was 8.9 °C, since 2011 it has been one degree warmer reaching 9.9 °C. The long-term standard (1981–2010) mean annual precipitation is 559 mm/yr, 506 mm/yr since 2011 [51] (Supplementary Figure S1). Agriculture is concentrated in the southern and eastern lowlands, to the north and on the borders dominated in upland areas below 500 masl. Agricultural production in the region is oriented to the production of cereals, rapeseed and sugar beet [52].
Land cover in South Moravia has been remarkably stable for the past decades. Between 1993 and 2018, agricultural land cover declined from 60.5% to 58.9% arable land changed from 50.8% to 48.7% and forest from 27.7% to 28.1% [52]. This stability is reflected at the national scale, where forest cover has not changed significantly (from 32.8% to 34%).

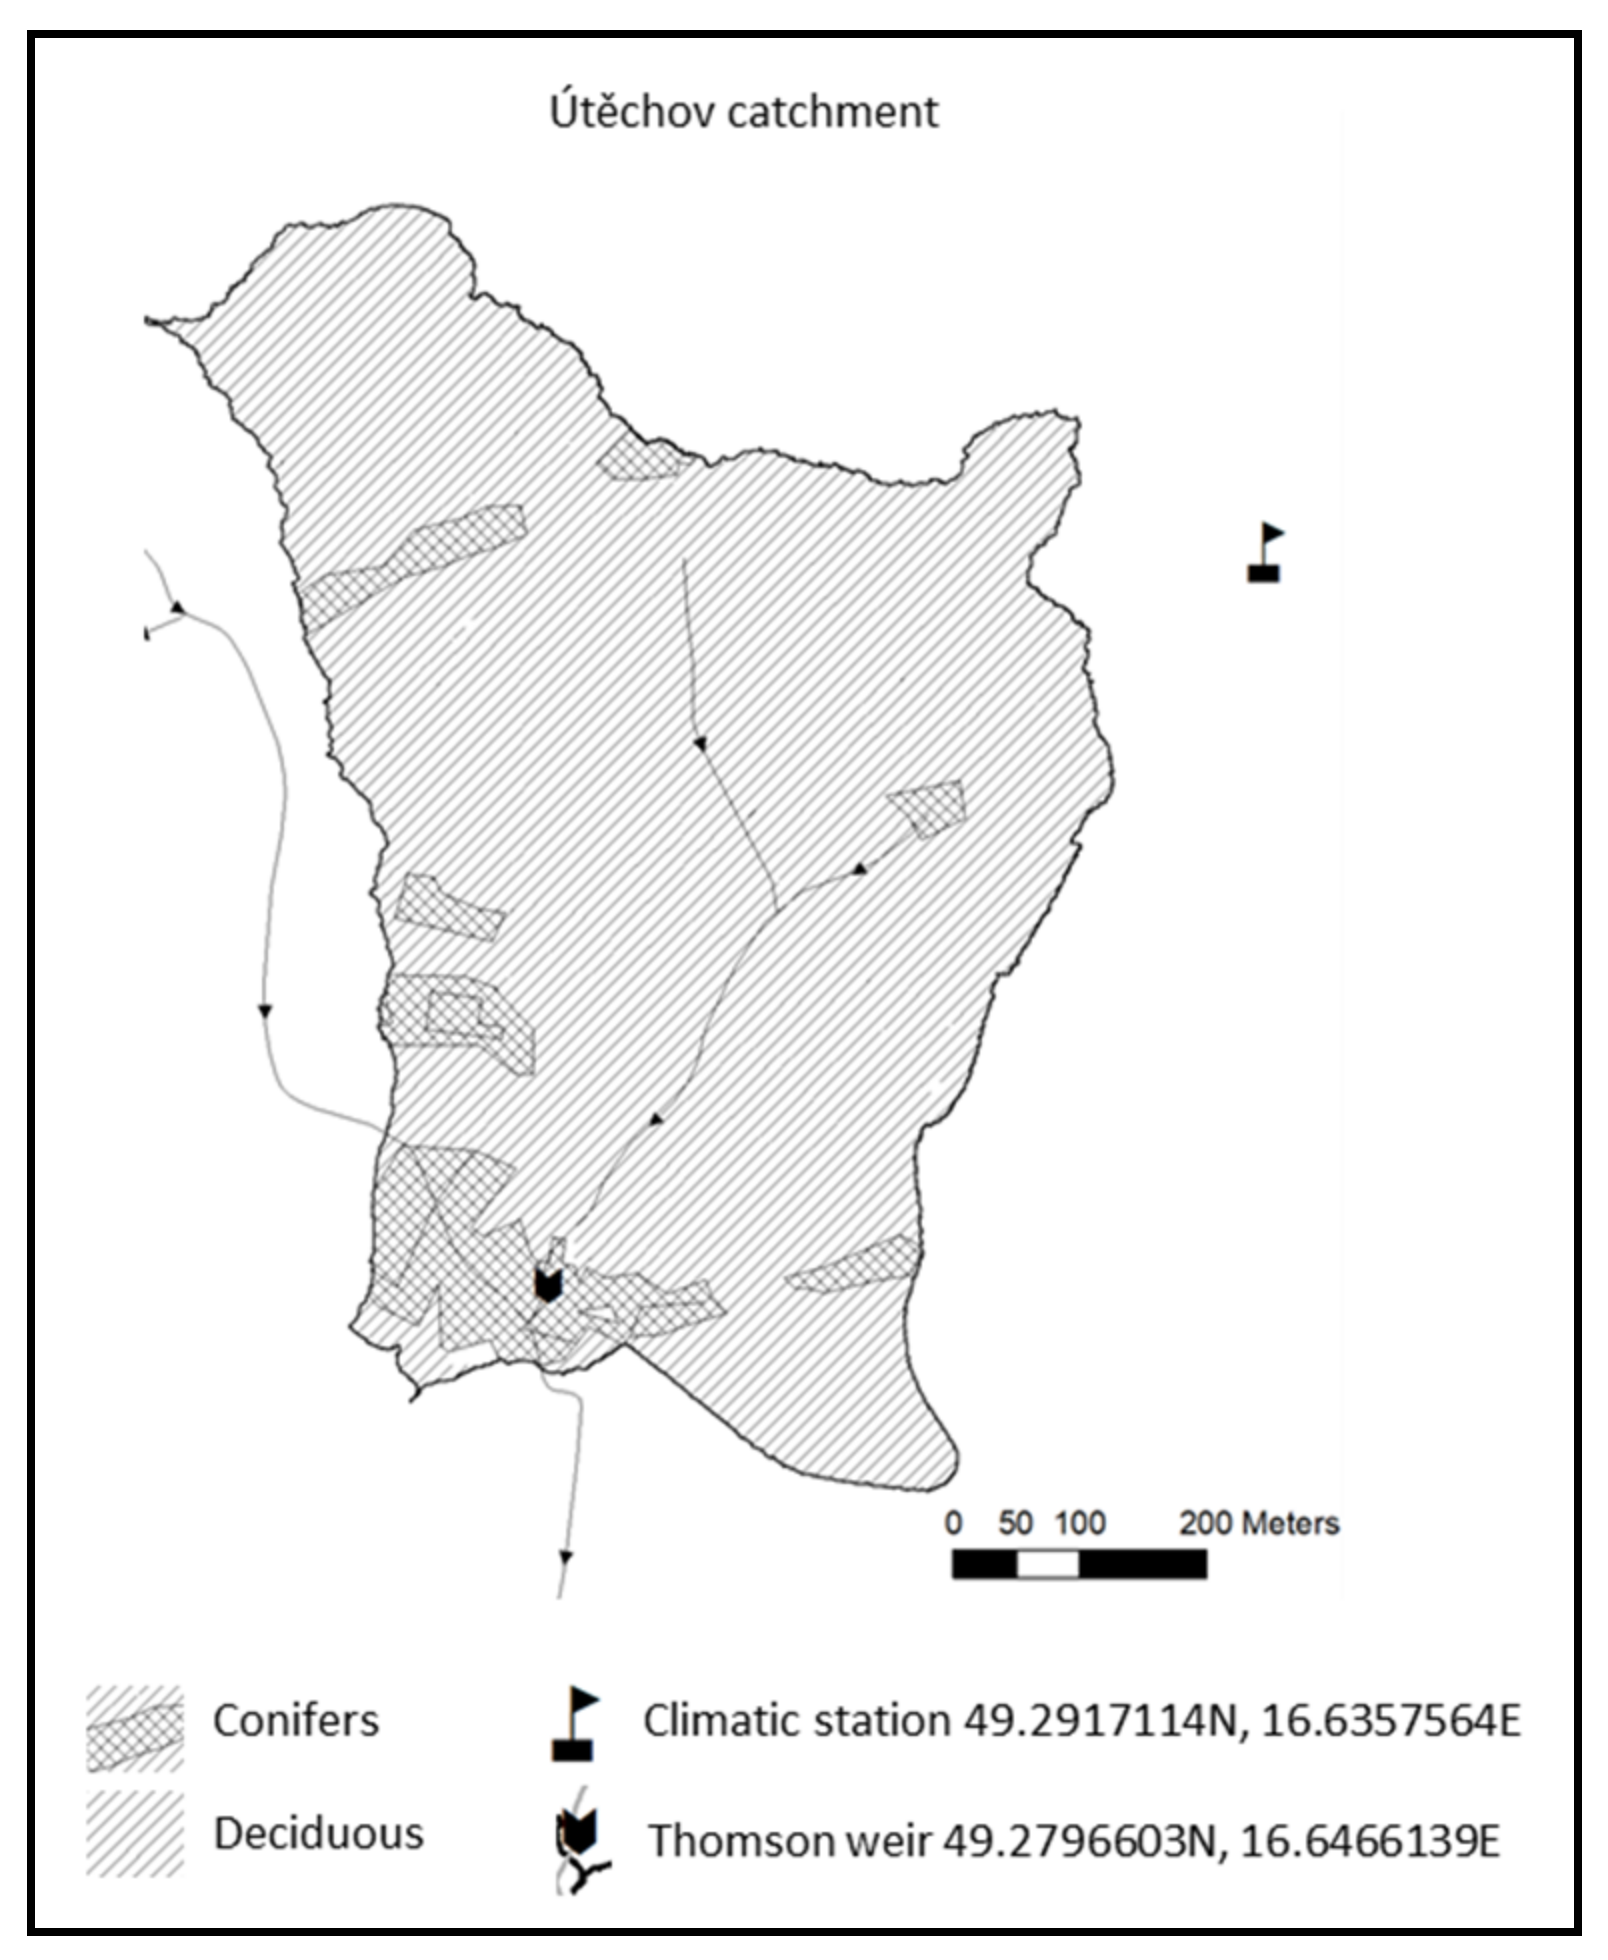
2.1.2. The Headwater Study Catchment

The Útěchov reference catchment is an upland fully forested headwater catchment located in the South Moravian Region of the Czech Republic in the Svitava river basin (Figure 1). The site has a continental humid-type climate (Köppen-Geiger class Dfb; [53]). The catchment area is less than 40 ha, mean altitude 411 masl, and the forest tree species composition is dominated by beech (Fagus sylvatica) 51%, larch (Larix decidua) 20%, spruce (Picea abies) 17%, and oak (Quercus petrea) 12%, which corresponds to 79% deciduous and 21% coniferous cover [54]. Regarding the age structure, ca. 40% is covered by mature deciduous stands (more than 50 years old), ca. 30% by younger deciduous stands (20–50 years old), ca. 9% is young (<20 years old) deciduous stands and the rest is covered by coniferous stands of varying age (10–80 years old). The parent rock is granodiorite and the prevailing soil type is modal cambisol with small enclaves of luvic cambisol and cambic gley in the vicinity of the streams. Mean depth of the soils reaches ca 70 cm [55]. In 2016, an in-depth measurement campaign took place in the catchment area, which included tree-cover analysis, soil analysis, transpiration measurements, and streamflow measurements [55].

2.2. Data Acquisition–Local Data

Streamflow at the catchment outlet (49.2796603N, 16.6466139E) has been estimated from water level measurements carried out, at a Thomson weir using a pressure water-level sensor (TSH22-3-1), connected to a datalogger (Hydro Logger H40D, both Fiedler Mágr, České Budějovice, CR). The mean water-level values for 15 min intervals were automatically converted to streamflow in the datalogger by a pre-set rating curve for the Thomson weir [54]. Precipitation (mm) and temperature (°C) were obtained from a nearby weather station with a 15-min recording interval (AMET, Velké Bílovice, CR) situated in a clear and fenced site 480 masl (49.2917114N, 16.6357564E; Figure 1) located 1.5 km from the catchment outlet outside the catchment. Continuous measurements of sap flow using the heat balance method [56] were performed during 6 April 2016 to 25 October 2016 on individual reference beech and spruce trees (31 trees in total) in the following stand types: deciduous-dominated stands of the following ages: 1–10, 20–40, 50–70, and 80+ years, and 20–60 year old coniferous dominated stands. Subsequent upscaling from single trees to the stand level was based on published relationships between diameter at breast height (dbh) and corresponding tree water use [56]. Area weighted average values for the four age groups of deciduous trees are used in subsequent analyses.

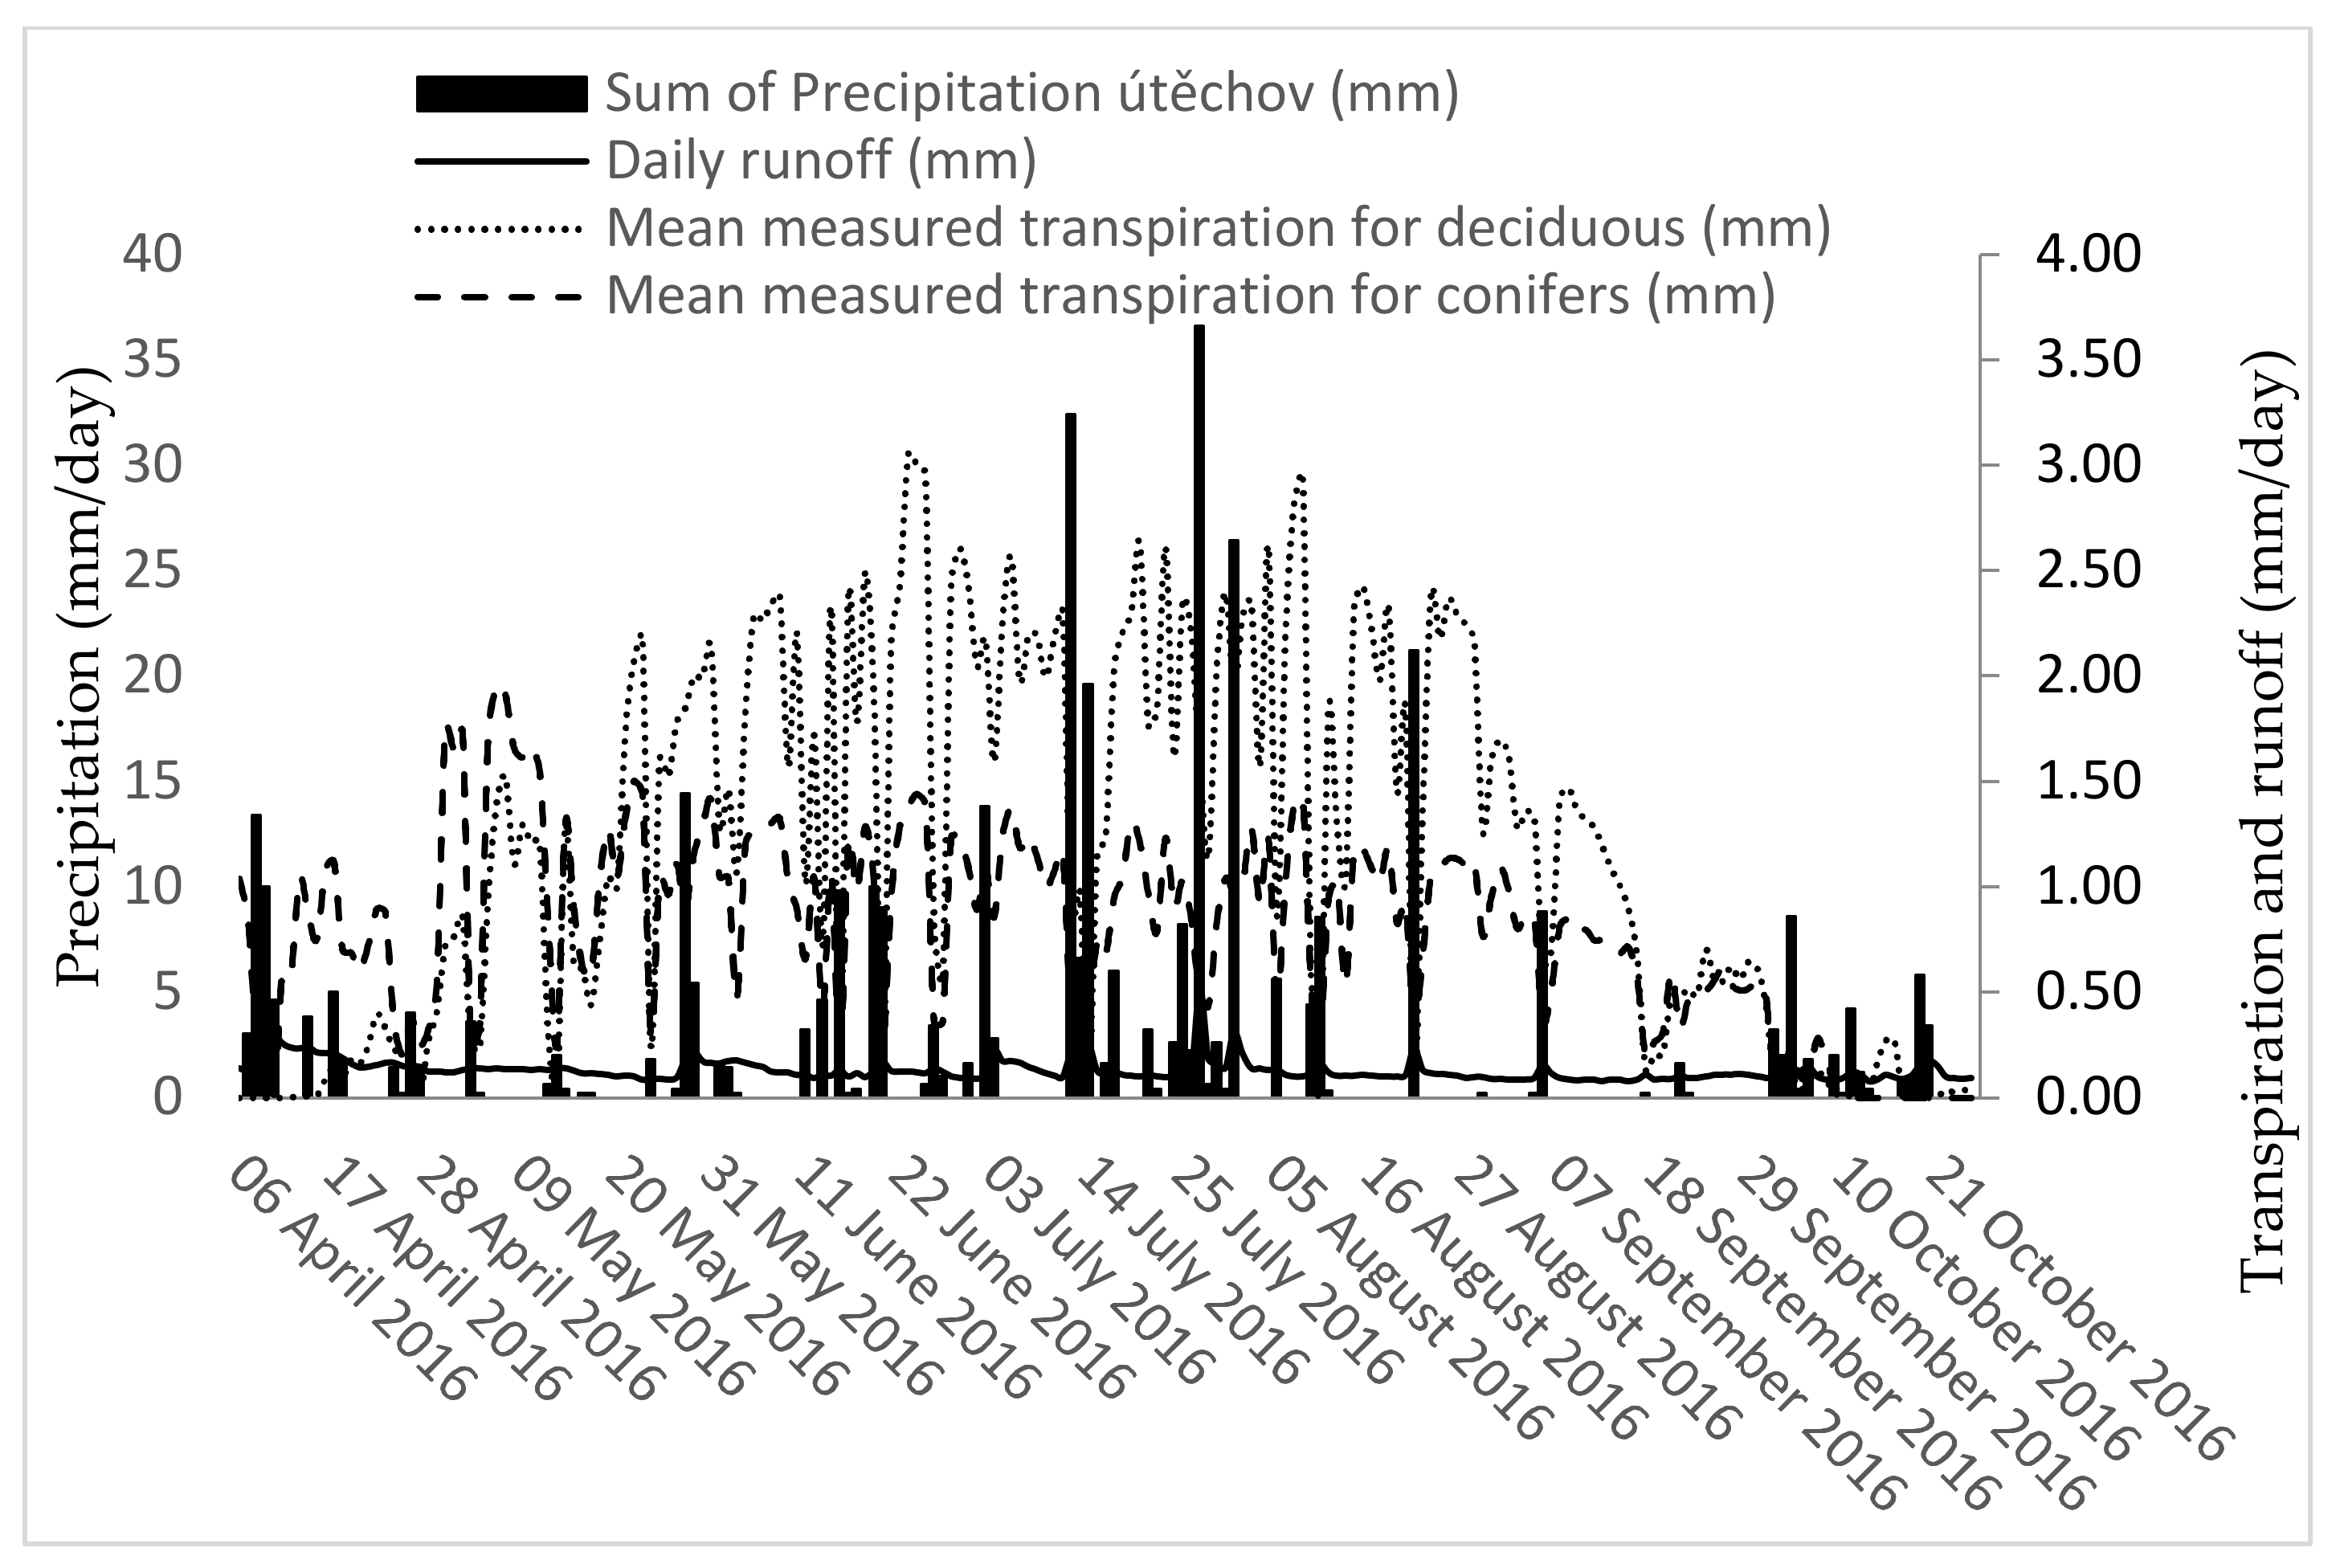
2.3. Measured Water Balance Components during the 2016 Growing Season

The water balance components for the 2016 growing season indicated that a very small fraction of precipitation left the catchment as runoff (7%) and that transpiration was equal to 63% and 43% of total precipitation for deciduous and coniferous stands, respectively (Figure 2, Supplementary Table S1).
There were noteworthy differences in spring transpiration between coniferous and deciduous stands. Transpiration measurements started in early April but no transpiration was recorded for deciduous until the beginning of May. Conifers were already transpiring more than 1 mm/day at the start of measurement and the start of their growing season was not captured.

2.4. Data Acquisition–Long-Term Data

Independent, external data sources were used to validate the long-term, catchment-scale water balance modelling. Water-level data from the closest available shallow groundwater borehole were purchased from the Czech Hydro-meteorological Institute (49.4643733N, 16.6220161E, CHMI) for the available period from November 1965 to June 2019. The borehole is located in the same main basin of the river Svitava upstream of the Útěchov reference catchment. The borehole is situated on the bottom of the Svitava valley in its flood plain at the edge of a field of arable land at 300 masl 20 km north of the outlet of the Útěchov catchment.
Throughout the period of borehole observations, the measuring equipment was upgraded several times. Originally, there were data available from 1965 in weekly intervals until 1986 when it was upgraded to daily writing intervals. In 2007, a new borehole was installed close to the first old one (less than 100 m away). The old one was functional until 2010. A linear calibration of the two boreholes according to the concurring three years of measurement was carried out to estimate water levels for the whole period from 1965 up to 2019.
Long-term daily temperature and precipitation estimates from 1950 to 2019 were obtained from the freely available E-OBS European high resolution gridded climate dataset [57]. This dataset offers high spatial resolution gridded estimates of daily temperature and precipitation derived from instrumental meteorological observations. We used data from the v.21.e 0.250° data set from grid cell (96,229) with coordinates 49.125° N and 16.625° E. The correspondence of the E-OBS gridded values to the instrumental measurements is very good for both temperature (R2 = 0.91) and rainfall (R2 = 0.68) (Supplementary Figure S2 and S3). The main difference in the control comparison of monthly precipitation between EOBS and instrumental was in July 2016 with one storm event recorded in the instrumental data that was not present in the E-OBS dataset. Annual growing degree day (GDD) summaries, defined as the sum of daily temperatures above 4°C, were calculated from E-OBS average daily temperatures.

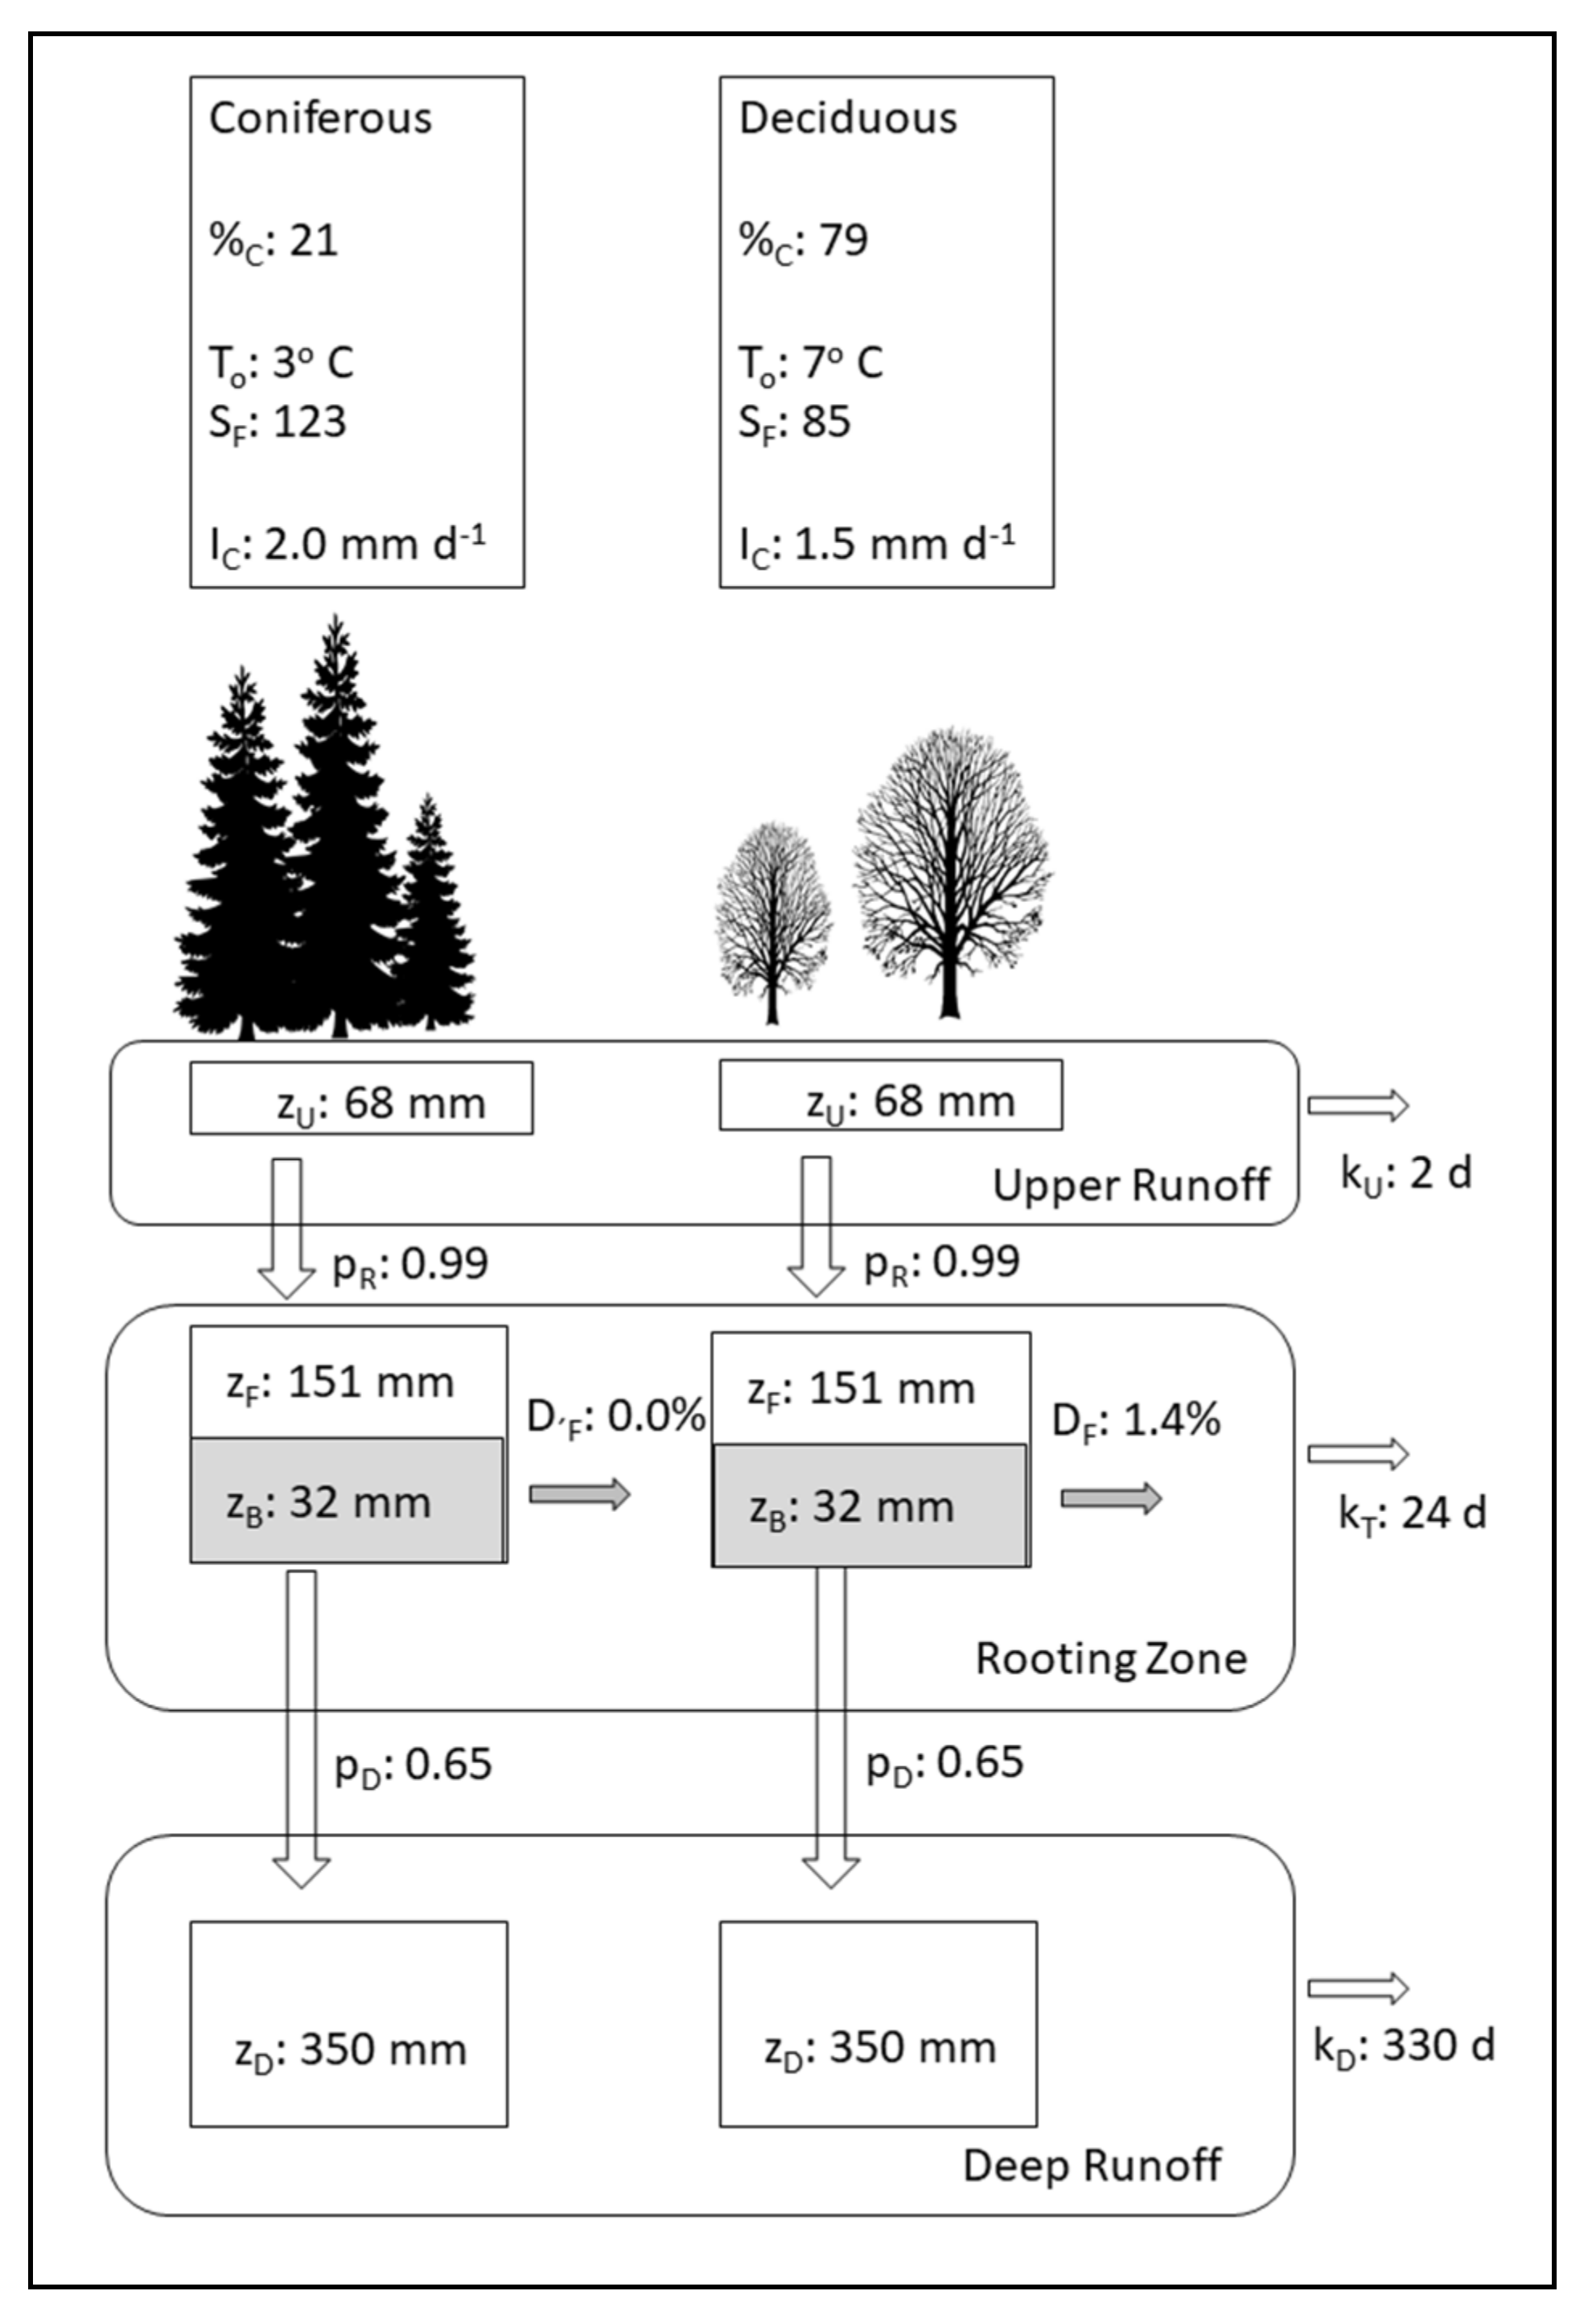
2.5. Persist Model Calibration

PERSiST [50] is a semi distributed, bucket-type model for daily flow simulations. It consists of a flexible framework that allows the modeller to specify the perceptual representation of the runoff generation process, which is based on a number of interconnected buckets. Buckets can be connected vertically to simulate different soil profiles [58] or horizontally to simulate riparian effects [59]. PERSiST can simulate multiple land cover types with differing hydrological properties, e.g., deciduous and coniferous forest within a single subcatchment. We used PERSiST_v1.6.1beta2 version to simulate water balance components (evapotranspiration, interception, and runoff) from the driving data (E-OBS daily precipitation and temperature).
In the simulations presented here, PERSiST was set up using two land cover types representing coniferous and deciduous forest (Figure 3). Coniferous forest covers slightly more than 1/5 of the catchment (%C = 21) while deciduous forest covers the remainder (%C = 79%). Different parameterizations were used for evapotranspiration, canopy interception (IC) and the drought runoff fraction (%D).
For both land cover types, the soil hydrology was simulated using three buckets representing upper runoff (U), the rooting zone (R) and deep runoff (D). The upper runoff bucket had a water storage capacity (zU) of 68 mm. In the rooting zone, the water storage capacity was split into a freely draining component (zF = 151 mm) contributing to both runoff and transpiration and a “bound” water component (zB = 32 mm) which does not contribute to runoff but can contribute to transpiration. Potential groundwater storage capacity contributing to deep runoff (zD) was assumed to equal 330 mm for both land cover types. Almost all of the water leaving the upper runoff buckets (99%) was routed vertically through the rooting zone. The remaining 1% is routed laterally to the stream. Of the liquid water leaving the rooting zone, 65% is routed vertically to the deep runoff bucket while 35% is routed laterally to the stream. All water leaving the deep runoff bucket was routed laterally to the stream.
Depth of liquid water (mm d−1) leaving a bucket each day was estimated as the depth of freely draining water (zU, zF and zD for the upper runoff, rooting zone and deep runoff buckets respectively) divided by a characteristic time constant, k. Characteristic time constants for the upper runoff, rooting zone and deep runoff buckets are 2 d, 24 d and 330 d, respectively.
Canopy interception (IC) was assumed to be 2 mm d−1 for the coniferous forest and 1.5 mm d−1 for the deciduous forest. The depth of water arriving at the soil surface was estimated by subtracting canopy interception from daily precipitation.
Daily potential evapotranspiration (PE mm d−1) was estimated with a Jensen-Haise/McGuinness type model [60] forced by air temperature (TA °C) and modelled extra-solar radiation (SR MJ m−2 d−1). The method for estimating solar radiation is provided by [61] and was calculated based on site latitude and day of year.
PE   =   S R / λ ρ T A     T 0 / S F
The equation requires latent heat of vaporization (λ) and water density (ρ). There are two empirical parameters. The temperature offset, T0 (°C), determines the lowest temperature for evapotranspiration. When TA <= T0, no evapotranspiration occurs. An empirical scaling factor SF (m kg−2) is also needed.
Actual evapotranspiration is calculated in the following manner. When the depth of water in the rooting zone exceeds the depth of “bound” water (zB mm), actual evapotranspiration is assumed to equal potential evapotranspiration. When the depth of water in the rooting zone is less than the depth of “bound” water storage, evapotranspiration is reduced by the ratio of water depth to bound water storage capacity (e.g., if there is 8 mm of water in the rooting zone, the actual evapotranspiration is 8/32, or 25% of PE).
The only other difference between the two land cover types was that a non-zero drought runoff fraction (DF = 1.4%) was assumed for the deciduous forest. The drought runoff fraction describes the fraction of water entering a bucket, which runs off laterally to the stream regardless of current depth of water in the bucket (i.e., runoff occurs whether or not the depth of water in the bucket exceeds the bound water storage capacity).
Differences in depth of water in the buckets contained in the two land cover types are the result of differential evapotranspiration and interception. More information about the PERSiST model is available elsewhere [50].
Results from the 2016 measuring campaign in the Útěchov reference catchment were used for the PERSiST model parameter setup to derive the immutable “hard” parameters including catchment properties (landscape units, vegetation types, etc.), soil characteristics (number and depth of buckets, maximum water holding capacity, etc.) as well as calibration time series of stand-specific transpiration and observed streamflow. In the simulation, the Útěchov reference was split into two land cover classes representing coniferous and deciduous stands. In each land cover type, water storage in the soil was simulated using three vertically stacked stores representing surface runoff, soilwater, and groundwater. Calibration followed a hybrid automatic/manual strategy [62].
The calibration was performed in three steps:
1.
Firstly, only the period where both measured streamflow and transpiration data were available was modelled (6 April 2016–25 October 2016). Instrumental measurements of temperature, precipitation, transpiration and streamflow from the 2016 field campaign were used to setup and calibrate the model for growing season conditions. A manual calibration was performed to achieve a match of R2 > 0.67 between modelled and observed daily stream flow. Soft calibration [63] based on measured transpiration of deciduous and coniferous stands was used to obtain a guideline of realistic values for the parameter setup. Specifically, simulated maximum daily transpiration values for deciduous trees were kept approximately 1.3 times higher than those for conifers throughout the whole calibration process. This value is an approximation based on expected differences between spruce and beech [64] and our own measurements from 2016, where we observed that deciduous trees transpired 1.48 times more than conifers (238 mm to 161 mm–however, note that the early spring transpiration of conifers was not captured, so the measured difference was probably a little less) (Supplementary Table S1, Figure S2.).
At the same time, the growing degree day threshold (T0) was set to 3°C and 7 °C for conifers and deciduous respectively as well as a drought runoff fraction (DF) of 0.014 for deciduous as opposed to 0 for conifers. In our previous study from the region we observed different stand-level water use efficiencies during precipitation-free periods related to the dominant tree species [54]. The drought runoff fraction coefficient provided one way of implementing this in PERSiST. In this manner, different values of mean daily transpiration were obtained for deciduous and coniferous stands in the catchment. Similarly, realistic interception amounts (IC) were used for days with precipitation (2 mm d−1 for spruce and 1.5 mm d−1 for deciduous) based measurements of interception made in Central European upland forests [65,66].
2.
The setup developed in step (1) was used with instrumental measurements of temperature and precipitation to model the whole year (1 January 2016 to 31 December 2016) including the important dormant season of the spring/winter period. It should be noted that no measurements of transpiration or streamflow were available for this part of the year. Transpiration coefficients, initial water depth parameters as well as the water movement through soil buckets were adjusted to simulate a reasonable winter streamflow and still maintain an acceptable fit during the measured growing season streamflow (65% accuracy; R2) while retaining the basic principles defined in step (1) for the transpiration and interception.
3.
The calibrated model from step (2) was then forced using EOBS daily gridded weather data to simulate the long-term water balance from 1950–2018. Again, transpiration coefficient, initial water depth parameters as well as the water movement through soil buckets and water residence time were adjusted to obtain reasonable streamflow throughout the almost 70-year period while still maintaining a good fit with the 2016 observed data. We opted to neglect possible subtle changes in evapotranspiration associated with the temporal evolution of age structure or tree species distribution and used the same parameter values for the whole of the 70-year period simulated.
To improve the credibility of the long-term model simulation, we used the original 2016 streamflow (manual calibration improved by following Monte-Carlo simulations [60] together with our own judgement and historical evidence (for example reports of severe drought in 1953 [67,68] resulting in 45% accuracy (R2) to the 2016 observed data while reproducing the observed timing of peaks and seasonal recession (Supplementary Figure S4). Looking at the entire period, it is important to note that there was a major drought in 1953, which is well captured by the simulations (Supplementary Figure S5).
To compare our simulations with the long-term CHMI borehole measurements, we exported the simulated water level in the deepest PERSiST water store (representing groundwater below 40 cm). These simulated water levels from 1965 onwards were then compared to groundwater depths in the borehole.

3. Results

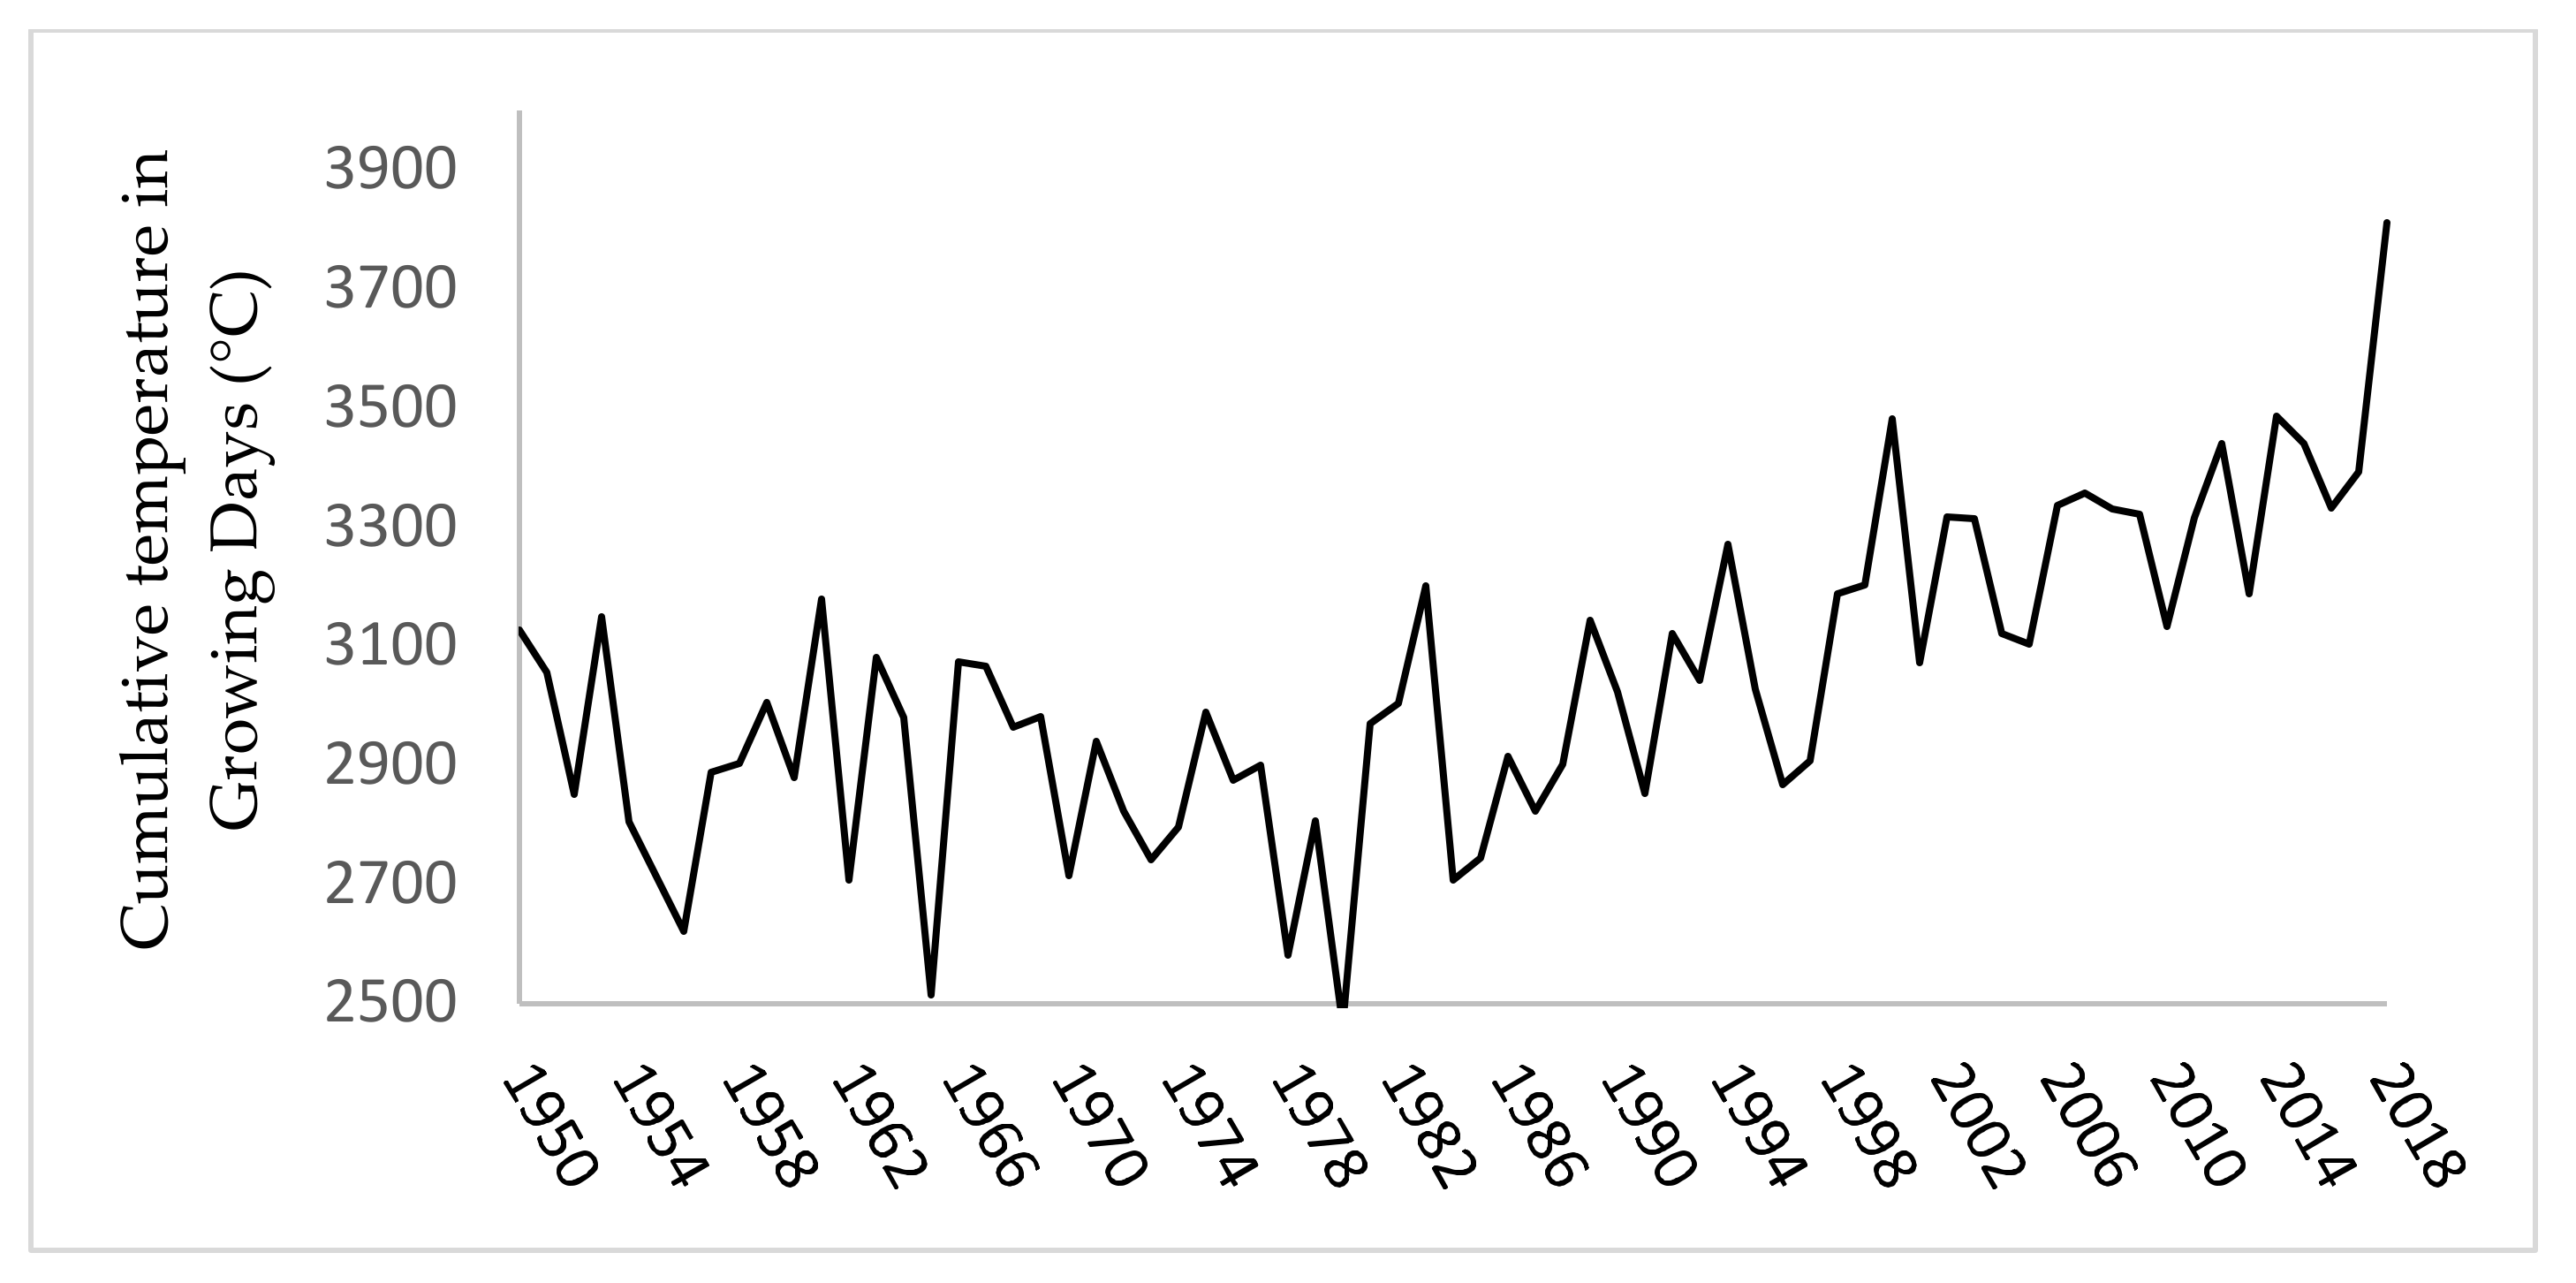
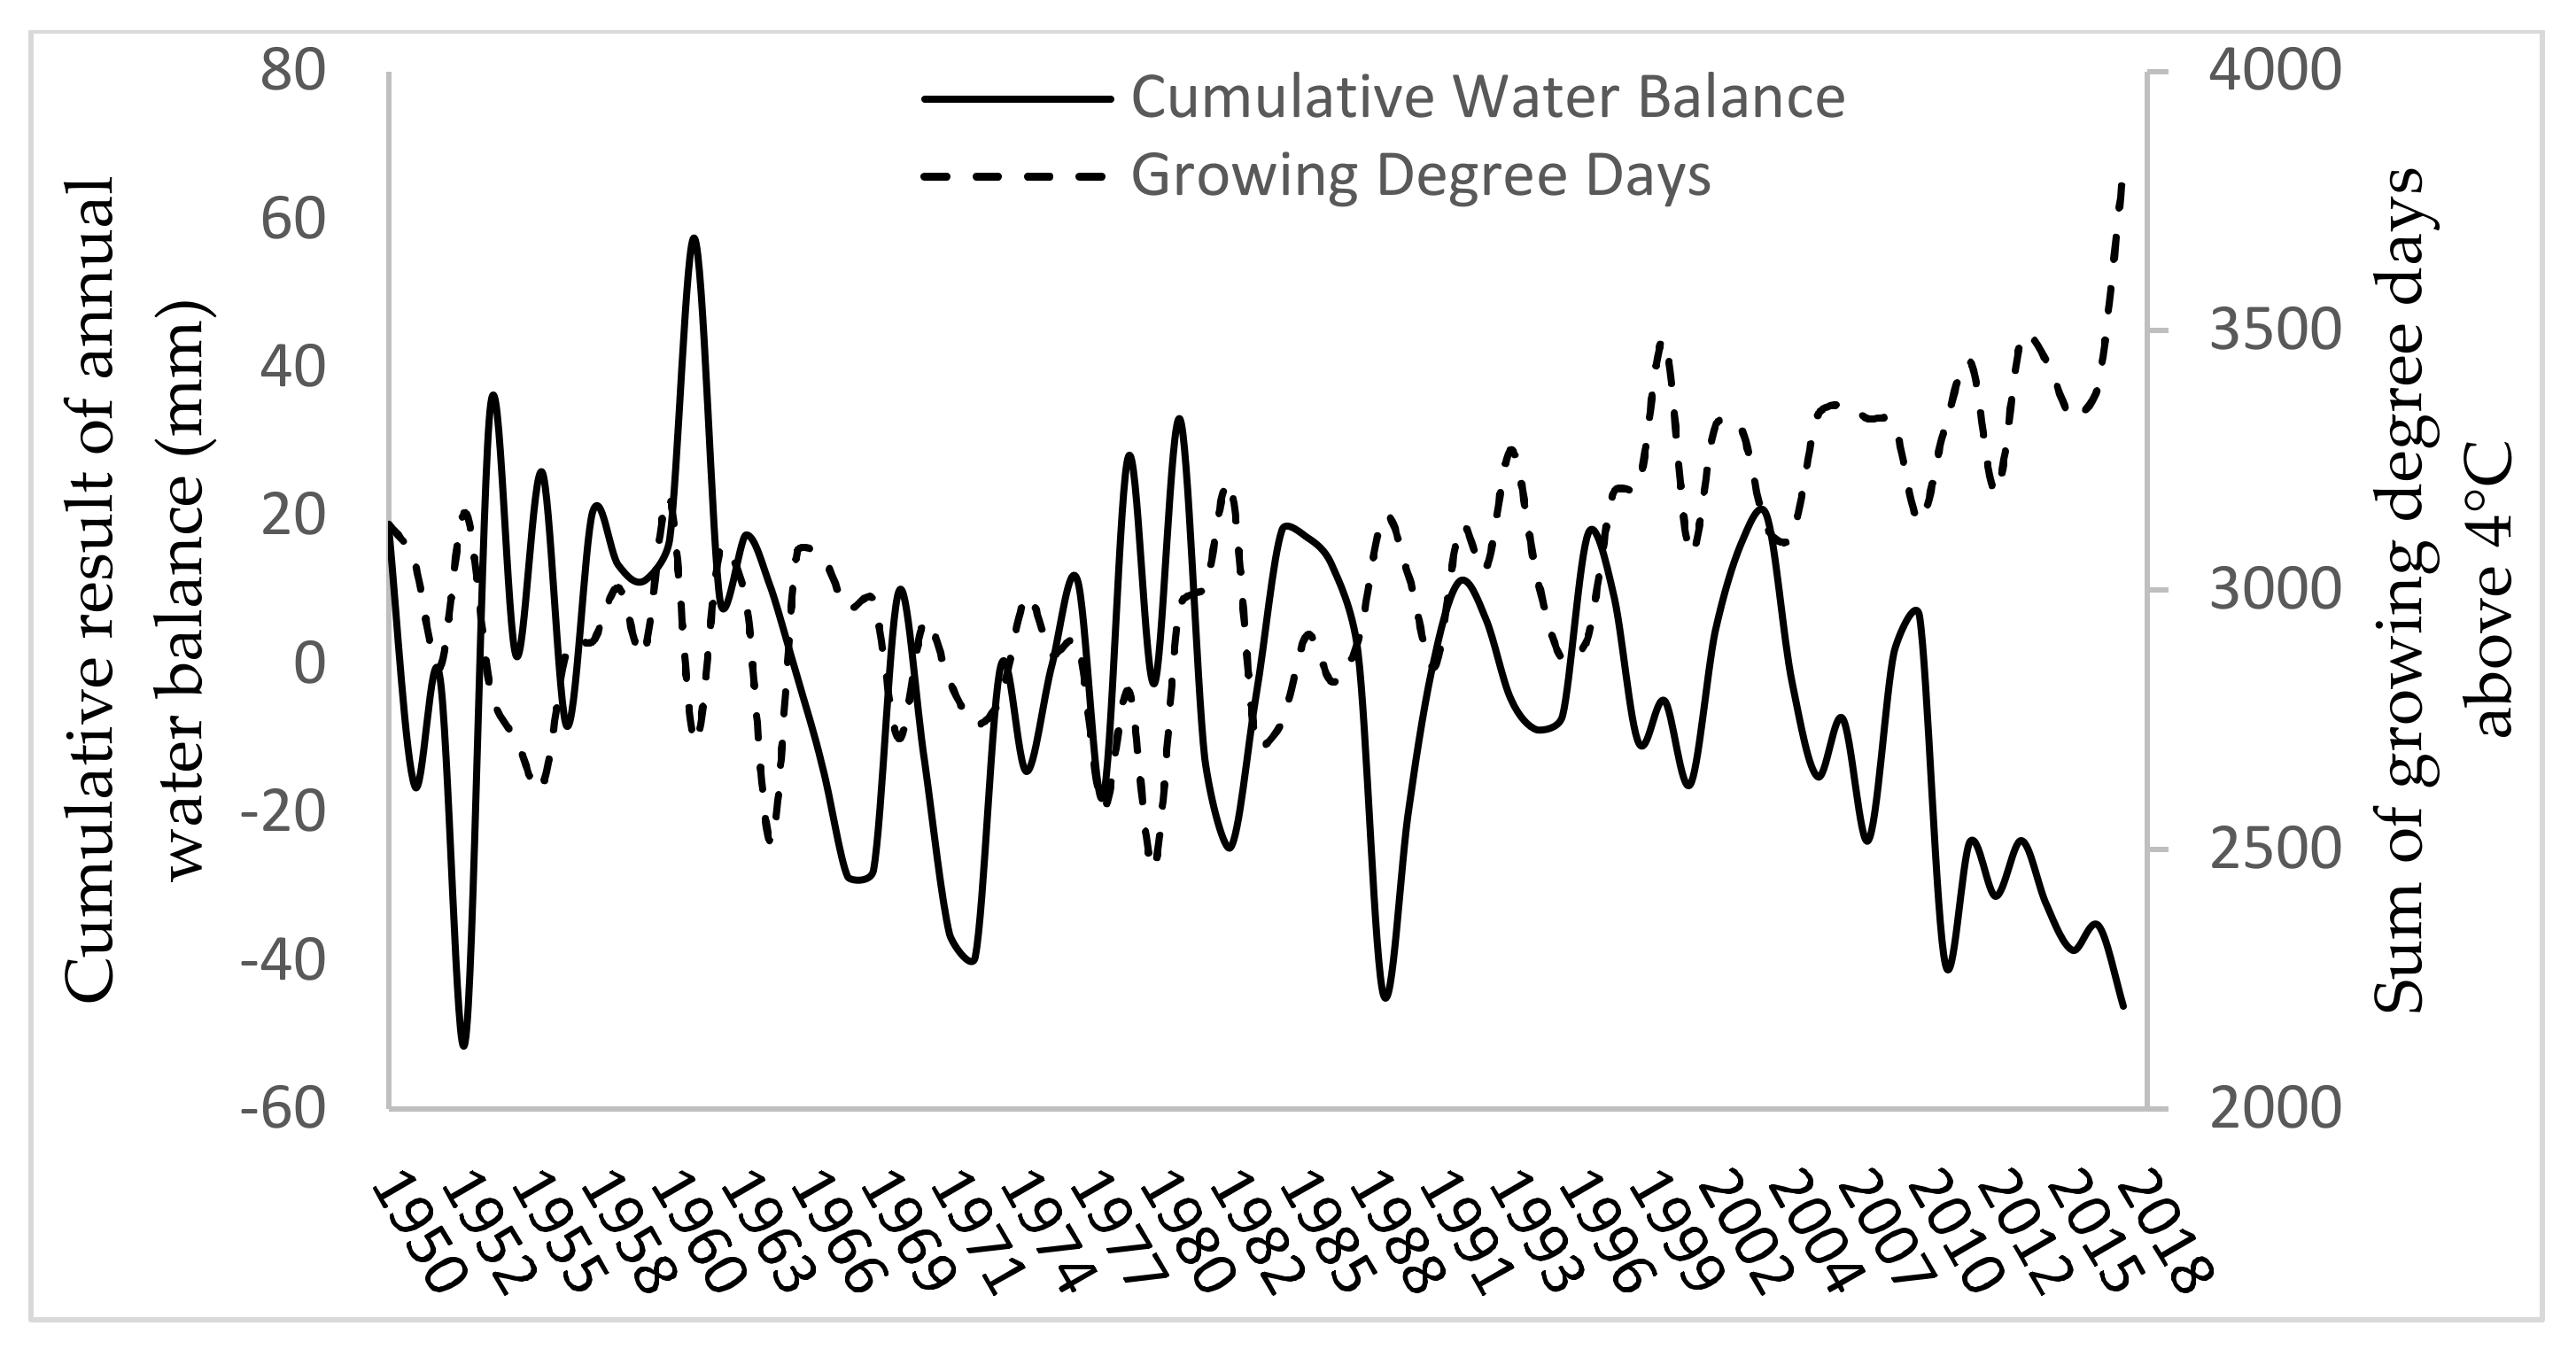
3.1. Long Term Climate Evaluation

The annual sums of growing degree days above 4 °C (GDD) clearly show ongoing warming in the region (Figure 4). Since 1980, there has been a monotonic increase in GDD. Most of this increase is associated with warmer April temperatures (Supplementary Figure S6), which is relevant to the increasing length of the growing season. There is a slight declining trend in April precipitation and small increases in September (Supplementary Figure S7). This may be indicative of a larger proportion of precipitation to runoff unutilized by vegetation because in autumn, trees might already be in the phenological phases of leaf coloring and leaf fall with lower transpiration rates [69], especially after a dry summer period when leaf-shedding might occur earlier as a defensive reaction to limited water resources [43]. However, the total amount of annual precipitation has remained roughly the same with no significant trends up or down (Figure 5).

3.2. Modelled Data of Long Term Water Balance from Útěchov Reference Catchment

The annual water balance has been moving towards a deficit situation since the early 1990s (Figure 5). During these last 30 years, modelled water balance components seemed to be quite stable (Figure 5, Supplementary Figure S8, Supplementary Table S2) with the exception of runoff. We found a slight decrease in precipitation (−0.8 mm yr−1) as well as slight increase in evapotranspiration for both stand types (0.5 and 0.2 mm yr−1 for deciduous and coniferous respectively); with low confidence (R2 less than 0.0075 for all cases). The most significant trend was found in the decrease of runoff that was approximately nine times higher than the decrease in precipitation. Given the lack of temporal trends in the other water balance components, the long-term decline in runoff seems to be driven mainly by the combination of slightly decreasing precipitation and the increasing length of the growing season exhibited by the increase in GDD (Figure 4 and Figure 6).
However, with the exception of the year 2010, total evapotranspiration from both deciduous and coniferous stand types did not increase significantly as expected [6,7,8,9,10,11]. Since the unusually wet year 2010 (732 mm precipitation), evapotranspiration seemed to decrease. The annual water balance results began to decrease a few years earlier inversely copying the increase in GDD (Figure 6). This suggests that a drying out was happening in the region (catchment) and the water storage has been depleted to a point where it limited transpiration [29,43] and the stands were under climate-induced stress [70].

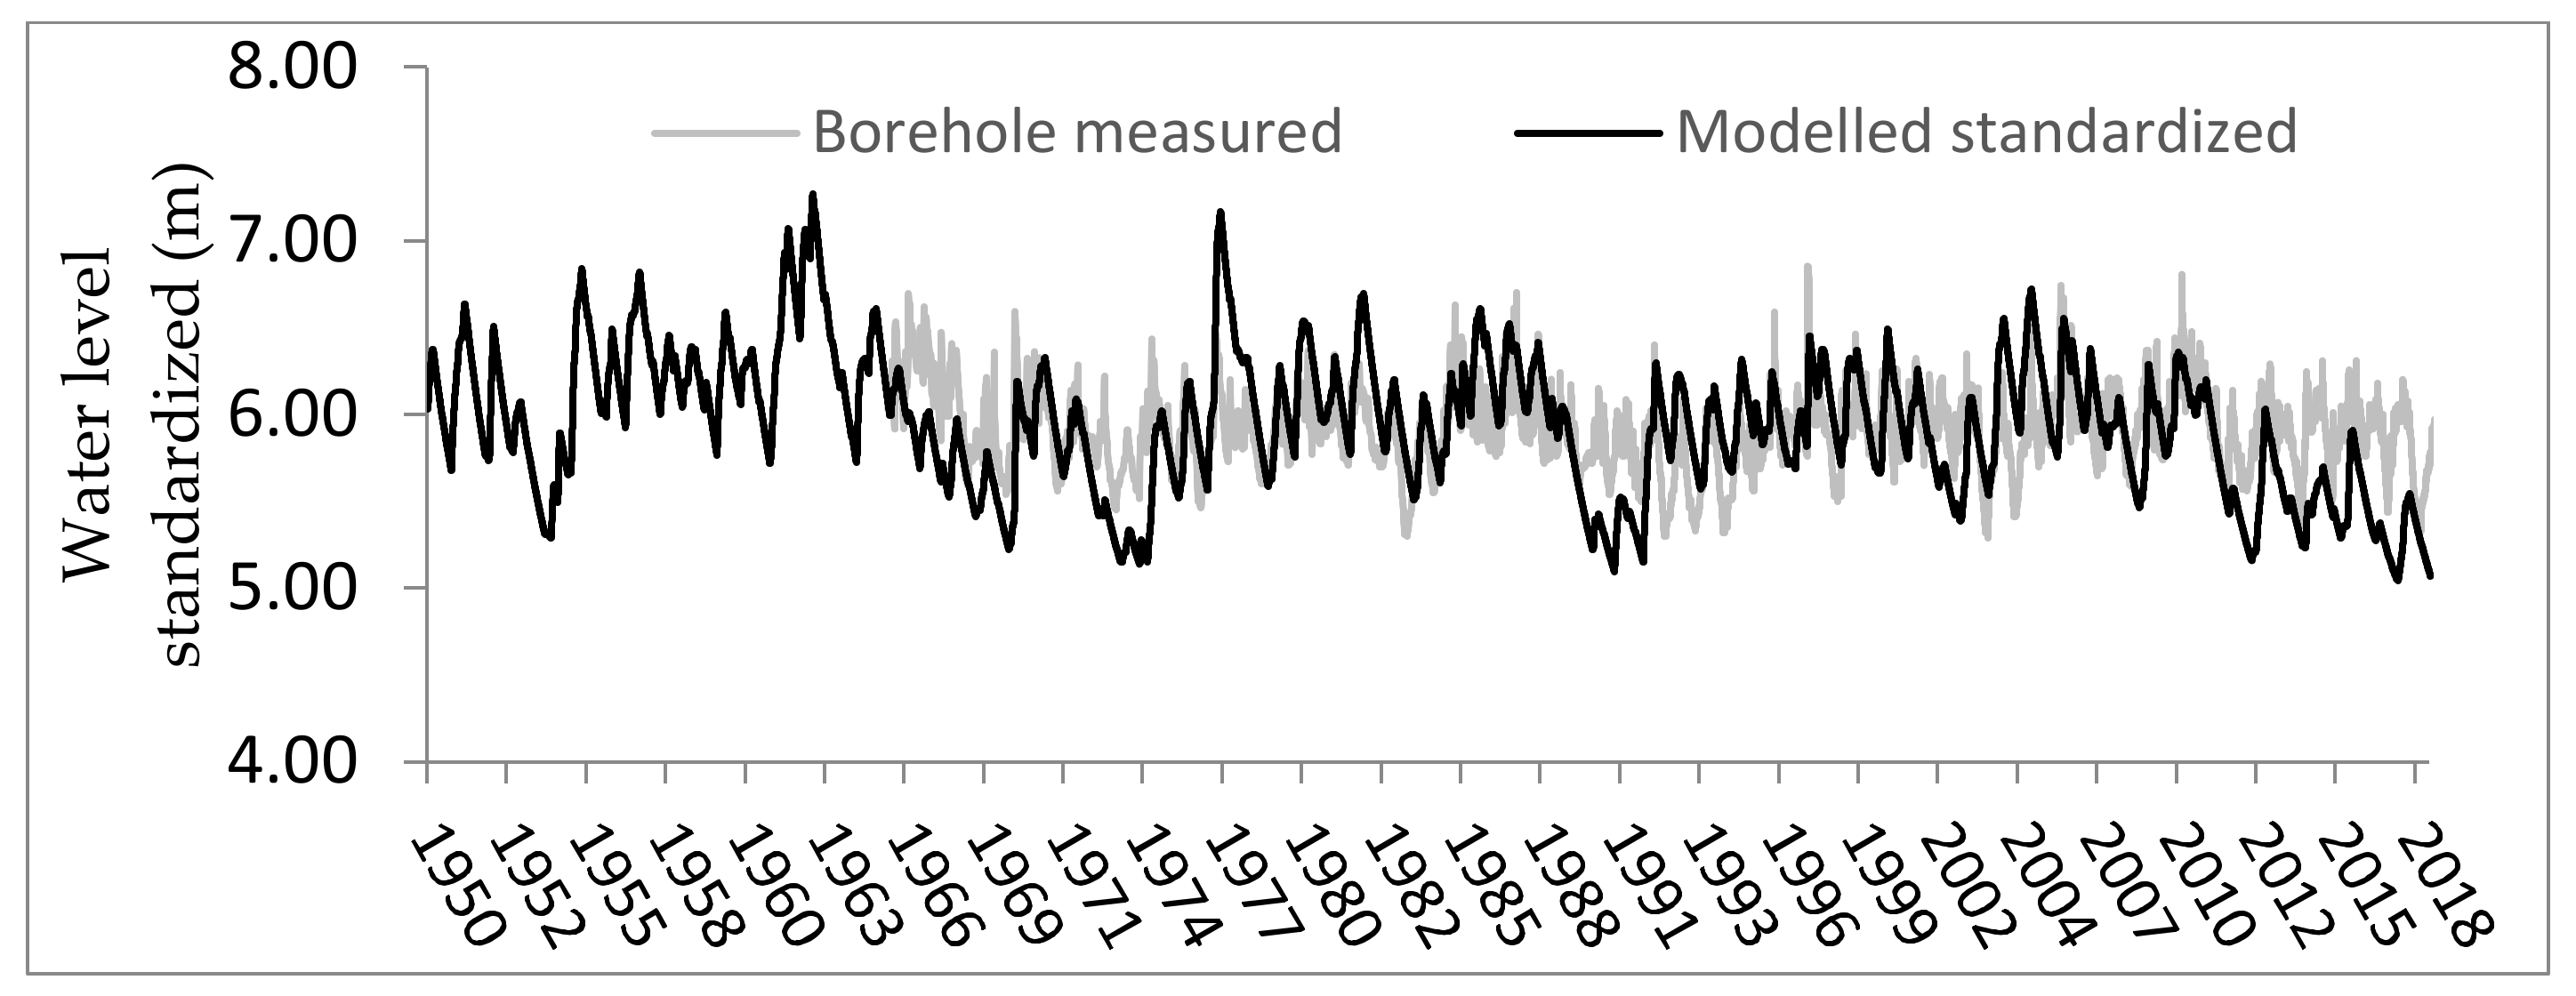
3.3. Long-Term Groundwater Evaluation

Modelled groundwater and measured borehole depths display a similar temporal pattern (Figure 7).
The two depths could be related using the following regression equation between the groundwater depth in the borehole to the area weighted water depth for the two modelled stand types (deciduous and coniferous) in the deepest PERSiST bucket:
GW Borehole   =   0.0146   ×   0.21   ×   GW Deciduous   +   168   +   0.79   ×   GW Conifer   +   153 ;   R 2   =   0.50
where GWBorehole is the measured depth to water in the borehole, GWDeciduous and GWConifer are the modelled depths to groundwater from PERSiST and 0.21 and 0.79 represent the relative areas of deciduous and coniferous stands in the Útěchov catchment. Both the observed groundwater levels and the long-term PERSIST simulated groundwater series show similar inter-annual variability. The long term groundwater data show a rapid decline in the water table level since 2010 (ca. 3 mm yr−1). The comparison between measured (from the borehole) and modelled (from the reference catchment via PERSiST) groundwater data shows the power of the calibration and the potential of the model (Figure 7). When standardized to the initial borehole measurement from 3/11/1965 to enable visual comparison, both of the trend lines show similar patterns of temporal variation indicative of a drying of the landscape in recent decades.

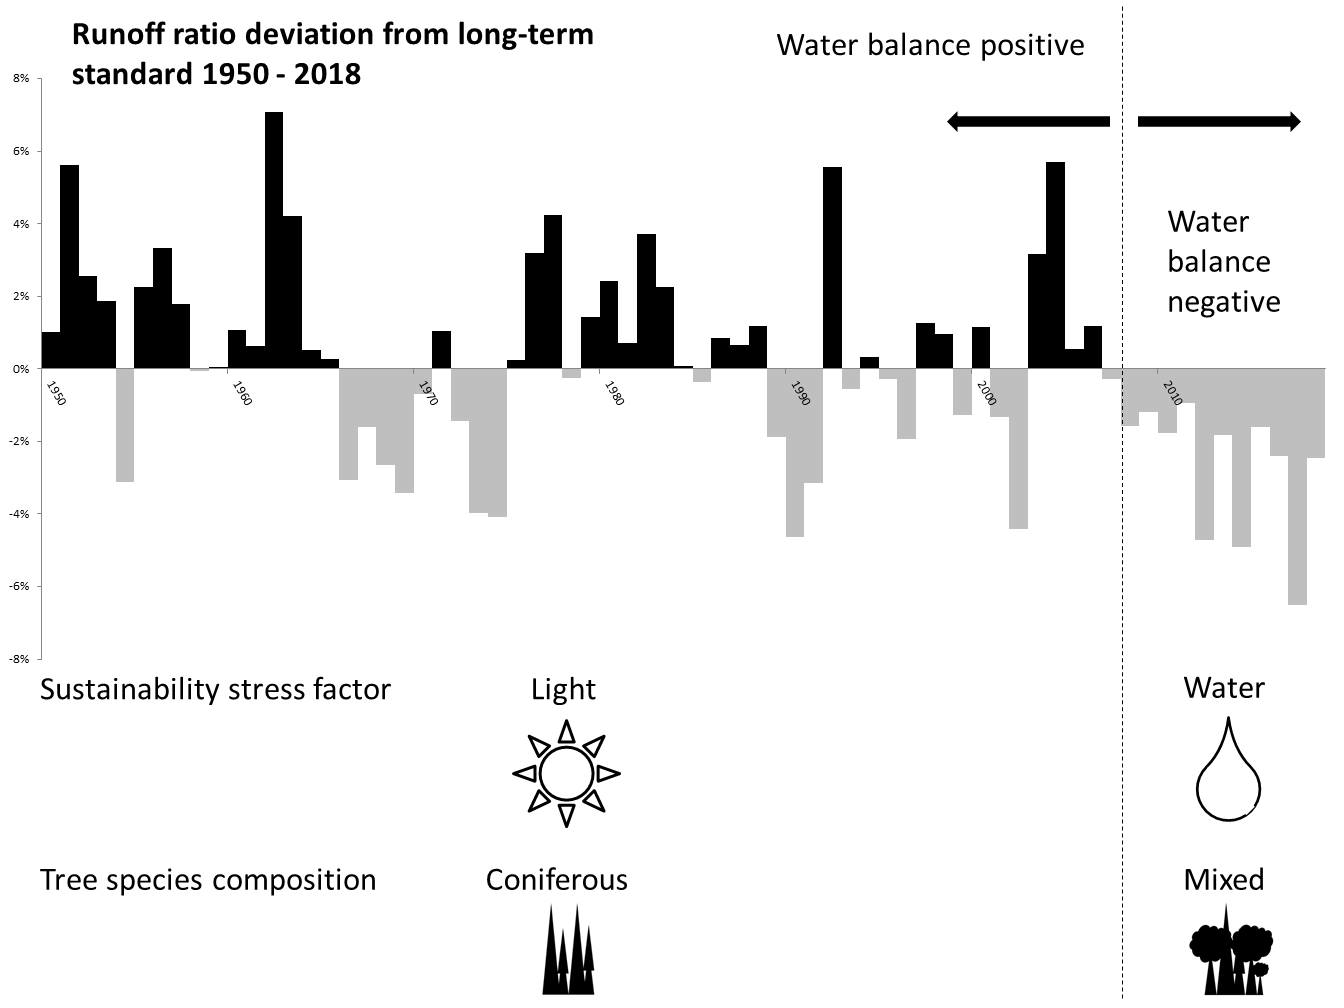
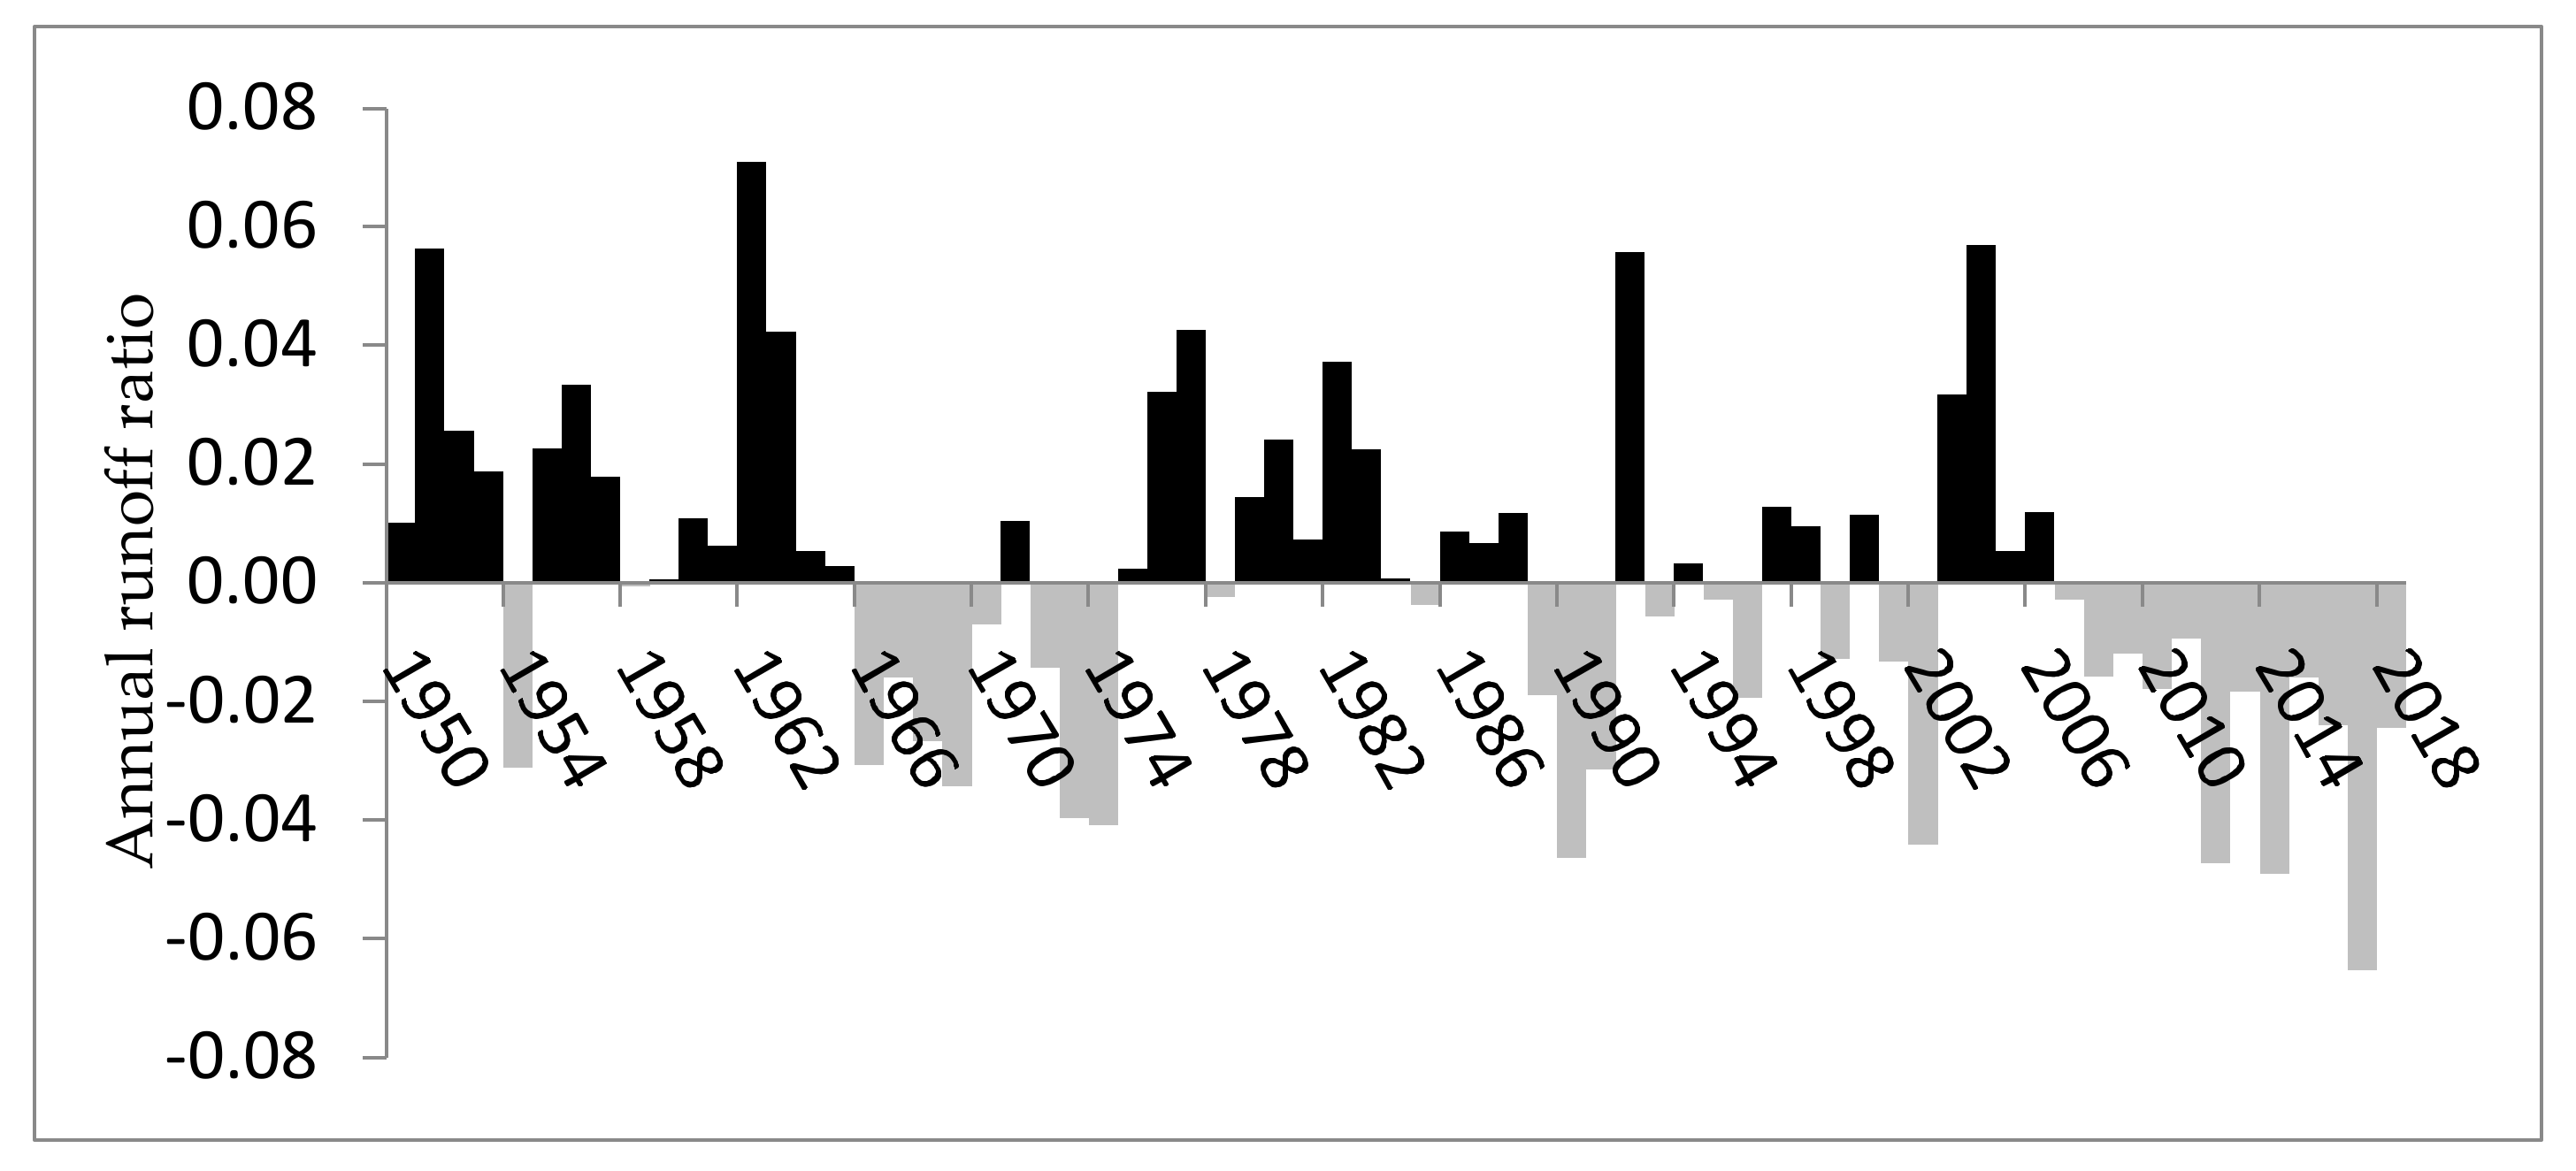
3.4. The Hydrological Regime Shift

The deviation of annual runoff ratio (runoff/precipitation) from the long term mean value (0.148) suggests that during recent decades, the landscape has been drying out to a degree that has not been experienced within living memory (Figure 8). This ongoing shift in the water balance with a steady decline in runoff ratios suggests that a long term hydrological regime shift is occurring in the forested uplands of central Europe and that the region is moving from a positive to a negative water balance.

4. Discussion

4.1. Long-Term Climate Evaluation

Since 1950, there has been a long-term warming trend at the study site manifested as an upward trend in growing degree days. This began in 1980, earlier than a previously reported climate breakpoint in 1984 [13]. At the same time, there has been no interpretable directional change in either annual or monthly precipitation.
Growing season water deficits have developed in the last decade. Total annual water loss is currently greater than precipitation and recharge only occurs during the dormant season. This is in accordance with earlier studies [2,7,37], which had focused more on general landscapes instead of specifically on forests. Our findings are also consistent with other studies documenting an increase in summer drought severity but little change in winter droughts [36]. The length of the forest growing season (mostly for coniferous tree species) has increased in recent years, especially because of mild winters and lack of frozen ground [29]. With the exception of drought years (i.e., 1953 and 1966), there was enough water to recharge the system during the dormant season to sustain groundwater levels. After 2007, a tipping point was crossed in the study region. Groundwater recharge declined, likely due to warmer winters and a longer vegetation season. This lack of recharge is occurring much earlier than suggested by modelling studies [32,34], which implied that deficits would not be observed before the middle of this century. It is, however, consistent with observations of slowly drying conditions observed elsewhere in the Czech Republic [17,18,19]. While it is true that more severe droughts have occurred over the past millennium [71] and the main forest-forming species have survived, the forest structure and species composition prior to the adoption of present day silviculture was very different, more natural and resilient. In our research we focused on current cultivated production forests with altered structure and species composition where the ongoing drying might have more severe consequences.

4.2. PERSiST Validity-Short Term Measuring Campaign Is Able to Reproduce Long Term Water Balance Changes

The modelling results driven by gridded climate data presented here suggest that short-term calibrations based on multiple observed time series can be leveraged to derive credible long term projections. The short term measuring campaign during the 2016 growing season provided sufficient data for robust model calibration and validation. Using measurements of streamflow, transpiration, and soil moisture, we were able to successfully constrain the parameter space. Even though the goodness of fit was only 50%, we still think it is noteworthy that we were able to get half of the signal corroborative to the closest possible borehole from the same river basin. The shared signal shows that both of them are driven by similar forces and it can be viewed as an independent test of the groundwater model. At the same time, given the differences of the borehole and the Útěchov reference catchment (localization, land cover) a lower goodness of fit is to be expected. It is especially noteworthy that the short term simulation was able to reproduce both the pattern in the long-term borehole measurements and the historic drought in 1953. This suggests that short term hydrological model applications based on short calibration series may still be informative for projecting possible future conditions.
Gridded climate data can be superior to instrumental records for hydrological simulations [72]. However, there is the potential for gridded products to miss localized, hydrologically important events such as the storm early in July 2016 which was seen in both the instrumental precipitation measurements and in streamflow (Supplementary Figure S3).
There may be regional differences in both drought onset and severity. The modelled values indicate even faster water depletion in the Útěchov reference catchment than are observed in the borehole. The borehole is located in the flood plain of the Svitava river basin, 20 km upstream and at a lower elevation from the Útěchov reference catchment. The observed slower water depletion in the borehole may be a result of deep (5.89 m on average) groundwater recharge in the flood plain which is able to temporarily buffer the drought seen in the uplands as opposed to the Útěchov headwater catchment with shallow soil profile represented by the modelled soil horizon (ca up to 70 cm). At the same time, the borehole is located at the edge of a field of arable land as opposed to the forested reference catchment. It is possible that agricultural drainage systems are affecting the observed water depth in the borehole, while no drainage is present in the forested catchment. Moreover, the different temporal dynamics of water depth under agricultural crops with annual rotation to forested land with higher annual transpiration demands is to be expected. Still, both sites share a common regional signal and the faster response to drought in the Útěchov catchment might be indicative of lesser resilience of the headwater upland regions.
Our results are comparable with regional drought simulations indicating a significant increase in soil droughts for southern Moravia [36] as well as a HYDRUS-1D model simulation of soil moisture in spruce, beech, and non-forest areas [73].
Our simple method reproduces the drought history identified by more complex modelling approaches, e.g., [2] who present a comprehensive reconstruction of drought in Central Europe, including the 1953 hydrologic drought experienced across much of the region. We arrive at much the same conclusions by a simpler method, suggesting that simpler methods such as the one presented here can work as well as more data-intensive approaches. Simple models and short calibration series can reliably reproduce analogous long-term hydrological patterns.
Following similar protocols to those developed by our group [58], we show that it is possible to calibrate to one year of observed data and credibly reproduce 70 years of hydrologic variation supported qualitatively by independent long-term groundwater level data and quantitatively by successful simulation of, for example, the 1953 drought.
Our approach, in which we use a short, data rich period for model calibration, is validated by long term observations carried out elsewhere in the region. For example, while small declines in runoff from a suite of Czech semi-natural forest headwater catchments have been observed between the early 1990s and 2011 [18], there has been limited change in the water balance of high elevation (above 1000 masl) sites [17].

4.3. Hydrological Regime Shift

It is clear that second order effects are important for long-term shifts in catchment hydrology. The Útěchov reference catchment, and presumably upland forests across central Europe are experiencing warmer temperatures but no significant changes in annual precipitation. The increase in catchment dryness is most likely the result of a shift in vegetation phenology driven by warmer temperatures, which allow for a longer growing season that in turn leads to a water balance regime shift. The current patterns in drought and the associated regime shifts are likely to continue as long as climate warms, regardless of what happens with rainfall. However, more extreme rainfall events have proportionately less infiltration, so the problem will likely become worse if rainfall intensity changes.
The future climate in the catchment is also quite uncertain. Typically, regional climate is described using Köppen–Geiger classification, which makes classifications on the basis of temperature and precipitation. Currently, the region is classified as “Dfb”, continental humid. The most likely future (2071–2100) Köppen–Geiger climate classification for the region is “Cfa”, humid, subtropical but there is a low degree of certainty (14/100) with this projection [53]. The future climate for the catchment may remain the same as present conditions shift to “Cfa” or to “Csa”, a Mediterranean-type climate [74]. It should be noted that Mediterranean climates have reduced precipitation during summer; this was not observed in the E-OBS dataset, which is based on instrumental measurements. As the climate classification is based solely on temperature and precipitation, it takes no account of second order effects on catchment water balances that are strongly affected by land use and dominant vegetation type. However, climate classification is a good indicator of the potential biomass. This means that the future expected climate might induce lower annual growth increments and forestry as it is currently practiced in the region might not be a viable option in the future.
Furthermore, meteorological indicators alone can give a poor indication of drought [75] and second order effects have to be considered. In this sense, forests seem to be one of the best indicators (better than arable land) of long-term landscape drying because of their semi-natural soil character and long growing cycle. While agricultural drought can be offset by just one year of sufficient precipitation, this can lead to a false sense of security as it would take years of surplus precipitation and/or precipitous declines in transpiration associated with catastrophic and widespread forest dieback to offset the soil moisture deficit experienced in the region since 2007.
Hydrological regime shifts may also have “knock on” effects, which alter carbon and nitrogen cycling [76]. If drought leads to increased forest dieback, forests will rapidly go from being carbon sinks to sources. This is likely to have profound consequences for national carbon inventories, as well as provide potential for commercial forestry in the Central European uplands.

5. Conclusions

Role of the Forests in Regional Hydrological Regime Shift-Transpiration Management Is the Key-Conclusion?

Forests play a critical role in local and regional scale hydrology [77]. Our study documents the hydrological response of a small catchment with coniferous and broadleaf forest stands over the past 70 years. We show that the ongoing increase in drought severity in forested uplands is likely related to an earlier onset of leaf out and consequent increases in transpiration. These trends in transpiration are different for coniferous and broadleaved tree species. Under current conditions, (trends in European climate development and current situation in forest management), it is apparent that the water stress will continue unless the management practice focuses primarily on transpiration control so that it is tuned the most effective way. While there have been earlier suggestions that the increase in atmospheric CO2 could contribute to reduced stomatal activity (e.g., [32]), recent studies suggest that increased transpiration will offset any reductions in stomatal activity [78]. Our modelled results strongly suggest that mere reduced stomatal activity is not enough for mitigating the negative effects of future drought in the forested uplands of Central Europe.
Recently, it seems that the resilience of uplands has been breached and production forests are dying. This can already be seen with for example, bark beetle calamities [79], forest dieback [70], and possibly fire [80]. The scale and extent of these calamities is alarming. The current loss of resilience in upland forests also poses a higher risk of biological invasions by alien species, better suited to summer droughts than European trees, e.g., Robinia pseudoacacia [81].
In European countries, where the annual allowable cut concept has been adopted (CR, Germany, France and others), sustainable forest management is based on the annual allowable cut being equivalent to the annual growth increment [82]. The total annual cut is predictable over the long term with a stable proportion of salvage and planned fellings. In the last 20 years in the CR, the total annual cut as well as the annual increment corresponded to 6–7 m3 ha−1 year−1 and the proportion of salvage and planned fellings to 30:70 if no calamities occurred (Green Reports of the Czech Republic 1999–2019). In 2018 and 2019, the proportion of salvage fellings caused by the bark beetle calamity associated with drought has reached an alarming 90 and 95%, respectively. The total annual cut in these two years reached 9.61 and 12.18 m3/ha/year, thus significantly exceeding the sustainable amount of the annual increment.
This again indicates that the central European upland production forests as they currently are, are quickly approaching or most possibly have already reached the tipping point of their survivability and that it is not a slow process, as currently believed [15,32,34].
According to our results, to sustain future forest ecosystem services, their production function and most notably their existence, a sophisticated and conscious control of the transpiration of cultivated forest stands will be necessary.

Supplementary Materials

The following are available online at https://www.mdpi.com/article/10.3390/f12121656/s1. Figure S1: The E-OBS Ombrothermic chart for the region 1950-2018, Table S1: Measured water balance components, Figure S2: Comparison between temperature in E-OBS and instrumental measurements, Figure S3: Monthly precipitation comparison between E-OBS and instrumental, Figure S4: Calibration Time Series, Figure S5: Long term PERSiST runoff simulation and observed runoff, Figure S6: The E-OBS temperature data (April), Figure S7: The E-OBS precipitation data (April and September), Table S2: Linear trends in annual modelled water balance components.

Author Contributions

Conceptualization, P.K., J.D., and M.F.; methodology, J.D.; software, J.D. and M.F.; validation, M.F., P.K., and J.D.; formal analysis, J.D.; investigation, J.D.; resources, J.D. and P.K.; data curation, M.F.; writing—original draft preparation, J.D.; writing—review and editing, P.K. and M.F.; visualization, J.D.; supervision, M.F.; project administration, J.D.; funding acquisition, J.D. All authors have read and agreed to the published version of the manuscript.

Funding

This research was funded by Internal Grant Agency (IGA) of the Faculty of Forestry and Wood Technology (FFWT) of Mendel University in Brno as part of the project LDF_TP_2019002.

Data Availability Statement

Data is available from the authors on request.

Acknowledgments

We acknowledge the E-OBS dataset from the EU-FP6 project UERRA (http://www.uerra.eu, accessed on 10 September 2020) and the data providers in the ECA & D project (https://www.ecad.eu, accessed on 10 September 2020). J.D. was supported by project “Strengthening and development of inventive activities at the Faculty of Forestry and Wood technology Mendel University in Brno by creating post-doc positions-project 7.1 of Institutional plan of Mendel university 2019−2020” and the Internal Grant Agency (IGA) of the Faculty of Forestry and Wood Technology (FFWT) of Mendel University in Brno as part of the project LDF_TP_2019009. MF was supported by the SLU Faculty of Natural Resources and Agricultural Sciences.

Conflicts of Interest

The authors declare no conflict of interest. The funders had no role in the design of the study, in the collection, analyses, or interpretation of data, in the writing of the manuscript, or in the decision to publish the results.

References

  1. Anders, I.; Stagl, J.; Auer, I.; Pavlik, D. Climate Change in Central and Eastern Europe. In Managing Protected Areas in Central and Eastern Europe under Climate Change; Springer: Dordrecht, The Netherlands, 2014; pp. 17–30. [Google Scholar]
  2. Moravec, V.; Markonis, Y.; Rakovec, O.; Kumar, R.; Hanel, M. A 250-Year European Drought Inventory Derived From Ensemble Hydrologic Modeling. Geophys. Res. Lett. 2019, 46, 5909–5917. [Google Scholar] [CrossRef]
  3. Brázdil, R.; Dobrovolný, P.; Trnka, M.; Kotyza, O.; Řezníčková, L.; Valášek, H.; Zahradníček, P.; Štěpánek, P. Droughts in the Czech Lands, 1090–2012 AD. Clim. Past 2013, 9, 1985–2002. [Google Scholar] [CrossRef] [Green Version]
  4. Brázdil, R.; Trnka, M.; Mikšovský, J.; Řezníčková, L.; Dobrovolný, P. Spring-summer droughts in the Czech Land in 1805–2012 and their forcings. Int. J. Climatol. 2015, 35, 1405–1421. [Google Scholar] [CrossRef]
  5. Potopová, V.; Boroneanţ, C.; Možný, M.; Soukup, J. Driving role of snow cover on soil moisture and drought development during the growing season in the Czech Republic. Int. J. Clim. 2015, 36, 3741–3758. [Google Scholar] [CrossRef] [Green Version]
  6. Trnka, M.; Brazdil, R.; Balek, J.; Semeradova, D.; Hlavinka, P.; Možný, M.; Stěpanek, P.; Dobrovolný, P.; Zahradnicek, P.; Dubrovský, M.; et al. Drivers of soil drying in the Czech Republic between 1961 and 2012. Int. J. Clim. 2015, 35, 2664–2675. [Google Scholar] [CrossRef]
  7. Trnka, M.; Balek, J.; Štěpánek, P.; Zahradníček, P.; Možný, M.; Eitzinger, J.; Žalud, Z.; Formayer, H.; Turňa, M.; Nejedlík, P.; et al. Drought trends over part of Central Europe between 1961 and 2014. Clim. Res. 2016, 70, 143–160. [Google Scholar] [CrossRef] [Green Version]
  8. Sippel, S.; Forkel, M.; Rammig, A.; Thonicke, K.; Flach, M.; Heimann, M.; Otto, F.E.L.; Reichstein, M.; Mahecha, M. Contrasting and interacting changes in simulated spring and summer carbon cycle extremes in European ecosystems. Environ. Res. Lett. 2017, 12, 75006. [Google Scholar] [CrossRef]
  9. Samaniego, L.; Thober, S.; Kumar, R.; Wanders, N.; Rakovec, O.; Pan, M.; Zink, M.; Sheffield, J.; Wood, E.F.; Marx, A. Anthropogenic warming exacerbates European soil moisture droughts. Nat. Clim. Chang. 2018, 8, 421–426. [Google Scholar] [CrossRef]
  10. Buermann, W.; Forkel, M.; O’Sullivan, M.; Sitch, S.; Friedlingstein, P.; Haverd, V.; Jain, A.K.; Kato, E.; Kautz, M.; Lienert, S.; et al. Widespread seasonal compensation effects of spring warming on northern plant productivity. Nature 2018, 562, 110–114. [Google Scholar] [CrossRef] [Green Version]
  11. Lian, X.; Piao, S.; Li, L.Z.X.; Li, Y.; Huntingford, C.; Ciais, P.; Cescatti, A.; Janssens, I.A.; Peñuelas, J.; Buermann, W.; et al. Summer soil drying exacerbated by earlier spring greening of northern vegetation. Sci. Adv. 2020, 6, eaax0255. [Google Scholar] [CrossRef] [Green Version]
  12. Menzel, A.; Yuan, Y.; Matiu, M.; Sparks, T.; Scheifinger, H.; Gehrig, R.; Estrella, N. Climate change fingerprints in recent European plant phenology. Glob. Chang. Biol. 2020, 26, 2599–2612. [Google Scholar] [CrossRef] [Green Version]
  13. Geng, X.; Fu, Y.H.; Hao, F.; Zhou, X.; Zhang, X.; Yin, G.; Vitasse, Y.; Piao, S.; Niu, K.; De Boeck, H.J.; et al. Climate warming increases spring phenological differences among temperate trees. Glob. Chang. Biol. 2020, 26, 5979–5987. [Google Scholar] [CrossRef]
  14. Donnelly, C.; Greuell, W.; Andersson, J.; Gerten, D.; Pisacane, G.; Roudier, P.; Ludwig, F. Impacts of climate change on European hydrology at 1.5, 2 and 3 degrees mean global warming above preindustrial level. Clim. Chang. 2017, 143, 13–26. [Google Scholar] [CrossRef] [Green Version]
  15. Spinoni, J.; Naumann, G.; Vogt, J. Pan-European seasonal trends and recent changes of drought frequency and severity. Glob. Planet. Chang. 2017, 148, 113–130. [Google Scholar] [CrossRef]
  16. Spinoni, J.; Vogt, J.V.; Naumann, G.; Barbosa, P.; Dosio, A. Will drought events become more frequent and severe in Europe? Int. J. Climatol. 2018, 38, 1718–1736. [Google Scholar] [CrossRef] [Green Version]
  17. Langhammer, J.; Bernsteinová, J. Which Aspects of Hydrological Regime in Mid-Latitude Montane Basins Are Affected by Climate Change? Water 2020, 12, 2279. [Google Scholar] [CrossRef]
  18. Lamačová, A.; Hruška, J.; Kram, P.; Stuchlik, E.; Farda, A.; Chuman, T.; Fottová, D. Runoff trends analysis and future projections of hydrological patterns in small forested catchments. Soil Water Res. 2014, 9, 169–181. [Google Scholar] [CrossRef] [Green Version]
  19. Vlach, V.; Ledvinka, O.; Matouskova, M. Changing Low Flow and Streamflow Drought Seasonality in Central European Headwaters. Water 2020, 12, 3575. [Google Scholar] [CrossRef]
  20. Hobbs, J.J. World Regional Geography; Nelson Education Ltd.: Toronto, ON, Canada, 2008. [Google Scholar]
  21. Neary, D.G.; Ice, G.G.; Jackson, C.R. Linkages between forest soils and water quality and quantity. For. Ecol. Manag. 2009, 258, 2269–2281. [Google Scholar] [CrossRef]
  22. Postel, S.; Bawa, K.; Kaufman, L.; Peterson, C.H.; Carpenter, S.; Tillman, D.; Dayton, P.; Alexander, S.; Lagerquist, K.; Goulder, L.; et al. The world’s forests and their ecosystem services. In Nature’s Services: Societal Dependence on Natural Ecosystems; Island Press: Washington, DC, USA, 1997; pp. 215–235. [Google Scholar]
  23. Reyer, C.P.O.; Brouwers, N.; Rammig, A.; Brook, B.; Epila, J.; Grant, R.; Holmgren, M.; Langerwisch, F.; Leuzinger, S.; Lucht, W.; et al. Forest resilience and tipping points at different spatio-temporal scales: Approaches and challenges. J. Ecol. 2015, 103, 5–15. [Google Scholar] [CrossRef] [Green Version]
  24. Dobor, L.; Hlásny, T.; Rammer, W.; Zimová, S.; Barka, I.; Seidl, R. Is salvage logging effectively dampening bark beetle outbreaks and preserving forest carbon stocks? J. Appl. Ecol. 2020, 57, 67–76. [Google Scholar] [CrossRef]
  25. Food and Agriculture Organisation (FAO). Global Forest Resources Assessments. Country Reports 2020. Available online: http://www.fao.org/forest-resources-assessment/fra-2020/country-reports/en/ (accessed on 15 January 2021).
  26. Bałazy, R.; Zasada, M.; Ciesielski, M.; Waraksa, P.; Zawiła-Niedźwiecki, T. Forest dieback processes in the Central European Mountains in the context of terrain topography and selected stand attributes. For. Ecol. Manag. 2019, 435, 106–119. [Google Scholar] [CrossRef]
  27. Linderholm, H.W. Growing season changes in the last century. Agric. For. Meteorol. 2006, 137, 1–14. [Google Scholar] [CrossRef]
  28. Vitasse, Y.; François, C.; Delpierre, N.; Dufrêne, E.; Kremer, A.; Chuine, I.; Delzon, S. Assessing the effects of climate change on the phenology of European temperate trees. Agric. For. Meteorol. 2011, 151, 969–980. [Google Scholar] [CrossRef]
  29. Kolář, T.; Giagli, K.; Trnka, M.; Bednářová, E.; Vavrčík, H.; Rybníček, M. Response of the leaf phenology and tree-ring width of European beech to climate variability. Silva Fenn. 2016, 50, 1520. [Google Scholar] [CrossRef] [Green Version]
  30. Sevanto, S.; Suni, T.; Pumpanen, J.; Grönholm, T.; Kolari, P.; Nikinmaa, E.; Hari, P.; Vesala, T. Wintertime photosynthesis and water uptake in a boreal forest. Tree Physiol. 2006, 26, 749–757. [Google Scholar] [CrossRef] [PubMed] [Green Version]
  31. Clausnitzer, F.; Köstner, B.; Schwärzel, K.; Bernhofer, C. Relationships between canopy transpiration, atmospheric conditions and soil water availability—Analyses of long-term sap-flow measurements in an old Norway spruce forest at the Ore Mountains/Germany. Agric. For. Meteorol. 2011, 151, 1023–1034. [Google Scholar] [CrossRef]
  32. Eckhardt, K.; Ulbrich, U. Potential impacts of climate change on groundwater recharge and streamflow in a central European low mountain range. J. Hydrol. 2003, 284, 244–252. [Google Scholar] [CrossRef]
  33. Hanel, M.; Kašpárek, L.; Peláková, M.; Beran, A.; Vizina, A. Evaluation of Changes in Deficit Volumes: Support for Protection of Localities Suitable for Construction of Reservoirs. In Considering Hydrological Change in Reservoir Planning and Management; Schumann, A., Ed.; IAHS Press: Wallingford, UK, 2013; pp. 187–192. [Google Scholar]
  34. Neukum, C.; Azzam, R. Impact of climate change on groundwater recharge in a small catchment in the Black Forest, Germany. Hydrogeol. J. 2012, 20, 547–560. [Google Scholar] [CrossRef]
  35. Farkas, C.; Gelybó, G.; Bakacsi, Z.; Horel, Á.; Hagyó, A.; Dobor, L.; Kása, I.; Tóth, E. Impact of expected climate change on soil water regime under different vegetation conditions. Biologia 2014, 69, 1510–1519. [Google Scholar] [CrossRef]
  36. Řehoř, J.; Brázdil, R.; Trnka, M.; Řezníčková, L.; Balek, J.; Možný, M. Regional effects of synoptic situations on soil drought in the Czech Republic. Theor. Appl. Climatol. 2020, 141, 1383–1400. [Google Scholar] [CrossRef]
  37. Hanel, M.; Vizina, A.; Máca, P.; Pavlásek, J. A Multi-Model Assessment of Climate Change Impact on Hydrological Regime in the Czech Republic. J. Hydrol. Hydromech. 2012, 60, 152–161. [Google Scholar] [CrossRef] [Green Version]
  38. Lamačová, A.; Hruška, J.; Trnka, M.; Štěpánek, P.; Zahradníček, P.; Meitner, J.; Farda, A. Modelling future hydrological pattern in a Bohemian Forest headwater catchment. Silva Gabreta 2018, 24, 47–67. [Google Scholar]
  39. Dittmar, C.; Zech, W.; Elling, W. Growth variations of common beech (Fagus sylvatica L.) under different climatic and environmental conditions in Europe—A dendroecological study. For. Ecol. Manag. 2003, 173, 63–78. [Google Scholar] [CrossRef]
  40. Ritter, E.; Dalsgaard, L.; Einhorn, K.S. Light, temperature and soil moisture regimes following gap formation in a semi-natural beech-dominated forest in Denmark. For. Ecol. Manag. 2005, 206, 15–33. [Google Scholar] [CrossRef]
  41. Barrette, M.; Thiffault, N.; Barrette, M.; Bélanger, L.; LeDuc, A.; Chalifour, D. Key ecosystem attributes and productivity of boreal stands 20 years after the onset of silviculture scenarios of increasing intensity. For. Ecol. Manag. 2017, 389, 404–416. [Google Scholar]
  42. Čater, M.; Diaci, J. Divergent response of European beech, silver fir and Norway spruce advance regeneration to increased light levels following natural disturbance. For. Ecol. Manag. 2017, 399, 206–212. [Google Scholar] [CrossRef]
  43. Bréda, N.; Huc, R.; Granier, A.; Dreyer, E. Temperate forest trees and stands under severe drought: A review of ecophysiological responses, adaptation processes and long-term consequences. Ann. For. Sci. 2006, 63, 625–644. [Google Scholar] [CrossRef] [Green Version]
  44. Overbeck, M.; Schmidt, M. Modelling infestation risk of Norway spruce by Ips typographus (L.) in the Lower Saxon Harz Mountains (Germany). For. Ecol. Manag. 2012, 266, 115–125. [Google Scholar] [CrossRef]
  45. Toth, D.; Maitah, M.; Maitah, K.; Jarolínová, V. The Impacts of Calamity Logging on the Development of Spruce Wood Prices in Czech Forestry. Forests 2020, 11, 283. [Google Scholar] [CrossRef] [Green Version]
  46. European Environment Agency (EEA). European Forest Types. Categories and Types for Sustainable Forest Management Reporting and Policy, 2nd ed.; European Environment Agency: Copenhagen, Denmark, 2007.
  47. Puumalainen, J. Structural, Compositional and Functional Aspects of Forest Biodiversity in Europe. Geneva Timber and Forest Discussion Papers; United Nations Economic Commission for Europe (UNECE): Geneva, Switzerland; Food and Agriculture Organisation (FAO): Rome, Italy, 2001. [Google Scholar]
  48. Pukkala, T. Plenterwald, Dauerwald, or clearcut? For. Policy Econ. 2016, 62, 125–134. [Google Scholar] [CrossRef]
  49. Schütz, J.P.; Saniga, M.; Diaci, J.; Vrška, T. Comparing close-to-naturesilviculture with processes in pristine forests: Lessons from Central Europe. Ann. For. Sci. 2006, 73, 911–921. [Google Scholar] [CrossRef] [Green Version]
  50. Futter, M.N.; Erlandsson, M.A.; Butterfield, D.; Whitehead, P.G.; Oni, S.K.; Wade, A.J. PERSiST: A flexible rainfall-runoff modelling toolkit for use with the INCA family of models. Hydrol. Earth Syst. Sci. 2004, 18, 855–873. [Google Scholar] [CrossRef] [Green Version]
  51. Czech Hydrometeorological Institute. Available online: https://www.chmi.cz/historicka-data/pocasi/uzemni-srazky?l=en (accessed on 2 July 2021).
  52. Czech Statistical Institute. Available online: https://www.google.com/url?sa=t&rct=j&q=&esrc=s&source=web&cd=&cad=rja&uact=8&ved=2ahUKEwiCpdzsyNDxAhVlg_0HHcObABUQFjAAegQIBRAD&url=https%3A%2F%2Fwww.czso.cz%2Fdocuments%2F11280%2F26041275%2FCR_CZ0640_3.pdf%2F5bfd5887-4a85-4255-8efc-fc71e2da6ff9%3Fversion%3D1.87&usg=AOvVaw3HOgdf5s8cG0NEC_U4kCwF (accessed on 2 July 2021).
  53. Beck, H.E.; Zimmermann, N.E.; McVicar, T.R.; Vergopolan, N.; Berg, A.; Wood, E.F. Present and future Köppen-Geiger climate classification maps at 1-km resolution. Sci. Data 2018, 5, 180214. [Google Scholar] [CrossRef] [Green Version]
  54. Kupec, P.; Libor, Š.; Deutscher, J. Tree species composition influences differences in water use efficiency of upland forested microwatersheds. Eur. J. For. Res. 2018, 137, 477–487. [Google Scholar]
  55. Deutscher, J.; Holík, L.; Kupec, P.; Marková, I.; Barašová, J.; Divín, J.; Holata, F.; Nezval, O.; Rosíková, J.; Školoud, L.; et al. Estimation of Basic Water-Balance Parameters of the Útěchov Forested Microwatershed. In Proceedings of the SilvaNet–WoodNet 2016: Proceedings Abstracts of Student Scientific Conference, Brno, Czech Republic, 14 November 2016, 1st ed.; Martinek, P., Prouza, M., Čermáková, V., Rozsypálek, J., Eds.; Mendelova Univerzita v Brně: Brno, Czech Republic, 2016; pp. 27–28. [Google Scholar]
  56. Čermák, J.; Kučera, J.; Nadezhdina, N. Sap flow measurements with some thermodynamic methods, flow integration within trees and scaling up from sample trees to entire forest stands. Trees 2004, 18, 529–546. [Google Scholar] [CrossRef]
  57. Haylock, M.R.; Hofstra, N.; Tank, A.K.; Klok, E.J.; Jones, P.; New, M. A European daily high-resolution gridded data set of surface temperature and precipitation for 1950–2006. J. Geophys. Res. Space Phys. 2008, 113, D20. [Google Scholar] [CrossRef] [Green Version]
  58. Deutscher, J.; Kupec, P.; Kučera, A.; Urban, J.; Ledesma, J.L.J.; Futter, M. Ecohydrological consequences of tree removal in an urban park evaluated using open data, free software and a minimalist measuring campaign. Sci. Total. Environ. 2019, 655, 1495–1504. [Google Scholar] [CrossRef]
  59. Lupon, A.; Ledesma, J.L.J.; Bernal, S. Riparian evapotranspiration is essential to simulate streamflow dynamics and water budgets in a Mediterranean catchment. Hydrol. Earth Syst. Sci. 2018, 22, 4033–4045. [Google Scholar] [CrossRef]
  60. Oudin, L.; Hervieu, F.; Michel, C.; Perrin, C.; Andréassian, V.; Anctil, F.; Loumagne, C. Which potential evapotranspiration input for a lumped rainfall–runoff model?: Part 2—Towards a simple and efficient potential evapotranspiration model for rainfall–runoff modelling. J. Hydrol. 2005, 303, 290–306. [Google Scholar] [CrossRef]
  61. Crossman, J.; Bussi, G.; Whitehead, P.G.; Butterfield, D.; Lannergård, E.; Futter, M.N. A New, Catchment-Scale Integrated Water Quality Model of Phosphorus, Dissolved Oxygen, Biochemical Oxygen Demand and Phytoplankton: INCA-Phosphorus Ecology (PEco). Water 2021, 13, 723. [Google Scholar] [CrossRef]
  62. Ledesma, J.L.; Köhler, S.J.; Futter, M.N. Long-term dynamics of dissolved organic carbon: Implications for drinking water supply. Sci. Total. Environ. 2012, 432, 1–11. [Google Scholar] [CrossRef]
  63. Seibert, J.; Mcdonnell, J. On the dialog between experimentalist and modeler in catchment hydrology: Use of soft data for multicriteria model calibration. Water Resour. Res. 2002, 38, 23-1–23-4. [Google Scholar] [CrossRef]
  64. Schume, H.; Jost, G.; Hager, H. Soil water depletion and recharge patterns in mixed and pure forest stands of European beech and Norway spruce. J. Hydrol. 2004, 289, 258–274. [Google Scholar] [CrossRef]
  65. Breda, N.; Granier, A.; Aussenac, G. Effects of thinning on soil and tree water relations, transpiration and growth in an oak forest (Quercus petraea (Matt.) Liebl.). Tree Physiol. 1995, 15, 295–306. [Google Scholar] [CrossRef]
  66. Alavi, G.; Jansson, P.-E.; Hällgren, J.-E.; Bergholm, J. Interception of a Dense Spruce Forest, Performance of a Simplified Canopy Water Balance Model. Hydrol. Res. 2011, 32, 265–284. [Google Scholar] [CrossRef] [Green Version]
  67. Treml, P. Nejvěštší sucha na území České Republiky v období let 1875–2010. Meteorol. Zprávy 2011, 64, 168. [Google Scholar]
  68. Spinoni, J.; Naumann, G.; Vogt, J.; Barbosa, P. The biggest drought events in Europe from 1950 to 2012. J. Hydrol. Reg. Stud. 2015, 3, 509–524. [Google Scholar] [CrossRef]
  69. Chmielewski, F.M.; Roetzer, T. Response of tree phenology to climate change across Europe. Agric. For. Meteorol. 2001, 108, 101–112. [Google Scholar] [CrossRef]
  70. Krejza, J.; Cienciala, E.; Světlík, J.; Bellan, M.; Noyer, E.; Horáček, P.; Štěpánek, P.; Marek, M.V. Evidence of climate-induced stress of Norway spruce along elevation gradient preceding the current dieback in Central Europe. Trees 2021, 35, 103–119. [Google Scholar] [CrossRef]
  71. Brázdil, R.; Kiss, A.; Luterbacher, J.; Nash, D.J.; Řezníčková, L. Documentary data and the study of the past droughts: An overview of the state of the art worldwide. Clim. Past Discuss. 2018, 118, 1–67. [Google Scholar]
  72. Ledesma, J.L.; Futter, M.N. Gridded climate data products are an alternative to instrumental measurements as inputs to rainfall-runoff models. Hydrol. Process. 2017, 31, 3283–3293. [Google Scholar] [CrossRef] [Green Version]
  73. Šípek, V.; Hnilica, J.; Vlček, L.; Hnilicová, S.; Tesař, M. Influence of vegetation type and soil properties on soil water dynamics in the Šumava Mountains (Southern Bohemia). J. Hydrol. 2020, 582, 124285. [Google Scholar] [CrossRef]
  74. Skalák, P.; Farda, A.; Zahradnicek, P.; Trnka, M.; Hlásny, T.; Stepanek, P. Projected shift of Köppen-Geiger zones in the central Europe: A first insight into the implications for ecosystems and the society. Int. J. Clim. 2018, 38, 3595–3606. [Google Scholar] [CrossRef]
  75. Bachmair, S.; Tanguy, M.; Hannaford, J.; Stahl, K. How well do meteorological indicators represent agricultural and forest drought across Europe? Environ. Res. Lett. 2018, 13, 34042. [Google Scholar] [CrossRef]
  76. Geβler, A.; Keitel, C.; Nahm, M.; Rennenberg, H. Water Shortage Affects the Water and Nitrogen Balance in Central European Beech Forests. Plant Biol. 2004, 6, 289–298. [Google Scholar] [CrossRef]
  77. Ellison, D.N.; Futter, M.; Bishop, K. On the forest cover–water yield debate: From demand-to supply-side thinking. Glob. Chang. Biol. 2012, 18, 806–820. [Google Scholar] [CrossRef] [Green Version]
  78. Frank, D.; Poulter, B.; Saurer, M.; Esper, J.; Huntingford, C.; Helle, G.; Treydte, K.; Zimmermann, N.; Schleser, G.H.; Ahlström, A.; et al. Water-use efficiency and transpiration across European forests during the Anthropocene. Nat. Clim. Chang. 2015, 5, 579–583. [Google Scholar] [CrossRef] [Green Version]
  79. Netherer, S.; Panassiti, B.; Pennerstorfer, J.; Matthews, B. Acute Drought Is an Important Driver of Bark Beetle Infestation in Austrian Norway Spruce Stands. Front. For. Glob. Chang. 2019, 2, 39. [Google Scholar] [CrossRef] [Green Version]
  80. Trnka, M.; Balek, J.; Možný, M.; Cienciala, E.; Čermák, P.; Semerádová, D.; Jurečka, F.; Hlavinka, P.; Štěpánek, P.; Farda, A.; et al. Observed and expected changes in wildfire-conducive weather and fire events in peri-urban zones and key nature reserves of the Czech Republic. Clim. Res. 2020, 82, 33–54. [Google Scholar] [CrossRef]
  81. Klisz, M.; Puchałka, R.; Netsvetov, M.; Prokopuk, Y.; Vítková, M.; Sádlo, J.; Matisons, R.; Mionskowski, M.; Chakraborty, D.; Olszewski, P.; et al. Variability in climate-growth reaction of Robinia pseudoacacia in Eastern Europe indicates potential for acclimatisation to future climate. For. Ecol. Manag. 2021, 492, 119194. [Google Scholar] [CrossRef]
  82. Vanclay, J.K. Allowable Cut in Forest Management. In Tropical Forestry Handbook; Pancel, L., Köhl, M., Eds.; Springer: Berlin/Heidelberg, Germany, 2014. [Google Scholar]
Figure 1. Localization of the study area.
Forests 12 01656 g001
Figure 2. Water balance components during the 2016 growing season. Daily measured precipitation (bars), streamflow (full line) and transpiration for conifers (dashed line) and deciduous (dotted line) stands. Note the different scale for precipitation.
Forests 12 01656 g002
Figure 3. Schematic of PERSiST model setup used in the simulations presented here.
Forests 12 01656 g003
Figure 4. Cumulative temperature in growing degree days (sum of mean daily temperatures on days with T > 4 °C) estimate from E-OBS v.21.e 0.25° gridded data.
Forests 12 01656 g004
Figure 5. Annual modelled water balance components since 1950. The solid line represents annual precipitation while the lower line shows annual streamflow. Dashed and dotted lines show evapotranspiration of deciduous and coniferous stands, respectively.
Forests 12 01656 g005
Figure 6. Cumulative temperature in growing degree days above 4 °C and cumulative annual water balance results. The two axes have been setup to enable visual comparison with no regard to their respective magnitudes.
Forests 12 01656 g006
Figure 7. Borehole measured depth and modelled depth to groundwater based on PERSiST simulated groundwater depths.
Forests 12 01656 g007
Figure 8. Deviation of annual runoff ratio (runoff/precipitation) from long term mean value (0.148).
Forests 12 01656 g008
Publisher’s Note: MDPI stays neutral with regard to jurisdictional claims in published maps and institutional affiliations.

