Article

Evaluation of Six Satellite-Based Terrestrial Latent Heat Flux Products in the Vegetation Dominated Haihe River Basin of North China

1
Jincheng Meteorological Administration, Jincheng 048026, China
2
Land Satellite Remote Sensing Application Center, Ministry of Natural Resource of the People’s Republic of China, Beijing 100048, China
3
State Key Laboratory of Remote Sensing Science, Faculty of Geographical Science, Beijing Normal University, Beijing 100875, China
4
Faculty of Geo-Information and Earth Observation (ITC), University of Twente, 7500 AE Enschede, The Netherlands
5
College of Resource Environment and Tourism, Capital Normal University, Beijing 100048, China
*
Author to whom correspondence should be addressed.
Forests 2021, 12(12), 1632; https://doi.org/10.3390/f12121632
Submission received: 25 October 2021 / Revised: 20 November 2021 / Accepted: 22 November 2021 / Published: 25 November 2021
(This article belongs to the Special Issue Forest Ecosystem Biogeochemical Cycling and Climate Change)

Abstract

:
In this study, six satellite-based terrestrial latent heat flux (LE) products were evaluated in the vegetation dominated Haihe River basin of North China. These LE products include Global Land Surface Satellite (GLASS) LE product, FLUXCOM LE product, Penman-Monteith-Leuning V2 (PML_V2) LE product, Global Land Evaporation Amsterdam Model datasets (GLEAM) LE product, Breathing Earth System Simulator (BESS) LE product, and Moderate Resolution Imaging Spectroradiometer (MODIS) (MOD16) LE product. Eddy covariance (EC) data collected from six flux tower sites and water balance method derived evapotranspiration (WBET) were used to evaluate these LE products at site and basin scales. The results indicated that all six LE products were able to capture the seasonal cycle of LE in comparison to EC observations. At site scale, GLASS LE product showed the highest coefficients of determination (R2) (0.58, p < 0.01) and lowest root mean square error (RMSE) (28.2 W/m2), followed by FLUXCOM and PML products. At basin scale, the LE estimates from GLASS product provided comparable performance (R2 = 0.79, RMSE = 18.8 mm) against WBET, compared with other LE products. Additionally, there was similar spatiotemporal variability of estimated LE from the six LE products. This study provides a vital basis for choosing LE datasets to assess regional water budget.

1. Introduction

The terrestrial latent heat flux (LE) is the heat exchange of water between the underlying surface and the atmosphere and mainly includes the evaporation of surface soil and water bodies, vegetation vaporization, and interception evaporation of plant canopy [1,2]. As the largest single source of heat in the atmosphere [3], LE is the surface evaporation energy source accounting for two-thirds of the annual global precipitation, which is of great significance in thermodynamic and climate dynamics [4,5]. Therefore, accurate knowledge of LE is vital to quantify the interaction between the land surface and atmosphere and guide surface water resources management [6,7]. The Haihe River basin (HRB), with more than 75% vegetation coverage, is one of the seven major basins of China and its internal Haihe River has brought enormous water vitality to agricultures and industries through agricultural irrigation, port transportation and fishery breeding. Although the HRB accounts for only 1.5% of the annual average water resources, it has an urgent need to meet the water requirements of 15% of population in China, which makes it a major water shortage region in Asia [8,9]. To understand the spatiotemporal variations of water consumption and improve water resource management in the HRB, the robust access of LE has become the focus of attention of various institutions and researchers, which would be helpful to maintain the healthy and sustainable development of regional economy [10].
Satellite remote sensing can obtain continuous spatial surface information in very short period and has played an increasingly important role in LE estimation at the regional scale [8,11,12]. In recent decades, with the development of satellite remote sensing technique for monitoring surface LE-related variables, there are many satellite-based LE models available including empirical regression models and physical models. The empirical regression methods are simple and operable, and have been widely applied to estimate regional and global LE [13,14,15]. Machine learning (ML) method has the excellent ability in prediction and has been widely used to generate LE products (i.e., WB-MTE [16]). Similarly, Bodesheim et al. used random forest methods to produce a global set of LE products and Jung et al. applied nine machine learning (9ML) models to develop FLUXCOM LE products [17,18]. Physical LE models include the surface energy balance models [19], the Penman-Monteith model [20,21], the Priestley-Taylor model [22,23], and temperature-vegetation index feature spatial model [24]. These physical models simulate the physical process of terrestrial LE and can be considered as the reliable methods to generate global LE products, such as the MOD16 LE product from the Moderate-resolution Imaging Spectroradiometer (MODIS) data released by National Aeronautics and Space Administration (NASA) [20,25], the Global Land Evapotranspiration Amsterdam Model (GLEAM) LE product [26,27], the Breathing Earth System Simulator (BESS) LE product [28,29], the Penman-Monteith-Leuning (PML)_V2 LE product [30], and the Global Land Surface Satellite (GLASS) LE product [31,32].
Although many satellite-based LE products show relative consistencies in temporal and spatial patterns, there are still substantial differences in inter-comparison and validation against in situ flux networks [33]. The study from the Global Soil Wetness Project-2 (GSWP-2) concluded that there were large discrepancies among 15 LE products and the differences of mean annual global LE were close to 50% [34]. Similarly, a comparison of eight satellite-based ET models over China showed that the mean annual ET of them varied from 535 to 852 mm year−1 [14]. Shang et al. also found substantial differences between five process-based and empirical/semi-empirical LE algorithms against ground based LE measurements over Europe [35]. The differences among these global or quasi-global LE products will be more obvious at regional or river basin scale [32,36]. As one of the inland river basins in northern China, the Heihe River basin also show large discrepancies in annual averaged ET from nine models, ranging from 80 to 229 mm year−1 [37]. Therefore, it is urgent to comprehensively assess the existing satellite-derived terrestrial LE products in Heihe River basin to inform their applications in local watershed water resources management.
Recently, the establishment of long-term EC flux tower networks (e.g., FLUXNET) has substantially advanced the evaluation of terrestrial LE. However, EC in situ measurements suffer from the energy imbalance problem, which leads to inaccuracies in the interpretations [38]. For ground-based validation, the scaling issue is also an important problem. The spatial scale mismatch between EC measurement coverage and satellite pixels may cause great uncertainties [37]. Furthermore, the observation periods of most EC sites are less than one decade, which is not conducive to the long-term evaluation [39]. Alternatively, the water balance method derived ET (WBET) can be used as a long-term LE evaluation method at basin scale [40]. WBET usually assumes that the change of total water storage (TWSC) is negligible during multi-years, which can be used as an indicator of long-term inter-annual change of LE at basin scale [41]. One the other hand, the TWSC from gravity recovery and Climate Experiment (GRACE) mission combined with water balance equation [42] can be used to calculate monthly LE and evapotranspiration (ET), which also facilitates the evaluation of monthly LE changes at basin scale. Therefore, there is a scope for multi-scale terrestrial LE evaluation by incorporating ground-based measurements and water balance method to improve the LE estimation in Haihe River Basin.
In this study, to understand the differences and uncertainties of multiple satellite-based LE products in Haihe River Basin, we evaluated six terrestrial LE products, including five process-based algorithms (PML-V2, BESS, GLEAM, MOD16, and GLASS) and a machine learning method (FLUXCOM). The objectives of this study includes: (1) To validate the accuracies of six LE products using EC flux tower observations; (2) To evaluate the performances of these LE products using water budget balance method at basin scale; (3) To compare the spatial distribution differences among these products by mapping the mean seasonal and annual terrestrial LE from 2013 to 2015 in the Haihe River basin of North China.

2. Materials and Methods

2.1. Study Area and Datasets
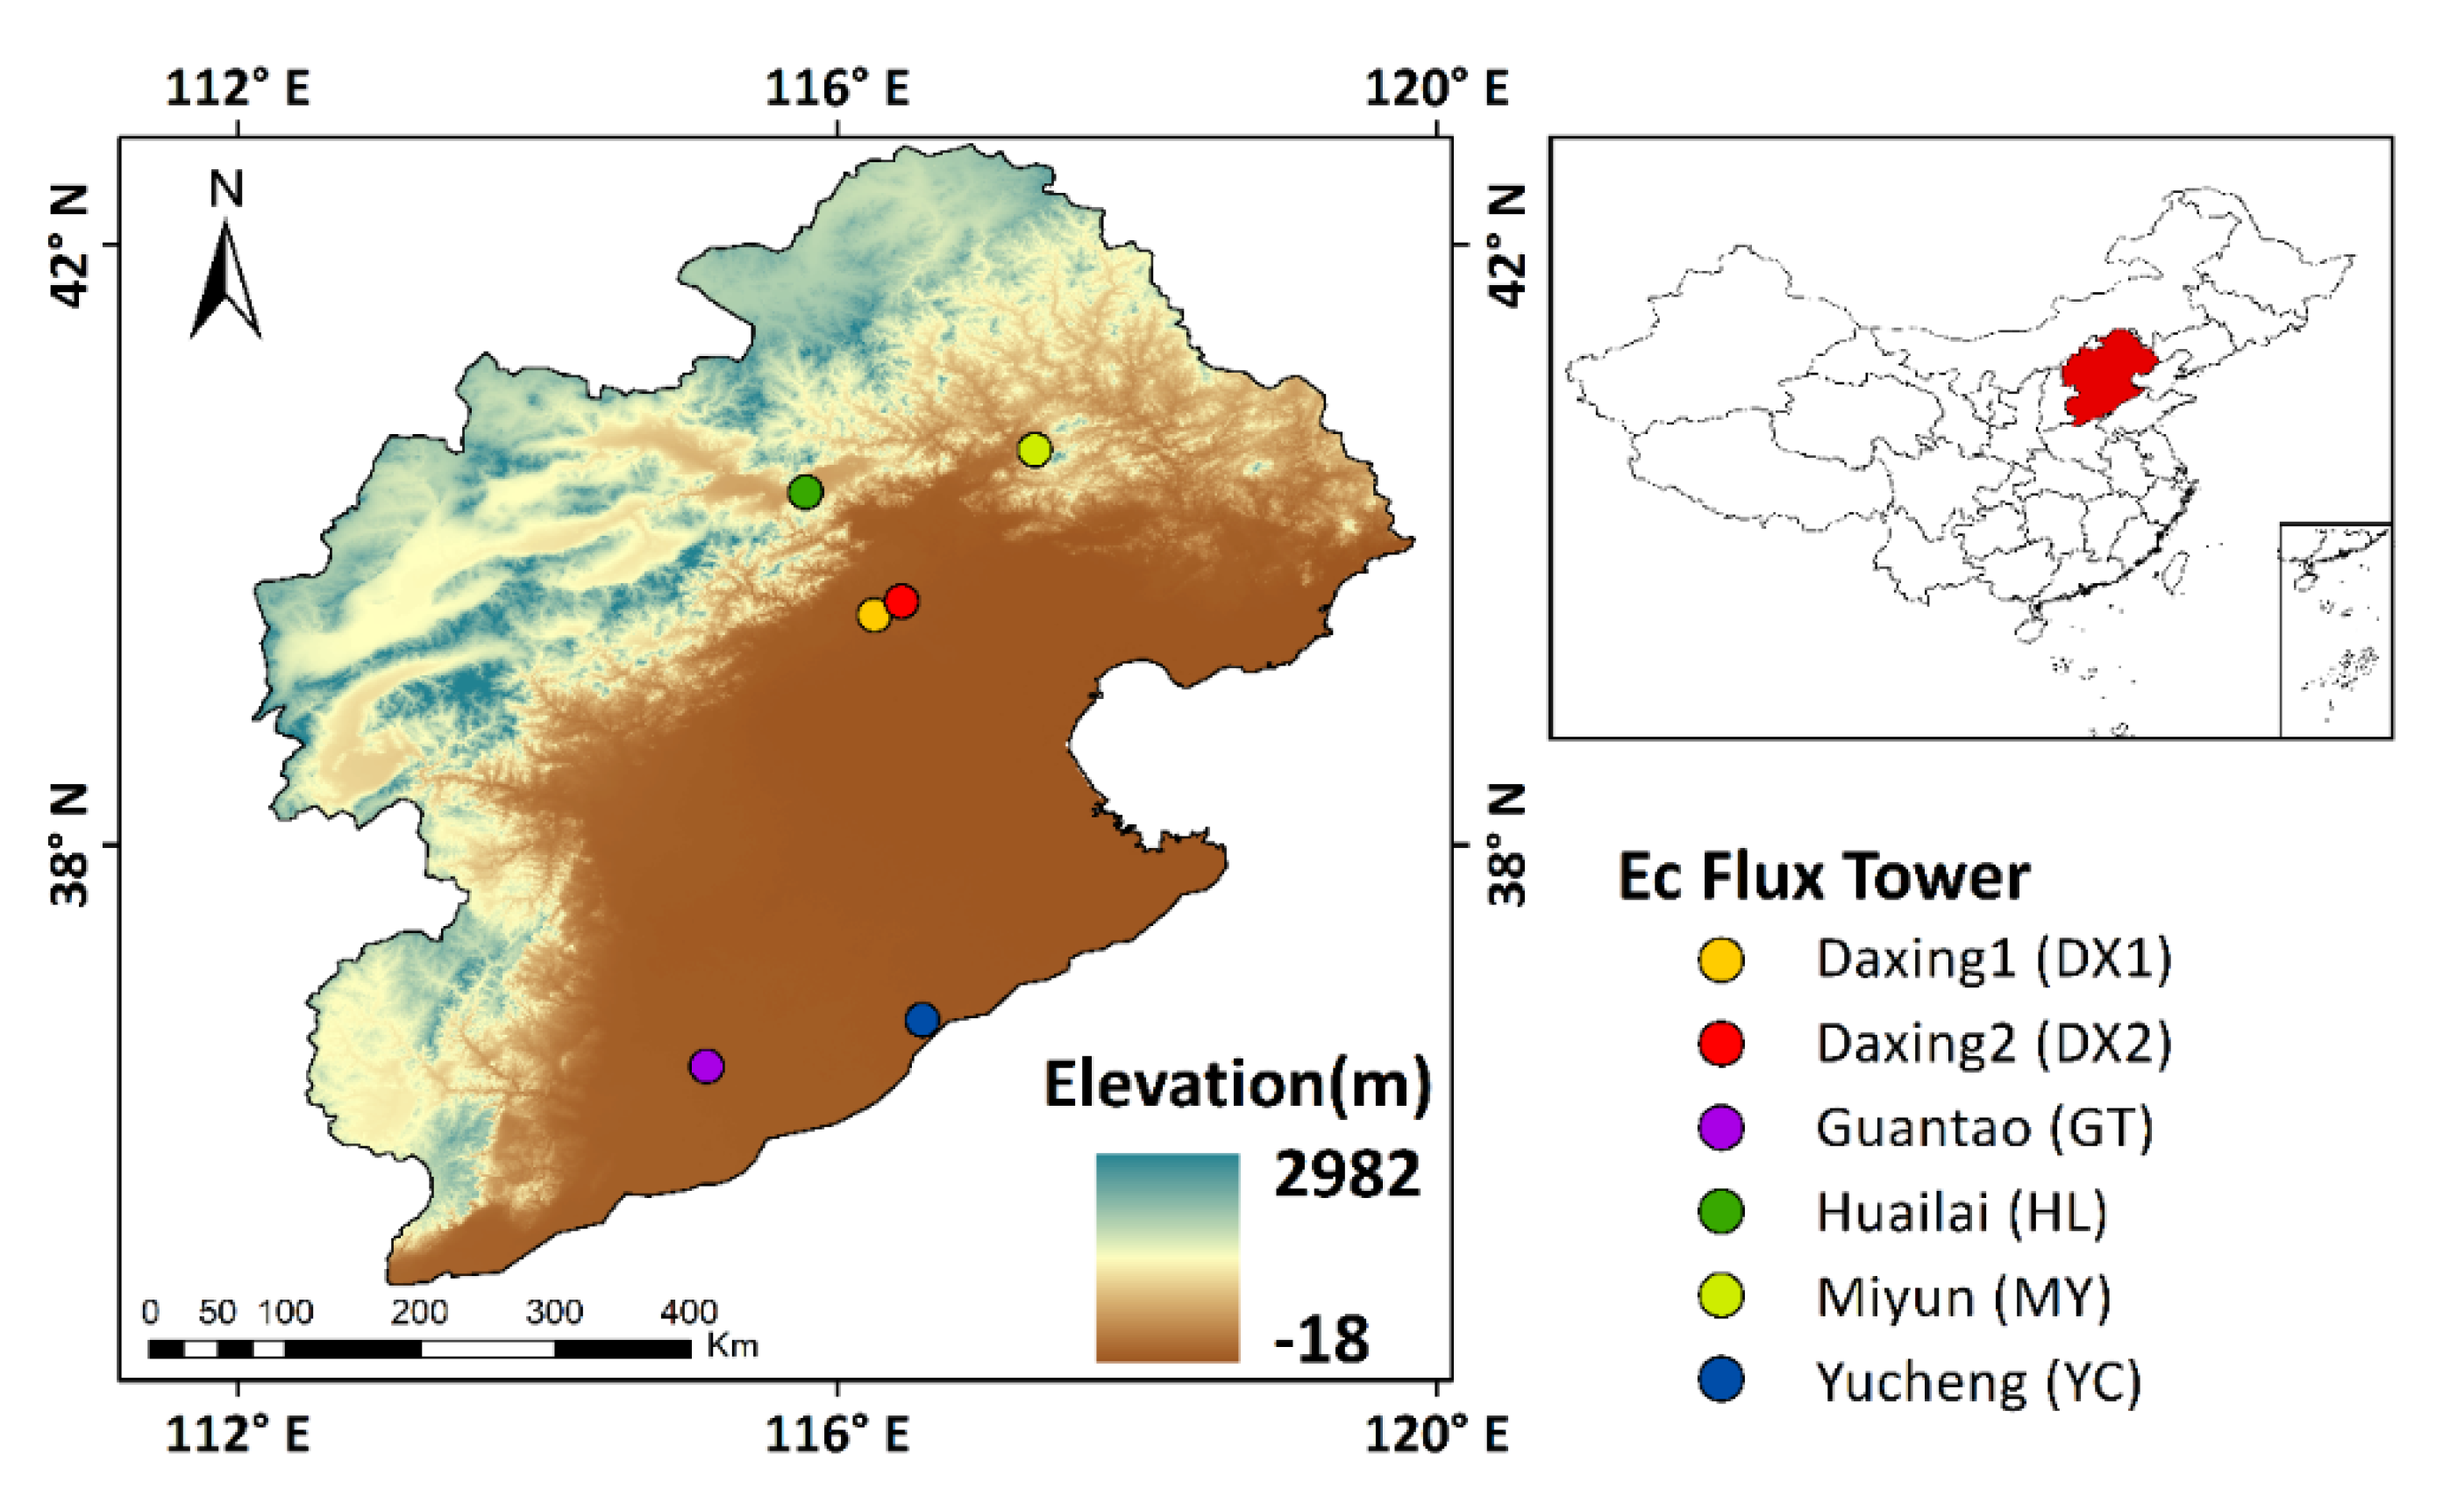
2.1.1. Study Area

The Haihe River basin (HRB) (112.1°–119.9° E, 35.0°–42.7° N) is located in the North China and has a total area of about 318,200 km2, accounting for 3.3% of the total area of China. The 60% of study region are hilly and plateau areas, located at the north and west of the HRB. The remaining 40% are plain areas (Figure 1). The vegetation coverage in the study area is approximately 77%. The east of the basin is the Bohai Sea, the west of the basin is the Taihang Mountains, the south of the basin is the Yellow River, and the north of the basin is the Mongolian Plateau. The HRB is located in the transition area between semi-humid and semi-arid with an average annual rainfall of about 539 mm. The average annual land surface evaporation in this basin is around 470 mm and the water surface evaporation is 1100 mm. The average annual relative humidity ranges from 50% to 70%, with a temperate East Asian monsoon climate [43].

2.1.2. Eddy Covariance Flux Tower Observations

We used the eddy-covariance (EC) observations and the corresponding meteorological data collected from six flux tower sites to evaluate six LE products. Table 1 lists the flux tower sites information in detail. The data for Daxing1 (DX1) site was provided by FLUXNET Lathuile network, the data for Yucheng (YC) site was provided by Chinaflux network [44], and the data for Dxing2 (DX2), Guantao (GT), Huailai (HL), and Miyun (MY) sites was provided by the National Tibetan Plateau Data Center (TPDC) [45,46,47,48,49]. These sites cover two global land-surface biomes: Mixed forest (MF) and crop land (CRO). The flux towers used the eddy-covariance (EC) system for measurement of the half-hour latent heat flux (LE), sensible heat flux (H), surface net radiation (Rn) and soil heat flux (G). We linearly aggregated the surface flux from half-hour into daily mean values and then aggregated daily values into 8-day mean values. We removed zero values and invalid values when the amount of missing data exceeds 20% of the responsible half-hourly measurements. The problem of unclosed energy in the flux towers data were reported in some studies, and we used the method of Twine et al. [50] to correct LE values of six flux towers.

2.1.3. Satellite-Based Latent Heat Flux Products

We evaluated six satellite-based products during 2002–2015 in this study, including Global Land Surface Satellite (GLASS) LE product, FLUXCOM LE product, Penman-Monteith-Leuning V2 (PML_V2) LE product, Global Land Evaporation Amsterdam Model datasets (GLEAM) LE product, Breathing Earth System Simulator (BESS) LE product, and Moderate Resolution Imaging Spectroradiometer (MODIS) (MOD16) LE product. To evaluate the accuracy of these products, we resampled spatially these products into 0.05 degree using bilinear method and aggregated daily LE into 8-day mean values. Table 2 summarized the detailed information of these LE products.
  • GLASS LE product
GLASS LE product version 4.0 is a merged LE product using Bayesian model averaging (BMA) method to merge five process-based algorithms [32]. The five algorithms include the MOD16 algorithm, the revised remote-sensing-based Penman-Monteith LE algorithm, the Priestley-Taylor-based LE algorithm, the modified satellite-based Priestley-Taylor LE algorithm and the semi-empirical Penman LE algorithm. The forcing data include the Modern-Era Retrospective analysis for Research and Applications, Version 2 (MERRA-2) meteorological datasets provided by Global Modeling and Assimilation Office (GMAO), and GLASS other products [albedo, LAI, Normalized Difference Vegetation Index (NDVI), and fraction of absorbed photosynthetically active radiation (FPAR)] from Advanced Very High Resolution Radiometer (AVHRR) data. The GLASS LE product version 4.0 used in our study, with a 0.05° spatial resolution and 8-day temporal resolution.
2.
FLUXCOM LE product
The FLUXCOM LE product with a 0.0833° spatial resolution and 8-day temporal resolution was produced from machine learning methods driven by remote sensing data [18]. This LE product was estimated exclusively from MODIS satellite data, including daytime and nighttime land surface temperature, land cover, FPAR and bidirectional reflectance distribution function (BRDF)-corrected reflectances.
3.
PML_V2 LE product
PML_V2 (PML version 2.0) LE product was produced based on a coupled diagnostic biophysical model. The input datasets include the Global Land Data Assimilation System (GLDAS) meteorological data and the LAI, albedo, and emissivity from MODIS. The PML_V2 datasets provide gross primary product (GPP), vegetation transpiration (Ec), soil evaporation (Es), vaporization of intercepted rainfall (Ei) and ET_water [30,51]. The PML_V2 LE product used in this study refers to the sum of the Es, Ei, and Ec, and it has a temporal resolution of 8 days and a spatial resolution of 0.05°.
4.
GLEAM LE product
The GLEAM LE product was calculated based on the Priestley and Taylor equation, the different components of land evapotranspiration was estimated separately, including transpiration, bare-soil evaporation, interception loss, open-water evaporation and sublimation [27]. The GLEAM LE product version 3.a used in our study is based on satellite data (soil moisture, vegetation optical depth and snow-water equivalent), reanalysis data (ERA air temperature and net radiation), and a multi-source precipitation product [26]. The GLEAM LE product has a daily temporal resolution and 0.25° spatial resolution.
5.
BESS LE product
BESS LE product was produced using a biophysical model that coupled the atmospheric radiative transfer, canopy radiative transfer, canopy photosynthesis, maximum carboxylation rate, two-leaf canopy conductance and temperature, and evapotranspiration [28,29]. The input data of the LE product includes MODIS atmospheric and land products and some auxiliary data. BESS LE product has the same projection and spatial resolution as MODIS data. We obtained BESS LE data with a temporal resolution of 8-day and a spatial resolution of 0.01°.
6.
MODIS LE product
MODIS LE (MOD16A2) product was generated based on an improved Penman–Monteith (PM) algorithm by Mu et al. [20]. The model input datasets include the land cover, FPAR, LAI and albedo from MODIS data and the meteorological data from GMAO-MERRA-2. The MOD16A2 product used in this study has a temporal resolution of 8 days and a spatial resolution of 500 m.

2.1.4. Auxiliary Data

The monthly gridded precipitation dataset provided by National Tibetan Plateau Data Center was used in this study [52]. The dataset was generated based on the Climatic Research Unit (CRU) dataset and the climatology dataset of WorldClim. The precipitation data has a spatial resolution of 0.0083333° (~1 km). Validation results from the 496 weather stations across China showed that this product was reliable in China [53,54].
We also used the monthly runoff dataset provided by the Global Land Data Assimilation System (GLDAS) in this study. We choose the GLDAS-2.1 dataset (GLDAS_NOAH025_M 2.1) [55], which has a temporal resolution of monthly and a spatial resolution of 0.25°. To evaluate six products, we resampled spatially all gridded dataset into 0.05 degree using bilinear method.

2.2. Methods

2.2.1. Water Budget Balance Method

The EC site-based validation method directly has been widely used to validate LE products. However, understanding the uncertainty in the LE data and other components of the water balance model at the basin scale is very important because inaccuracies in input data can affect model accuracy [56]. The water budget balance method (WBET) has been extensively used to evaluate large-scale LE products in some studies [56,57]. Therefore, we used the WBET to evaluate six LE products at the basin scale. The basic equation of total ET can be calculated with water balance method within a river basin is as follow,
W B E T = P R T W S C
where W B E T is the evapotranspiration (ET) derived by water balance method and can be calculated using L E / λ . λ is the latent heat of evaporation. P and R are the precipitation and runoff, respectively. T W S C is the total water storage change. Some studies show that when the data time span is larger than 10 years, the T W S C can be neglected [57]. Thus, we used the below equation to evaluate six satellite-based LE products in this study.
W B E T = P R

2.2.2. Evaluation Methods

We used three statistical metrics to evaluate six satellite-based LE products by comparing satellite-based LE estimates with flux tower observations and WBET in our study. The metrics include the coefficient of determination (R2), root mean square error (RMSE) and bias. The mathematical equations of the three indicators are as follows,
R 2 = [ i = 1 n ( X i X ¯ ) ( Y i Y ¯ ) i = 1 n ( X i X ¯ ) ( Y i Y ¯ ) ] 2
R M S E = 1 n i = 1 n ( X i Y i ) 2
B i a s = i = 1 n ( X i Y i ) n
where X i are the observed values and Y i are the estimated values, X ¯ and Y ¯ are the average of X i and Y i , respectively, and n is the total number of the samples.
Taylor diagrams were also used to evaluate six satellite-based LE products [58]. A Taylor diagram is a polar-style graph and it has a standard deviation (SD) between the estimations and the observations, a correlation coefficient (R) and a centered root-mean-square-difference (RMSD). Here, SD refers to the radial distance from the origin, R is reflected by the cosine of the azimuth angle, and RMSD is the radial distance from the observed point.

3. Results

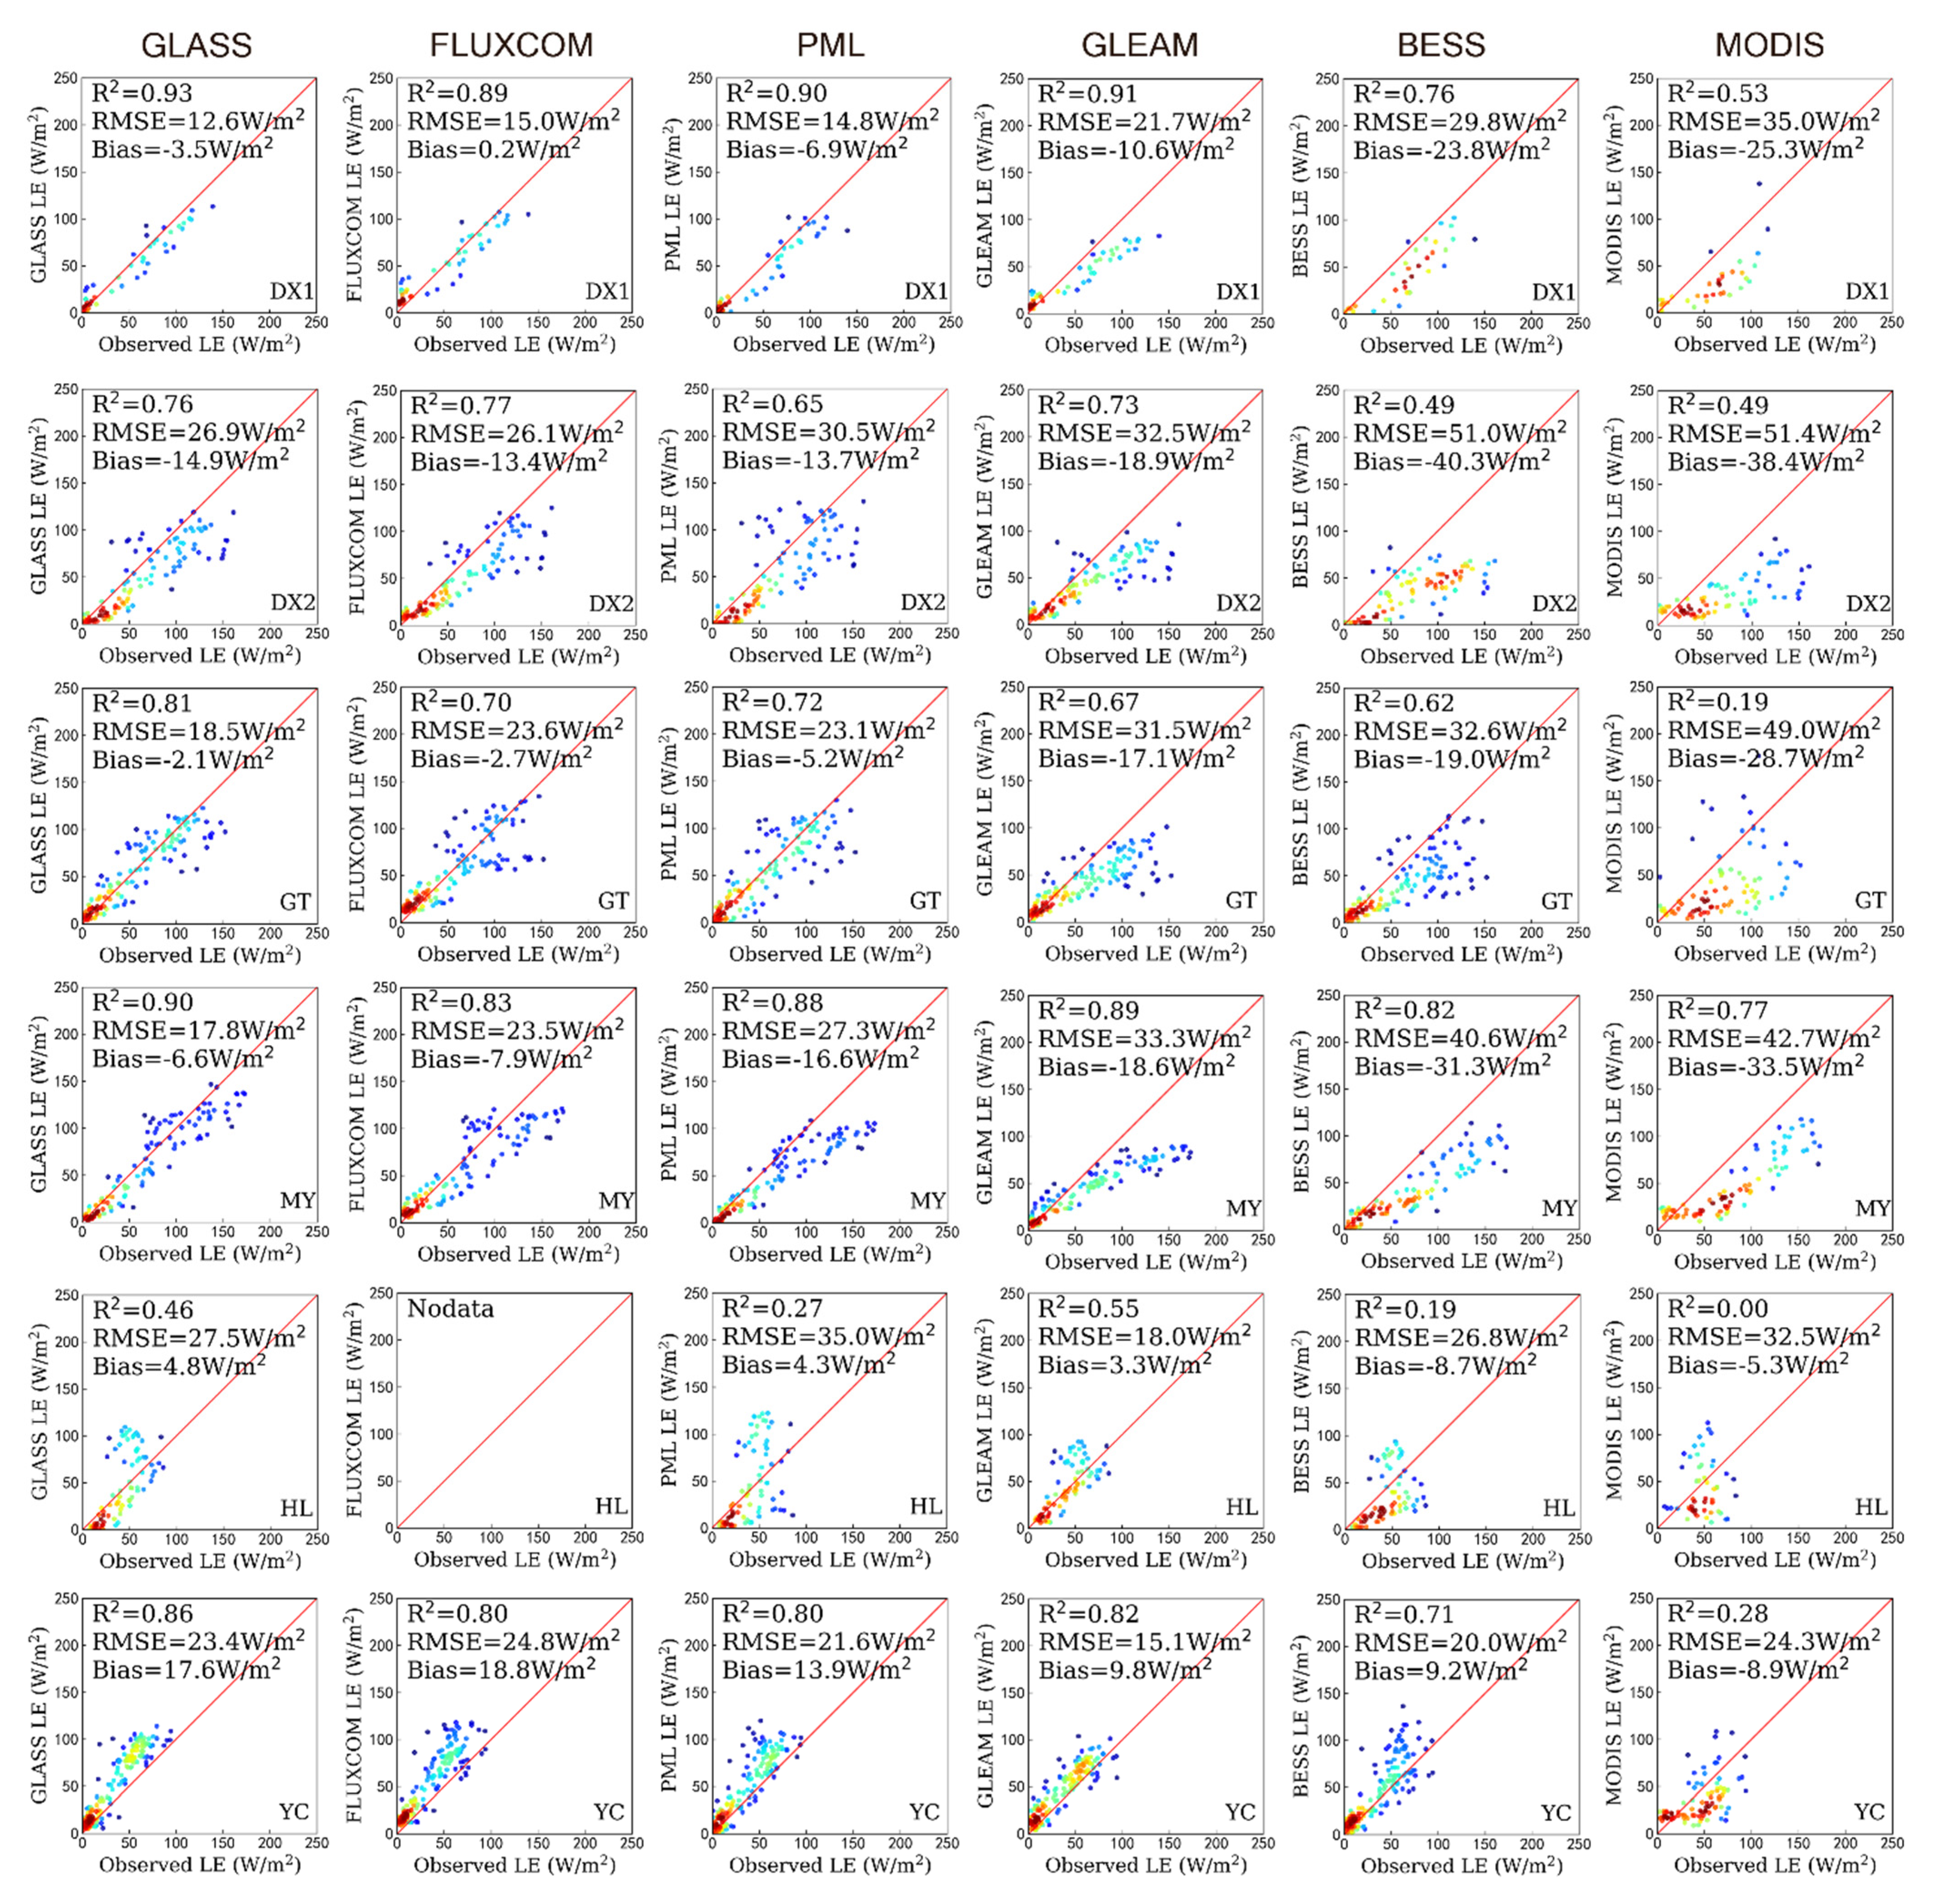
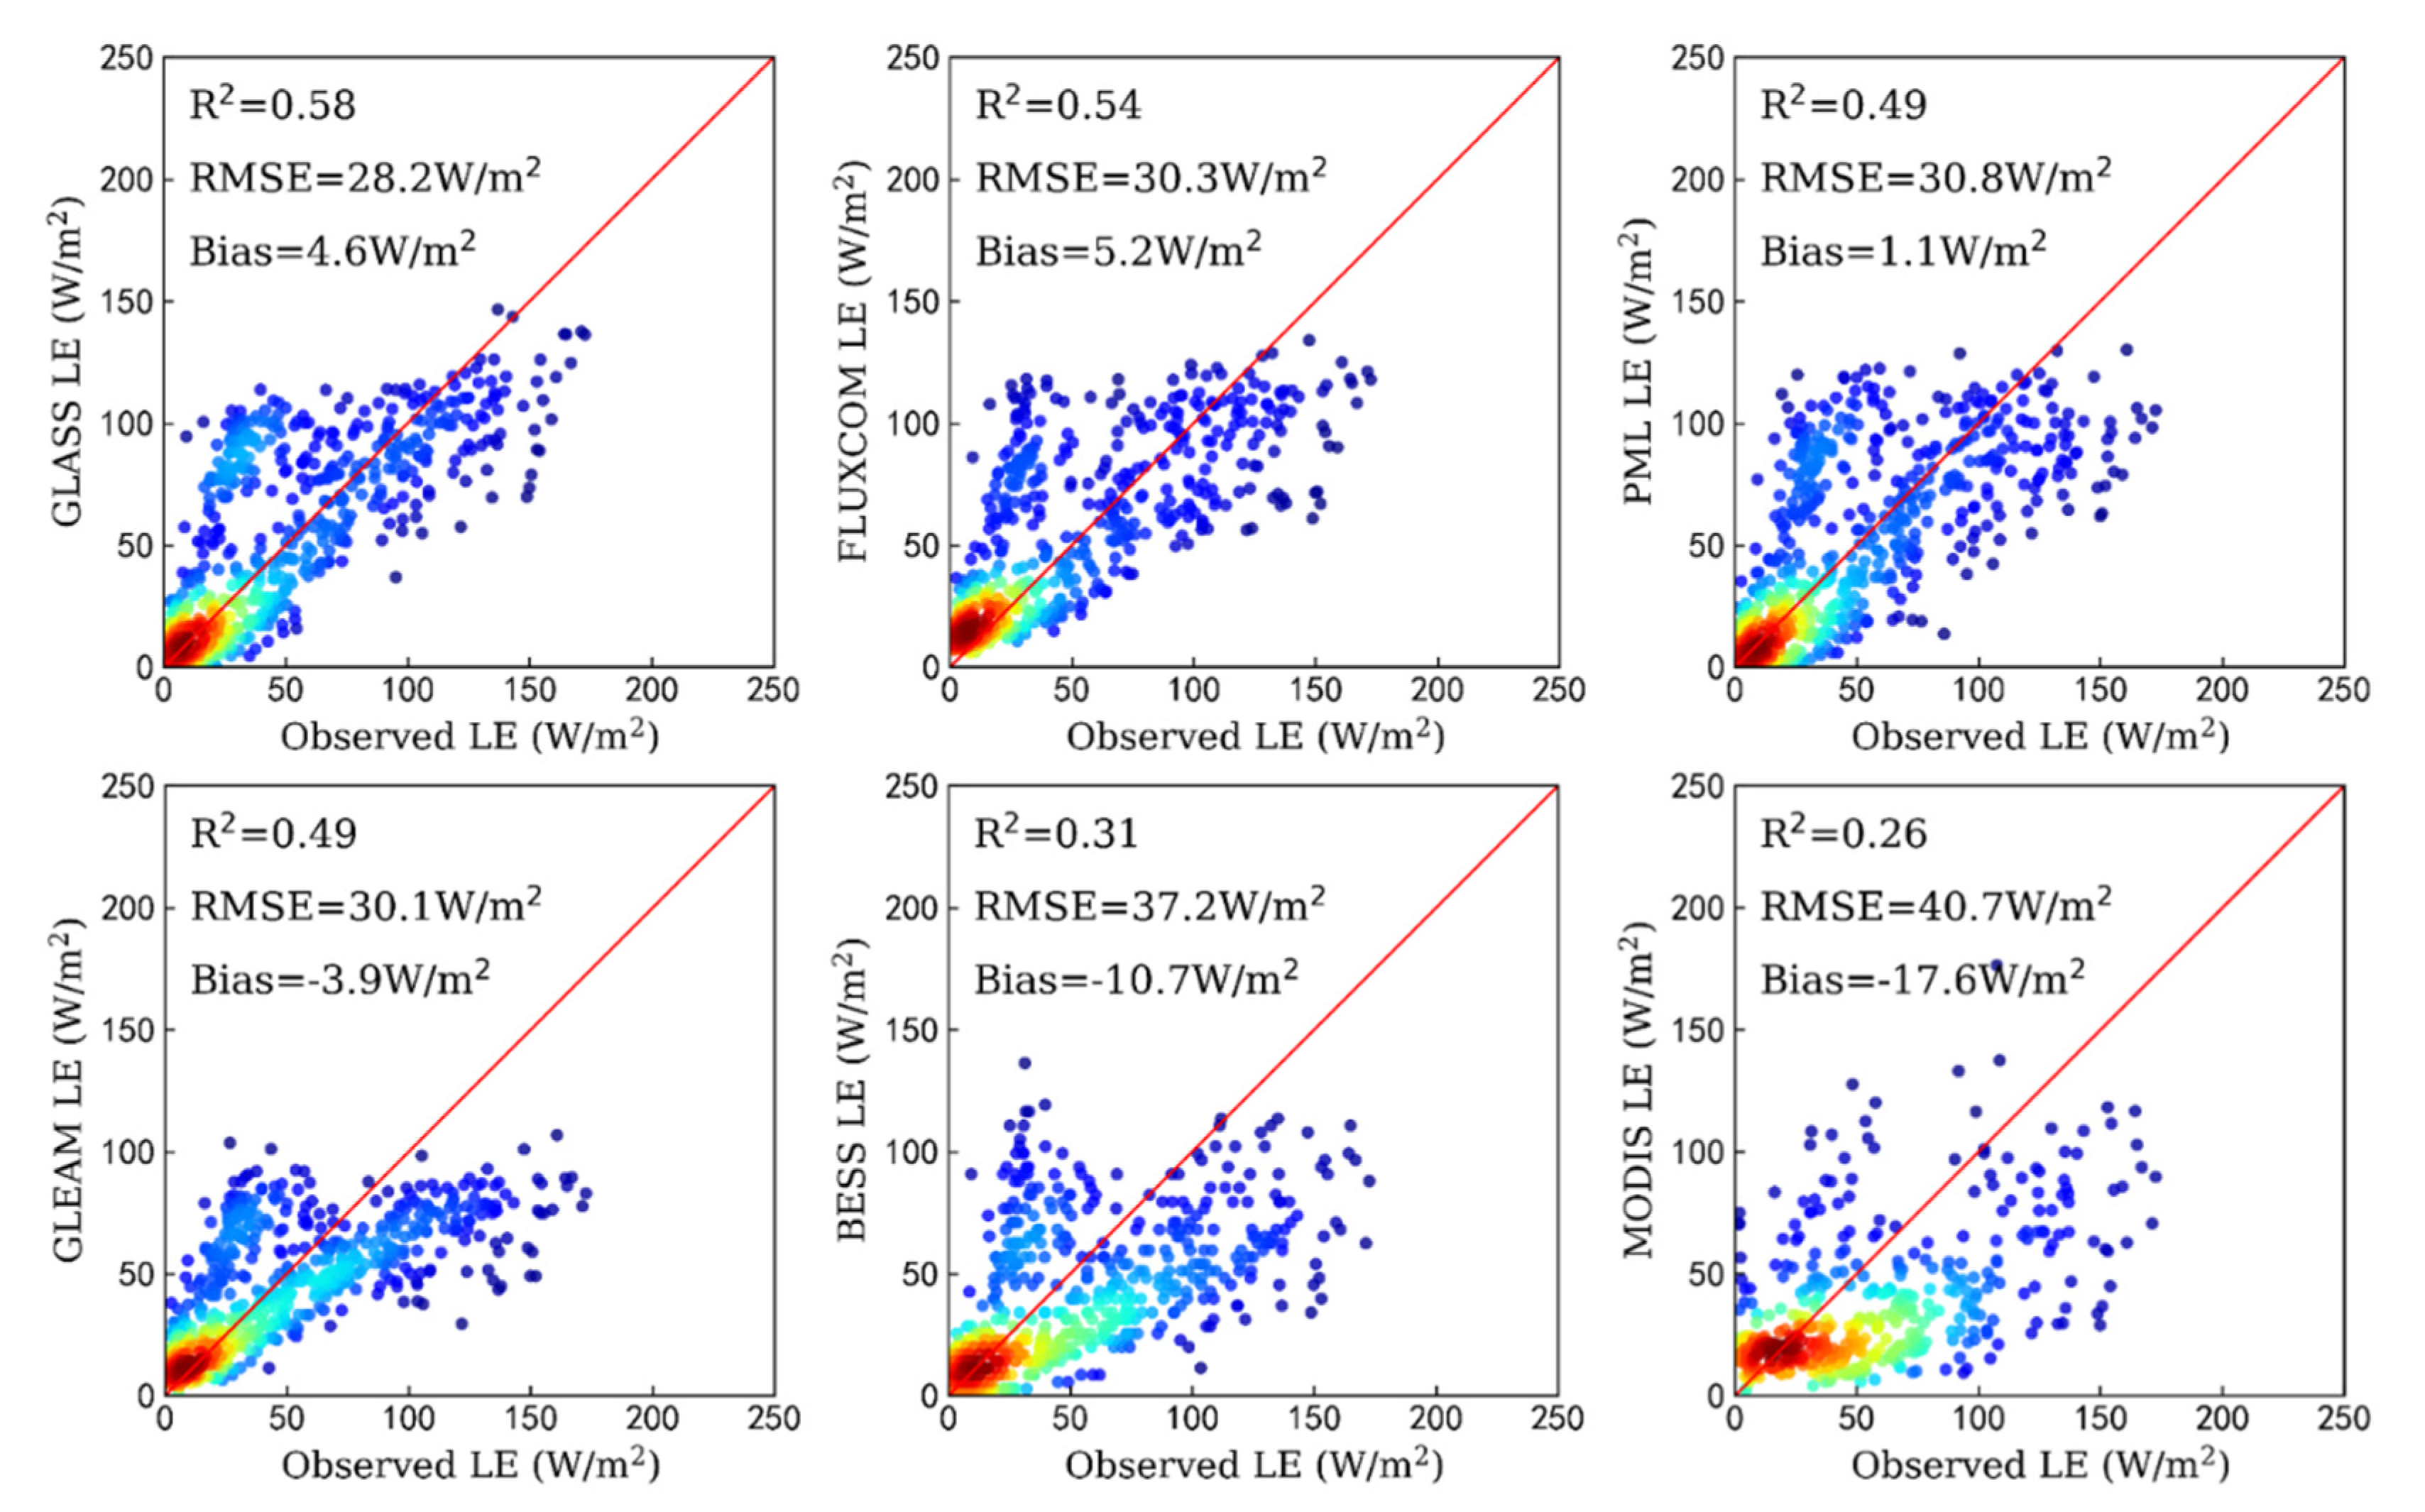
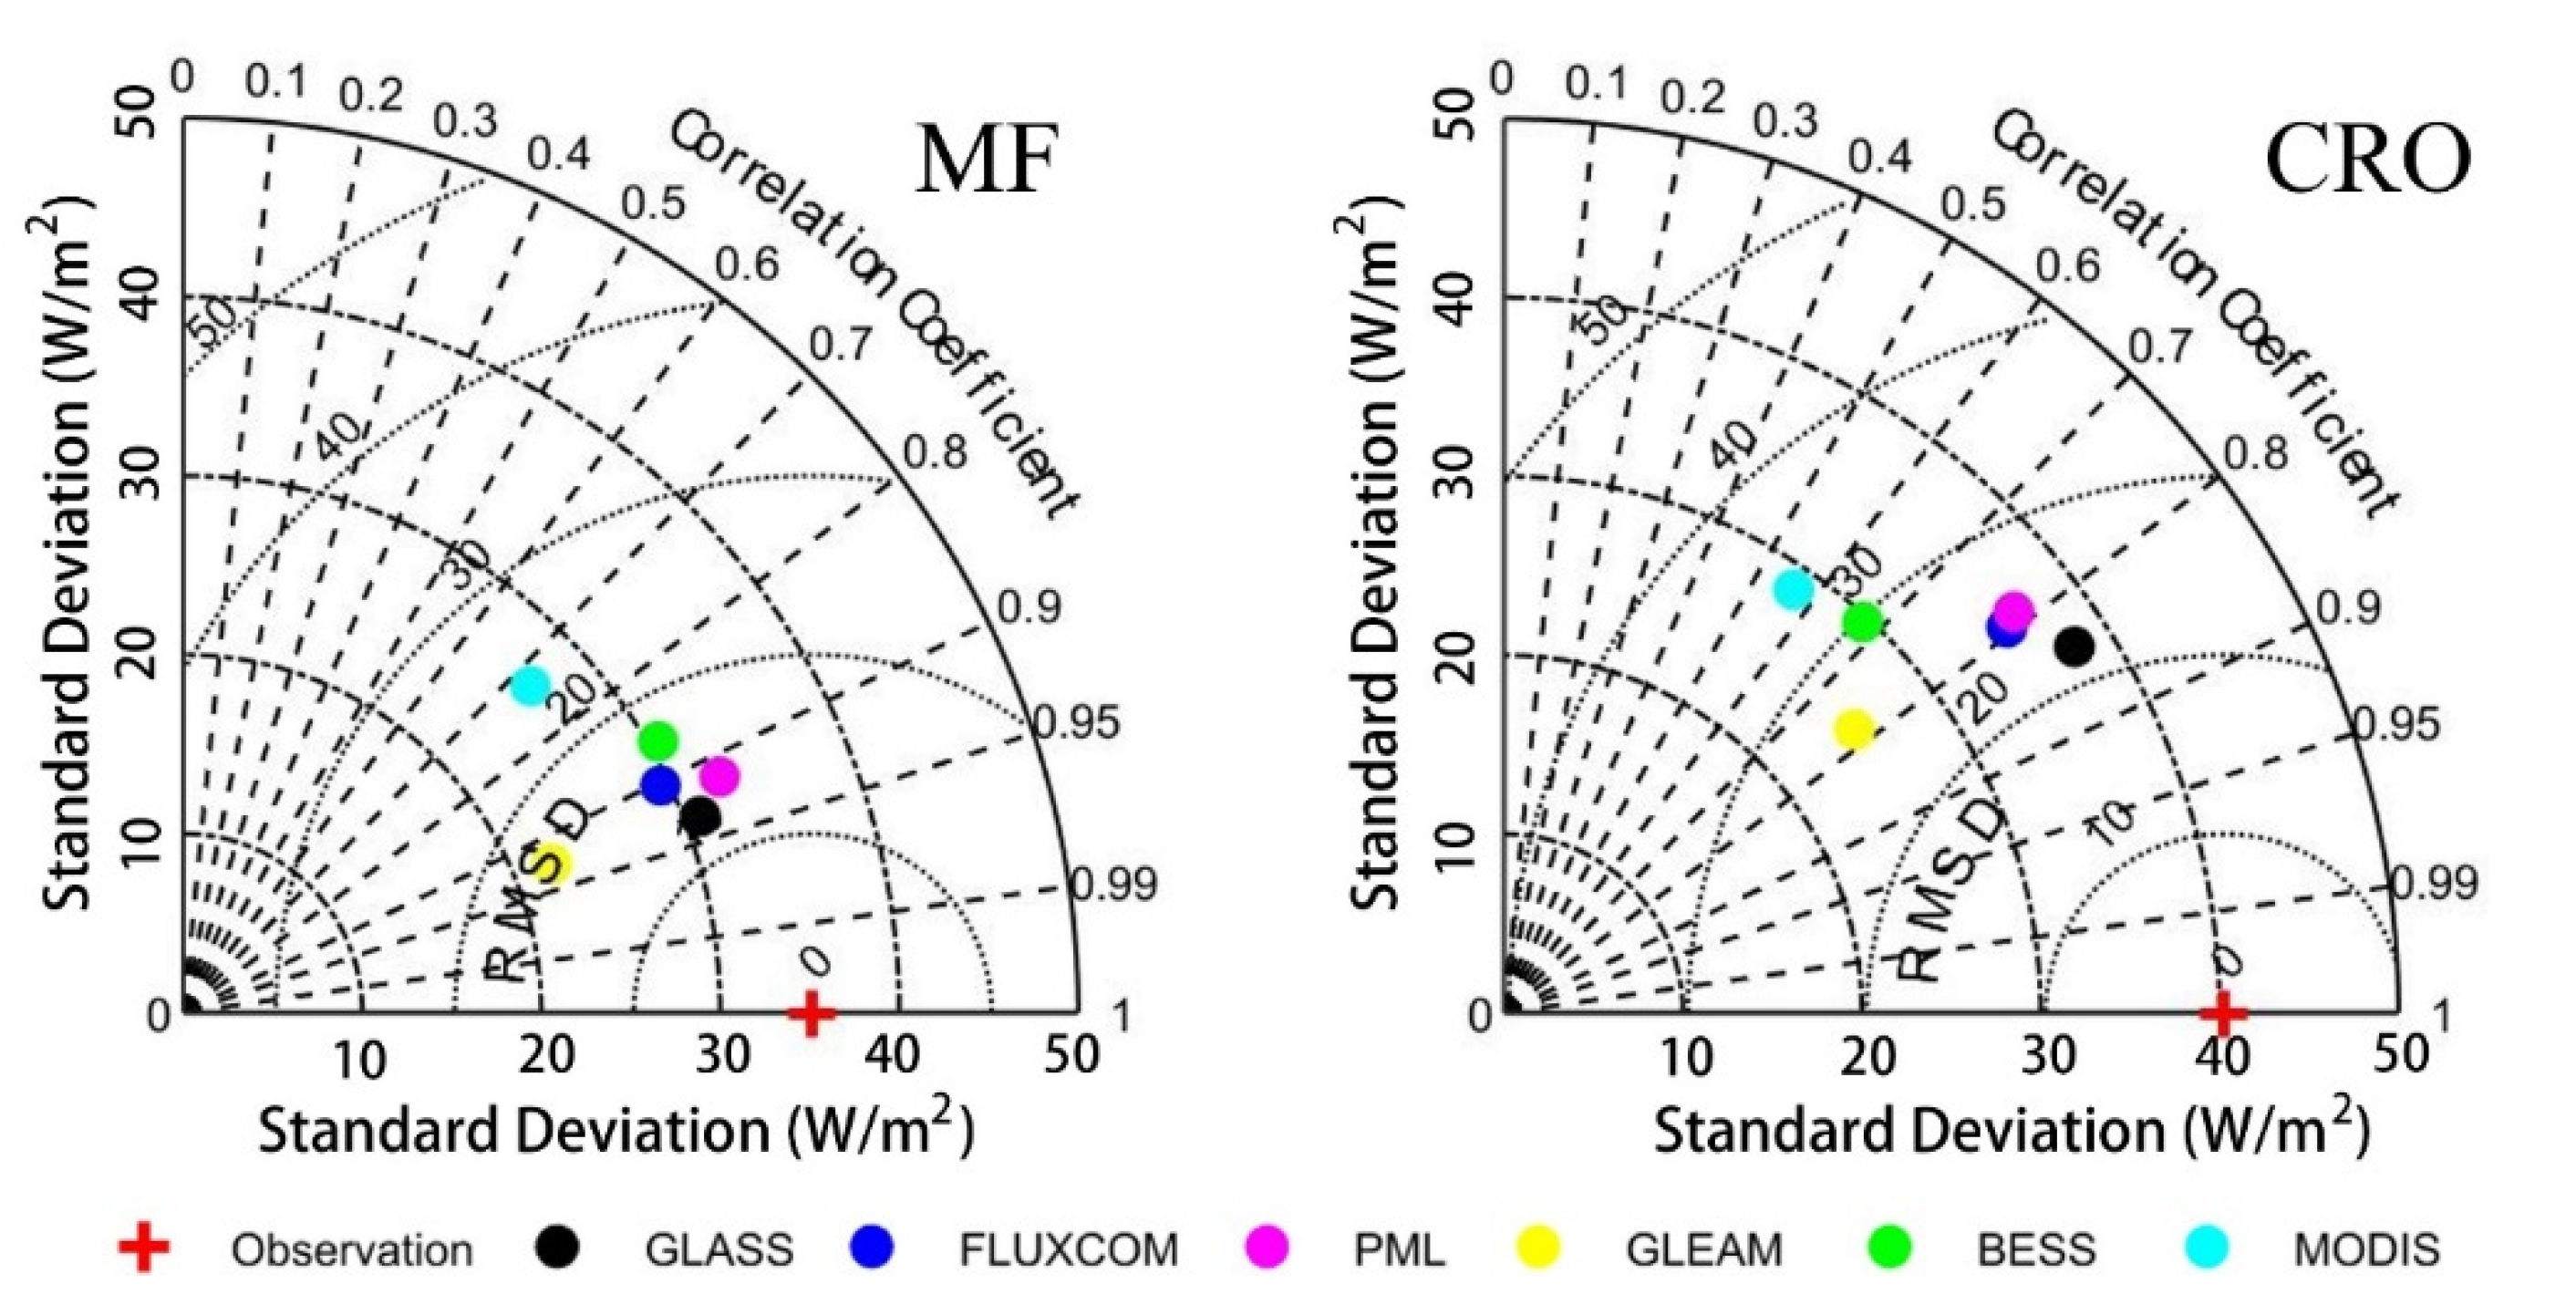
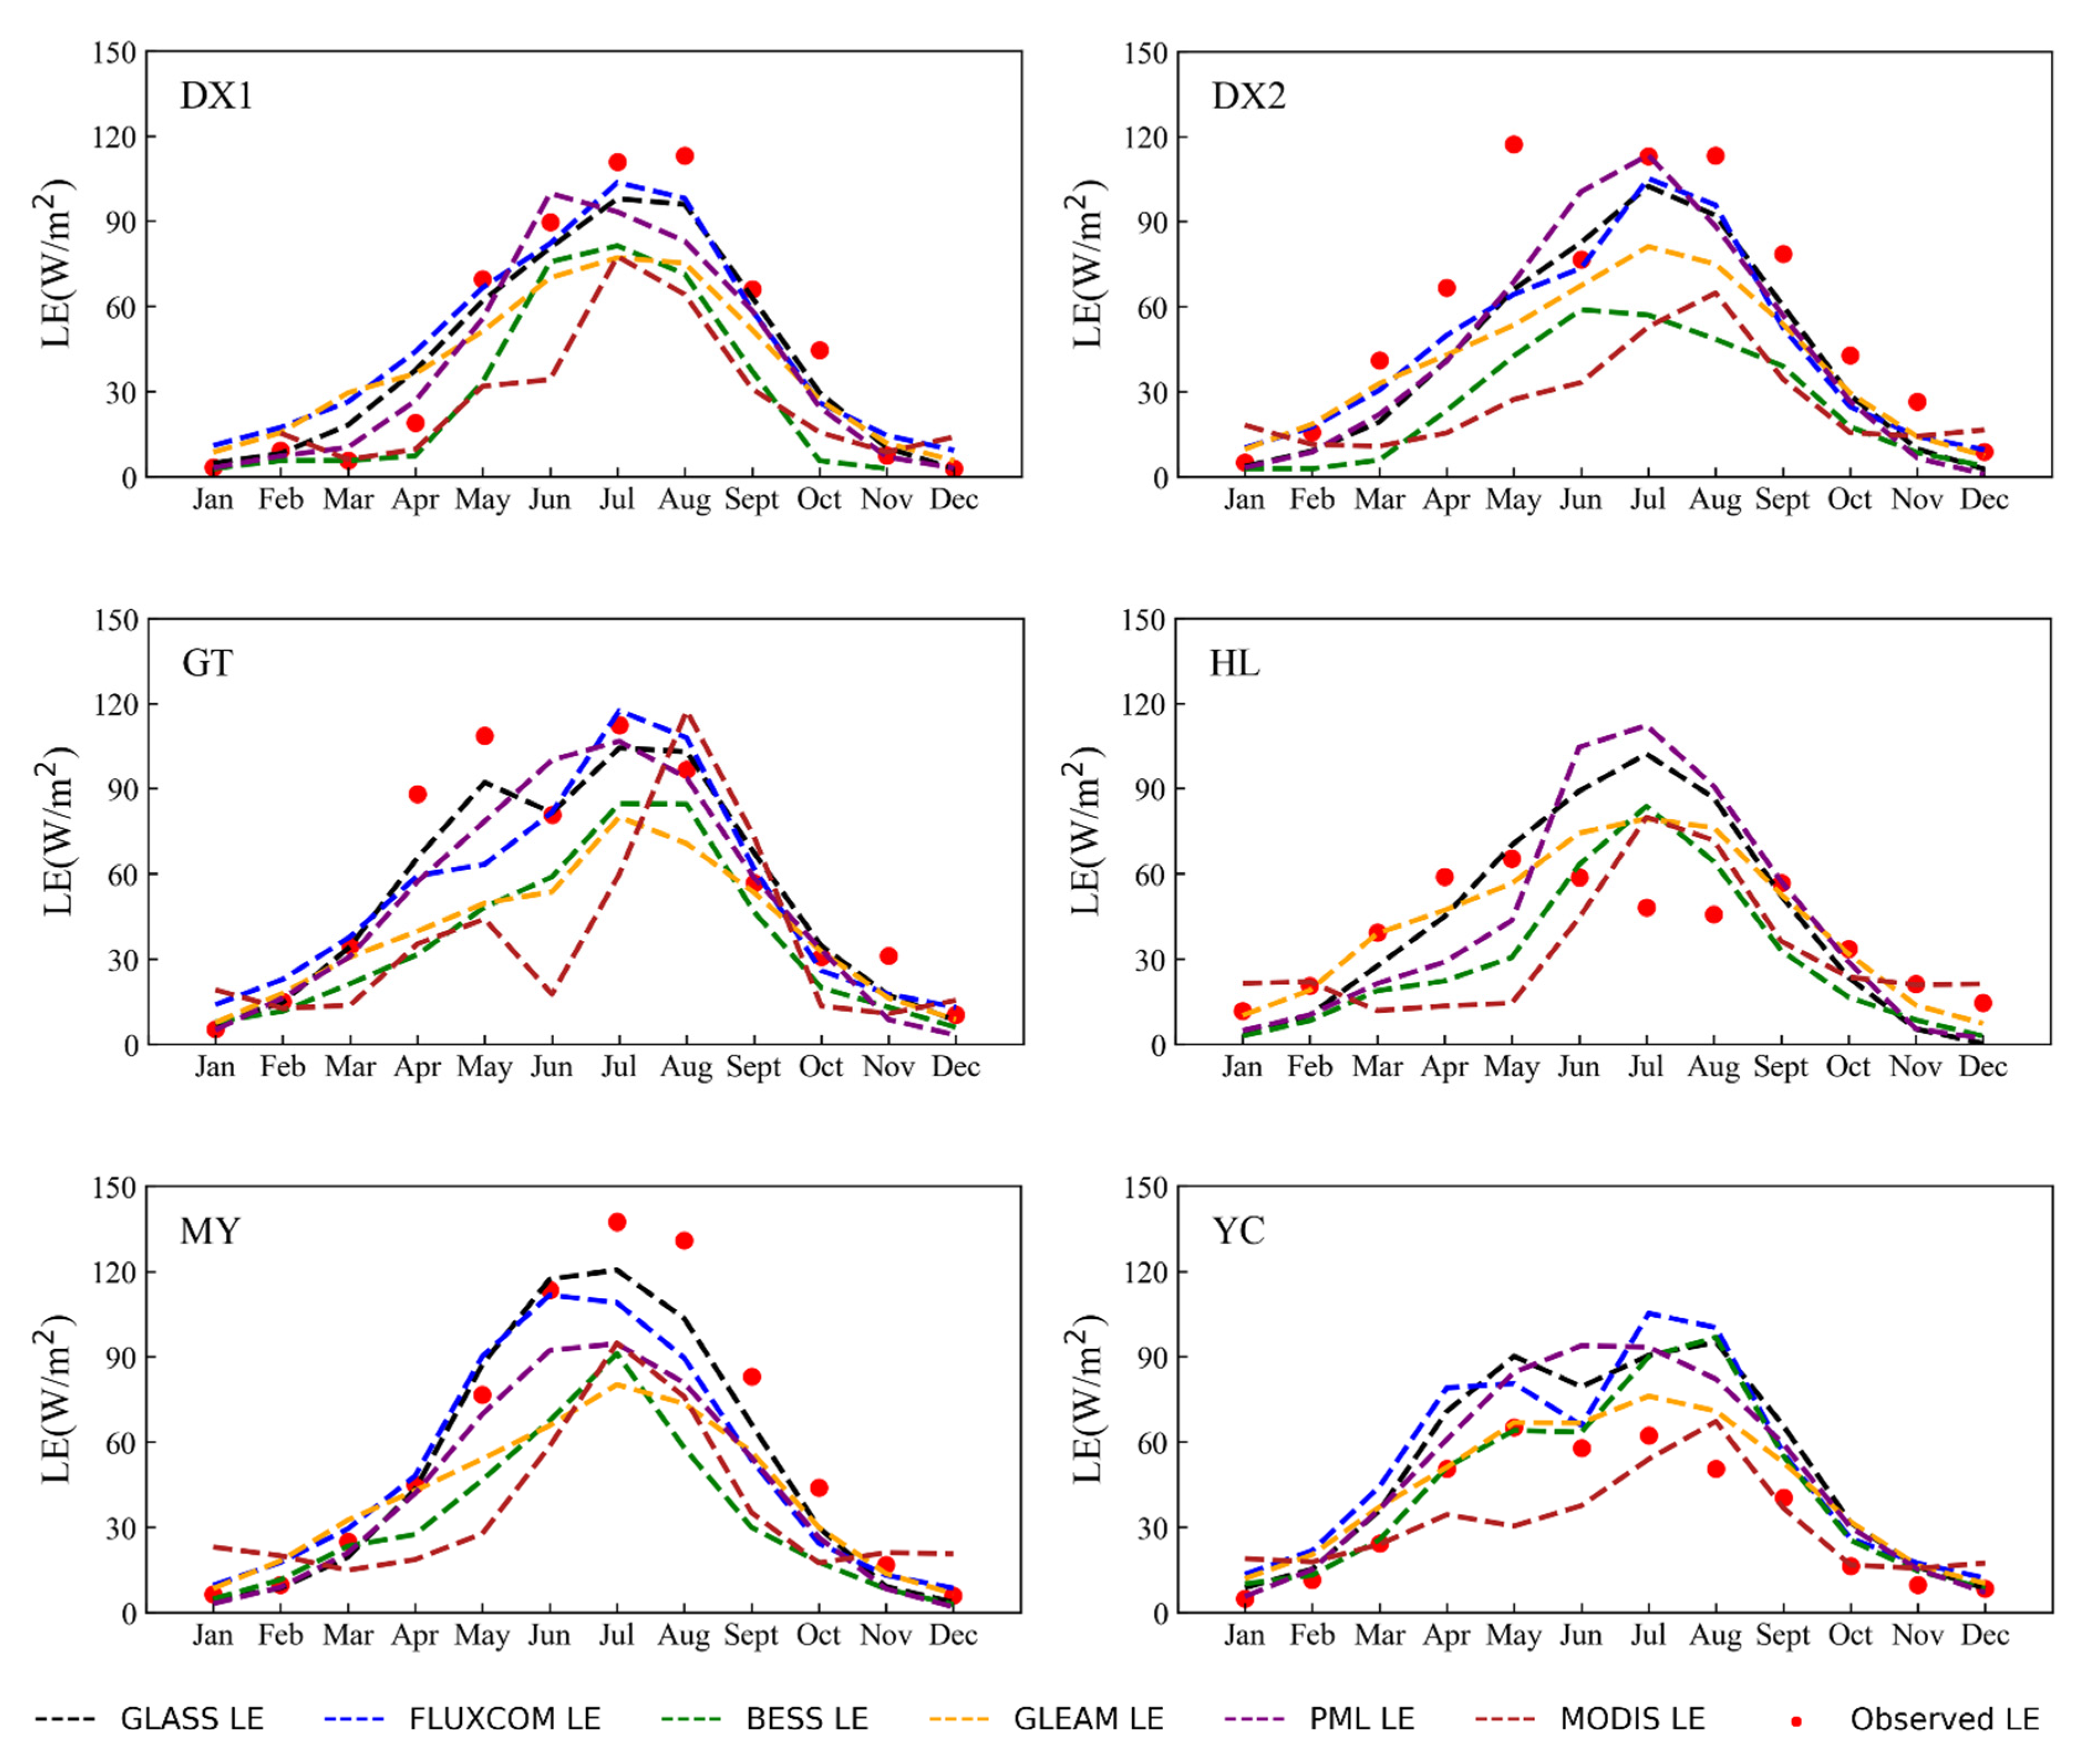
3.1. LE Validation with Flux Tower Observations

Figure 2 shows scatterplots of the observed LE and estimated LE derived from six LE products at six different sites. One notices that for different sites, the R2 of the observed LE versus the estimated LE from six products varied from 0.19 to 0.93 at a 99% confidence level, the RMSE varied from 12.6 W/m2 to 51.4 W/m2, and the bias varied from −40.3 W/m2 to 18.8 W/m2, with an exception of MODIS LE product. Among them, GLASS LE had the highest R2 and lowest RMSE in DX1, GT and MY, FLUXCOM LE had the highest R2 and lowest RMSE in DX2. In contrast, MODIS LE had the lowest R2 and highest RMSE in DX1, DX2, GT and MY. Moreover, all products underestimated LE in DX1, X2, GT and MY and overestimated LE in YC, except for MODIS. It is clear that MODIS product had a negative bias over six sites compared with observed LE, which indicates that MODIS product systematically underestimated LE in the Haihe River basin.
Figure 3 shows the scatterplots of the observed LE versus the estimated LE from six products at all sites. For all six sites, GLASS LE had the highest R2 of 0.58 (p < 0.01) and lowest RMSE of 28.2 W/m2, followed by FLUXCOM LE with R2 of 0.54 (p < 0.01) and RMSE of 30.3 W/m2. In contrast, BESS and MODIS products significant underestimated LE, with a bias of −10.7 W/m2 and −17.6 W/m2, respectively.
Figure 4 presents the Taylor diagrams of six products with observed LE over mixed forests (MF) and croplands (CRO) that cover all six flux tower sites. All LE products except MODIS closed well to the EC observations in MF sites with RMSD values less than 18.0 W/m2 and R values higher than 0.86, while great differences were found over CRO sites. For individual product, GLASS LE product showed better agreement with EC observations in MF and CRO sites with the lower RMSD values of 13.2 W/m2 and 23.1 W/m2, and highest R values of 0.93 and 0.84 respectively, followed by FLUXCOM, PML and GLEAM. In contrast, MODIS LE product had the largest RMSD of 24.1 W/m2 and 33.8 W/m2, the lowest R of 0.72 and 0.56 over MF and CRO, respectively. The performance of PML and FLUXCOM LE were similar for two land cover types.
Figure 5 illustrates the multi-year average seasonal cycles from six LE productions across six sites. Generally, LE derived from all products was comparable in seasonal pattern and magnitude for all sites. GLASS LE product captured LE seasonal variances well across most sites. However, no one product captures the LE variation in summer at HL site. The seasonal variations curve of MODIS LE and FLUXCOM LE products were similar at DX1, DX2 and MY site. MODIS LE product was lower than observed values at DX1, DX2, MY and YC sites. The observed dual peaks of seasonal LE variation curve at GT site were only captured by GLASS and MODIS LE products. However, MODIS LE product tended to underestimate LE for most sites. Overall, the GLASS LE product has the best performance in the Haihe River basin, followed by FLUXCOM LE product.

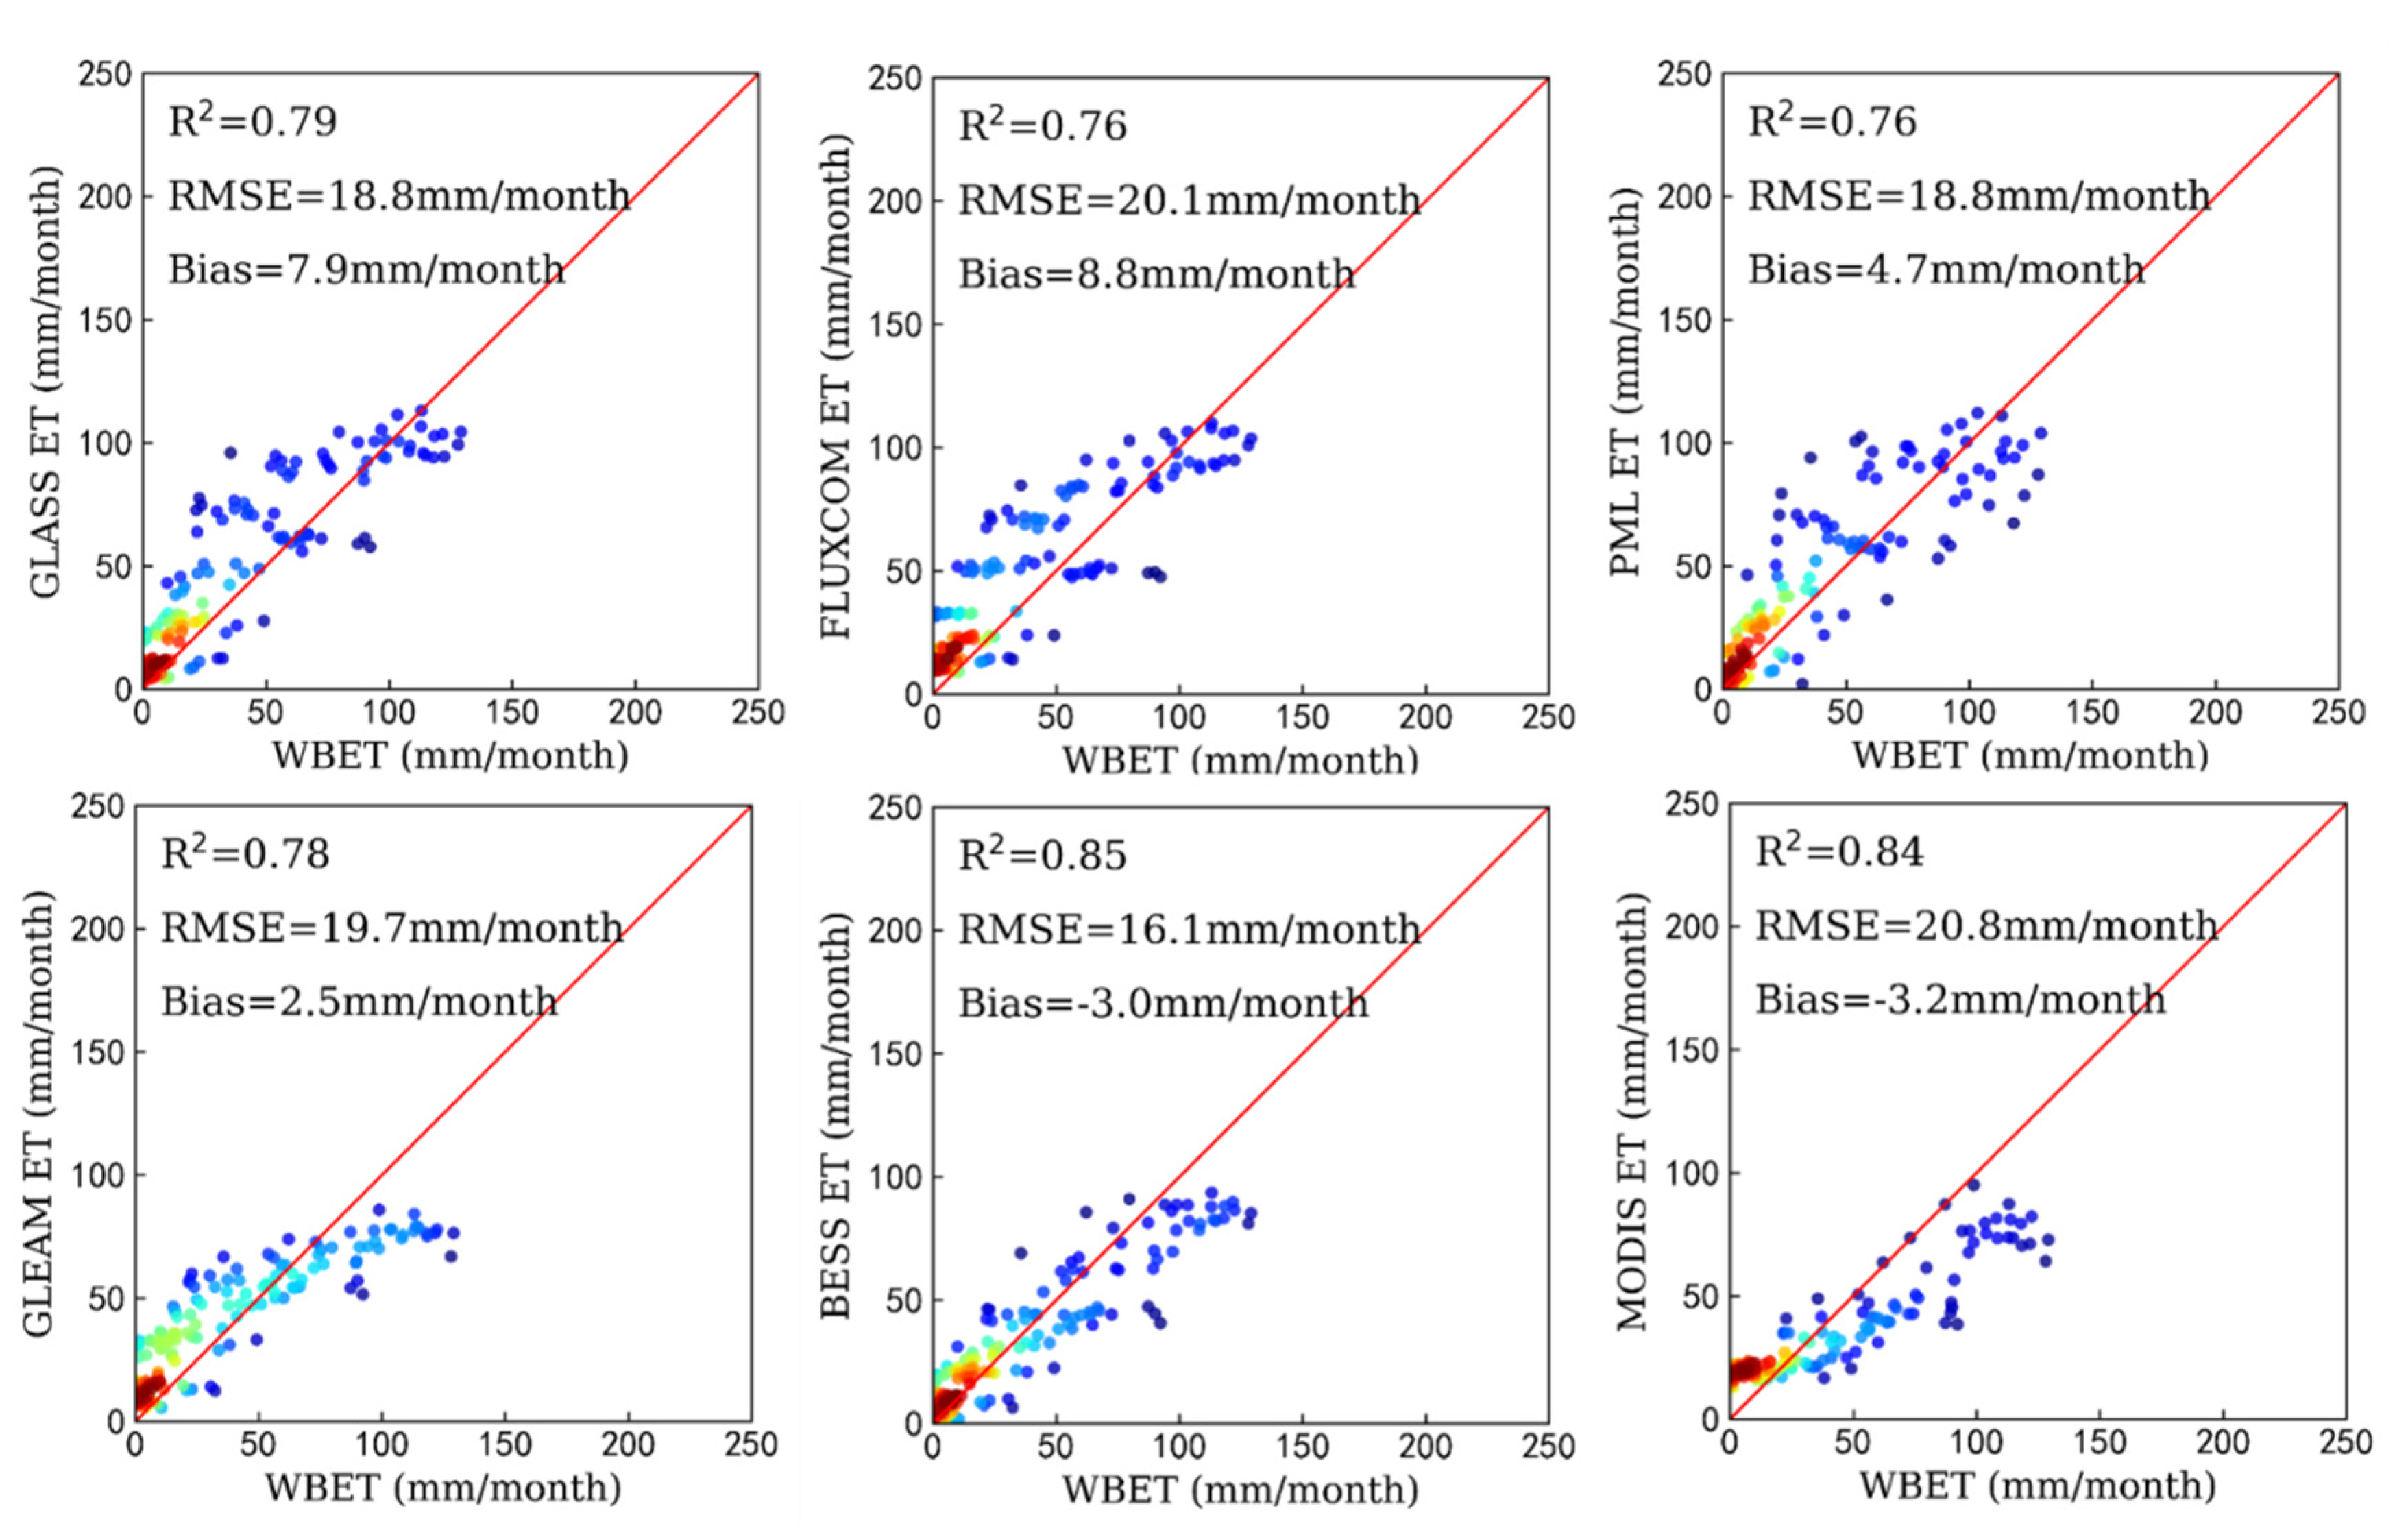
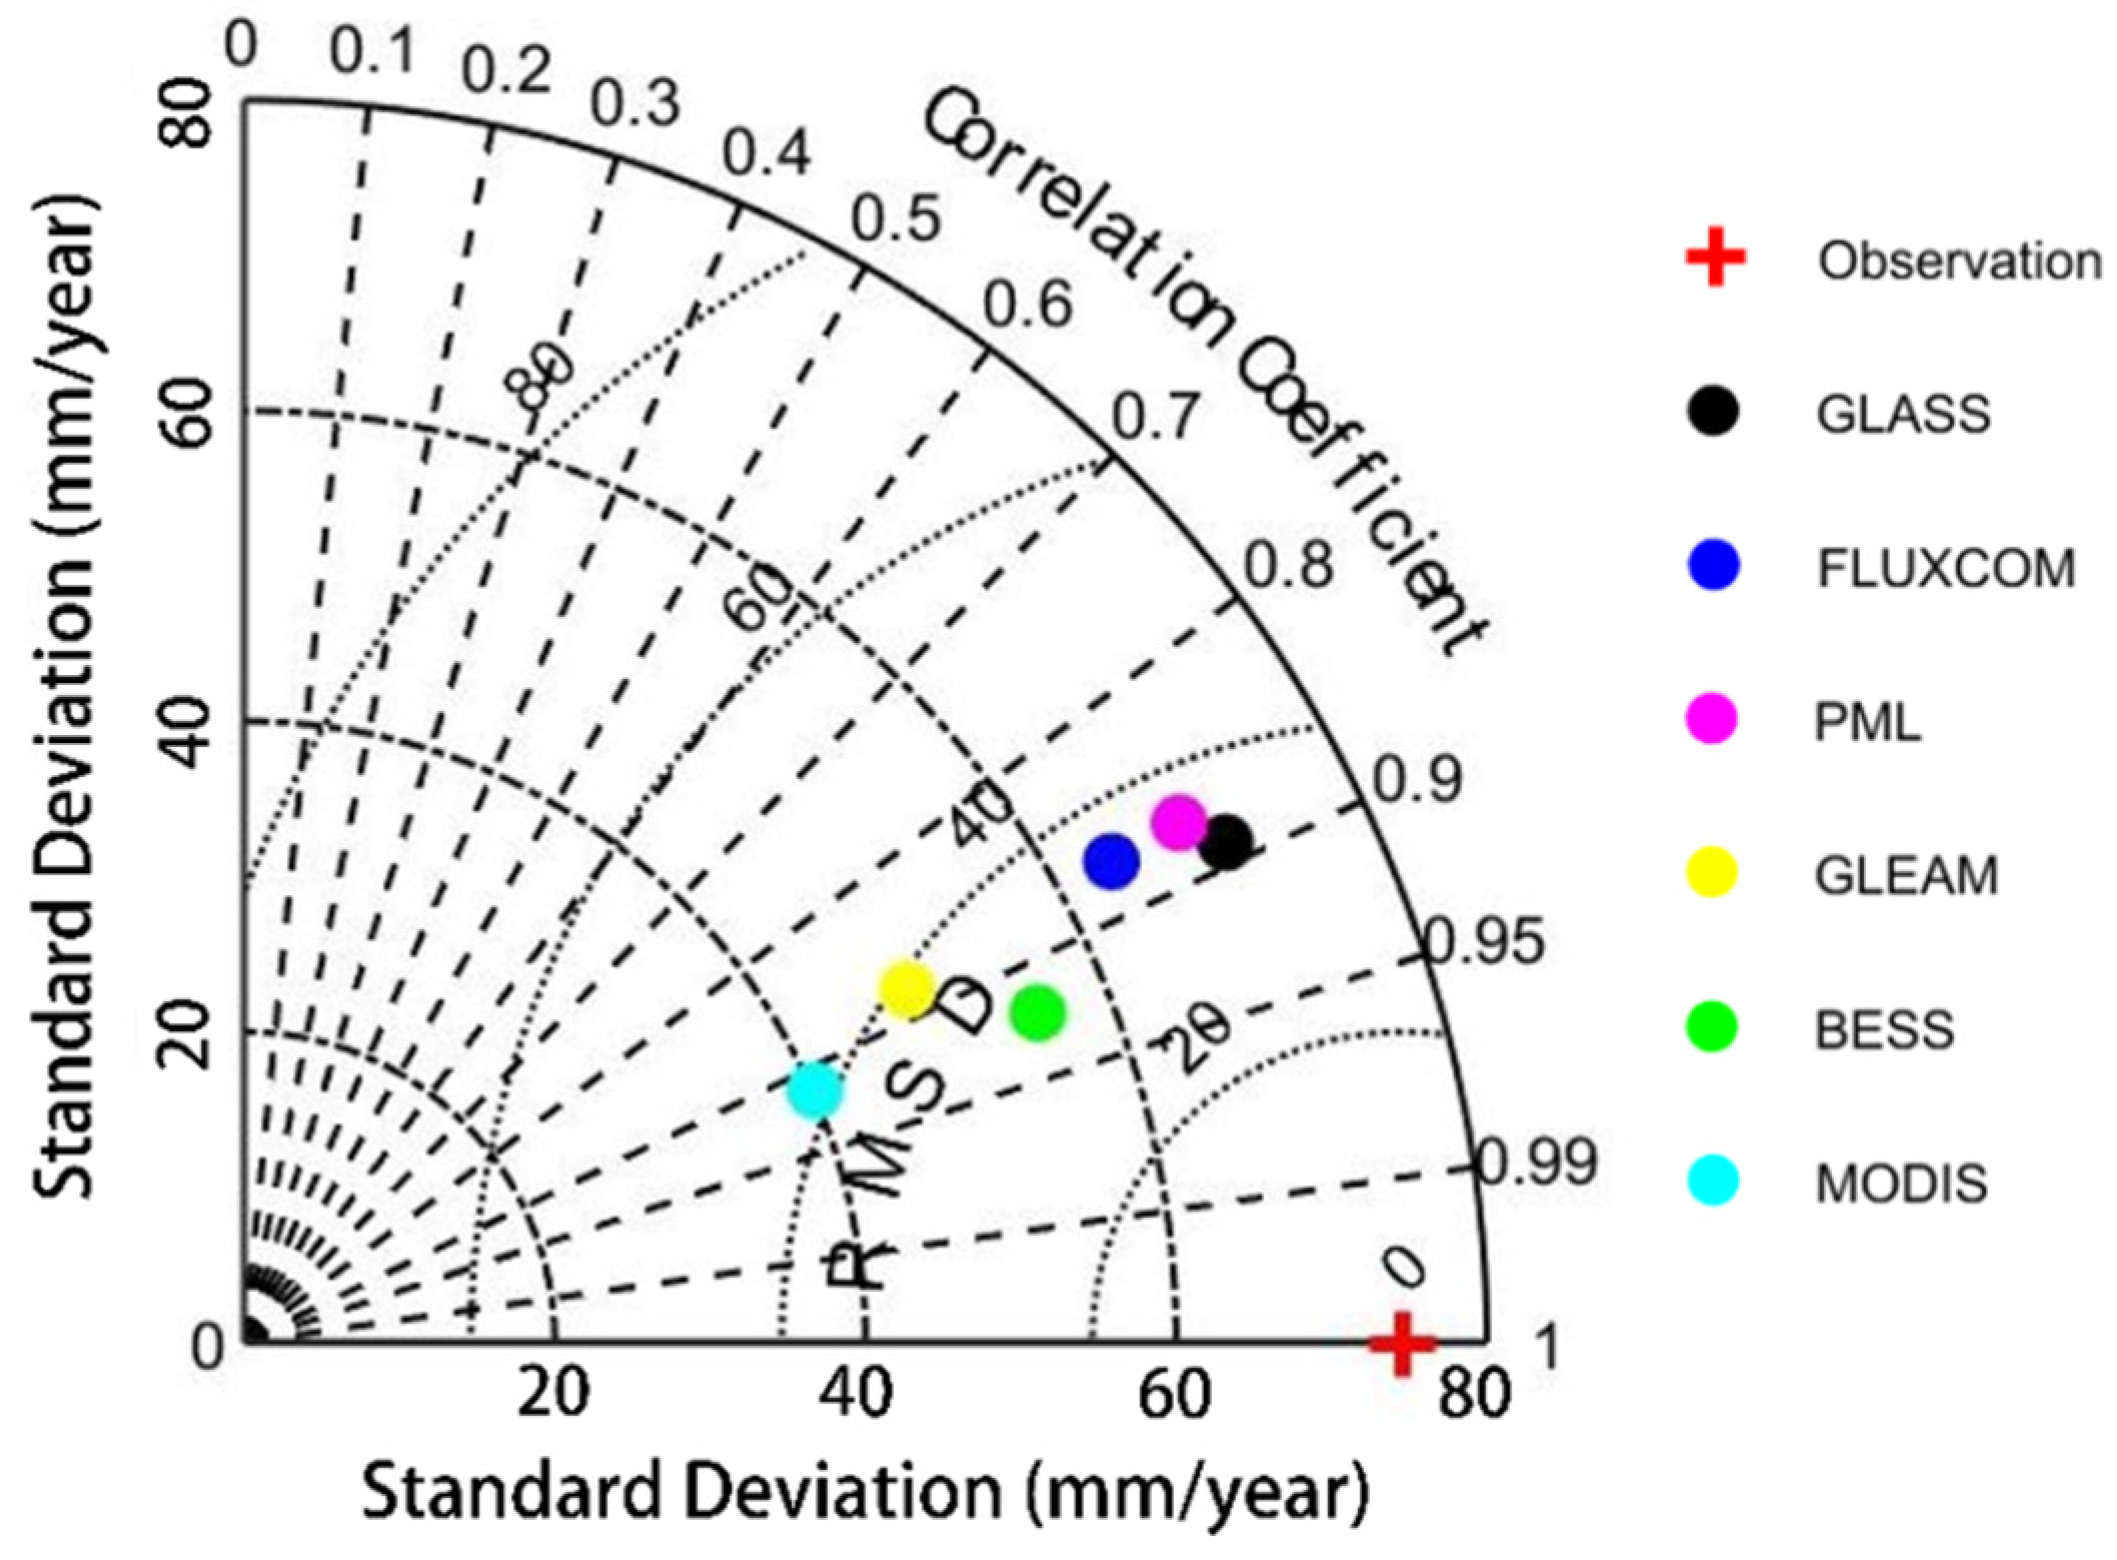
3.2. ET Evaluation with Water Balance Method

The WBET was used as the reference benchmark to evaluate the monthly ET calcualted from each satellite-based LE products at the basin scale. The time span of this study was 14 years (2002–2015). Figure 6 presents the comparsion of the calcualted ET derived from six LE products with WBET over the Haihe River basin. According to our statistical analysis, R2 and RMSE of the estimated monthly ET from six satellite-based LE products versus WBET varied from 0.76 to 0.85 with 99% confidence and 16.1 to 20.8 mm, respectively. Among six LE products, the ET estimates from GLASS LE product showed comparable performance (R2 = 0.79, RMSE = 18.8 mm) with ET estimates from other LE products, though BESS had the highest R2 of 0.85 (p < 0.01) and the smallest RMSE of 16.1 mm, and FLUXCOM provided the lowest R2 of 0.76 and the largest RMSE of 20.1 mm against WBET. Therefore, GLASS and other five LE products were validated to capture the variability of ET at basin scale.
The Taylor diagrams for annual WBET and ET estimates from the individual products for the all EC flux sites indicated that GLASS and other five LE products had the ability to simulate the annual ET variances at basin scale (Figure 7). Among them, BESS had the highest R value of 0.92 and the lowest RMSD of 31.7 mm, followed by GLASS product with a R of 0.89 and a RMSD of 34.2 mm. The R for the other four products varied from 0.87 to 0.92, and the RMSD varied from 34.2 to 41.2 mm. Overall, although the six satellite-derived LE products showed little discrepancies against WBET, BESS and GLASS LE products provided the most accurate ET estimates across the Haihe River Basin.

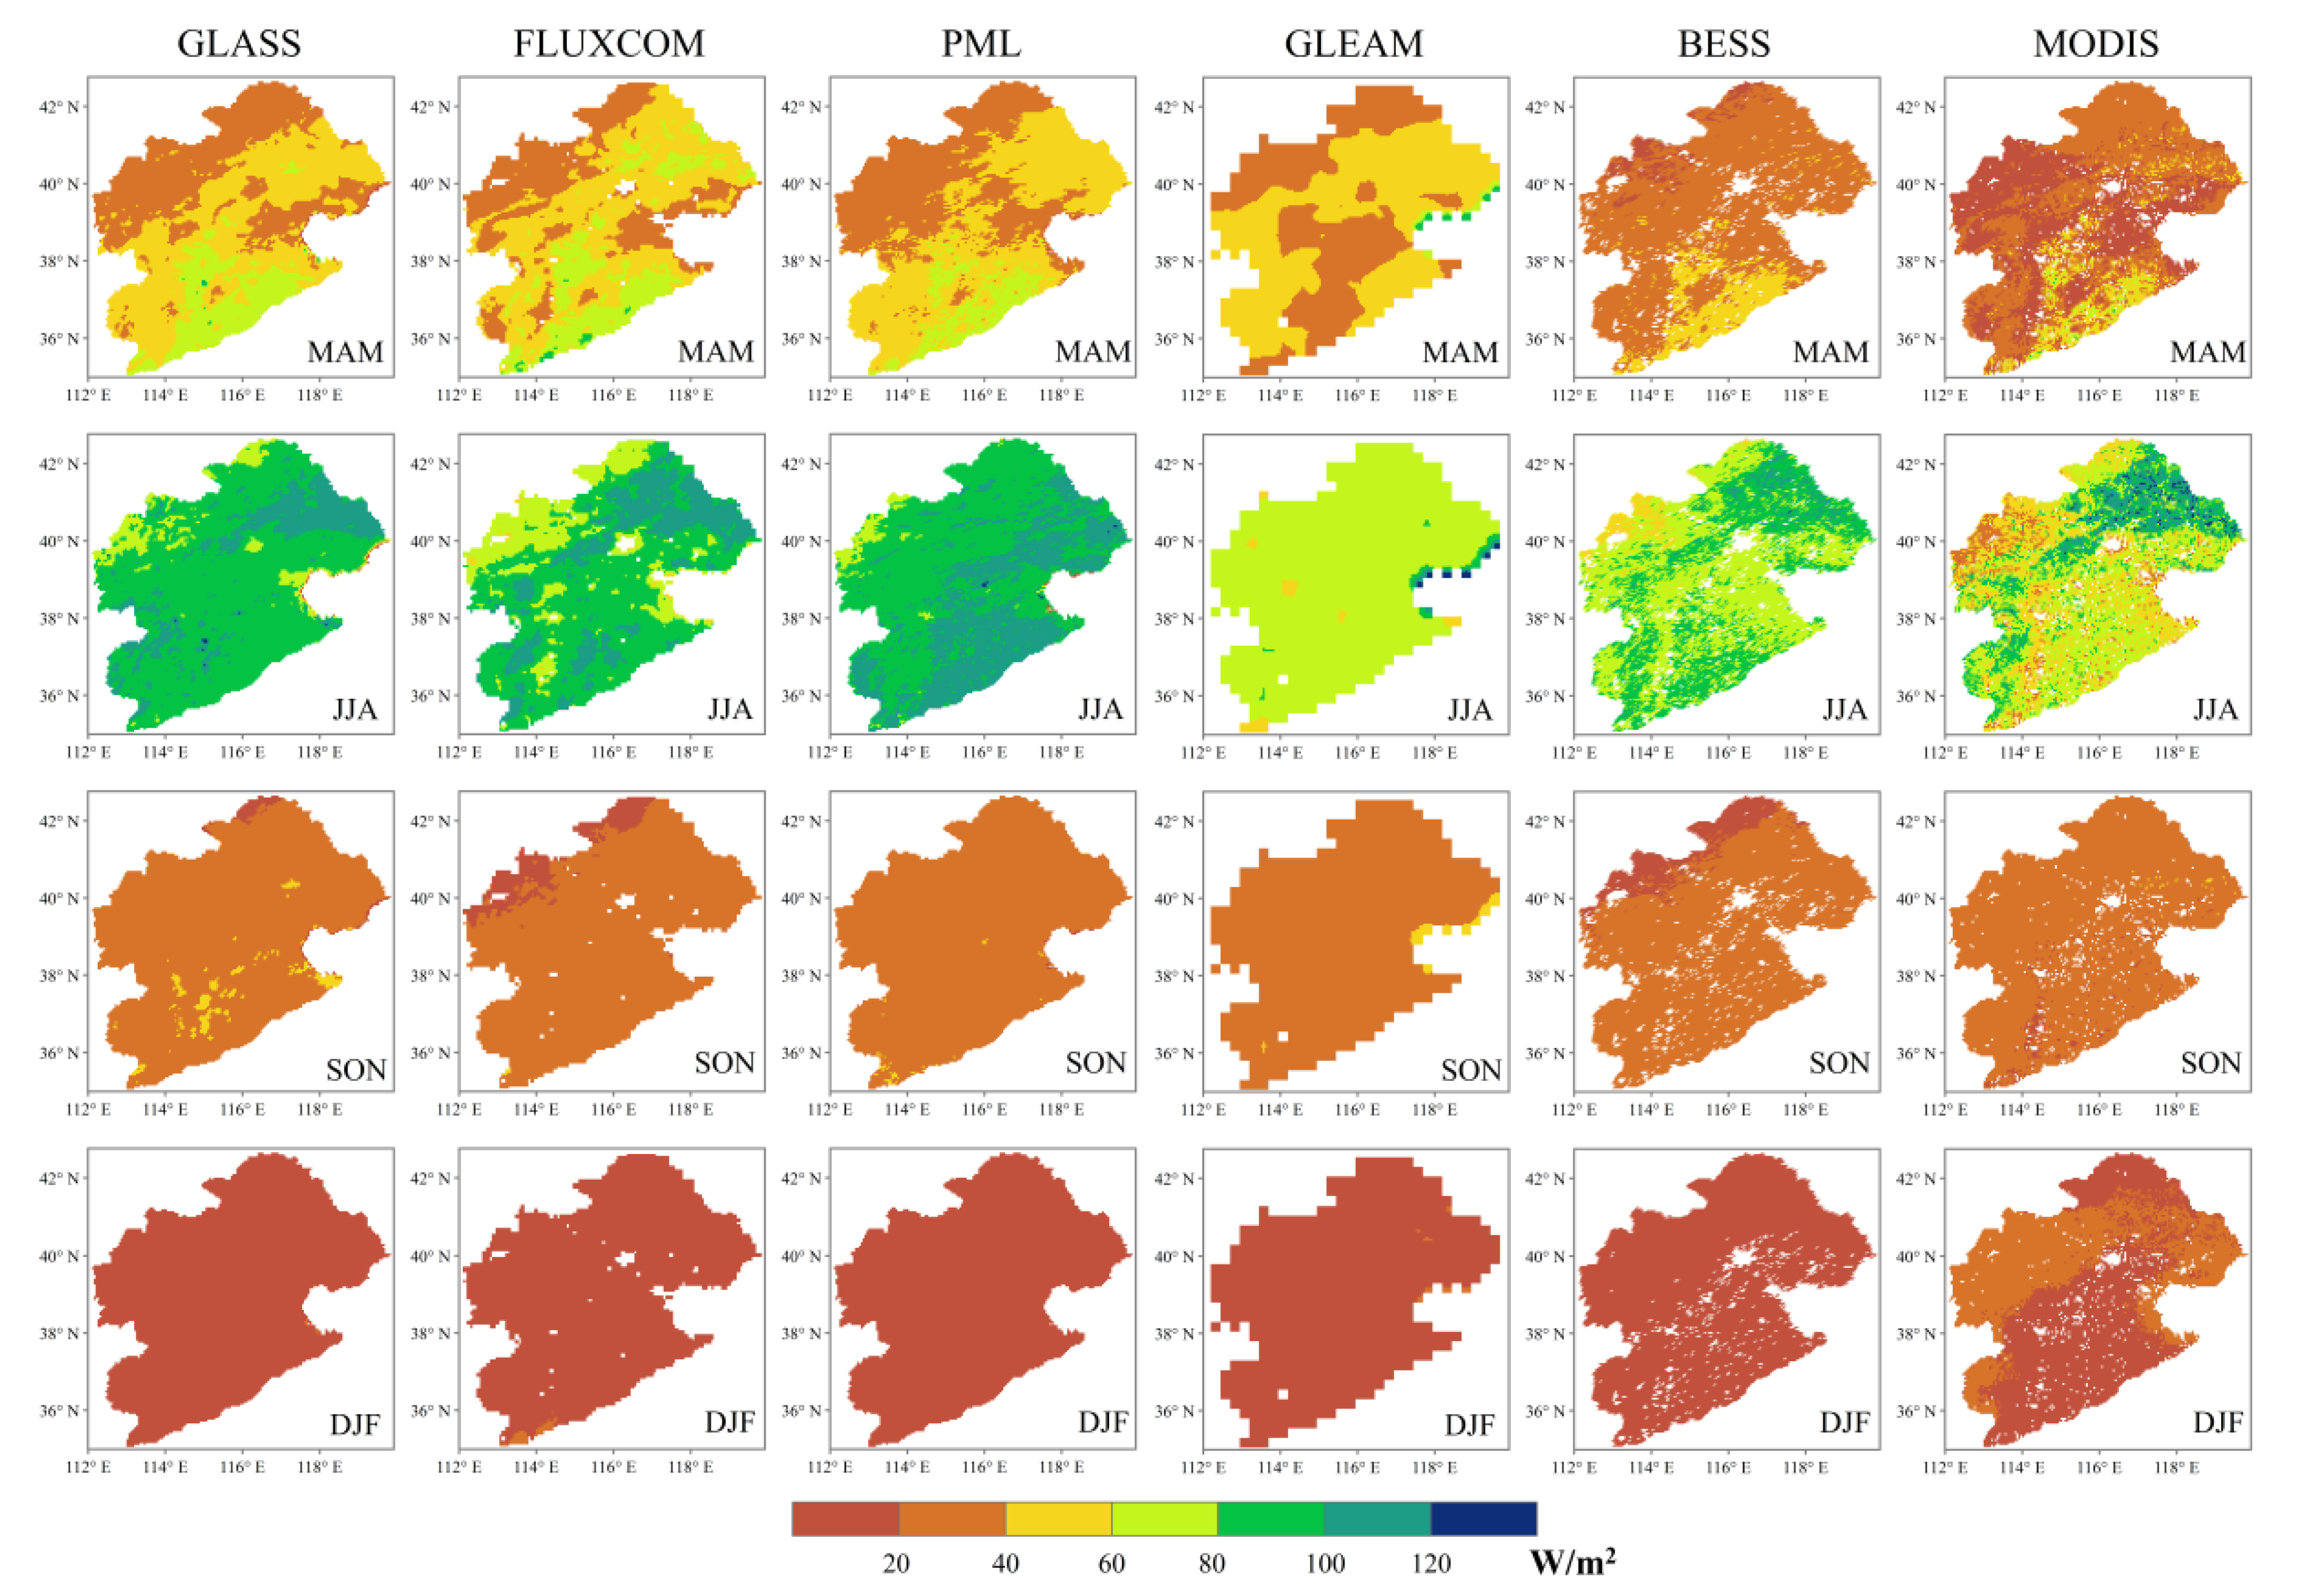
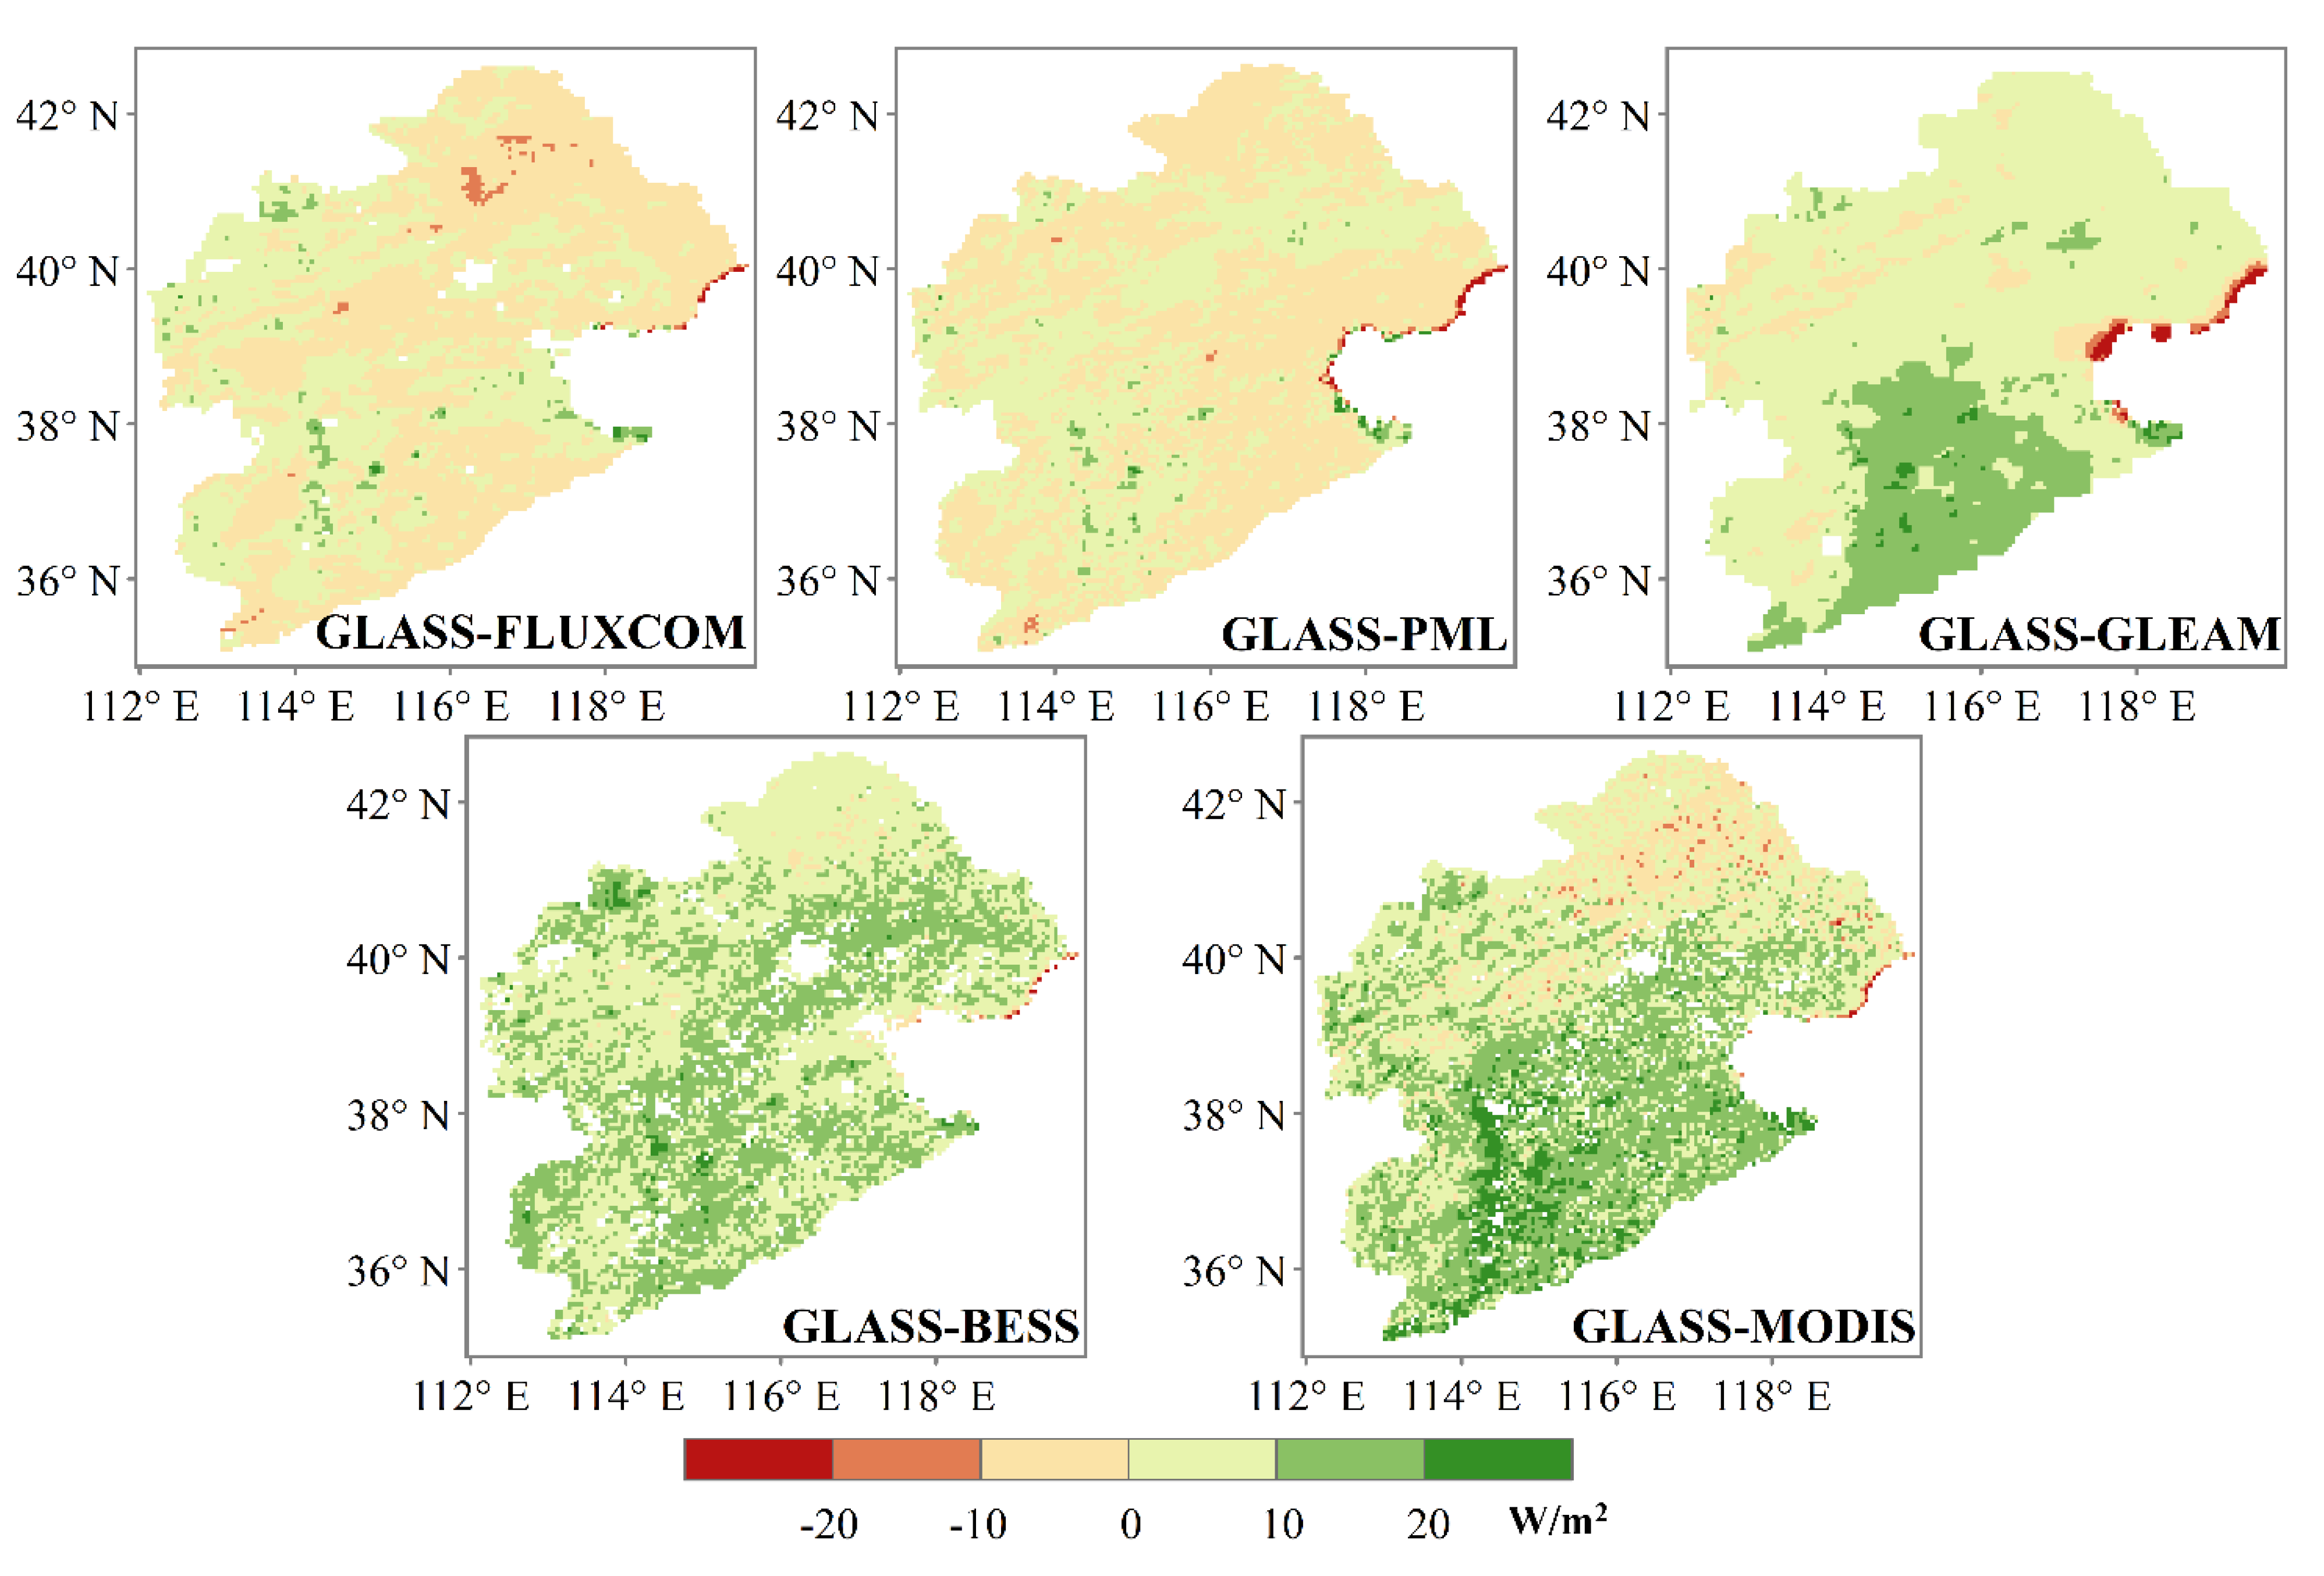
3.3. Spatial Distribution of LE in the Haihe River Basin of North China

Figure 8 shows the comparison of multiyear (2013–2015) mean seasonality of LE estimates in Haihe River basin of China from GLASS, FLUXCOM, PML, GLEAM, BESS and MODIS LE products. LE showed large spatial variability over the whole area and strong seasonality according to the climate conditions and there was similar spatiotemporal variability of estimated terrestrial LE from the six LE products. In the spring (MAM), the estimated terrestrial LE values in the HRB ranged from 20 to 60 W/m2 with a rapid rising in temperature. LE values in the southeast area were higher than that in the northern and northwestern area. In the summer (JJA), LE gradually increased relative to spring and reached the peak with higher temperatures and vegetation cover. The estimated terrestrial LE was mainly distributed in the range of 60 to 100 W/m2, and the variability in the spatial distribution were similar to spring. During fall months (SON), LE decreased significantly relative to summer due to dropped temperature and reduced vegetation cover. The estimated terrestrial LE were mainly distributed in the range of 20 to 40 W/m2, and the variability in the spatial distribution decreased relative to spring and summer. In the winter (DJF), the LE values were lowest and were obviously lower than that in the other seasons due to the low temperature and more snow. The estimated terrestrial LE values were below 20 W/m2 in winter months and the spatial patterns of LE were similar to fall. However, for different satellite LE products, they exhibit an irregular pattern for the same seasons. This may be attributed to the different spatial resolutions, different model structures and different forcing inputs [36].
To investigate the differences of the six satellite-based LE products, we further mapped spatial differences in the average annual terrestrial LE (2013–2015) between GLASS LE product and other five LE products (Figure 9). One notices that the differences of the average annual terrestrial LE among the GLASS, FLUXCOM and PML LE products were less than 10 W/m2 for most regions. In contrast, the differences of the average annual terrestrial LE among the GLASS, GLEAM, BESS and MODIS LE products were 10–20 W/m2 for most regions. Overall, in comparison to GLASS LE product, GLEAM, BESS and MODIS LE products yielded lower average annual terrestrial LE across almost HRB areas.

4. Discussion

4.1. Errors in Satellite-Based LE Products

The satellite-based LE models, the simplified equations of the physical process, are widely developed and used to understand the process of evaporation and transpiration. However, different models’ structure may lead to considerable uncertainties in LE estimations. In our study, six satellite-based LE products were generated with different strategies including empirical methods (e.g., machine learning method) and process-based methods. Validation results illustrated that both GLASS and FLUXCOM LE products based on the empirical methods outperformed other four process-based LE products (PML, GLEAM, BESS and MODIS) at site scale. This may be attributed to the fact that both GLASS and FLUXCOM LE products make full use of EC observations (more than 200 sites) distributed around the world [18,32]. GLASS LE product integrates multiple single LE process-based models by BMA method and FLUXCOM LE product uses the machine learning methods to estimate LE [18,32]. GLEAM LE product applies data assimilation method into Priestley-Taylor model to capture accurate soil moisture evaporation, contributing to more accurate LE [26]. PML LE product takes advantages of EC data from 95 widely-distributed sites to calibrate model, leading to better performance that BESS and MODIS LE products at site scale [30]. On the other hand, based on our water balance validation, BESS LE product has the best performance among all six products. This may be caused by the fact that BESS LE product uses a carbon-water-coupled module, which includes better physical mechanism with higher accuracy at basin scale [28]. MODIS LE product improves estimates of LE based on Penman-Monteith equation at global or regional scale [20,59].
The model input data, such as satellite and meteorological data, also has a great influence on the accuracies of LE products. Previous substantial studies has reported that vegetation parameters derived from satellite data had approximately 15–30% relative error [5,60]. And the classification accuracy of the land cover data from remote sensing data is general less than 78% [61]. More importantly, error in surface net radiation (Rn) data can introduce large biases into LE estimation. The Rn has a large influence on the partition of LE and H that is the energy source of LE [60]. Meanwhile, Rn is susceptible to the influence of clouds sky, leading to the overestimation of Rn [62]. Moreover, the meteorological data with low spatial resolution has large errors compared with ground measurement [63,64]. Badgley et al. has found that there is no most accurate meteorological reanalysis data for estimating land surface energy budgets [65]. Therefore, the errors in the input data may cause large errors in LE products.

4.2. Uncertainties in Reference Data and Evaluation Methods

Although we utilized the EC observation as reference data to validate six satellite-based LE products at site scale, the large uncertainties still exist in the LE evaluation framework. First, the EC observations errors and energy imbalance. According to previous studies, ground-observations from the EC sites have an error of approximately 10–30% [5,25]. The typical EC observations errors may lead to uncertainties for evaluating LE products. Importantly, EC method suffers energy imbalance and Foken reported that EC method cannot observe large eddies, which will cause H + LE ≠ Rn − G [66]. Although we correct the LE using the method proposed by Twine et al., this method is based on limited understandings of the nature of the energy imbalance and errors resulting from the unclosed energy problem remain unclear [50,67]. Second, the limited EC flux tower sites in our study. There are only six flux tower sites available in the Haihe River basin to validate LE products. These EC flux tower sites are sparsely distributed and covered with limited lands cover types. Therefore, limited EC flux tower sites in the Haihe River basin will lead to large uncertainties in LE evaluation. Third, the spatial scale mismatch. The spatial footprint of EC observation is approximately 100–300 m and the spatial resolution of six satellite-based LE products is more than 500 m [60,68]. Inaccurate representations of the EC footprint may result in large uncertainties in LE evaluation.
On the other hand, the WBET were used as reference data to validate six satellite-based LE products at basin scales. The WBET was generally based on the assumption that the total water storage change (TWSC) can be negligible over multi-year scale [41,69]. In fact, TWSC may not equal to zero over the multi-year scale when there is sustained climate change and/or human activities impacts on the water cycle [70]. Studies have showed that TWSCs vary greatly due to glacier and snow melting in headwaters of rivers, reservoir storage, and groundwater withdrawal for agricultural depletion, etc. [70,71,72]. The neglection of TWSC is projected to lead to uncertainties in the derivation of WBET. The GRACE mission provides TWSC observations, yet its coarse spatial resolution hampers its application in regional water budget estimation. To data, downscaling GRACE TWSC data using a forward algorithm may be the solution for estimating regional water budget in near future [73].

5. Conclusions

We evaluated the reliability of six satellite-based LE products in the vegetation dominated Haihe River basin of North China against ground-measured LE data collected from six eddy covariance flux tower sites at local scale and water balance method derived ET at basin scale. These six LE products consist of the GLASS LE product, FLUXCOM LE product, PML_V2 LE product, GLEAM LE product, BESS LE product, and MODIS LE product.
Our results indicated that all six satellite-based LE products were able to simulate the seasonal cycle of LE. At site scale, GLASS LE product provided the highest R2 (0.58, p < 0.01) and the lowest RMSE (28.2 W/m2), followed by FLUXCOM, PML, GLEAM, BESS, and MODIS LE products. At basin scale, the LE estimates from GLASS product showed comparable accuracy (R2 = 0.79, RMSE = 18.8 mm) with other LE products. Among them, the BESS product had the highest R2 value of 0.85 (p < 0.01) and the smallest RMSE value of 16.1 mm, and FLUXCOM presents the lowest R2 value of 0.76 and the largest RMSE value of 20.1 mm against WBET. The Spatial distribution of annual averaged terrestrial LE (2013–2015) illustrated that LE showed large spatial variability over the whole are and presented strong seasonality according to the climate conditions. Moreover, there is similar spatiotemporal variability of estimated terrestrial LE from the six LE products. Errors in satellite-based LE products and uncertainties in reference data and evaluation methods were also discussed. Overall, this study further demonstrates that GLASS LE product with 0.05 degree is promising dataset to evaluate regional water budget.

Author Contributions

Conceptualization, Y.L. and X.S.; methodology, Y.Y.; validation, H.C., L.Z. and L.W.; formal analysis, L.W. and K.S.; investigation, L.W. and K.S.; resources, L.W.; data curation, L.W.; writing—original draft preparation, J.N., J.Y., R.Y., L.L., X.G. and Z.X.; writing—review and editing, Y.Y., H.C., L.Z., L.W. and K.S.; visualization, L.W.; supervision, Y.Y.; project administration, Y.L. and Y.Y.; funding acquisition, Y.L., X.S. and Y.Y. All authors have read and agreed to the published version of the manuscript.

Funding

This research was funded by the National Natural Science Foundation of China (Grant No. 41671331) and the National Key Research and Development Program of China (Grant No. 2016YFA0600103). This work was also supported by China Scholarship Council under Grant 201806040217 and Natural Resources Department of ITC, University of Twente, Netherlands.

Institutional Review Board Statement

Not applicable.

Informed Consent Statement

Not applicable.

Data Availability Statement

Data available on request.

Acknowledgments

The authors thank Shaomin Liu, Ziwei Xu, and Zhongli Zhu from Beijing Normal University, China, and Guirui Yu, and Zhi Chen from Institute of Geographic Sciences and Natural Resources Research, Chinese Academy of Sciences, Beijing, China for providing ground-measured data. Acknowledgement for the data support from “National Earth System Science Data Center, National Science & Technology Infrastructure of China. (http://www.geodata.cn accessed on 11 June 2021)”. Acknowledgement also for the data support from “National Tibetan Plateau Data Center (http://data.tpdc.ac.cn/zh-hans/data accessed on 11 June 2021)”. GLASS data can be obtained online (http://www.glass.umd.edu/ accessed on 11 June 2021). The FLUXCOM datasets are available online (https://www.fluxcom.org/ accessed on 11 June 2021). The PML-V2 LE product was obtained from the National Tibetan Plateau Data Center (TPDC) (https://data.tpdc.ac.cn/zh-hans/ accessed on 11 June 2021). GLEAM LE product can be downloaded online (https://www.gleam.eu/ accessed on 11 June 2021). BESS LE data can be acauired from the website (https://www.environment.snu.ac.kr/bess-flux accessed on 11 June 2021). MODIS LE products can be free accessible online (https://modis.gsfc.nasa.gov/ accessed on 11 June 2021). The precipitation data can be obtained from the website (https://data.tpdc.ac.cn/zh-hans/data accessed on 11 June 2021). The GLDAS dataset can be downloaded from the NASA Goddard Earth Sciences Data and Information Services Center (GES DISC) (https://ldas.gsfc.nasa.gov/gldas/ accessed on 11 June 2021).

Conflicts of Interest

The authors declare no conflict of interest.

References

  1. Betts, A.K. Land-Surface-Atmosphere Coupling in Observations and Models. J. Adv. Model. Earth Syst. 2009, 1, 1–18. [Google Scholar] [CrossRef]
  2. Liang, S.; Wang, K.; Zhang, X.; Wild, M. Review on Estimation of Land Surface Radiation and Energy Budgets From Ground Measurement, Remote Sensing and Model Simulations. IEEE J.-STARS 2010, 3, 225–240. [Google Scholar] [CrossRef]
  3. Vinukollu, R.K.; Wood, E.F.; Ferguson, C.R.; Fisher, J.B. Global estimates of evapotranspiration for climate studies using multi-sensor remote sensing data: Evaluation of three process-based approaches. Remote Sens. Environ. 2011, 115, 801–823. [Google Scholar] [CrossRef]
  4. Shukla, J.; Mintz, Y. Influence of land-surface evapo-transpiration on the earths climate. Science 1982, 215, 1498–1501. [Google Scholar] [CrossRef]
  5. Wang, K.; Dickinson, R.E. A review of global terrestrial evapotranspiration: Observation, modeling, climatology, and climatic variability. Rev. Geophys. 2012, 50, 1–54. [Google Scholar] [CrossRef]
  6. Anderson, M.C.; Norman, J.M.; Mecikalski, J.R.; Otkin, J.A.; Kustas, W.P. A climatological study of evapotranspiration and moisture stress across the continental United States based on thermal remote sensing: 1. Model formulation. J. Geophys. Res.-Atmos. 2007, 112, 1–17. [Google Scholar] [CrossRef]
  7. Yao, Y.; Liang, S.; Cheng, J.; Liu, S.; Fisher, J.B.; Zhang, X.; Jia, K.; Zhao, X.; Qing, Q.; Zhao, B.; et al. MODIS-driven estimation of terrestrial latent heat flux in China based on a modified Priestley-Taylor algorithm. Agric. For. Meteorol. 2013, 171, 187–202. [Google Scholar] [CrossRef]
  8. Xiong, J.; Wu, B.; Zhou, Y.; Li, J. IEEE Estimating Evapotranspiration using Remote Sensing in the Haihe Basin. In Proceedings of the IEEE International Geoscience and Remote Sensing Symposium (IGARSS), Denver, CO, USA, 31 July–4 August 2006; pp. 1044–1047. [Google Scholar]
  9. Jia, Z.; Liu, S.; Xu, Z.; Chen, Y.; Zhu, M. Validation of remotely sensed evapotranspiration over the Hai River Basin, China. J. Geophys. Res.-Atmos. 2012, 117, 1–21. [Google Scholar] [CrossRef]
  10. Wu, B.; Yan, N.; Xiong, J.; Bastiaanssen, W.G.M.; Zhu, W.; Stein, A. Validation of ETWatch using field measurements at diverse landscapes: A case study in Hai Basin of China. J. Hydrol. 2012, 436, 67–80. [Google Scholar] [CrossRef]
  11. Ke, Y.; Im, J.; Park, S.; Gong, H. Downscaling of MODIS One Kilometer Evapotranspiration Using Landsat-8 Data and Machine Learning Approaches. Remote Sens. 2016, 8, 215. [Google Scholar] [CrossRef] [Green Version]
  12. Zhang, Y.Q.; Chiew, F.H.S.; Zhang, L.; Leuning, R.; Cleugh, H.A. Estimating catchment evaporation and runoff using MODIS leaf area index and the Penman-Monteith equation. Water Resour. Res. 2008, 44, 1–15. [Google Scholar] [CrossRef]
  13. Carter, C.; Liang, S. Comprehensive evaluation of empirical algorithms for estimating land surface evapotranspiration. Agric. For. Meteorol. 2018, 256, 334–345. [Google Scholar] [CrossRef] [Green Version]
  14. Chen, Y.; Xia, J.; Liang, S.; Feng, J.; Fisher, J.B.; Li, X.; Li, X.; Liu, S.; Ma, Z.; Miyata, A.; et al. Comparison of satellite-based evapotranspiration models over terrestrial ecosystems in China. Remote Sens. Environ. 2014, 140, 279–293. [Google Scholar] [CrossRef]
  15. Feng, F.; Chen, J.; Li, X.; Yao, Y.; Liang, S.; Liu, M.; Zhang, N.; Guo, Y.; Yu, J.; Sun, M. Validity of Five Satellite-Based Latent Heat Flux Algorithms for Semi-arid Ecosystems. Remote Sens. 2015, 7, 16733–16755. [Google Scholar] [CrossRef] [Green Version]
  16. Zeng, Z.; Wang, T.; Zhou, F.; Ciais, P.; Mao, J.; Shi, X.; Piao, S. A worldwide analysis of spatiotemporal changes in water balance-based evapotranspiration from 1982 to 2009. J. Geophys. Res.-Atmos. 2014, 119, 1186–1202. [Google Scholar] [CrossRef]
  17. Bodesheim, P.; Jung, M.; Gans, F.; Mahecha, M.D.; Reichstein, M. Upscaled diurnal cycles of land-atmosphere fluxes: A new global half-hourly data product. Earth Syst. Sci. Data 2018, 10, 1327–1365. [Google Scholar] [CrossRef] [Green Version]
  18. Jung, M.; Koirala, S.; Weber, U.; Ichii, K.; Gans, F.; Camps-Valls, G.; Papale, D.; Schwalm, C.; Tramontana, G.; Reichstein, M. The FLUXCOM ensemble of global land-atmosphere energy fluxes. Sci. Data 2019, 6, 74. [Google Scholar] [CrossRef] [Green Version]
  19. Kustas, W.P. Estimates of evapotranspiration with a one-layer and 2-layer model of heat-transfer over partial canopy cover. J. Appl. Meteorol. Clim. 1990, 29, 704–715. [Google Scholar] [CrossRef]
  20. Mu, Q.; Zhao, M.; Running, S.W. Improvements to a MODIS global terrestrial evapotranspiration algorithm. Remote Sens. Environ. 2011, 115, 1781–1800. [Google Scholar] [CrossRef]
  21. Penman, H.L. Natural evaporation from open water, bare soil and grass. Proc. R. Soc. Lond. A 1948, 193, 120–145. [Google Scholar]
  22. Fisher, J.B.; Tu, K.P.; Baldocchi, D.D. Global estimates of the land-atmosphere water flux based on monthly AVHRR and ISLSCP-II data, validated at 16 FLUXNET sites. Remote Sens. Environ. 2008, 112, 901–919. [Google Scholar] [CrossRef]
  23. Priestley, C.H.B.; Taylor, R.J. On the Assessment of surface heat-flux and evaporation using large-scale parameters. Mon. Weather Rev. 1972, 100, 81–92. [Google Scholar] [CrossRef]
  24. Price, J.C. Using spatial context in satellite data to infer regional scale evapotranspiration. IEEE Trans. Geosci. Remote Sens. 1990, 28, 940–948. [Google Scholar] [CrossRef] [Green Version]
  25. Mu, Q.; Heinsch, F.A.; Zhao, M.; Running, S.W. Development of a global evapotranspiration algorithm based on MODIS and global meteorology data. Remote Sens. Environ. 2007, 111, 519–536. [Google Scholar] [CrossRef]
  26. Martens, B.; Miralles, D.G.; Lievens, H.; van der Schalie, R.; de Jeu, R.A.M.; Fernandez-Prieto, D.; Beck, H.E.; Dorigo, W.A.; Verhoest, N.E.C. GLEAM v3: Satellite-based land evaporation and root-zone soil moisture. Geosci. Model Dev. 2017, 10, 1903–1925. [Google Scholar] [CrossRef] [Green Version]
  27. Miralles, D.G.; Holmes, T.R.H.; De Jeu, R.A.M.; Gash, J.H.; Meesters, A.G.C.A.; Dolman, A.J. Global land-surface evaporation estimated from satellite-based observations. Hydrol. Earth Syst. Sci. 2011, 15, 453–469. [Google Scholar] [CrossRef] [Green Version]
  28. Jiang, C.; Ryu, Y. Multi-scale evaluation of global gross primary productivity and evapotranspiration products derived from Breathing Earth System Simulator (BESS). Remote Sens. Environ. 2016, 186, 528–547. [Google Scholar] [CrossRef]
  29. Ryu, Y.; Baldocchi, D.D.; Kobayashi, H.; van Ingen, C.; Li, J.; Black, T.A.; Beringer, J.; van Gorsel, E.; Knohl, A.; Law, B.E.; et al. Integration of MODIS land and atmosphere products with a coupled-process model to estimate gross primary productivity and evapotranspiration from 1 km to global scales. Glob. Biogeochem. Cycles 2011, 25, 1–24. [Google Scholar] [CrossRef] [Green Version]
  30. Zhang, Y.; Kong, D.; Gan, R.; Chiew, F.H.S.; McVicar, T.R.; Zhang, Q.; Yang, Y. Coupled estimation of 500 m and 8-day resolution global evapotranspiration and gross primary production in 2002–2017. Remote Sens. Environ. 2019, 222, 165–182. [Google Scholar] [CrossRef]
  31. Liang, S.; Cheng, J.; Jia, K.; Jiang, B.; Liu, Q.; Xiao, Z.; Yao, Y.; Yuan, W.; Zhang, X.; Zhao, X.; et al. The Global Land Surface Satellite (GLASS) Product Suite. Bull. Am. Meteorol. Soc. 2021, 102, E323–E337. [Google Scholar] [CrossRef]
  32. Yao, Y.; Liang, S.; Li, X.; Hong, Y.; Fisher, J.B.; Zhang, N.; Chen, J.; Cheng, J.; Zhao, S.; Zhang, X.; et al. Bayesian multimodel estimation of global terrestrial latent heat flux from eddy covariance, meteorological, and satellite observations. J. Geophys. Res.-Atmos. 2014, 119, 4521–4545. [Google Scholar] [CrossRef]
  33. Yao, Y.; Liang, S.; Li, X.; Chen, J.; Wang, K.; Jia, K.; Cheng, J.; Jiang, B.; Fisher, J.B.; Mu, Q.; et al. A satellite-based hybrid algorithm to determine the Priestley-Taylor parameter for global terrestrial latent heat flux estimation across multiple biomes. Remote Sens. Environ. 2015, 165, 216–233. [Google Scholar] [CrossRef] [Green Version]
  34. Dirmeyer, P.A.; Gao, X.; Zhao, M.; Guo, Z.; Oki, T.; Hanasaki, N. GSWP-2—Multimodel anlysis and implications for our perception of the land surface. Bull. Am. Meteorol. Soc. 2006, 87, 1381–1398. [Google Scholar] [CrossRef] [Green Version]
  35. Shang, K.; Yao, Y.; Li, Y.; Yang, J.; Jia, K.; Zhang, X.; Chen, X.; Bei, X.; Guo, X. Fusion of Five Satellite-Derived Products Using Extremely Randomized Trees to Estimate Terrestrial Latent Heat Flux over Europe. Remote Sens. 2020, 12, 687. [Google Scholar] [CrossRef] [Green Version]
  36. Yao, Y.; Zhang, Y.; Liu, Q.; Liu, S.; Jia, K.; Zhang, X.; Xu, Z.; Xu, T.; Chen, J.; Fisher, J.B. Evaluation of a satellite-derived model parameterized by three soil moisture constraints to estimate terrestrial latent heat flux in the Heihe River basin of Northwest China. Sci. Total Environ. 2019, 695, 133787. [Google Scholar] [CrossRef]
  37. Shang, K.; Yao, Y.; Liang, S.; Zhang, Y.; Fisher, J.B.; Chen, J.; Liu, S.; Xu, Z.; Zhang, Y.; Jia, K.; et al. DNN-MET: A deep neural networks method to integrate satellite-derived evapotranspiration products, eddy covariance observations and ancillary information. Agric. For. Meteorol. 2021, 308, 108582. [Google Scholar] [CrossRef]
  38. Mahrt, L. Computing turbulent fluxes near the surface: Needed improvements. Agric. For. Meteorol. 2010, 150, 501–509. [Google Scholar] [CrossRef]
  39. Ma, N.; Szilagyi, J.; Zhang, Y.; Liu, W. Complementary-Relationship-Based Modeling of Terrestrial Evapotranspiration Across China During 1982-2012: Validations and Spatiotemporal Analyses. J. Geophys. Res.-Atmos. 2019, 124, 4326–4351. [Google Scholar] [CrossRef]
  40. Long, D.; Longuevergne, L.; Scanlon, B.R. Uncertainty in evapotranspiration from land surface modeling, remote sensing, and GRACE satellites. Water Resour. Res. 2014, 50, 1131–1151. [Google Scholar] [CrossRef] [Green Version]
  41. Senay, G.B.; Leake, S.; Nagler, P.L.; Artan, G.; Dickinson, J.; Cordova, J.T.; Glenn, E.P. Estimating basin scale evapotranspiration (ET) by water balance and remote sensing methods. Hydrol. Process. 2011, 25, 4037–4049. [Google Scholar] [CrossRef]
  42. Mao, Y.; Wang, K. Comparison of evapotranspiration estimates based on the surface water balance, modified Penman-Monteith model, and reanalysis data sets for continental China. J. Geophys. Res.-Atmos. 2017, 122, 3228–3244. [Google Scholar] [CrossRef]
  43. Wu, X.; Li, S.; Liu, B.; Xu, D. Spatial and Temporal Variation Characteristics of Snowfall in the Haihe River Basin from 1960 to 2016. Water 2021, 13, 1798. [Google Scholar] [CrossRef]
  44. Yu, G.-R.; Wen, X.-F.; Sun, X.-M.; Tanner, B.D.; Lee, X.; Chen, J.-Y. Overview of ChinaFLUX and evaluation of its eddy covariance measurement. Agric. For. Meteorol. 2006, 137, 125–137. [Google Scholar] [CrossRef]
  45. Liu, S.; Xu, Z.; National Tibetan Plateau Data Center. Multi-Scale Surface Flux and Meteorological Elements Observation Dataset in the Hai River Basin (Huailai Station-Eddy Covariance System-10m Tower, 2014). 2016. Available online: https://data.tpdc.ac.cn/en/data/f5b47cc3-1961-4267-bf00-db7d9639809c/ (accessed on 11 June 2021).
  46. Liu, S.; Xu, Z.; National Tibetan Plateau Data Center. Multi-Scale Surface Flux and Meteorological Elements Observation Dataset in the Hai River Basin (Daxing Site-Eddy Covariance System) (2008–2010). 2016. Available online: https://data.tpdc.ac.cn/en/data/6adc1a5f-c96c-4d5a-9eb7-e87cf57a6569/ (accessed on 11 June 2021).
  47. Liu, S.; Xu, Z.; National Tibetan Plateau Data Center. Multi-Scale Surface Flux and Meteorological Elements Observation Dataset in the Hai River Basin (Miyun Site-Eddy Covariance System) (2008–2010). 2016. Available online: https://data.tpdc.ac.cn/en/data/4de3790b-72c8-49aa-bb5f-f365869bd73a/ (accessed on 11 June 2021).
  48. Liu, S.; Xu, Z.; National Tibetan Plateau Data Center. Multi-Scale Surface Flux and Meteorological Elements Observation Dataset in the Hai River Basin (Guantao Site-Automatic Weather Station) (2008–2010). 2016. Available online: https://data.tpdc.ac.cn/en/data/ce779155-c730-45ef-954a-12c08af73506/ (accessed on 11 June 2021).
  49. Xu, Z.; Liu, S.; National Tibetan Plateau Data Center. Multi-Scale Surface Flux and Meteorological Elements Observation Dataset in the Hai River Basin (Huailai Station-Eddy Covariance System-10m Tower, 2013). 2016. Available online: https://data.tpdc.ac.cn/en/data/f33e6c8f-e407-4848-b1dd-b4b9762c245f/ (accessed on 11 June 2021).
  50. Twine, T.E.; Kustas, W.P.; Norman, J.M.; Cook, D.R.; Houser, P.R.; Meyers, T.P.; Prueger, J.H.; Starks, P.J.; Wesely, M.L. Correcting eddy-covariance flux underestimates over a grassland. Agric. For. Meteorol. 2000, 103, 279–300. [Google Scholar] [CrossRef] [Green Version]
  51. Zhang, Y.; National Tibetan Plateau Data Center. PML_V2 Global Evapotranspiration and Gross Primary Production (2002.07–2019.08). 2020. Available online: https://data.tpdc.ac.cn/en/data/48c16a8d-d307-4973-abab-972e9449627c/ (accessed on 11 June 2021).
  52. Peng, S.; National Tibetan Plateau Data Center. High-Spatial-Resolution Monthly Temperatures Dataset over China during 1901–2017). 2020. Available online: https://zenodo.org/record/3185722#.YZt5FroRVPY (accessed on 11 June 2021).
  53. Peng, S.; Ding, Y.; Liu, W.; Li, Z. 1 km monthly temperature and precipitation dataset for China from 1901 to 2017. Earth Syst. Sci. Data 2019, 11, 1931–1946. [Google Scholar] [CrossRef] [Green Version]
  54. Peng, S.; Gang, C.; Cao, Y.; Chen, Y. Assessment of climate change trends over the Loess Plateau in China from 1901 to 2100. Int. J. Climatol. 2018, 38, 2250–2264. [Google Scholar] [CrossRef]
  55. Rodell, M.; Houser, P.R.; Jambor, U.; Gottschalck, J.; Mitchell, K.; Meng, C.J.; Arsenault, K.; Cosgrove, B.; Radakovich, J.; Bosilovich, M.; et al. The global land data assimilation system. Bull. Am. Meteorol. Soc. 2004, 85, 381–394. [Google Scholar] [CrossRef] [Green Version]
  56. Velpuri, N.M.; Senay, G.B.; Singh, R.K.; Bohms, S.; Verdin, J.P. A comprehensive evaluation of two MODIS evapotranspiration products over the conterminous United States: Using point and gridded FLUXNET and water balance ET. Remote Sens. Environ. 2013, 139, 35–49. [Google Scholar] [CrossRef]
  57. Xu, T.; Guo, Z.; Xia, Y.; Ferreira, V.G.; Liu, S.; Wang, K.; Yao, Y.; Zhang, X.; Zhao, C. Evaluation of twelve evapotranspiration products from machine learning, remote sensing and land surface models over conterminous United States. J. Hydrol. 2019, 578, 124105. [Google Scholar] [CrossRef]
  58. Taylor, K.E. Summarizing multiple aspects of model performance in a single diagram. J. Geophys. Res.-Atmos. 2001, 106, 7183–7192. [Google Scholar] [CrossRef]
  59. Ruhoff, A.L.; Paz, A.R.; Aragao, L.E.O.C.; Mu, Q.; Malhi, Y.; Collischonn, W.; Rocha, H.R.; Running, S.W. Assessment of the MODIS global evapotranspiration algorithm using eddy covariance measurements and hydrological modelling in the Rio Grande basin. Hydrol. Sci. J. 2013, 58, 1658–1676. [Google Scholar] [CrossRef]
  60. Kalma, J.D.; McVicar, T.R.; McCabe, M.F. Estimating Land Surface Evaporation: A Review of Methods Using Remotely Sensed Surface Temperature Data. Surv. Geophys. 2008, 29, 421–469. [Google Scholar] [CrossRef]
  61. Hansen, M.C.; Defries, R.S.; Townshend, J.R.G.; Sohlberg, R. Global land cover classification at 1km spatial resolution using a classification tree approach. Int. J. Remote. Sens. 2000, 21, 1331–1364. [Google Scholar] [CrossRef]
  62. Bisht, G.; Bras, R.L. Estimation of net radiation from the MODIS data under all sky conditions: Southern Great Plains case study. Remote Sens. Environ. 2010, 114, 1522–1534. [Google Scholar] [CrossRef]
  63. Hersbach, H.; Bell, B.; Berrisford, P.; Hirahara, S.; Horanyi, A.; Munoz-Sabater, J.; Nicolas, J.; Peubey, C.; Radu, R.; Schepers, D.; et al. The ERA5 global reanalysis. Q. J. R. Meteorol. Soc. 2020, 146, 1999–2049. [Google Scholar] [CrossRef]
  64. Rienecker, M.M.; Suarez, M.J.; Gelaro, R.; Todling, R.; Bacmeister, J.; Liu, E.; Bosilovich, M.G.; Schubert, S.D.; Takacs, L.; Kim, G.-K.; et al. MERRA: NASA’s Modern-Era Retrospective Analysis for Research and Applications. J. Clim. 2011, 24, 3624–3648. [Google Scholar] [CrossRef]
  65. Badgley, G.; Fisher, J.B.; Jimenez, C.; Tu, K.P.; Vinukollu, R. On Uncertainty in Global Terrestrial Evapotranspiration Estimates from Choice of Input Forcing Datasets. J. Hydrometeorol. 2015, 16, 1449–1455. [Google Scholar] [CrossRef]
  66. Foken, T. The energy balance closure problem: An overview. Ecol. Appl. 2008, 18, 1351–1367. [Google Scholar] [CrossRef]
  67. Hui, D.F.; Wan, S.Q.; Su, B.; Katul, G.; Monson, R.; Luo, Y.Q. Gap-filling missing data in eddy covariance measurements using multiple imputation (MI) for annual estimations. Agric. For. Meteorol. 2004, 121, 93–111. [Google Scholar] [CrossRef]
  68. Glenn, E.P.; Morino, K.; Didan, K.; Jordan, F.; Carroll, K.C.; Nagler, P.L.; Hultine, K.; Sheader, L.; Waugh, J. Scaling sap flux measurements of grazed and ungrazed shrub communities with fine and coarse-resolution remote sensing. Ecohydrology 2008, 1, 316–329. [Google Scholar] [CrossRef]
  69. Zhang, K.; Kimball, J.S.; Nemani, R.R.; Running, S.W. A continuous satellite-derived global record of land surface evapotranspiration from 1983 to 2006. Water Resour. Res. 2010, 46, 1–21. [Google Scholar] [CrossRef] [Green Version]
  70. Mao, Y.; Wang, K.; Liu, X.; Liu, C. Water storage in reservoirs built from 1997 to 2014 significantly altered the calculated evapotranspiration trends over China. J. Geophys. Res.-Atmos. 2016, 121, 10097–10112. [Google Scholar] [CrossRef]
  71. Rodell, M.; Famiglietti, J.S.; Wiese, D.N.; Reager, J.T.; Beaudoing, H.K.; Landerer, F.W.; Lo, M.H. Emerging trends in global freshwater availability. Nature 2018, 557, 651–659. [Google Scholar] [CrossRef] [PubMed]
  72. Scanlon, B.R.; Longuevergne, L.; Long, D. Ground referencing GRACE satellite estimates of groundwater storage changes in the California Central Valley, USA. Water Resour. Res. 2012, 48, 1–9. [Google Scholar] [CrossRef] [Green Version]
  73. Long, D.; Chen, X.; Scanlon, B.R.; Wada, Y.; Hong, Y.; Singh, V.P.; Chen, Y.; Wang, C.; Han, Z.; Yang, W. Have GRACE satellites overestimated groundwater depletion in the Northwest India Aquifer? Sci. Rep. 2016, 6, 24398. [Google Scholar] [CrossRef] [PubMed]
Figure 1. Geographical location and topographic map of the Haihe River basin (HRB) and distribution of the 6 flux tower sites.
Forests 12 01632 g001
Figure 2. Scatterplots of the observed LE and estimated LE derived from six LE products at six different sites.
Forests 12 01632 g002
Figure 3. Scatterplots of the observed LE versus the estimated LE from six products at all sites.
Forests 12 01632 g003
Figure 4. Taylor diagrams for LE observations and LE estimates from six products at both MF and CRO sites.
Forests 12 01632 g004
Figure 5. Seasonal cycle of the estimated LE derived from six products at six sites.
Forests 12 01632 g005
Figure 6. Comparison of the estimated monthly ET from six products and the corresponding WBET.
Forests 12 01632 g006
Figure 7. Taylor diagrams for the estimated annual ET from six satellite-based products and the corresponding WBET.
Forests 12 01632 g007
Figure 8. Multiyear (2013–2015) mean seasonality of LE in Haihe River basin of China. MAM: March, April and May; JJA: June, July and August; SON: September, October and November; DJF: December, January and February.
Forests 12 01632 g008
Figure 9. Spatial differences in the average annual terrestrial LE (2013–2015) between GLASS LE and other five LE products.
Forests 12 01632 g009
Table 1. Summary of the 6 flux tower sites used in this study, including the site name, location, land cover types, elevation and period.
SiteLocationLand Cover TypesElevation (m)Period
Daxing1 (DX1)39.53° N, 116.25° EMixed forest302005–2006
Daxing2 (DX2)39.62° N, 116.43° Ewinter wheat/maize and vegetables202008–2010
Guantao (GT)36.52° N, 115.13° Ewinter wheat/maize and cotton302008–2010
Huailai (HL)40.35° N, 115.79° Emaize4802013–2014
Miyun (MY)40.63° N, 117.32° Eorchard and maize3502008–2010
Yucheng (YC)36.83° N, 116.57° EWarmer temperate dry farming cropland282002–2007
Table 2. Detailed information of LE products used in this study.
ProductsSpatial
Resolution
Temporal
Resolution
Study DomainTime SpanReferences
GLASS0.05°8-dayGlobal1982–2018Yao et al., 2014
FLUXCOM0.0833°8-dayGlobal2000–2015Jung et al., 2019
PML_V20.05°8-dayGlobal2002–2019Zhang et al., 2019
GLEAM0.25°dailyGlobal1980–2020Martens et al., 2017
BESS0.01°8-dayGlobal2000–2015Jiang and Ryu, 2016
MODIS500 m8-dayGlobal2001–2021Mu et al., 2011
Publisher’s Note: MDPI stays neutral with regard to jurisdictional claims in published maps and institutional affiliations.

