Article

Transcriptome-Wide Identification and Expression Profiling of SPX Domain-Containing Members in Responses to Phosphorus Deprivation of Pinus massoniana

1
Institute for Forest Resources and Environment of Guizhou, Guizhou University, Guiyang 550025, China
2
College of Forestry, Guizhou University, Guiyang 550025, China
3
Key Laboratory of Forest Cultivation in Plateau Mountain of Guizhou Province, Guizhou University, Guiyang 550025, China
*
Author to whom correspondence should be addressed.
Forests 2021, 12(12), 1627; https://doi.org/10.3390/f12121627
Submission received: 28 September 2021 / Revised: 20 November 2021 / Accepted: 22 November 2021 / Published: 24 November 2021
(This article belongs to the Special Issue Forest Genomics and Transcriptomics)

Abstract

:
The SPX domain-encoding proteins are believed to play important roles in phosphorus (Pi) homeostasis and signal transduction in plants. However, the overall information and responses of SPXs to phosphorus deficiency in pines, remain undefined. In this study, we screened the transcriptome data of Pinus massoniana in response to phosphorus deprivation. Ten SPX domain-containing genes were identified. Based on the conserved domains, the P. massoniana SPX genes were divided into four different subfamilies: SPX, SPX-MFS, SPX-EXS, and SPX-RING. RNA-seq analysis revealed that PmSPX genes were differentially expressed in response to phosphorus deprivation. Furthermore, real-time quantitative PCR (RT-qPCR) showed that PmSPX1 and PmSPX4 showed different expression patterns in different tissues under phosphorus stress. The promoter sequence of 2284 bp upstream of PmSPX1 was obtained by the genome walking method. A cis-element analysis indicated that there were several phosphorus stress response-related elements (e.g., two P1BS elements, a PHO element, and a W-box) in the promoter of PmSPX1. In addition, the previously obtained PmSPX2 promoter sequence contained a W-box, and it was shown that PmWRKY75 could directly bind to the PmSPX2 promoter using yeast one-hybrid analysis in this study. These results presented here revealed the foundational functions of PmSPXs in maintaining plant phosphorus homeostasis.

1. Introduction

Phosphorus (P) is one of the major nutrients required by plants, indispensable in plant growth and development [1]. It is usually absorbed and utilized in the form of inorganic phosphate (Pi) [2]. However, soil inorganic phosphorus content is low, and not easy to diffuse in the soil, as a result, P is difficult to be absorbed by plant roots [3]. Therefore, in the natural environment, plants often encounter phosphorus deficiency in the soil and overcome this problem by applying large amounts of phosphorus fertilizer. Nevertheless, this approach can cause not only overexploitation of phosphate ore but also water eutrophication [4]. Thus, it is crucial to improve the adaptability of plants to a phosphorus-deficient environment.
Plants have developed intricate regulatory mechanisms to survive in Pi deficient conditions [5,6,7]. Unveiling the molecular mechanism of plants’ adaptation to phosphorus starvation would be pivotal for breeding phosphorus efficient species. In previous studies, the phosphorus starvation signaling pathway in plants has been well revealed, and more and more research has confirmed that SPX-domain proteins play a vital role in phosphorus homeostasis and signal transduction [8,9,10,11]. So far, the SPX members have been identified and characterized in many plants, including Arabidopsis [12], rice [13], common bean [14], rapeseed [15], wheat [16].
The SPX domain (Pfam: F03105) is named after the first discovered acronym containing the three proteins of the domain: yeast SYG1 and PHO81, and human XPR1 protein [17]. The SPX conserved hydrophilic domain is usually located at the N-terminal. According to the different C-terminal domains, proteins containing the SPX domain in plants can be divided into four subfamilies: SPX, SPX-MFS, SPX-EXS, and SPX-RING [18]. The members of the SPX genes family are gradually being discovered as playing a vital role in the growth and metabolism of disease resistance, hypoxia response, light signaling, and nutrient stress response [19]. The SPX-MFS protein, also specified as the PHOSPHATE TRANSPORTER 5 family, has a vacuolar Pi transport function [20]. The inorganic phosphates stored in plant vacuoles play a vital role in maintaining cell phosphorus homeostasis. AtPHT5;1 is an SPX-MFS protein that acts as a vacuolar phosphorus transporter, mediating the transfer of phosphorus from the cytoplasm into vacuoles [21]. OsSPX-MFS1 mediates Pi inward flow into vacuoles, while OsSPX-MFS3 mediates phosphorus transport from vacuoles to the cytoplasm [22,23]. Members of the PHO family, which contain both the SPX and EXS domains, have been confirmed to mediate the transport of phosphorus from root to shoot [17,24]. In Arabidopsis, there are 11 PHO1 family members, including AtPHO1 and AtPHO1;H1 which have been shown to involve in phosphorus homeostasis by transporting Pi from root xylem to shoot [25]. According to the report, OsPHO1;2 also mediated the transfer of phosphorus from root to stem in rice [26]. A characteristic member of the SPX-RING family, also known as nitrogen limiting adaptation (NLA), was firstly identified in anti-nitrogen starvation, meanwhile, mutation of OsNLA1 led to excessive accumulation of Pi in roots and shoots under Pi-sufficient conditions [27]. Similarly, members of the SPX subfamily play a vital role in the regulation of P signal networks. Previous documents revealed that all SPX genes excepting AtSPX4 and OsSPX4 were Pi starvation-induced genes [28,29]. Further evidence proved that SPX protein was a negative regulator of Pi signal transduction, and maintained phosphorus homeostasis in plants by counteracting overexpression of PHR [30,31].
Pinus massoniana is a coniferous gymnosperm native to tropical and subtropical areas of southern China. This species has become an important economic species because of its excellent characteristics of fast growth and high yield [32]. However, P. massoniana may be critically endangered in some areas due to poor growing conditions and excessive logging harvesting, and the plant was classified as “Least Concern” in the IUCN Red List of Threatened Species (2013) [33]. Therefore, it is particularly important to study the adaptability of P. massoniana in adapting to the growing environment and improving its growth ability. The main production area of P. massoniana is seriously short of phosphorus. Whereas, in the long-term evolution process, P. massoniana obtained a great ability of resistance to phosphorus deficiency conditions, and showed differences in gene expression level [34,35]. These molecular changes played a vital role in plants in adaptation to low phosphorus stress. Therefore, P. massoniana is an ideal specimen for studying the response mechanism of woody plants to phosphorus stress. However, the role of SPX family genes in P. massoniana was unknown. In this study, we performed a comprehensive transcriptome analysis of SPX family genes in phosphorus stress, conducted gene identification, phylogenetic, conserved domain, and sequential physicochemical properties analysis. In addition, we also investigated the expression profiles of PmSPX1 and PmSPX4 in different tissue (root, stem, and leaf) under phosphorus stress treatments by RT-qPCR. The upstream promoter sequence of PmSPX1 was obtained by chromosome stepping method and its cis-elements were analyzed. The binding of PmWRKY75 to the PmSPX2 promoter was verified by a yeast one-hybrid experiment. These results lay a theoretical basis for further functional analysis of PmSPXs in P. massoniana.

2. Materials and Methods

2.1. Identification of SPX Genes in P. massoniana

The SPX gene data for P. massoniana were obtained from the previously determined Pi deficiency Transcriptome (PRJNA641031) [36]. The Hidden Markov Model (HMM) configuration file of the SPX domain (PF03105) was downloaded from the Pfam database (http://pfam.xfam.org/, accessed on 15 July 2020). HMMER3 was used to classify the P. massoniana SPX protein sequences (E-value ≤ 10−3). Protein domains were predicted using the Pfam (http://pfam.xfam.org/, accessed on 15 September 2020) and the structure of P. massoniana SPX domain protein sequences screening by CD-search (https://www.ncbi.nlm.nih.gov/cdd/, accessed on 10 April 2021). Finally, 10 sequences with complete SPX domains were identified (Supplementary Materials Table S1). DOG2.0 software was used to draw the distribution of conserved domains according to the starting position and length [37]. The physicochemical parameters including the number of amino acids (aa), molecular weights (MW,) and isoelectric points (pI) of PmSPX proteins, were calculated by the ExPASy program (http://www.expasy.org/tools/, accessed on 10 April 2021). Subcellular location prediction was conducted using PSORT (https://psort.hgc.jp/, accessed on 25 April 2021) and CELLO (http://cello.life.nctu.edu.tw/, accessed on 10 April 2021).

2.2. Multiple Sequence Alignment, Phylogenetic Analysis, and Conserved Motif Analysis

The SPX protein sequences of Arabidopsis and rice were downloaded from NCBI (https://www.ncbi.nlm.nih.gov/, accessed on 10 April 2021). Clustal W software (https://www.genome.jp/tools-bin/clustalw, accessed on 10 April 2021) was used to conduct multiple sequence alignment of 10 PmSPXs proteins sequences, 20 AtSPXs proteins sequences, and 15 OsSPXs proteins sequences. A phylogenetic tree of the 45 full-length SPX protein sequences was performed by MEGA 6 with neighbor-joining (NJ) criteria and 1000 bootstrap replicates [38], and then beautified using Evolview (https://www.evolgenius.info/evolview/#login, accessed on 10 April 2021). MEME tool (Version 5.3.3) (https://meme-suite.org/meme/tools/meme, accessed on 10 April 2021) was used to analyze the amino acid motifs of PmSPXs proteins, with setting 6 motifs, and all other default parameter values. The sketch map of conserved motifs for PmSPX proteins was drawn by Tbtools software [39].

2.3. Plant Material and Pi Stress Treatments

P. massoniana materials and Pi stress treatments were similar to previous research [36]. The plants were grown in perlite in an illuminated incubator with a cycle of 14 h/25 °C days and 10 h/22 °C nights, and light intensity of 250 μmol·m−2·s−1. In addition to the Pi, the complete basal nutrient solution contained: 5.0 mM KNO3, 2.0 mM MgSO4·7H2O, 4.5 mM Ca(NO3)2·4H2O, 46 μM H3BO3, 0.8 μM ZnSO4·7H2O, 10 μM MnCl2·4H2O, 0.4 μM H2MoO4·4H2O, 0.56 μM CuSO4·5H2O and 25 μM Fe-NaEDTA [40]. The phosphorus concentration in the treated nutrient solution was adjusted by KH2PO4. Three treatments with different phosphorous levels: a control treatment (0.5 mM), two experimental treatments P1 (0.01 mM) and P2 (0.06 mM). KCl was added to Pi-deficient solutions to ensure the same potassium concentration. 30 days after emergence, the nutrient solutions with different Pi concentrations were added every 2 days, the treatment lasted for 60 days. During the Stress treatment for 12, 24, 36, 48, and 60 days, roots, stems, and leaves were harvested, immediately frozen in liquid nitrogen, and stored at −80 °C. In this study, three biological replicates were set up for each sample.

2.4. RNA-Seq Data Analysis of PmSPX Genes

The following is the information on Pi deficiency treatment for Illumina RNA-seq of P. massoniana. P. massoniana seedlings were grown in perlite medium under 0.5 mM Pi (normal Pi, CK) for 30 days, then half the seedlings were treated with 0.01 mM Pi (low Pi, P1) stress and the remaining seedlings were kept under normal Pi conditions as a control. The aboveground and underground parts of every seedling were harvested at 24, 36, and 48 days after the phosphorus processing. To measure the expression level of the P. massoniana SPX gene, fragments per kilobase of exon model per million reads mapped (FPKM) values were calculated to reckon the abundance of transcripts. Tbtools software was used to generate a heat map of PmSPXs gene expression d based on log2 (FPKM +0.01) value.

2.5. RNA Extraction, cDNA Synthesis, and RT-qPCR

Total RNA was isolated from plant tissues using RNAprep Pure Plant Kit (Tiangen, Beijing, China) according to the manufacturer’s protocols. RNA concentration and purity were measured with IMPLEN GMBH (NanoPhotometer N60 Touch, Germany), and then the integrity of RNA was identified by gel electrophoresis. The first-strand cDNA was synthesized using the FastKing gDNA Dispelling RT SuperMix (Trangen, Beijing, China). The specific primers used in this study were designed based on the P. massoniana SPX genes sequences using Primer Primer 5.0 software and synthesized by Sangon Biotech Company (Shanghai, China) (Table S3). RT-qPCR was executed on a CFX96 Real-Time PCR Detection System (Bio-Rad, Hercules, CA, USA) with the SYBR Green system (Tiangen, Beijing, China). The P. massoniana UBC gene was employed as a control. In this study, three independent biological replicates and three technical replicates for each biological replicate were examined. The relative expression levels of PmSPX genes were calculated by the 2−ΔΔCT method [41].

2.6. Subcellular Localization Analysis

The coding regions without stop codon of PmSPX1 and PmSPX4 were cloned into the transient expression vector (pCAMBIA-EGFP) for subcellular localization analysis and fused with the N-terminus of GFP in the vector pCAMBIA to generate 35S-PmSPXs-GFP vectors. The ORF and primer sequence information was listed in Tables S4 and S5. For subcellular localization of PmSPXs in leaf epidermal cells of N. benthamiana, the 35S-PmSPXs-GFP were transformed into Agrobacterium tumefaciens GV3101 strain. The transformed strains were cultured to a density of OD600 = 0.5, and then harvested and resuspended in osmotic buffer (0.2 mM AS and 10 mM MgCl2) to the same concentration. After transformation, the plants were grown under the dark treatment for 48 h, and the GFP fluorescence was observed by a confocal laser scanning microscope (TCS SP8, Leica). All fluorescence experiments were independently repeated three times.

2.7. Isolation and Cis-Element Analysis of the PmSPX1 Promoter

The PmSPX1 promoter sequence was isolated using a Genome Walking Kit (TaKaRa, Beijing, China). The full-length DNA of PmSPX1 was verified by combining it with the transcriptome data (PRJNA641031). Specific primers (SP1, SP2, and SP3) with high annealing temperature were designed using validated DNA sequences (Tables S4 and S5), combining degenerate primers (AP) provided in the kit and the manufacturer’s instructions, finally, the upstream 5’ sequence of PmSPX1 gene was obtained. Using the same way, by specific primers SP4/5/6 and SP7/8/9, the second and third upstream promoter sequences could be cloned (Table S5). The PmSPX1 upstream promoter sequences were analyzed to determine the cis-regulatory elements using cis-element online analysis software PlantCARE (http://bioinformatics.psb.ugent.be/webtools/plantcare/html/, accessed on 4 January 2021) [42].

2.8. Yeast One-Hybrid Assay

Based on the previously obtained PmSPX2 promoter sequence, W-box cis-acting element was the binding site for WRKY transcription factors under phosphorus stress [43,44,45]. To detect the interaction between PmWRKY75 and the W-box element of the PmSPX2 gene, we cloned the ORF of PmWRKY75 into pGADT7 (Clontech, Dalian, China) and constructed an effector vector (pGADT7-PmWRKY75). The PmSPX2 promoter fragment (790 bp) containing the W-box element was cloned and connected to the pAbAi vector (pAbAi-proSPX2). Library Construction & Screening Kits (Clontech, Cat. No. 630490) were used to screen yeast-hybrid libraries according to the manufacturer’s instructions. The growth ability of co-transformed yeast cells was tested by adding variously concentrated AbAr in SD/−Leu/−Ura medium. The yeast one-hybrid assay was repeated four times. The specific primers for the yeast one-hybrid experiment are shown in Table S5.

2.9. Statistical Analysis

Graphpad Prism (Version 8.3.0) was used for analyses of the RT-qPCR data. Analyses of variance (ANOVA) for sets of data were subjected to Duncan’s test. p < 0.05 and p < 0.01 were determined significant and extremely significant, respectively.

3. Results

3.1. Transcriptome-Wide Identification of SPX Members in P. massoniana

Genes containing SPX domains were identified in the transcriptome of P. massoniana by gene models and CD-search program, and 10 SPX genes (PmSPXs) were confirmed in the transcriptome of P. massoniana (Table 1). These SPX genes were divided into four subfamilies: SPX, SPX-MFS, SPX-EXS, and SPX-RING. The confirmed coding sequences of PmSPX genes were listed in Table S1. The PmSPX proteins consist of 267~820 amino acids (aa), and the corresponding molecular weights range from 30.413 to 93.081 kDa. Among the 10 PmSPX proteins, PmNLA1 was the smallest, and PmPHO1 was the largest. The isoelectric point (pI) value of these PmSPX proteins ranged from 5.07 (PmSPX4) to 9.40 (PmPHO1), and most proteins in the same subfamily have similar parameters. CELLO and PSORT were used to forecast the subcellular location of the 10 PmSPX proteins, including the nucleus and plasma membrane. All proteins in the SPX-MFS and SPX-EXS subfamilies were located in the plasma membrane, and all the members in the SPX and SPX-RING were located in the nucleus. The predicted results for these proteins were shown in (Table 1). The diversity in subcellular locations implies different SPX subfamilies may have different functions. To verify the prediction results of subcellular localization, PmSPX1 and PmSPX4 fused with GFP were instantaneously transformed into N. benthamiana and their localization was analyzed. Based on the location of the green fluorescence signal, the results showed that PmSPX1 and PmSPX4 were localized in the nucleus (Figure 1).

3.2. Phylogenetic Relationships and Conserved Domain Analysis of PmSPX Proteins

To examine the phylogenetic relationships and classification of the PmSPX family members, we constructed a phylogenetic tree of 10 PmSPXs, 20 AtSPXs, and 15 OsSPXs proteins (Figure 2A). The phylogenetic tree confirmed that PmSPXs could be divided into four different subfamilies (SPX, SPX-MFS, SPX-EXS, and SPX-RING subfamilies). In addition, the numbers of SPX subfamily proteins in the three species were highly asymmetrical. For example, two PmSPXs and 11 AtSPXs were classified in SPX-EXS subfamilies, and 3 PmSPXs, 2 AtSPXs, and 2 OsSPXs were included in SPX-RING subfamilies. Phylogenetic analysis showed that the SPX genes family was highly conserved and diverse in different plants.
The N-terminus of these four subfamily proteins all contain the SPX domain, and different subfamily proteins have different C-terminus domains (Figure 2B). Conserved motif prediction showed 6 motifs within P. massoniana SPX proteins. The length of amino acids of the six motifs ranges from 21 to 50. The mode of the conserved motifs was displayed in Figure 2C and illustrated in Table 2. Motif 1 was identified in all PmSPX proteins, while only PmNLA1 did not appear motif 2. As shown in Figure 2C, the PmSPX proteins clustered in the same subfamily usually have similar motif patterns. For instance, all members of the SPX subfamily contained motifs 1, 2, and 4, and all of the SPXs in the SPX-RING subfamily contained motifs 1, 3, 5, and 6. In addition, all SPX members included motif 1, 2, and 4 in the SPX, SPX-EXS, and SPX-MFS subfamily, while all SPX members included motif 1, 3, 5, and 6 in the SPX-RING subfamily.

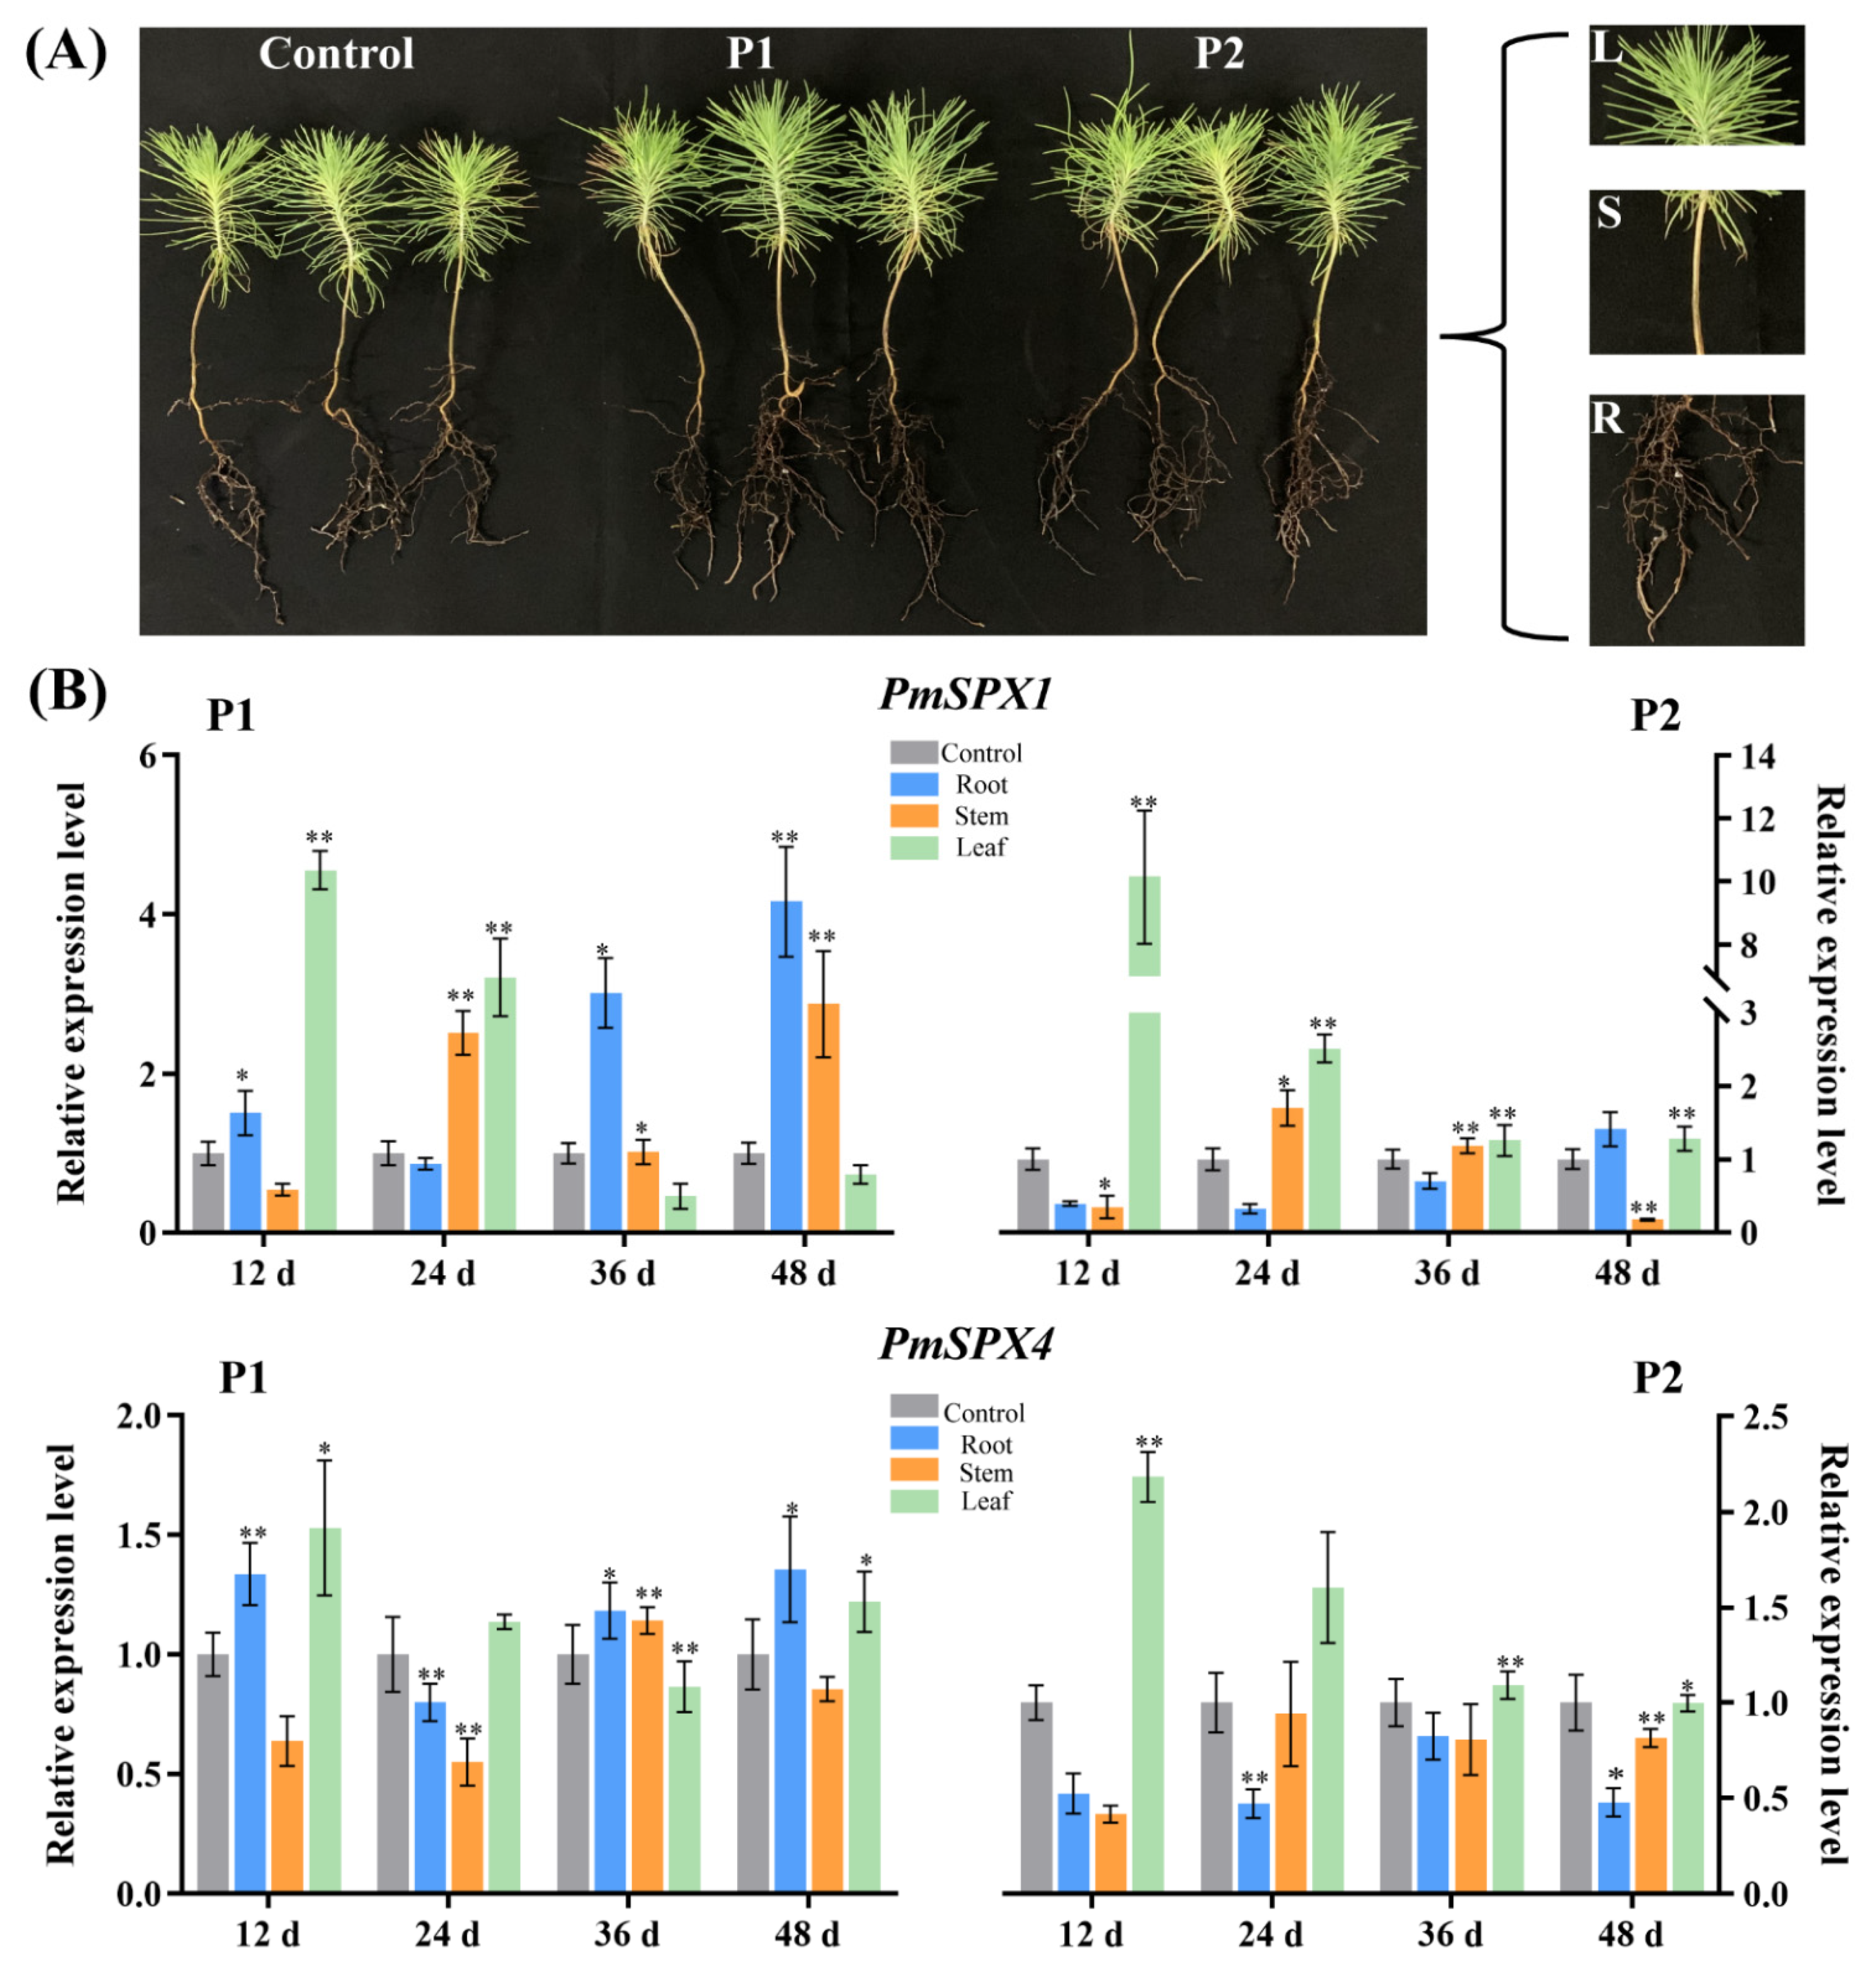
3.3. Analysis of the Transcriptional Profiles of PmSPX Genes

To explore PmSPX genes that may be involved in phosphorus starvation signals, we analyzed the expression profiles of all SPX genes in P. massoniana under phosphorus stress using RNA-seq analysis. The 10 PmSPXs expression data were clustered and displayed in a heat map (Figure 3 and Table S2). The result showed that some genes exhibited significant trends during treatment with Pi stress. For instance, PmSPX4 was induced and expressed in the aboveground and underground parts of P. massoniana seedlings at all stages of low Pi stress; the expression of PmSPX1 and PmSPX2 was induced except for aboveground parts on 24 days; the expression of PmPHO1 and PmPHO1;H1 was inhibited except for up-regulation in aboveground parts on 24 days. In addition, the expression levels of some genes changed at different stress times and tissues. These results suggested that these genes could be regulated by Pi stress.
We found that under Pi stress (P1, P2), the root structure of P. massoniana seedlings changed significantly compared with normal Pi concentration (Control) (Figure 4A), and the more developed root structure was conducive to the uptake of Pi by plants [46]. To further understand the expression pattern of PmSPX1 and PmSPX4 in response to phosphorus stress, RT-qPCR was performed using specific primes for PmSPX1 and PmSPX4 of the SPX subfamily (Table S3). Under phosphorus stress, PmSPX1 and PmSPX4 were differentially expressed in different tissue parts and at different treatment times (Figure 4B, Table S6). It is noteworthy that the expression of PmSPX1 was significantly higher than that of PmSPX4 under phosphorus deficiency conditions, and the gene expression in the root, stem, and leaf tissues of P. massoniana seedlings was in dynamic change. In addition, with the extension of phosphorus stress time, the relative expression of PmSPX1 gradually increased in the roots of P. massoniana seedlings, while that in the leaves of P. massoniana seedlings decreased gradually. Under severe low Pi treatment (P1), the expression of PmSPX4 increased as a whole. However, the expression of PmSPX4 was inhibited under moderate low Pi treatment (P2) for 48 days, and the relative expression of PmSPX4 in P. massoniana seedling leaves gradually decreased with the increase of stress time. These results showed that PmSPX1 and PmSPX4 could play vital roles in the response to phosphorus stress in different tissues.

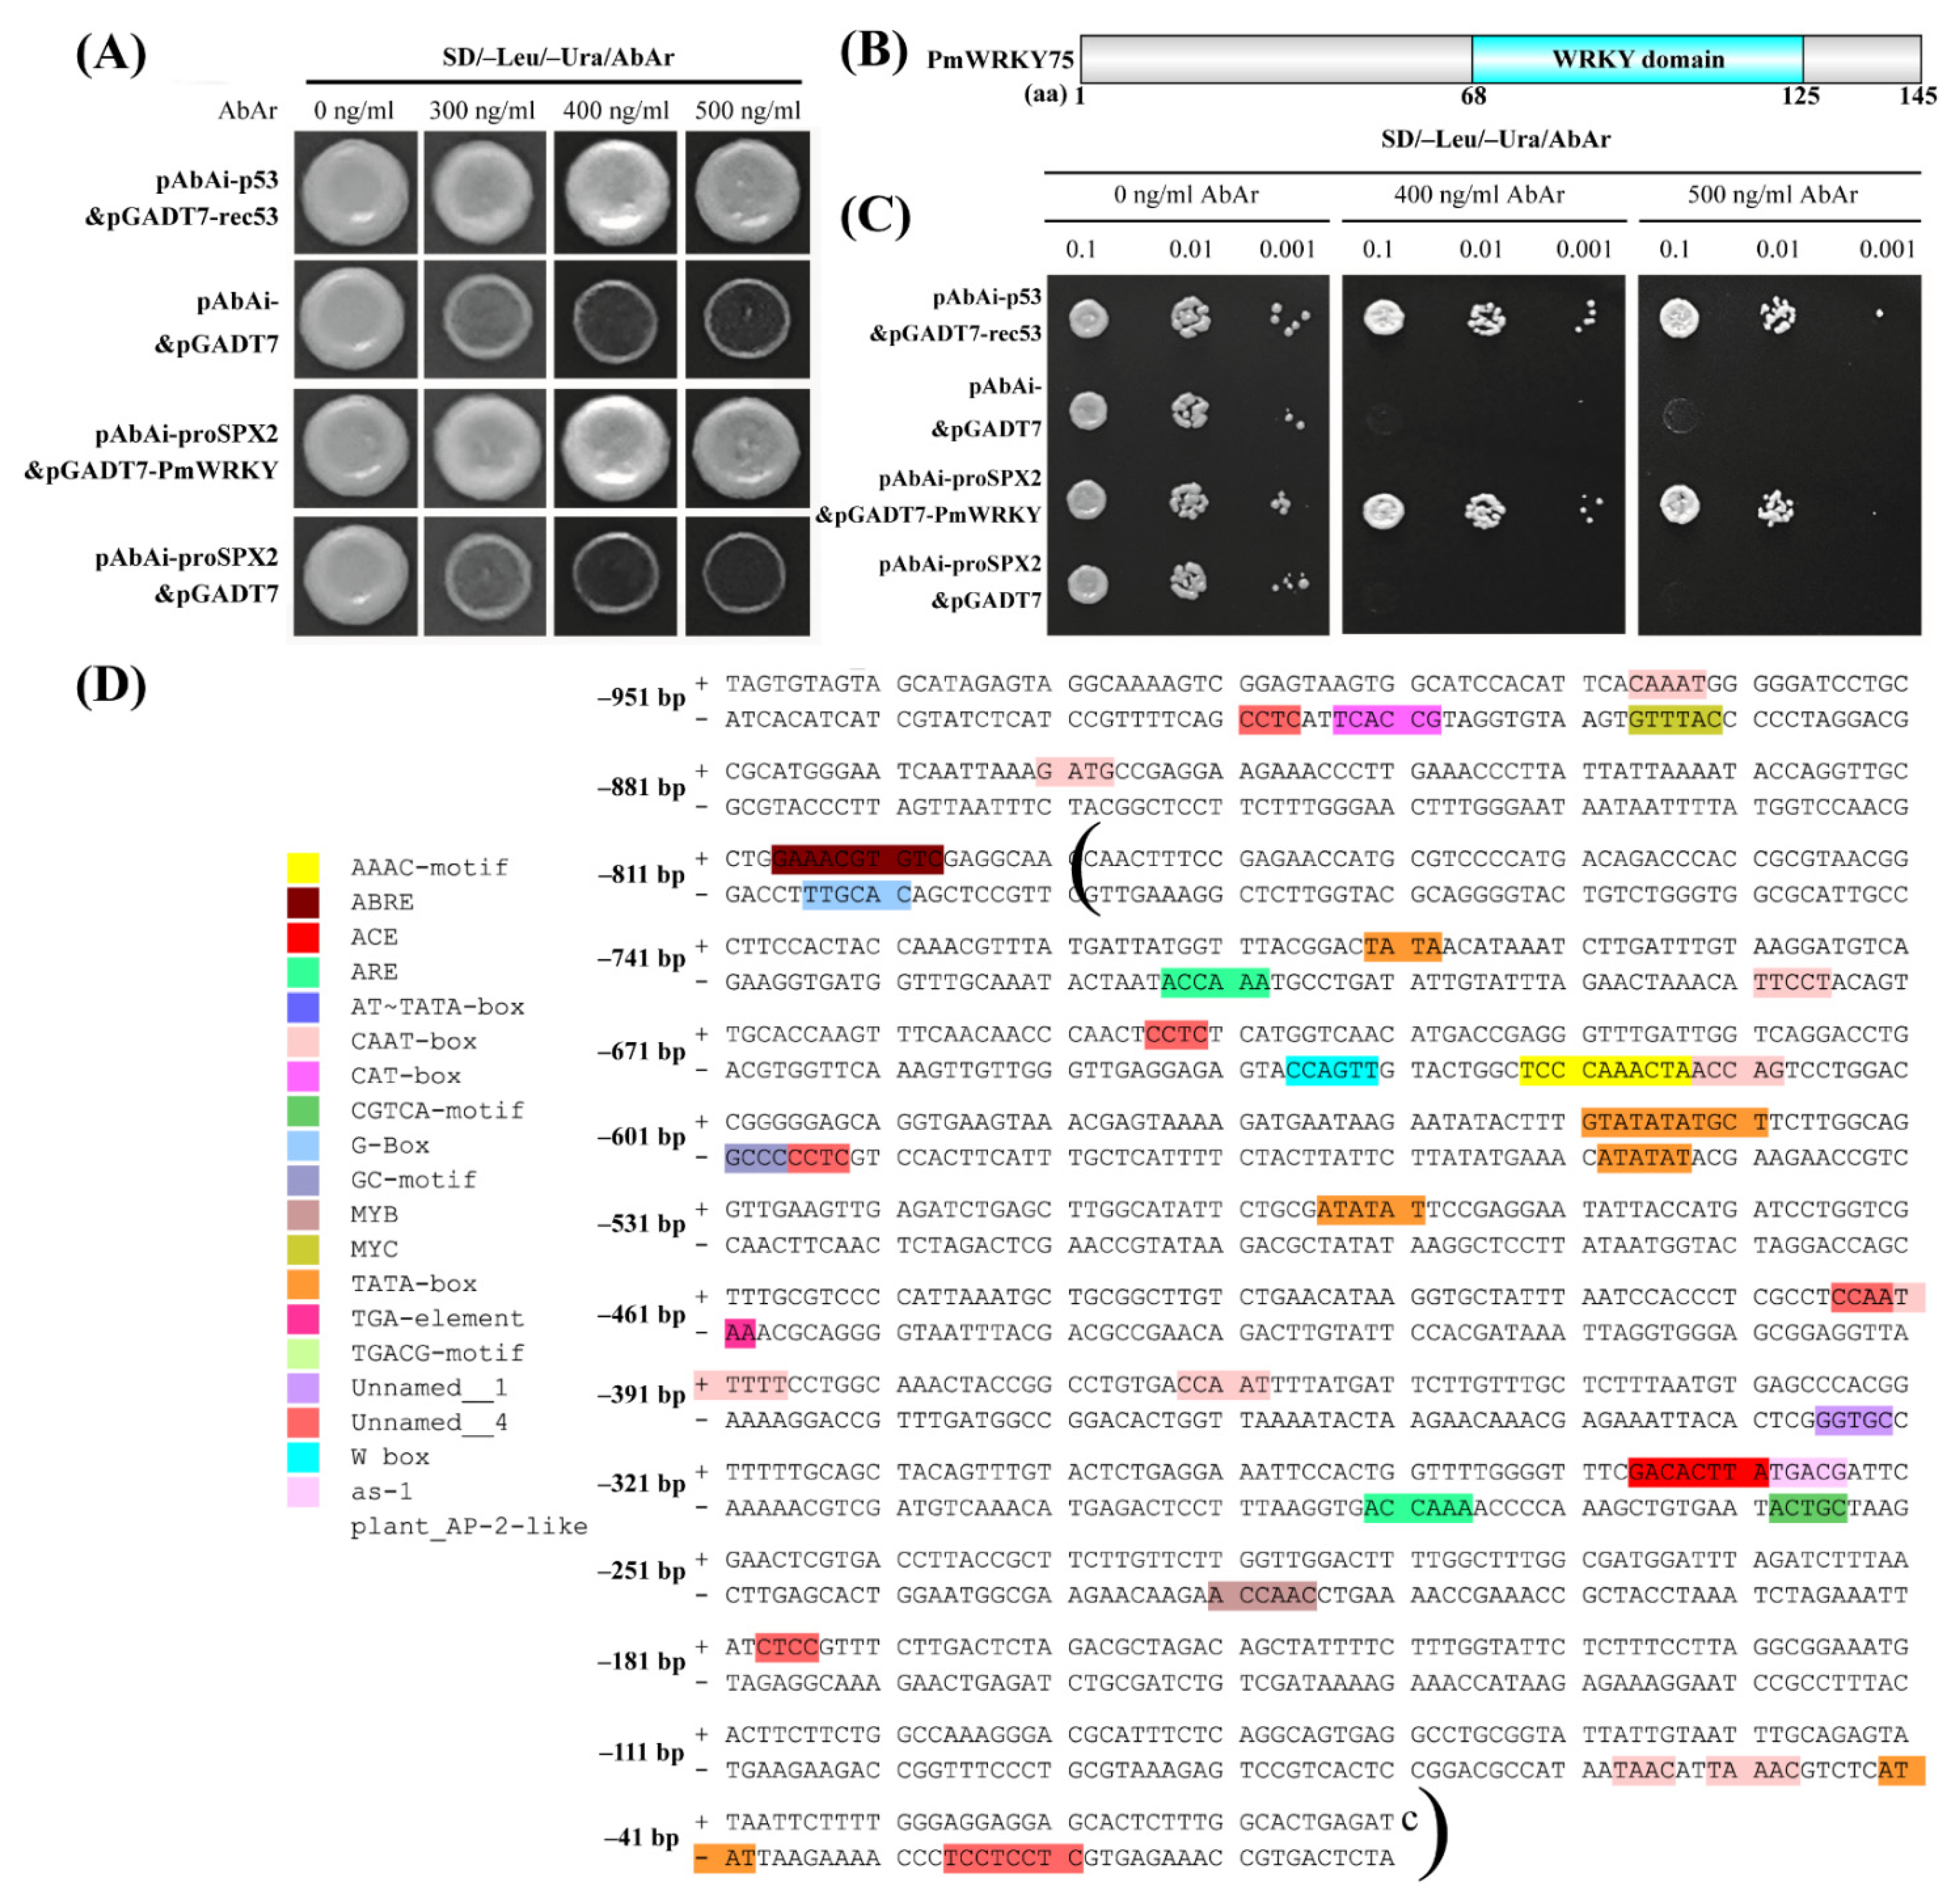
3.4. Isolation and Cis-Acting Element Analysis of PmSPX1 Promoter

As the P. massoniana genome sequence has not been obtained, the PmSPX1 promoter sequence was cloned using a genome walking assay. Based on specific primers (SP) and degenerative primers (AP), the upstream 892 bp sequence of the initiation codon was obtained by the first round of genome walking, 491 bp unknown sequence was isolated in the second round, and 901 bp unknown sequence was isolated in the third round. (Figure 5A,B). Finally, the PmSPX1 promoter sequence of 2284 bp was obtained (Figure 5A,C).
Cis-acting elements play vital roles in the overall regulation of gene expression. Cis-element analysis of 2284 bp nucleotide sequences upstream of the initiation codon was performed using online software PlantCARE, and a total of 36 types of cis-acting elements were identified (Figure 5C). These cis-acting elements are mainly composed of core promoter elements (e.g., CAAT-box and TATA-box), light response-related elements (e.g., AE-box, Box 4, G-Box, GATA-motif, GATA-motif, Gap-box, MRE, TCCC-motif, and TCT-motif), hormone-responsive elements (e.g., ABRE, ABRE3a, ABRE4, P-box, TCA, ARE and ERE), stress response-related elements (e.g., TC-rich repeats, WUN-motif and MBS.), metabolism-related element (e.g., Box III and O2-site.) and transcription factor binding site (e.g., MYB, MYC, and W-box). P1BS (GNATATNC) was a well-established Pi-starvation-responsive element [47] and based on their sequence characteristics, we identified two P1BS elements [678 bp (−)/1541 bp (−)]. PHO element (CACGT(G/C)), which has also been suggested to be related to Pi signaling [48], was found in the PmSPX1 promoter [648 bp (−)]. Lots of cis-acting elements in the promoter sequence suggested that PmSPX1 may be involved in a complex regulatory network.

3.5. PmWRKY75 Can Bind Directly to PmSPX2 Promoter

In this study, we analyzed the cis-acting elements of the PmSPX2 promoter sequence, and multiple types of cis-acting elements were identified in the PmSPX2 promoter region (i.e., stress response, metabolism, hormonal response, and photoreaction related elements) (Figure 6D). Previously study revealed that the expression levels of PmSPX2 in different tissue parts of P. massoniana seedlings were differentially expressed under phosphorus stress [45]. In addition, PmSPX2 contained a W-box structure, and PmWRKY75 protein contained a complete WRKY domain (Figure 6B). Yeast single hybridization (Y1H) assay was used to evaluate whether PmWRKY75 is directly bound to the promoter of PmSPX2. The cells co-transformed with pAbAi-proSPX2 and the pGADT7-PmWRKY75 vectors could grow well on SD/−Leu/−Ura/AbAr plates (Figure 6A), and proportionately diluted yeast also grow normally (Figure 6C). The results suggested that PmWRKY75 could directly bind to the promoters of PmSPX2.

4. Discussion

SPX subfamily genes have always been the focus of studies on maintaining phosphorus homeostasis in plants [19,49]. The SPX genes have been well identified and classified in Arabidopsis, rice, rapeseed, and beans [14,18,50]. Since the genome information of P. massoniana is not available, transcriptome data was often used to identify gene families, and 10 SPX genes were identified in our study (Table 1). Compared with these number of SPX members, 20 SPX genes were found in Arabidopsis, 15 in rice, 69 in rapeseed, and 46 in wheat [16], which may be related to genome duplications, or evolutionary differences of these plants. P. massoniana SPXs genes were classified into four subfamilies based on the conservative domain and phylogenetic analysis (Figure 2A,B), which is highly consistent with the results of rice and Arabidopsis [51]. According to phylogenetic analysis, we found that the SPX-EXS subfamily of Arabidopsis was the largest subfamily with 11 members, while only 3 and 2 members were identified in rice and P. massoniana, respectively (Figure 2A). In addition, PmSPX1 appeared in the same branch of PmSPX4, AtSPX4, and OsSPX4. These results suggested that the PmSPXs genes family has partial differentiation in the long-term evolution process compared with Arabidopsis and may be closer to the evolution process of rice SPX genes. In this study, we analyzed the conserved domain and motifs of PmSPX proteins (Figure 2B,C). These results indicated that there were similar structures within members of the same subfamily, indicating that a subset of PmSPX genes was convergent in the evolutionary process.
Proteins containing the SPX domains are widely involved in phosphate homeostasis and phosphate deficiency responses in plants [18]. It was found that SPX-EXS and SPX-MFS play a role of phosphorus transporter in phosphorus absorption and translocation [52]. SPX-EXS proteins mediate the transport of phosphorus from root to shoot, whereas SPX-MFS proteins act as vacuolar Pi transporter [21,25]. In our research, we found that SPX-EXS and SPX-MFS proteins were located in the plasma membrane (Table 1). Previously studied showed that SPX-EXS subfamily members, such as AtPHO1, AtPHO1;H1 and OsPHO1;2, were located in the plasma membrane, and had known to participate in the transfer of phosphate from root to shoot [53,54]. Two of the confirmed P. massoniana SPX-EXS proteins were clustered into the same branch with AtPHO1, AtPHO1;H1 and OsPHO1;2, and they were differentially expressed under phosphorus stress (Figure 1A and Figure 3), which suggests a similar function in regulating phosphorus homeostasis in P. massoniana Similarly, SPX-MFS protein in P. massoniana is in the same branch as AtSPX-MFS1~3 and OsSPX-MFS1~3, and SPX-MSF family has been proven as tonoplast Pi transporters in Arabidopsis and rice [55]. Thus, we hypothesized that P. massoniana SPX-EXS proteins may also function as vacuolar phosphorus transporters. The RING domain is located in the C-terminus of the SPX-RING subfamily and is related to the activity of ubiquitin E3 ligase [56]. NLA (Nitrogen-Limited Adaptation) genes were identified as SPX-RING genes in Arabidopsis, rice, and soybean, which were usually located in the nucleus and could sense changes in phosphorus concentration [57]. SPX-RING proteins of P. massoniana have similar structures with Arabidopsis and rice and are predicted to be located in the nucleus, which suggests that may also have the ability to sense phosphorus concentration in P. massoniana.
In this study, we analyzed the gene expression patterns of PmSPXs in responding to Pi stress by RNA-seq data, and results showed that PmSPXs in the SPX subfamily generally was up-regulated in low-Pi conditions (Figure 3). Previous studies found that all SPX genes except SPX4 belonged to phosphorus-starvation induced expression genes [12,29]. In addition, AtSPX4 and OsSPX4 were located in the nucleus and cytoplasm [28,58]. However, in this study, PmSPX4 was slightly induced, and the subcellular localization of PmSPX4 was in the nucleus. We used RT-qPCR to analyze the expression patterns in different tissue parts of P. massoniana seedlings under phosphorus stress and found that the relative expression levels of PmSPX4 in roots, stems, and leaves were in dynamic change. Therefore, we speculated that PmSPX4 may have different modes of action in response to low Pi stress. In our study, the relative expression of PmSPX1 in leaves was the highest at the beginning under severe low phosphorus (P1) stress and gradually decreased with the extension of stress time. On the contrary, it was gradually induced in roots with the increase of stress time (Figure 4B). In rice and Arabidopsis, SPX1 played a role in roots and shoots in response to phosphorus deficiency [59,60]. In addition, overexpressed AtSPX1 accelerated leaf senescence and regulated the transport of phosphorus from senescing leaves to other vigorous parts of the plant [61]. It was speculated that PmSPX1 could affect the transport of phosphorus in the leaves and roots of P. massoniana seedlings under phosphorus stress and thus maintain phosphorus homeostasis.
Analysis of promoter sequence and cis-regulatory elements provide a theoretical basis for studying the physiological functions [62]. In our study, the PmSPX1 gene promoter contained multiple types of cis-acting elements (Figure 5C), especially light-response elements, indicating that the PmSPX1 gene participates in a complex regulatory network in plants. In Arabidopsis, SPX protein was proven to play a vital role in modulating phytochrome-mediated light signals [63,64]. Some studies had shown that the concentration of root tip phosphate could affect the changes of root morphology, and a variety of hormones were involved [65]. In our study, some hormonal response elements were identified in the PmSPX1 promoter sequence. We hypothesized that PmSPX1 may be regulated by hormones to maintain phosphorus homeostasis. It is remarkable that PmSPX1 also contained some phosphorus response key elements such as P1BS and PHO elements. Previous studies showed that a large part of Pi starvation-induced (PSI) genes was regulated by phosphorus-responsive central regulatory gene (PHR), however, SPX protein could affect PHR expression [66]. Recent studies had shown that InsP8 regulated phosphorus homeostasis in plants by controlling PHR binding state and influencing the binding ability of PHR to SPX promoter [49]. Meanwhile, studies had shown that MYB, WRKY, and MYC proteins participate in the regulation of plant Pi signaling [67,68,69]. In our study, binding sites of a large number of transcription factors were also identified in the PmSPX1 promoter region. Thus, these results suggested that PmSPX1 may be regulated by multiple transcription factors in response to phosphorus deficiency.
To date, more and more WRKY transcription factors have been found to respond to phosphorus deficiency in plants [70,71]. Meanwhile, it has been found that WRKY protein could bind to the W-box element of the target gene [69]. Fan et al. [72] found that WRKY transcription factors may play a vital role in the phosphorus deficiency response of P. massoniana. In poplars, WRKY75 was located in the nucleus and could bind to the W-box [73]. Similarly, it was found in rapeseed that WRKY75 could bind to BnPht1;4 promoters through W-box under phosphorus stress [74]. In this study, we found that the PmSPX2 promoter contained a W-box element, and yeast one-hybrid analysis showed that PmWRKY75 could directly bind to the PmSPX2 promoter (Figure 6A,C). These results suggested that PmSPX2 may be controlled by PmWRKY75 transcription factors in response to low Pi stress.

5. Conclusions

In this study, we identified 10 SPX genes from the P. massoniana transcriptome and analyzed the phylogenetic relationships, conserved motif, physicochemical properties of proteins, and subcellular localization of these genes, providing a theoretical framework for further study of this gene family. We analyzed the expression patterns of the PmSPXs gene in different tissues of P. massoniana seedlings under phosphorus stress, providing a basis for studying its regulatory role in response to low phosphorus stress. In addition, we observed PmSPX1 and PmSPX4 localization in tobacco cells and found that they were located in the nucleus. Isolation of PmSPX1 promoter and bioinformatics analysis showed that the PmSPX1 gene contained various cis-acting elements, which supported the diversity of its regulatory functions. Furthermore, yeast one-hybrid assay demonstrated that PmWRKY75 could bind directly to the PmSPX2 promoter. Thus, functional identification of the PmSPXs gene laid a necessary foundation for further analysis of its role in response to phosphorus stress in P. massoniana.

Supplementary Materials

The following are available online at https://www.mdpi.com/article/10.3390/f12121627/s1, Table S1. Ten Pinus massoniana SPX proteins sequences, Table S2. Differentially expressed data of SPX genes family, Table S3. Primers for RT-qPCR, Table S4. DNA sequence information, Table S5. Sequence cloning primer. Table S6. The relative expression level of PmSPX1 and PmSPX4.

Author Contributions

C.W. designed, performed the experiments, and wrote the paper; F.F. conducted the experiments and revised the manuscript; X.S., Z.Z., and G.D. collected and analyzed the data. All authors have read and agreed to the published version of the manuscript.

Funding

This study was financed by the Post-National Key Research and Development Project, China (20185261), the National Natural Science Foundation of China (31660185), the Science and Technology Foundation of Guizhou, China (20175788), and the First-class Discipline Construction Project of Guizhou Province, China (GNYL [2017] 007).

Data Availability Statement

The data presented in this study are available on request from the corresponding author.

Conflicts of Interest

The authors declare no conflict of interest.

References

  1. Wang, F.; Deng, M.; Xu, J.; Zhu, X.; Mao, C. Molecular mechanisms of phosphate transport and signaling in higher plants. Semin. Cell Dev. Biol. 2018, 74, 114–122. [Google Scholar] [CrossRef] [PubMed]
  2. Richardson, A.E.; Simpson, R.J. Soil microorganisms mediating phosphorus availability update on microbial phosphorus. Plant Physiol. 2011, 156, 989–996. [Google Scholar] [CrossRef] [Green Version]
  3. Raghothama, K.G. Phosphate acquisition. Annu. Rev. Plant Physiol. Plant Mol. Biol. 1999, 50, 665–693. [Google Scholar] [CrossRef]
  4. Cho, H.; Bouain, N.; Zheng, L.; Rouached, H. Plant resilience to phosphate limitation: Current knowledge and future challenges. Crit. Rev. Biotechnol. 2021, 41, 63–71. [Google Scholar] [CrossRef] [PubMed]
  5. Vance, C.P.; Uhde-Stone, C.; Allan, D.L. Phosphorus acquisition and use: Critical adaptations by plants for securing a nonrenewable resource. New Phytol. 2003, 157, 423–447. [Google Scholar] [CrossRef] [PubMed] [Green Version]
  6. Ham, B.K.; Chen, J.; Yan, Y.; Lucas, W.J. Insights into plant phosphate sensing and signaling. Curr. Opin. Biotechnol. 2018, 49, 1–9. [Google Scholar] [CrossRef]
  7. Chang, M.X.; Gu, M.; Xia, Y.W.; Dai, X.L.; Dai, C.R.; Zhang, J.; Wang, S.C.; Qu, H.Y.; Yamaji, N.; Ma, J.F.; et al. OsPHT1;3 mediates uptake, translocation, and remobilization of phosphate under extremely low phosphate regimes. Plant Physiol. 2019, 179, 656–670. [Google Scholar] [CrossRef] [PubMed] [Green Version]
  8. Qi, W.; Baldwin, S.A.; Muench, S.P.; Baker, A. Pi sensing and signalling: From prokaryotic to eukaryotic cells. Biochem. Soc. Trans. 2016, 44, 766–773. [Google Scholar] [CrossRef] [PubMed] [Green Version]
  9. Vogiatzaki, E.; Baroux, C.; Jung, J.Y.; Poirier, Y. PHO1 exports phosphate from the chalazal seed coat to the embryo in developing Arabidopsis seeds. Curr. Biol. 2017, 27, 2893–2900.e3. [Google Scholar] [CrossRef] [PubMed] [Green Version]
  10. Huang, Y.; Xu, P.H.; Hou, B.Z.; Shen, Y.Y. Strawberry tonoplast transporter, FaVPT1, controls phosphate accumulation and fruit quality. Plant Cell Environ. 2019, 42, 2715–2729. [Google Scholar] [CrossRef] [PubMed]
  11. Torres-Rodríguez, J.V.; Salazar-Vidal, M.N.; Montes, R.A.C.; Massange-Sánchez, J.A.; Gillmor, C.S.; Sawers, R.J.H. Low nitrogen availability inhibits the phosphorus starvation response in maize (Zea mays ssp. mays L.). BMC Plant Biol. 2021, 21, 259. [Google Scholar] [CrossRef] [PubMed]
  12. Duan, K.; Yi, K.; Dang, L.; Huang, H.; Wu, W.; Wu, P. Characterization of a sub-family of Arabidopsis genes with the SPX domain reveals their diverse functions in plant tolerance to phosphorus starvation. Plant J. 2008, 54, 965–975. [Google Scholar] [CrossRef] [PubMed]
  13. Wang, C.; Ying, S.; Huang, H.; Li, K.; Wu, P.; Shou, H. Involvement of OsSPX1 in phosphate homeostasis in rice. Plant J. 2009, 57, 895–904. [Google Scholar] [CrossRef] [PubMed]
  14. Yao, Z.F.; Liang, C.Y.; Zhang, Q.; Chen, Z.J.; Xiao, B.X.; Tian, J.; Liao, H. SPX1 is an important component in the phosphorus signalling network of common bean regulating root growth and phosphorus homeostasis. J. Exp. Bot. 2014, 65, 3299–3310. [Google Scholar] [CrossRef] [PubMed] [Green Version]
  15. Du, H.; Yang, C.; Ding, G.; Shi, L.; Xu, F. Genome-wide identification and characterization of SPX domain-containing members and their responses to phosphate deficiency in Brassica napus. Front. Plant Sci. 2017, 8, 35. [Google Scholar] [CrossRef] [Green Version]
  16. Kumar, A.; Sharma, M.; Gahlaut, V.; Nagaraju, M.; Chaudhary, S.; Kumar, A.; Tyagi, P.; Gajula, M.N.V.P.; Singh, K.P. Genome-wide identification, characterization, and expression profiling of SPX gene family in wheat. Int. J. Biol. Macromol. 2019, 140, 17–32. [Google Scholar] [CrossRef]
  17. Wang, Y.; Ribot, C.; Rezzonico, E.; Poirier, Y. Structure and expression profile of the Arabidopsis PHO1 gene family indicates a broad role in inorganic phosphate homeostasis. Plant Physiol. 2004, 135, 400–411. [Google Scholar] [CrossRef] [PubMed] [Green Version]
  18. Secco, D.; Wang, C.; Arpat, B.A.; Wang, Z.; Poirier, Y.; Tyerman, S.D.; Wu, P.; Shou, H.; Whelan, J. The emerging importance of the SPX domain-containing proteins in phosphate homeostasis. New Phytol. 2012, 193, 842–851. [Google Scholar] [CrossRef] [PubMed] [Green Version]
  19. Liu, N.; Shang, W.; Li, C.; Jia, L.; Wang, X.; Xing, G.; Zheng, W. Evolution of the SPX gene family in plants and its role in the response mechanism to phosphorus stress. Open Biol. 2018, 8, 170231. [Google Scholar] [CrossRef] [Green Version]
  20. Liu, T.Y.; Huang, T.K.; Yang, S.Y.; Hong, Y.T.; Huang, S.M.; Wang, F.N.; Chiang, S.F.; Tsai, S.Y.; Lu, W.C.; Chiou, T.J. Identification of plant vacuolar transporters mediating phosphate storage. Nat. Commun. 2016, 7, 11095. [Google Scholar] [CrossRef] [PubMed] [Green Version]
  21. Yang, S.Y.; Huang, T.K.; Kuo, H.F.; Chiou, T.J. Role of vacuoles in phosphorus storage and remobilization. J. Exp. Bot. 2017, 68, 3045–3055. [Google Scholar] [CrossRef]
  22. Wang, C.; Huang, W.; Ying, Y.; Li, S.; Secco, D.; Tyerman, S.; Whelan, J.; Shou, H. Functional characterization of the rice SPX-MFS family reveals a key role of OsSPX-MFS1 in controlling phosphate homeostasis in leaves. New Phytol. 2012, 196, 139–148. [Google Scholar] [CrossRef] [PubMed]
  23. Wang, C.; Yue, W.; Ying, Y.; Wang, S.; Secco, D.; Liu, Y.; Whelan, J.; Tyerman, S.D.; Shou, H. Rice SPX-Major facility superfamily3, a vacuolar phosphate efflux transporter, is involved in maintaining phosphate homeostasis in rice. Plant Physiol. 2015, 169, 2822–2831. [Google Scholar] [CrossRef] [PubMed] [Green Version]
  24. Chiou, T.J. The diverse roles of rice PHO1 in phosphate transport: From root to node to grain. Plant Cell Physiol. 2020, 61, 1384–1386. [Google Scholar] [CrossRef]
  25. Wege, S.; Khan, G.A.; Jung, J.Y.; Vogiatzaki, E.; Pradervand, S.; Aller, I.; Meyer, A.J.; Poirier, Y. The EXS Domain of PHO1 participates in the response of shoots to phosphate deficiency via a root-to-shoot signal. Plant Physiol. 2016, 170, 385–400. [Google Scholar] [CrossRef] [PubMed] [Green Version]
  26. Chaiwong, N.; Prom-u-thai, C.; Bouain, N.; Lacombe, B.; Rouached, H. Individual versus combinatorial effects of silicon, phosphate, and iron deficiency on the growth of lowland and upland rice varieties. Int. J. Mol. Sci. 2018, 19, 899. [Google Scholar] [CrossRef] [PubMed] [Green Version]
  27. Yang, J.; Wang, L.; Mao, C.; Lin, H. Characterization of the rice NLA family reveals a key role for OsNLA1 in phosphate homeostasis. Rice 2017, 10, 52. [Google Scholar] [CrossRef] [PubMed] [Green Version]
  28. Wang, Z.; Hu, H.; Huang, H.; Duan, K.; Wu, Z.; Wu, P. Regulation of OsSPX1 and OsSPX3 on expression of OsSPX domain genes and Pi-starvation signaling in rice. J. Integr. Plant Biol. 2009, 51, 663–674. [Google Scholar] [CrossRef] [PubMed]
  29. Zhou, Z.; Wang, Z.; Lv, Q.; Shi, J.; Zhong, Y.; Wu, P.; Mao, C. SPX proteins regulate Pi homeostasis and signaling in different subcellular level. Plant Signal. Behav. 2015, 10, e1061163. [Google Scholar] [CrossRef] [PubMed]
  30. Qi, W.; Manfield, I.W.; Muench, S.P.; Baker, A. AtSPX1 affects the AtPHR1-DNA-binding equilibrium by binding monomeric AtPHR1 in solution. Biochem. J. 2017, 474, 3675–3687. [Google Scholar] [CrossRef] [PubMed]
  31. Zhong, Y.; Wang, Y.; Guo, J.; Zhu, X.; Shi, J.; He, Q.; Liu, Y.; Wu, Y.; Zhang, L.; Lv, Q.; et al. Rice SPX6 negatively regulates the phosphate starvation response through suppression of the transcription factor PHR2. New Phytol. 2018, 219, 135–148. [Google Scholar] [CrossRef] [PubMed] [Green Version]
  32. Li, M.; Wang, H.; Zhao, X.; Lu, Z.; Sun, X.; Ding, G. Role of Suillus placidus in improving the drought tolerance of masson pine (Pinus massoniana Lamb.) Seedlings. Forests 2021, 12, 332. [Google Scholar] [CrossRef]
  33. Farjon, A. Pinus massoniana. IUCN Red List of Threat Species. 2013. Available online: https://doi.org/10.2305/IUCN.UK.2013-1.RLTS.T42379A2976356.en (accessed on 22 July 2021).
  34. Fan, F.; Wang, Q.; Wen, X.; Ding, G. Transcriptome-wide identification and expression profiling of Pinus Massoniana MYB transcription factors responding to phosphorus deficiency. J. For. Res. 2020, 31, 909–919. [Google Scholar] [CrossRef]
  35. Zhang, Y.; Zhou, Z.; Ma, X.; Jin, G. Foraging ability and growth performance of four subtropical tree species in response to heterogeneous nutrient environments. J. Res. 2021, 15, 91–98. [Google Scholar] [CrossRef]
  36. Fan, F.; Shang, X.; Ding, G.; Zhou, Z.; Tian, J. Integrated mRNA and miRNA expression analyses of Pinus massoniana roots and shoots in long-term response to phosphate deficiency. J. Plant Growth Regul. 2021, 9. [Google Scholar] [CrossRef]
  37. Ren, J.; Wen, L.; Gao, X.; Jin, C.; Xue, Y.; Yao, X. DOG 1.0: Illustrator of protein domain structures. Cell Res. 2009, 19, 271–273. [Google Scholar] [CrossRef] [PubMed]
  38. Tamura, K.; Stecher, G.; Peterson, D.; Filipski, A.; Kumar, S. MEGA6: Molecular evolutionary genetics analysis version 6.0. Mol. Biol. Evol. 2013, 30, 2725–2729. [Google Scholar] [CrossRef] [PubMed] [Green Version]
  39. Chen, C.; Chen, H.; Zhang, Y.; Thomas, H.R.; Frank, M.H.; He, Y.; Xia, R. TBtools: An integrative toolkit developed for interactive analyses of big biological data. Mol. Plant 2020, 13, 1194–1202. [Google Scholar] [CrossRef]
  40. Chen, W.; Chen, R.; Zhang, Y.; Li, J.; Tigabu, M.; Ma, X.; Li, M. Cloning, Characterization and Expression Analysis of the Phosphate Starvation Response Gene, ClPHR1, from Chinese Fir. Forests 2020, 11, 104. [Google Scholar] [CrossRef] [Green Version]
  41. Livak, K.J.; Schmittgen, T.D. Analysis of relative gene expression data using real-time quantitative PCR and the 2(-Delta Delta C(T)) Method. Methods 2001, 25, 402–408. [Google Scholar] [CrossRef]
  42. Lescot, M.; Déhais, P.; Thijs, G.; Marchal, K.; Moreau, Y.; Van de Peer, Y.; Rouzé, P.; Rombauts, S. PlantCARE, a database of plant cis-acting regulatory elements and a portal to tools for in silico analysis of promoter sequences. Nucleic Acids Res. 2002, 30, 325–327. [Google Scholar] [CrossRef]
  43. Miao, J.; Sun, J.; Liu, D.; Li, B.; Zhang, A.; Li, Z.; Tong, Y. Characterization of the promoter of phosphate transporter TaPHT1.2 differentially expressed in wheat varieties. J. Genet. Genomics 2009, 36, 455–466. [Google Scholar] [CrossRef]
  44. Su, T.; Xu, Q.; Zhang, F.C.; Chen, Y.; Li, L.Q.; Wu, W.H.; Chen, Y.F. WRKY42 modulates phosphate homeostasis through regulating phosphate translocation and acquisition in Arabidopsis. Plant Physiol. 2015, 167, 1579–1591. [Google Scholar] [CrossRef] [Green Version]
  45. Wang, C.; Fan, F.; Qin, H.; Zhou, Z.; Tan, J.; Ding, G. Cloning, prokaryotic expression and expression pattern analysis of Pinus massoniana PmSPX2 gene. Plant Physiol. J. 2021, 57, 1645–1656. [Google Scholar] [CrossRef]
  46. McKay Fletcher, D.M.; Ruiz, S.; Dias, T.; Petroselli, C.; Roose, T. Linking root structure to functionality: The impact of root system architecture on citrate-enhanced phosphate uptake. New Phytol. 2020, 227, 376–391. [Google Scholar] [CrossRef] [PubMed] [Green Version]
  47. Ruan, W.; Guo, M.; Cai, L.; Hu, H.; Li, C.; Liu, Y.; Wu, Z.; Mao, C.; Yi, K.; Wu, P.; et al. Genetic manipulation of a high-affinity PHR1 target cis-element to improve phosphorous uptake in Oryza sativa L. Plant Mol. Biol. 2015, 87, 429–440. [Google Scholar] [CrossRef] [PubMed]
  48. Sega, P.; Kruszka, K.; Szewc, Ł.; Szweykowska-Kulińska, Z.; Pacak, A. Identification of transcription factors that bind to the 5′-UTR of the barley PHO2 gene. Plant Mol. Biol. 2020, 102, 73–88. [Google Scholar] [CrossRef] [PubMed]
  49. Ried, M.K.; Wild, R.; Zhu, J.; Pipercevic, J.; Sturm, K.; Broger, L.; Harmel, R.K.; Abriata, L.A.; Hothorn, L.A.; Fiedler, D.; et al. Inositol pyrophosphates promote the interaction of SPX domains with the coiled-coil motif of PHR transcription factors to regulate plant phosphate homeostasis. Nat. Commun. 2021, 12, 384. [Google Scholar] [CrossRef]
  50. Zhang, K.; Song, Q.; Wei, Q.; Wang, C.; Zhang, L.; Xu, W.; Su, Z. Down-regulation of OsSPX1 caused semi-male sterility, resulting in reduction of grain yield in rice. Plant Biotechnol. J. 2016, 14, 1661–1672. [Google Scholar] [CrossRef] [PubMed] [Green Version]
  51. Zhao, L.; Liu, F.; Xu, W.; Di, C.; Zhou, S.; Xue, Y.; Yu, J.; Su, Z. Increased expression of OsSPX1 enhances cold/subfreezing tolerance in tobacco and Arabidopsis thaliana. Plant Biotechnol. J. 2009, 7, 550–561. [Google Scholar] [CrossRef] [PubMed]
  52. Wang, Y.; Chen, Y.F.; Wu, W.H. Potassium and phosphorus transport and signaling in plants. J. Integr. Plant Biol. 2021, 63, 34–52. [Google Scholar] [CrossRef] [PubMed]
  53. Secco, D.; Baumann, A.; Poirier, Y. Characterization of the rice PHO1 gene family reveals a key role for OsPHO1;2 in phosphate homeostasis and the evolution of a distinct clade in dicotyledons. Plant Physiol. 2010, 152, 1693–1704. [Google Scholar] [CrossRef] [PubMed] [Green Version]
  54. Che, J.; Yamaji, N.; Miyaji, T.; Mitani-Ueno, N.; Kato, Y.; Shen, R.F.; Ma, J.F. Node-localized transporters of phosphorus essential for seed development in rice. Plant Cell Physiol. 2020, 61, 1387–1398. [Google Scholar] [CrossRef] [PubMed]
  55. Liu, J.; Fu, S.; Yang, L.; Luan, M.; Zhao, F.; Luan, S.; Lan, W. Vacuolar SPX-MFS transporters are essential for phosphate adaptation in plants. Plant Signal. Behav. 2016, 11, e1213474. [Google Scholar] [CrossRef] [PubMed] [Green Version]
  56. Yue, W.; Ying, Y.; Wang, C.; Zhao, Y.; Dong, C.; Whelan, J.; Shou, H. OsNLA1, a RING-type ubiquitin ligase, maintains phosphate homeostasis in Oryza sativa via degradation of phosphate transporters. Plant J. 2017, 90, 1040–1051. [Google Scholar] [CrossRef] [PubMed] [Green Version]
  57. Du, W.; Ning, L.; Liu, Y.; Zhang, S.; Yang, Y.; Wang, Q.; Chao, S.; Yang, H.; Huang, F.; Cheng, H.; et al. Identification of loci and candidate gene GmSPX-RING1 responsible for phosphorus efficiency in soybean via genome-wide association analysis. BMC Genom. 2020, 21, 725. [Google Scholar] [CrossRef] [PubMed]
  58. Lv, Q.; Zhong, Y.; Wang, Y.; Wang, Z.; Zhang, L.; Shi, J.; Wu, Z.; Liu, Y.; Mao, C.; Yi, K.; et al. SPX4 negatively regulates phosphate signaling and homeostasis through its interaction with PHR2 in rice. Plant Cell 2014, 26, 1586–1597. [Google Scholar] [CrossRef] [Green Version]
  59. Wang, Z.; Ruan, W.; Shi, J.; Zhang, L.; Xiang, D.; Yang, C.; Li, C.; Wu, Z.; Liu, Y.; Yu, Y.; et al. Rice SPX1 and SPX2 inhibit phosphate starvation responses through interacting with PHR2 in a phosphate-dependent manner. Proc. Natl. Acad. Sci. USA 2014, 111, 14953–14958. [Google Scholar] [CrossRef] [PubMed] [Green Version]
  60. Puga, M.I.; Mateos, I.; Charukesi, R.; Wang, Z.; Franco-Zorrilla, J.M.; de Lorenzo, L.; Irigoyen, M.L.; Masiero, S.; Bustos, R.; Rodríguez, J.; et al. SPX1 is a phosphate-dependent inhibitor of Phosphate Starvation Response 1 in Arabidopsis. Proc. Natl. Acad. Sci. USA 2014, 111, 14947–14952. [Google Scholar] [CrossRef] [Green Version]
  61. Yan, H.; Sheng, M.; Wang, C.; Liu, Y.; Yang, J.; Liu, F.; Xu, W.; Su, Z. AtSPX1-mediated transcriptional regulation during leaf senescence in Arabidopsis thaliana. Plant Sci. 2019, 283, 238–246. [Google Scholar] [CrossRef] [PubMed]
  62. Li, Y.; Chen, C.Y.; Kaye, A.M.; Wasserman, W.W. The identification of cis-regulatory elements: A review from a machine learning perspective. Biosystems 2015, 138, 6–17. [Google Scholar] [CrossRef] [PubMed]
  63. Kang, X.; Ni, M. Arabidopsis SHORT HYPOCOTYL UNDER BLUE1 contains SPX and EXS domains and acts in cryptochrome signaling. Plant Cell 2006, 18, 921–934. [Google Scholar] [CrossRef] [PubMed] [Green Version]
  64. Zhou, Y.; Ni, M. SHORT HYPOCOTYL UNDER BLUE1 truncations and mutations alter its association with a signaling protein complex in Arabidopsis. Plant Cell 2010, 22, 703–715. [Google Scholar] [CrossRef] [PubMed] [Green Version]
  65. Oldroyd, G.E.D.; Leyser, O. A plant’s diet, surviving in a variable nutrient environment. Science 2020, 368, eaba0196. [Google Scholar] [CrossRef] [PubMed]
  66. Sega, P.; Pacak, A. Plant PHR Transcription Factors: Put on A Map. Genes 2019, 10, 1018. [Google Scholar] [CrossRef] [Green Version]
  67. Jain, A.; Nagarajan, V.K.; Raghothama, K.G. Transcriptional regulation of phosphate acquisition by higher plants. Cell Mol. Life Sci. 2012, 69, 3207–3224. [Google Scholar] [CrossRef] [PubMed]
  68. He, Q.; Lu, H.; Guo, H.; Wang, Y.; Zhao, P.; Li, Y.; Wang, F.; Xu, J.; Mo, X.; Mao, C. OsbHLH6 interacts with OsSPX4 and regulates the phosphate starvation response in rice. Plant J. 2021, 105, 649–667. [Google Scholar] [CrossRef] [PubMed]
  69. Zhang, J.; Gu, M.; Liang, R.; Shi, X.; Chen, L.; Hu, X.; Wang, S.; Dai, X.; Qu, H.; Li, H.; et al. OsWRKY21 and OsWRKY108 function redundantly to promote phosphate accumulation through maintaining the constitutive expression of OsPHT1;1 under phosphate-replete conditions. New Phytol. 2021, 229, 1598–1614. [Google Scholar] [CrossRef] [PubMed]
  70. Jiang, J.; Ma, S.; Ye, N.; Jiang, M.; Cao, J.; Zhang, J. WRKY transcription factors in plant responses to stresses. J. Integr. Plant Biol. 2017, 59, 86–101. [Google Scholar] [CrossRef]
  71. Shen, N.; Hou, S.; Tu, G.; Lan, W.; Jing, Y. Transcription factor WRKY33 mediates the phosphate deficiency-induced remodeling of root architecture by modulating iron homeostasis in Arabidopsis roots. Int. J. Mol. Sci. 2021, 22, 9275. [Google Scholar] [CrossRef] [PubMed]
  72. Fan, F.; Wang, Q.; Li, H.; Ding, G.; Wen, X. Transcriptome-wide identification and expression profiles of masson pine WRKY transcription factors in response to low phosphorus stress. Plant Mol. Biol. Rep. 2021, 39, 1–9. [Google Scholar] [CrossRef]
  73. Zhao, K.; Zhang, D.; Lv, K.; Zhang, X.; Cheng, Z.; Li, R.; Zhou, B.; Jiang, T. Functional characterization of poplar WRKY75 in salt and osmotic tolerance. Plant Sci. 2019, 289, 110259. [Google Scholar] [CrossRef] [PubMed]
  74. Ren, F.; Zhao, C.Z.; Liu, C.S.; Huang, K.L.; Guo, Q.Q.; Chang, L.L.; Xiong, H.; Li, X.B. A Brassica napus PHT1 phosphate transporter, BnPht1;4, promotes phosphate uptake and affects roots architecture of transgenic Arabidopsis. Plant Mol. Biol. 2014, 86, 595–607. [Google Scholar] [CrossRef] [PubMed]
Figure 1. Subcellular localization of PmSPX1 and PmSPX4 in N. benthamiana. Scale bars = 25 μm.
Forests 12 01627 g001
Figure 2. (A) Phylogenetic analysis of the SPX proteins of P. massoniana, rice, and Arabidopsis. Different subfamilies are represented by different color branches and stripes. The blue background represents Arabidopsis, the green background represents rice and the purple background represents P. massoniana. (B) The conserved domain of PmSPX proteins. The location and size of different domains were indicated in different colors. The two ends of the arrow represent the N-terminals and C-terminals of SPX proteins respectively. (C) The left and right sides represent the phylogenetic tree and the distribution of conserved motifs of 10 PmSPX proteins, respectively. In total 6 conserved motifs are represented with different colored boxes.
Forests 12 01627 g002
Figure 3. Heat maps of the relative expression of 10 PmSPX genes under phosphorus deficiency. The gene relative expression values were normalized by log2 transformation and expressed as color fractions. A concentration of normal Pi (CK) was used as a control. LS/R denotes aboveground and underground parts.
Forests 12 01627 g003
Figure 4. (A) Morphology of P. massoniana seedlings treated with different phosphorus concentrations and three biological replicates were set up. P1 (severe low phosphorus: 0.01 mM Pi), P2 (moderate-low phosphorus: 0.01 mM Pi) and Control (normal phosphorus: 0.5 mM Pi). R, S, and L respectively represent the root, stem, and leaf of P. massoniana seedlings. (B) Expression patterns of PmSPX1 and PmSPX4 in different tissues under different phosphorus deficiency conditions. The relative expression of PmSPX1 and PmSPX4 was analyzed by RT-qPCR in root, stem, and leaf. Error bars ± SEM (standard error). Asterisks represent significant differences of gene expression in different tissue parts of P. massoniana seedlings between different Pi deficiency and normal phosphorus in t-tests. * p < 0.05, ** p < 0.01.
Forests 12 01627 g004
Figure 5. Information of the PmSPX1 promoter. (A) The PmSPX1 promoter cloning model is based on genome walking. (B) Analysis of three rounds of genome walking by gel electrophoresis. The position of the red rectangle represents the PmSPX1 promoter that was cloned in each round. (C) Nucleotide sequence and predicted cis-acting elements of the PmSPX1 promoter. On the right, different colors indicate different cis-acting elements. On the left, rectangles of different colors show the sequence and position of each cis-acting element, for example, the W-box (CCAGTT) is shown in magenta between −1724 bp and −1794 bp. The location of each specific primer was indicated by the arrows.
Forests 12 01627 g005
Figure 6. (A,C) Y1H assay to dissect the binding regions of PmWRKY75 in the promoter regions of PmSPX2. 0.1, 0.01, and 0.001 indicate yeast dilution 10 times, 100 times, and 1000 times, respectively. pAbAi- & pGADT7 and pAbAi-proSPX2 & pGADT7 as two negative controls, and pAbAi-p53 & pGADT7-rec53 as a positive control. (B) The conserved domain of PmWKY75 proteins. The location and size of WRKY domains are indicated in bright blue. (D) Nucleotide sequence and predicted cis-acting elements of the PmSPX2 promoter. On the left, different colors indicate different cis-acting elements. On the right, rectangles of different colors show the sequence and position of each cis-acting element, for example, the W-box (CCAGTT) is shown in bright blue between −601 bp and −671 bp. The sequence contained in parentheses (790 bp) was connected to the bait vector.
Forests 12 01627 g006
Table 1. Basic information for 10 identified PmSPX members.
GeneGene ID acDNA LengthaaMW (kDa)pIDomain Subfamilies bSubcellular Localization c
PmSPX1Unigene0025956125629033.6425.27SPXNuclear
PmSPX2Unigene0055609174034939.6265.58SPXNuclear
PmSPX4Unigene004869190436641.0135.07SPXNuclear
PmSPX-MFS1Unigene0002810194953060.3898.34SPX-MFSPlasma Membrane
PmSPX-MFS2Unigene0019666266070278.3966.14SPX-MFSPlasma Membrane
PmPHO1Unigene0054294298882093.0819.40SPX-EXSPlasma Membrane
PmPHO1;H1Unigene0004203313080293.0579.24SPX-EXSPlasma Membrane
PmNLA1Unigene0027297199826730.4137.53SPX-RINGNuclear
PmNLA2Unigene0000965137135540.3918.18SPX-RINGNuclear
PmNLA3Unigene0063200256035340.2358.97SPX-RINGNuclear
a The gene ID was obtained from the transcriptome data of P. massoniana Pi stress transcriptome (PRJNA641031). b The domain subfamilies were classified based on CD-search (https://www.ncbi.nlm.nih.gov/cdd/, accessed on 10 April 2021) search for the conserved domain of PmSPX proteins. c Subcellular localization of the PmSPX proteins is projected using CELLO (http://cello.life.nctu.edu.tw/, accessed on 10 April 2021) and PSORT (https://psort.hgc.jp/, accessed on 10 April 2021).
Table 2. Information of conserved motifs from PmSPX proteins.
MotifLengthSequence
129RELVLLENYSSLNATAIRKILKKYDKRTG
221YPEWKDKFLNYKLLKKKLKKI
350TCPICLDTVFDPVALGCGHIFCNNCACTGASIPTIEGVKAANPRARCPJC
447KDRRAAEKDFIKLLDAZLEKFNLFFLEKEEEYIIRLEELKERIERLK
550KSPWLIELIAFQINTRDPEHGHIGEIFPECSCDFTGSDPVJTCTLPDSVK
650RQMGVYADSVHLPELGLLVKKRCRGYWEERLHTERAERVKQAKEHWDLQS
Publisher’s Note: MDPI stays neutral with regard to jurisdictional claims in published maps and institutional affiliations.

