
The Identification of Several Dipterocarpaceae and Fagaceae Trees by Barcode DNA Coupled with High-Resolution Melting Analysis


Abstract
:1. Introduction
2. Materials and Methods
2.1. Data Mining for Primer Design
2.2. Plants Samples and DNA Extraction
2.3. In Silico Analysis of the Most Suitable Region for HRM Analysis
2.4. Simulation High-Resolution Melting (HRM)
2.5. High-Resolution Melting (HRM) Analysis
3. Results
3.1. Experiment 1: Comparing Primer Design Methods
3.2. Experiment 2: Using Bar-HRM to Identify Unknown Species (Dipterocarpaceae)
4. Conclusions
5. Discussion
5.1. Experiment 1: Comparing Primer Design Methods
5.2. Experiment 2: Using Bar-HRM to Identify Unknown Species (Dipterocarpaceae)
Supplementary Materials
Author Contributions
Funding
Institutional Review Board Statement
Informed Consent Statement
Data Availability Statement
Acknowledgments
Conflicts of Interest
References
- Estoque, R.C.; Ooba, M.; Avitabile, V.; Hijioka, Y.; DasGupta, R.; Togawa, T.; Murayama, Y. The future of Southeast Asia’s forests. Nat. Commun. 2019, 10, 1829. [Google Scholar] [CrossRef] [Green Version]
- Maxwell, S.L.; Evans, T.; Watson, J.; Morel, A.; Grantham, H.; Duncan, A.; Harris, N.; Potapov, P.; Runting, R.K.; Venter, O.; et al. Degradation and forgone removals increase the carbon impact of intact forest loss by 626%. Sci. Adv. 2019, 5, eaax2546. [Google Scholar] [CrossRef] [Green Version]
- Sasaki, S. Physiological characteristics of tropical rain forest tree species: A basis for the development of silvicultural technology. Proc. Jpn. Acad. Ser. B Phys. Biol. Sci. 2008, 84, 31–57. [Google Scholar] [CrossRef] [PubMed] [Green Version]
- Singh, P.P.; Chakraborty, T.; Dermann, A.; Dermann, F.; Adhikari, D.; Gurung, P.B.; Barik, S.K.; Bauhus, J.; Fassnacht, F.E.; Dey, D.C.; et al. Assessing Restoration Potential of Fragmented and Degraded Fagaceae Forests in Meghalaya, North-East India. Forests 2020, 11, 1008. [Google Scholar] [CrossRef]
- Widiyatno; Fanny, H.; Suryo, H.; Sapto, I.; Susilo, P.J.; Naoki, T.; Mohammad, N. Selection of dipterocarp species for enrichment planting in a secondary tropical rainforest. For. Sci. Technol. 2020, 16, 206–215. [Google Scholar] [CrossRef]
- Margules, C.R.; Pressey, R.L. Systematic conservation planning. Nature 2000, 405, 243. [Google Scholar] [CrossRef] [PubMed]
- Forman, L.L. Trigonobalanus a new genus of Fagaceae with notes on the classification of the family. Kew. Bull. 1964, 17, 381–396. [Google Scholar] [CrossRef]
- Hebert, P.; Gregory, T.R. The promise of DNA barcoding for taxonomy. Syst. Bot. 2005, 54, 852–859. [Google Scholar] [CrossRef]
- Hajibabaei, M.; Singer, G.A.; Hebert, P.D.; Hickey, D.A. DNA barcoding: How it complements taxonomy, molecular phylogenetics and population genetics. Trends Genet. 2007, 23, 167–172. [Google Scholar] [CrossRef]
- Joly, S.; Davies, T.J.; Archambault, A.; Bruneau, A.; Derry, A.; Kembel, S.W.; Peres-Neto, P.; Vamosi, J.; Wheeler, T.A. Ecology in the age of DNA barcoding: The resource, the promise and the challenges ahead. Mol. Ecol. Resour. 2013, 14, 221–232. [Google Scholar] [CrossRef] [PubMed]
- Pečnikar, F.Z.; Buzan, E.V. 20 years since the introduction of DNA barcoding: From theory to application. J. Appl. Genet. 2014, 55, 43–52. [Google Scholar] [CrossRef]
- Hebert, P.D.; Ratnasingham, S.; de Waard, J.R. Barcoding animal life: Cytochrome c oxidase subunit 1 divergences among closely related species. Proc. R. Soc. Lond. B Biol. Sci. 2003, 270 (Suppl. 1), S96–S99. [Google Scholar] [CrossRef] [PubMed] [Green Version]
- Chase, M.W.; Cowan, R.S.; Hollingsworth, P.M.; Van Den Berg, C.; Madriñán, S.; Petersen, G.; Seberg, O.; Jørgsensen, T.; Cameron, K.M.; Carine, M.; et al. A proposal for a standardised protocol to barcode all land plants. Taxon 2007, 56, 295–299. [Google Scholar] [CrossRef]
- Kress, W.J. Use of DNA barcodes to identify flowering plants. Proc. Natl. Acad. Sci. USA 2005, 102, 8369–8374. [Google Scholar] [CrossRef] [PubMed] [Green Version]
- CBOL Plant Working Group. A DNA barcode for land plants. Proc. Natl. Acad. Sci. USA 2009, 106, 12794–12797. [Google Scholar] [CrossRef] [PubMed] [Green Version]
- Pennisi, E. Wanted: A barcode for plants. Science 2007, 318, 190–191. [Google Scholar] [CrossRef]
- Erickson, D.L.; Spouge, J.; Resch, A.; Weigt, L.A.; Kress, J.W. DNA barcoding in land plants: Developing standards to quantify and maximize success. Taxon 2008, 57, 1304–1316. [Google Scholar] [CrossRef] [PubMed]
- Lahaye, R.; Van der Bank, M.; Bogarin, D.; Warner, J.; Pupulin, F. DNA barcoding the floras of biodiversity hotspots. Proc. Natl. Acad. Sci. USA 2008, 105, 2923–2928. [Google Scholar] [CrossRef] [Green Version]
- Ledford, H. Botanical identities: DNA barcoding for plants comes a step closer. Nature 2008, 451, 616. [Google Scholar] [CrossRef]
- Farrington, L.; MacGillivray, P.; Faast, R.; Austin, A. Investigating DNA barcoding options for the identification of Caladenia (Orchidaceae) species. Aust. J. Bot. 2009, 57, 276–286. [Google Scholar] [CrossRef]
- Taberlet, P.; Coissac, E.; Pompanon, F.; Gielly, L.; Miquel, C.; Valentini, A.; Vermat, T.; Corthier, G.; Brochmann, C.; Willerslev, E. Power and limitations of the chloroplast trnL (UAA) intron for plant DNA barcoding. Nucleic Acids Res. 2006, 35, e1. [Google Scholar] [CrossRef] [PubMed] [Green Version]
- Fahner, N.A.; Shokralla, S.; Baird, D.J.; Hajibabaei, M. Large-scale monitoring of plants through environmental DNA metabarcoding of soil: Recovery, resolution, and annotation of four DNA markers. PLoS ONE 2016, 11, e0157505. [Google Scholar] [CrossRef] [Green Version]
- Chen, S.; Yao, H.; Han, J.; Liu, C.; Song, J.; Shi, L.; Zhu, Y.; Ma, X.; Gao, T.; Pang, X.; et al. Validation of the ITS2 Region as a Novel DNA Barcode for Identifying Medicinal Plant Species. PLoS ONE 2010, 5, e8613. [Google Scholar] [CrossRef] [PubMed]
- Li, D.Z.; Gao, L.M.; Li, H.T.; Wang, H.; Ge, X.J.; Liu, J.Q.; Chen, Z.D.; Zhou, S.L.; Chen, S.L.; Yang, J.B. Comparative analysis of a large dataset indicates that internal transcribed spacer (ITS) should be incorporated into the core barcode for seed plants. Proc. Natl. Acad. Sci. USA 2011, 108, 19641–19646. [Google Scholar] [PubMed] [Green Version]
- Feliner, G.N.; Rosselló, J.A. Better the devil you know? Guidelines for insightful utilization of nrDNA ITS in species-level evolutionary studies in plants. Mol. Phylogenetics Evol. 2007, 44, 911–919. [Google Scholar] [CrossRef] [Green Version]
- Ganopoulos, I.; Sakaridis, I.; Argiriou, A.; Madesis, P.; Tsaftaris, A. A novel closed-tube method based on high resolution melting (HRM) analysis for authenticity testing and quantitative detection in Greek PDO Feta cheese. Food Chem. 2013, 141, 835–840. [Google Scholar] [CrossRef]
- Ririe, K.M.; Rasmussen, R.P.; Wittwer, C.T. Product differentiation by analysis of DNA melting curves during the polymerase chain reaction. Anal. Biochem. 1997, 245, 154–160. [Google Scholar] [CrossRef]
- Reed, G.H.; Wittwer, C.T. Sensitivity and Specificity of Single-Nucleotide Polymorphism Scanning by High-Resolution Melting Analysis. Clin. Chem. 2004, 50, 1748–1754. [Google Scholar] [CrossRef] [Green Version]
- Madesis, P.; Ganopoulos, I.; Anagnostis, A.; Tsaftaris, A. The application of Bar-HRM (Barcode DNA-High Resolution Melting) analysis for authenticity testing and quantitative detection of bean crops (Leguminosae) without prior DNA purification. Food Control 2012, 25, 576–582. [Google Scholar] [CrossRef]
- Madesis, P.; Ganopoulos, I.; Bosmali, I.; Tsaftaris, A. Barcode High Resolution Melting analysis for forensic uses in nuts: A case study on allergenic hazelnuts (Corylus avellana). Food Res. Int. 2013, 50, 351–360. [Google Scholar] [CrossRef]
- Osathanunkul, M.; Madesis, P.; de Boer, H. Bar-HRM for Authentication of Plant-Based Medicines: Evaluation of Three Medicinal Products Derived from Acanthaceae Species. PLoS ONE 2015, 10, e0128476. [Google Scholar] [CrossRef] [Green Version]
- Singtonat, S.; Osathanunkul, M. Fast and reliable detection of toxic Crotalaria spectabilis Roth. in Thunbergia laurifolia Lindl. herbal products using DNA barcoding coupled with HRM analysis. BMC Complement. Altern. Med. 2015, 15, 162. [Google Scholar] [CrossRef] [Green Version]
- Osathanunkul, M.; Suwannapoom, C.; Khamyong, N.; Pintakum, D.; Lamphun, S.; Triwitayakorn, K.; Osathanunkul, K.; Madesis, P. Hybrid analysis (barcode-high resolution melting) for authentication of Thai herbal products, Andrographis paniculata (Burm.f.) Wall. ex Nees. Pharmacogn. Mag. 2016, 12, 71–75. [Google Scholar] [CrossRef] [Green Version]
- Wittwer, C.T.; Reed, G.H.; Gundry, C.N.; Vandersteen, J.G.; Pryor, R.J. High-Resolution Genotyping by Amplicon Melting Analysis Using LCGreen. Clin. Chem. 2003, 49, 853–860. [Google Scholar] [CrossRef] [PubMed] [Green Version]
- Dieffenbach, C.W.; Lowe, T.M.; Dveksler, G.S. General concepts for PCR primer design. PCR Methods Appl. 1993, 3, S30–S37. [Google Scholar] [CrossRef]
- Kajita, T.; Kamiya, K.; Nakamura, K.; Tachida, H.; Wickneswari, R.; Tsumura, Y.; Yoshimaru, H.; Yamazaki, T. Molecular phylogeny of Dipterocarpaceae in Southeast Asia based on nucleotide sequences of matK, trnL intron, and trnL-trnF intergenic spacer region in chloroplast DNA. Theor. Appl. Genet. 1998, 10, 202–209. [Google Scholar]
- Kamiya, K.; Harada, K.; Kajita, T.; Yamazaki, T.; Lee, H.S.; Ogino, K.; Ashton, P.S. Molecular phylogeny of dipterocarp species using nucleotide sequences of two noncoding regions in chloroplast DNA. Tropics 1998, 7, 195–207. [Google Scholar] [CrossRef] [Green Version]
- Dayanandan, S.; Ashton, P.S.; Williams, S.M.; Primack, R.B. Phylogeny of the tropical tree family Dipterocarpaceae based on nucleotide sequences of the chloroplast rbcL gene. Am. J. Bot. 1999, 86, 1182–1190. [Google Scholar] [CrossRef] [Green Version]
- Yulita, K.S.; Bayer, R.J.; West, J.G. Molecular phylogenetic study of Hopea and Shorea (Dipterocarpaceae): Evidence from the trnL-trnF and internal transcribed spacer regions. Plant Species Biol. 2005, 20, 167–182. [Google Scholar] [CrossRef]


| Used in | Species | Voucher Number |
|---|---|---|
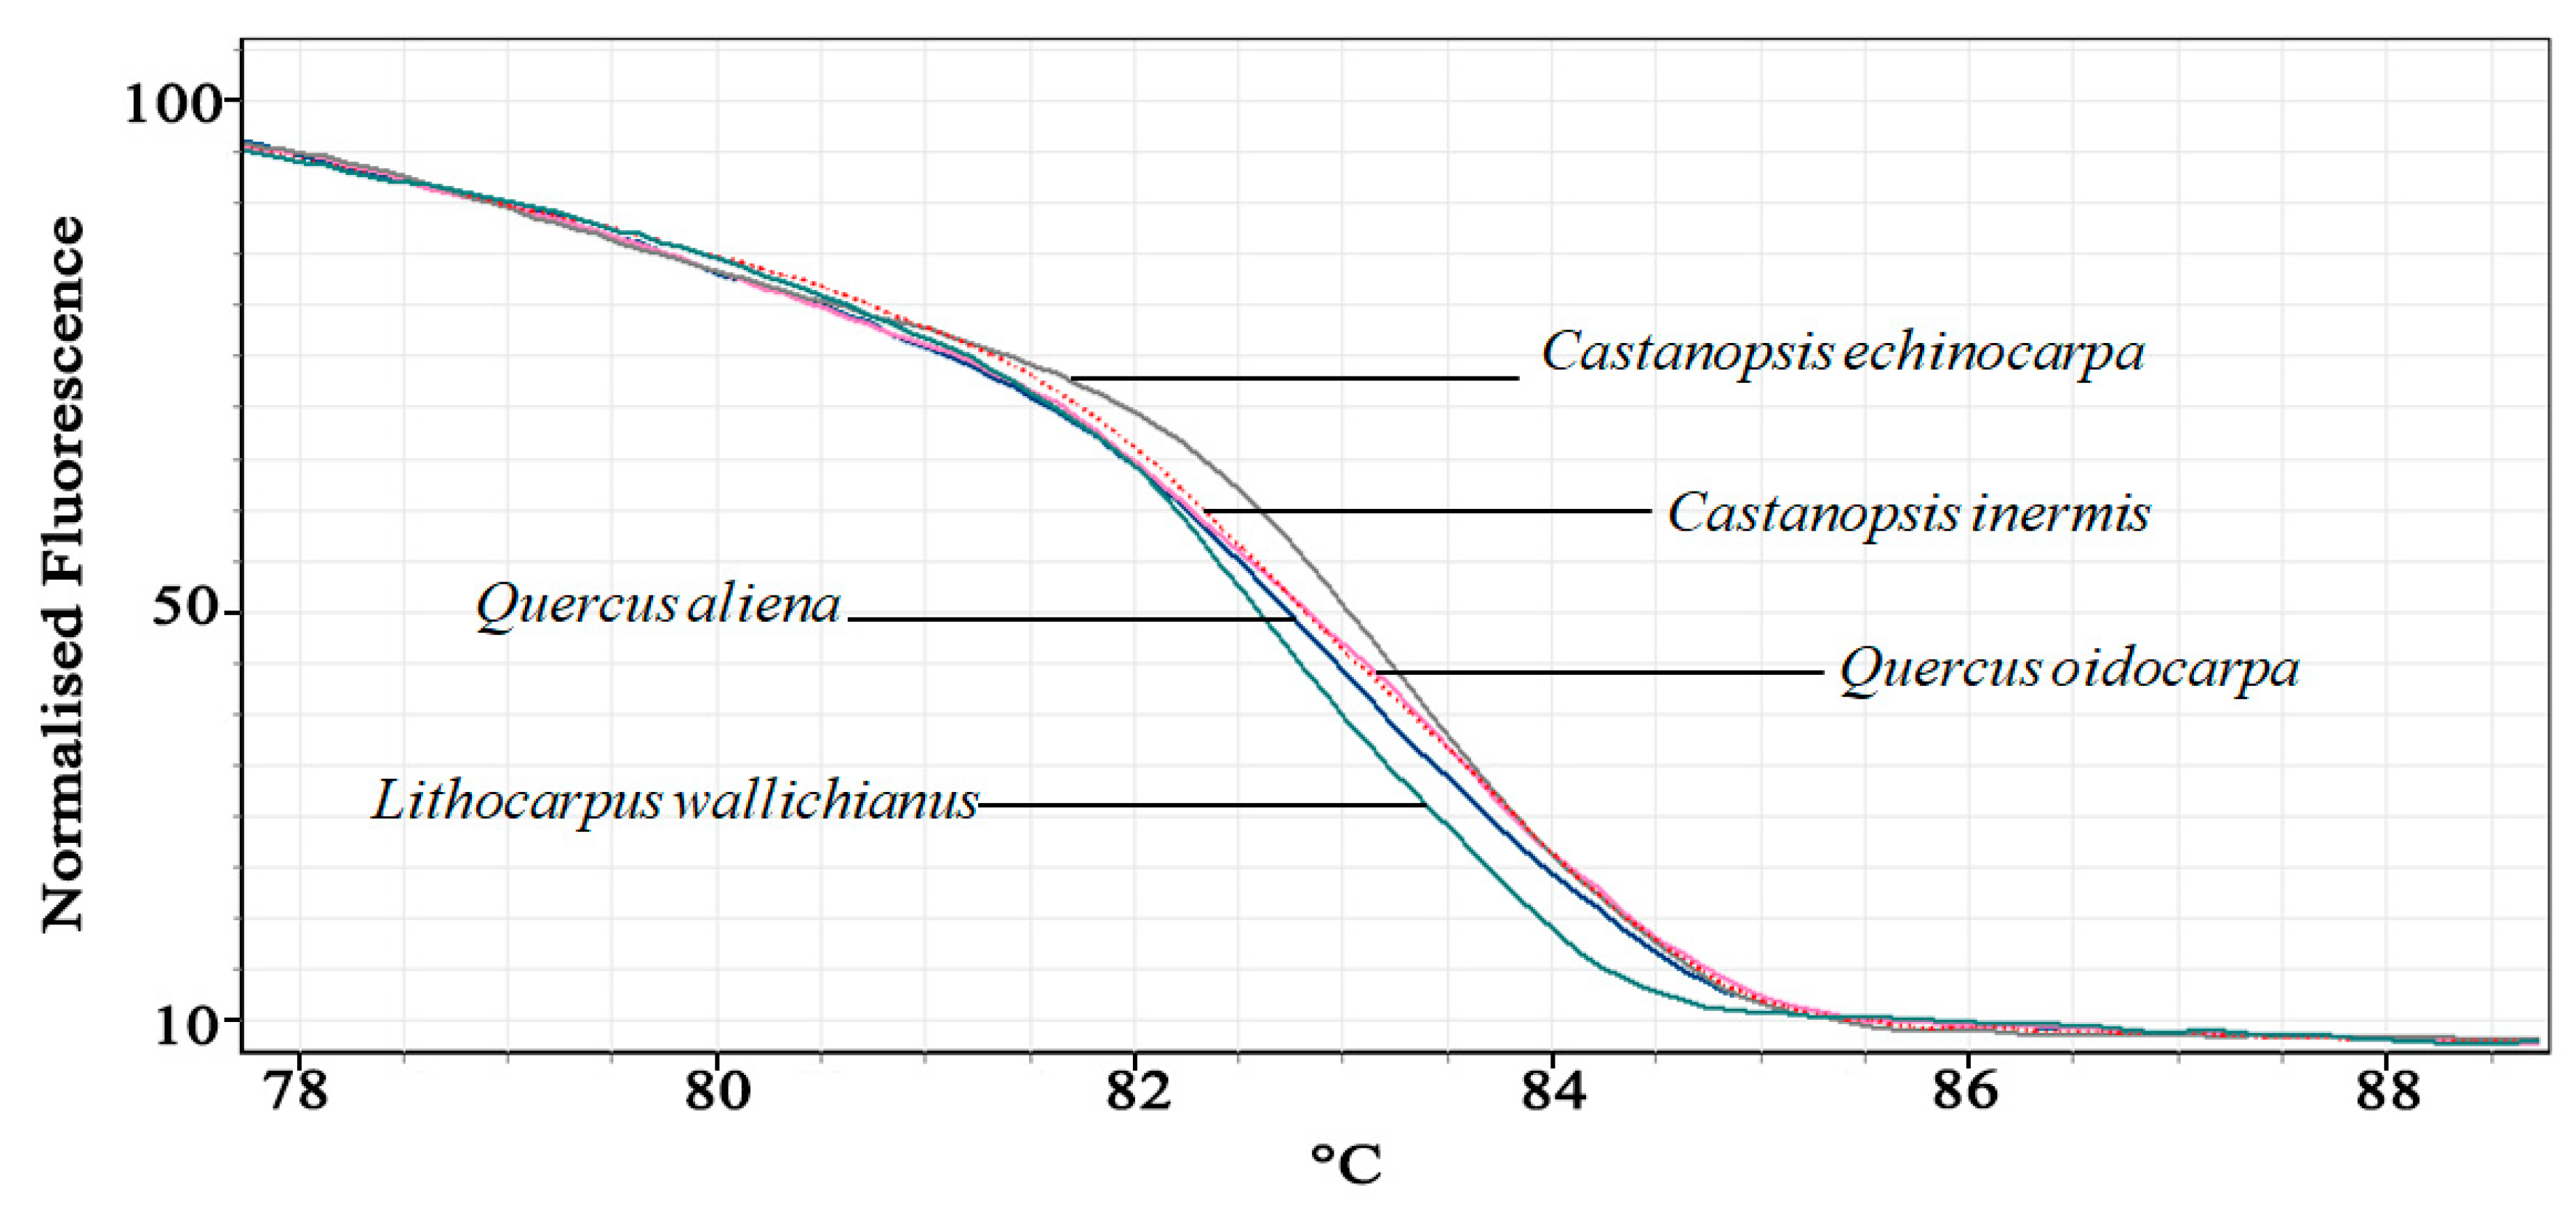
| Experiment 1 | Castanopsis echinocarpa A.DC | 25819 |
| Castanopsis inermis (Lindl. ex Wall.) Benth. & Hook.f. | 7316 | |
| Lithocarpus wallichianus (Lindl. ex Hance) Rehder | 25181 | |
| Quercus aliena Blume | 34038 | |
| Quercus oidocarpa DC. | 90636 | |
| Experiment 2 | Dipterocarpus alatus Roxb. ex G.Don | 46253 |
| Dipterocarpus intricatus Dyer | 10895 | |
| Dipterocarpus costatus C.F. Gaertn. | 10567 | |
| Dipterocarpus obtusifolius Teijsm. ex Miq. | 8889 | |
| Hopea odorata Roxb. | 28852 | |
| Hopea ferrea Laness. | 27258 | |
| Shorea roxburghii G.Don | 32238 | |
| Shorea obtusa Wall. ex Blume | 28848 | |
| Shorea siamensis Miq. | 33182 | |
| Shorea guiso Blume | 20500 |
| Primer | Length | Sequence (5′–3′) | Region | Amplicon Size (bp) |
|---|---|---|---|---|
| M1F | 22 | GGTACATGGACAACTGTGTGGA | rbcL | 149 |
| M1R | 25 | ACAGAACCTTCTTCAAAAAGGTCTA | ||
| ITS1F | 24 | GGTGAACCTGCGGAAGGATCATTG | ITS1 | 200–230 |
| ITS1R | 24 | CCGAGATATCCATTGCCGAGAGTC | ||
| ITS2F | 21 | CGCCTGCTTGGGCGTCATGGC | ITS2 | 200–230 |
| ITS2R | 22 | GGGCCTCGCCTGACTTGGGGCC |
| Programme | Primer | Variable Nucleotide | Segment |
|---|---|---|---|
| Manual | M1 | 6.0 | B |
| M2 | 2.0 | C | |
| GenScript | G1 | 3.9 | E/F |
| G2 | 7.5 | B | |
| G3 | 8.7 | D/E | |
| Primer3 | P1 | 5.5 | B |
| P2 | 5.9 | B | |
| P3 | 6.0 | B | |
| P4 | 5.9 | B/C | |
| Primer-BLAST | PB1 | 11.7 | C/D |
| PB2 | 11.9 | C/D | |
| PB3 | 4.0 | F | |
| PB4 | 12.3 | C/D | |
| PB5 | 7.6 | B/C | |
| PB6 | 8.2 | F | |
| PB7 | 8.0 | F | |
| PB8 | 9.6 | F/G | |
| PB9 | 10.4 | C/D | |
| PB10 | 7.4 | B/C | |
| PrimerQuest IDT | PQ1 | 10.5 | C/D |
| PQ2 | 9.8 | C | |
| PQ3 | 8.0 | D/E | |
| PQ4 | 7.7 | D/E | |
| PQ5 | 5.2 | E/F |
| Primer | Length | Tm (°C) | GC Content | Sequence (5′–3′) | Variable Site (%) | Group in Simulation HRM | Amplicon Size (bp) |
|---|---|---|---|---|---|---|---|
| M1F | 22 | 55.93 | 46.8 | GGTACATGGACAACTGTGTGGA | 6.0 | 3 | 149 |
| M1R | 25 | 54.25 | ACAGAACCTTCTTCAAAAAGGTCTA | ||||
| G3F | 20 | 59.04 | 44.8 | CAACCATTTATGCGTTGGAG | 2.3 | 1 | 266 |
| G3R | 20 | 59.24 | GCACGATGGATGTGAAGAAG | ||||
| P3F | 20 | 59.85 | 44.2 | GGACATGGACAACTGTGTGG | 2.0 | 3 | 200 |
| P3R | 20 | 59.89 | CAGGGCCTTGAATCCAAATA | ||||
| PB4F | 20 | 60.25 | 43.6 | AACTTTCCAAGGTCCGCCTC | 0.6 | 2 | 163 |
| PB4R | 20 | 59.83 | GGTAAAATCAAGCCCACCGC | ||||
| PQ1F | 22 | 62.00 | 42.1 | GCATCCAAGTTGAGAGGGATAA | 0.5 | 2 | 190 |
| PQ1R | 20 | 62.00 | CGGTCTCTCCAACGCATAAA |
Publisher’s Note: MDPI stays neutral with regard to jurisdictional claims in published maps and institutional affiliations. |
© 2021 by the authors. Licensee MDPI, Basel, Switzerland. This article is an open access article distributed under the terms and conditions of the Creative Commons Attribution (CC BY) license (https://creativecommons.org/licenses/by/4.0/).
Share and Cite
Osathanunkul, M.; Madesis, P. The Identification of Several Dipterocarpaceae and Fagaceae Trees by Barcode DNA Coupled with High-Resolution Melting Analysis. Forests 2021, 12, 1466. https://doi.org/10.3390/f12111466
Osathanunkul M, Madesis P. The Identification of Several Dipterocarpaceae and Fagaceae Trees by Barcode DNA Coupled with High-Resolution Melting Analysis. Forests. 2021; 12(11):1466. https://doi.org/10.3390/f12111466
Chicago/Turabian StyleOsathanunkul, Maslin, and Panagiotis Madesis. 2021. "The Identification of Several Dipterocarpaceae and Fagaceae Trees by Barcode DNA Coupled with High-Resolution Melting Analysis" Forests 12, no. 11: 1466. https://doi.org/10.3390/f12111466