
Assessing Burned Areas in Wildfires and Prescribed Fires with Spectral Indices and SAR Images in the Margalla Hills of Pakistan

 ,
, 
 ,
,  ,
, 
 and
and
Abstract
:1. Introduction
2. Materials and Methods
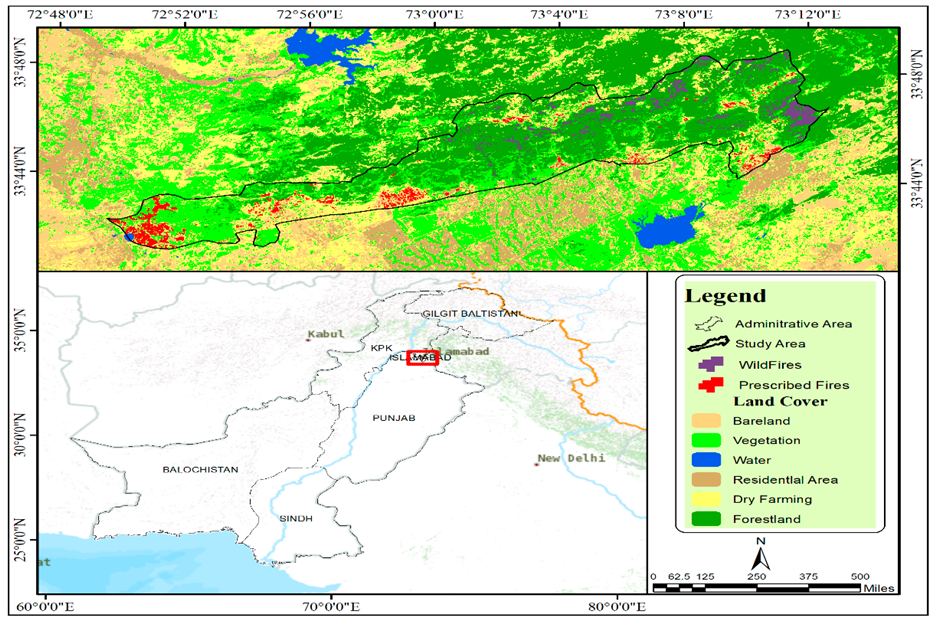
2.1. Study Area
2.2. Datasets
2.3. Sampling and Preprocessing
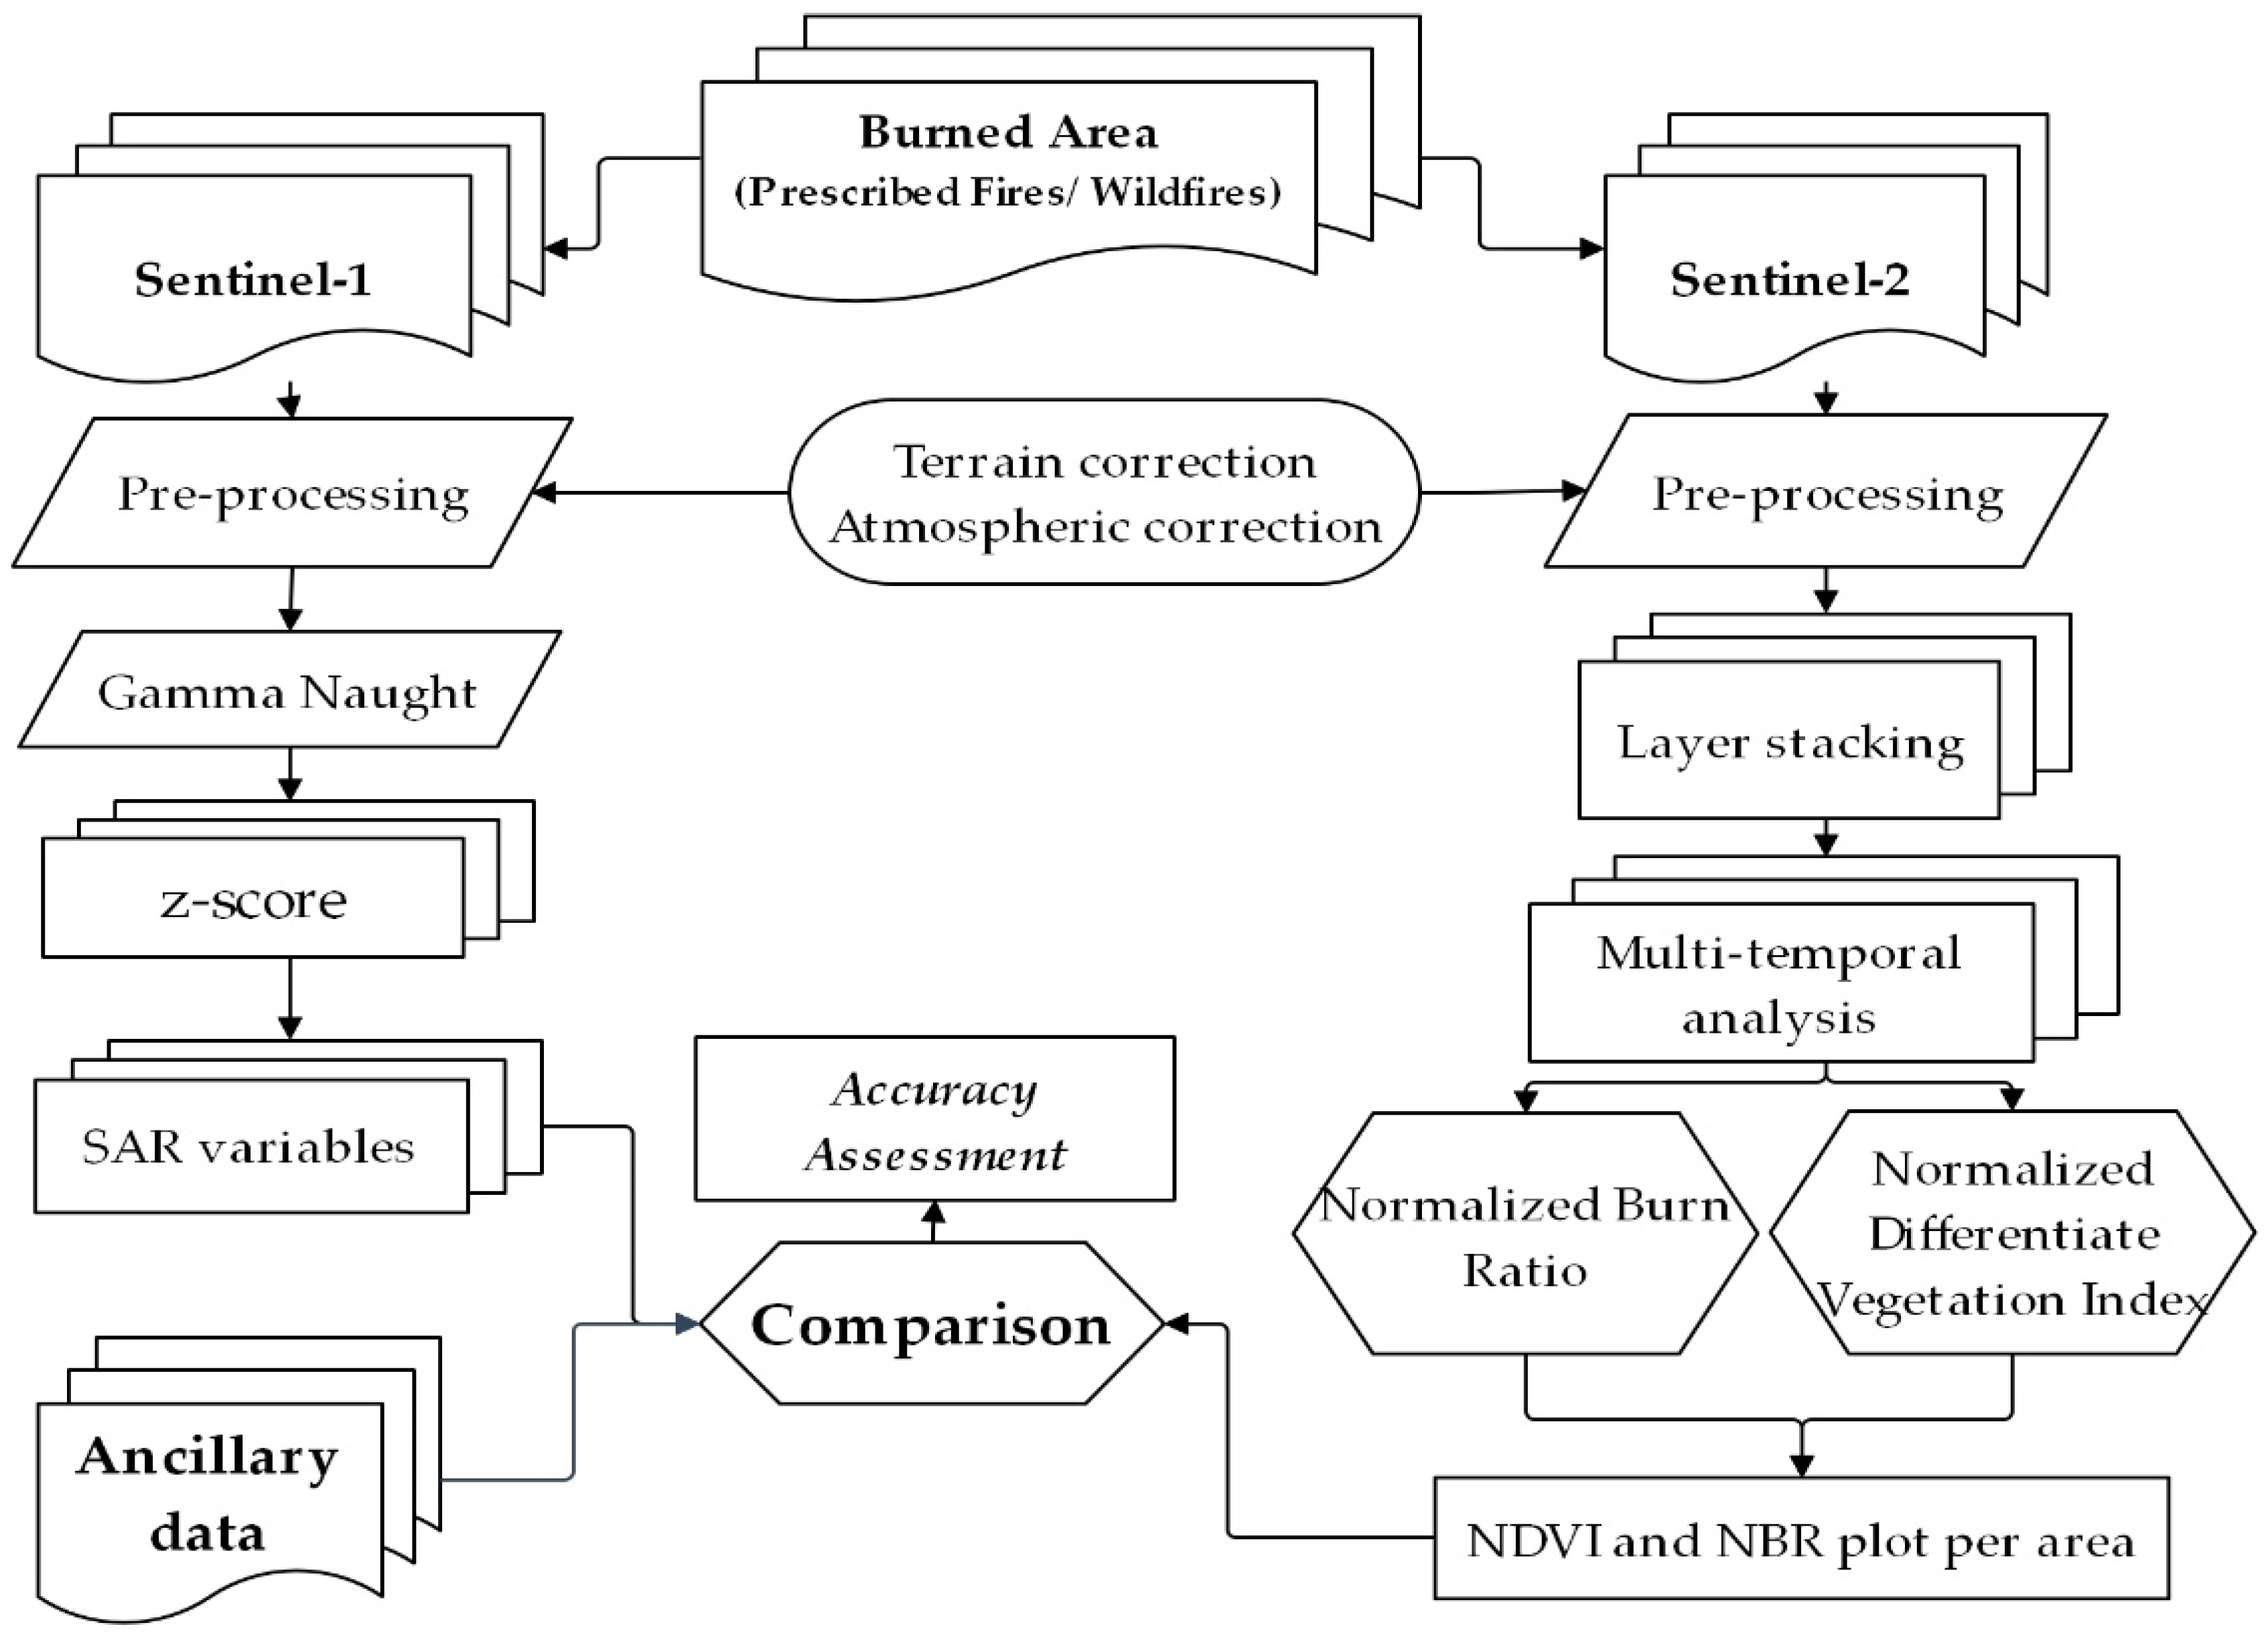
2.4. Analysis
2.4.1. Sentinel-1 Images Using GEE
2.4.2. Validation of the Spectral Indices
3. Results
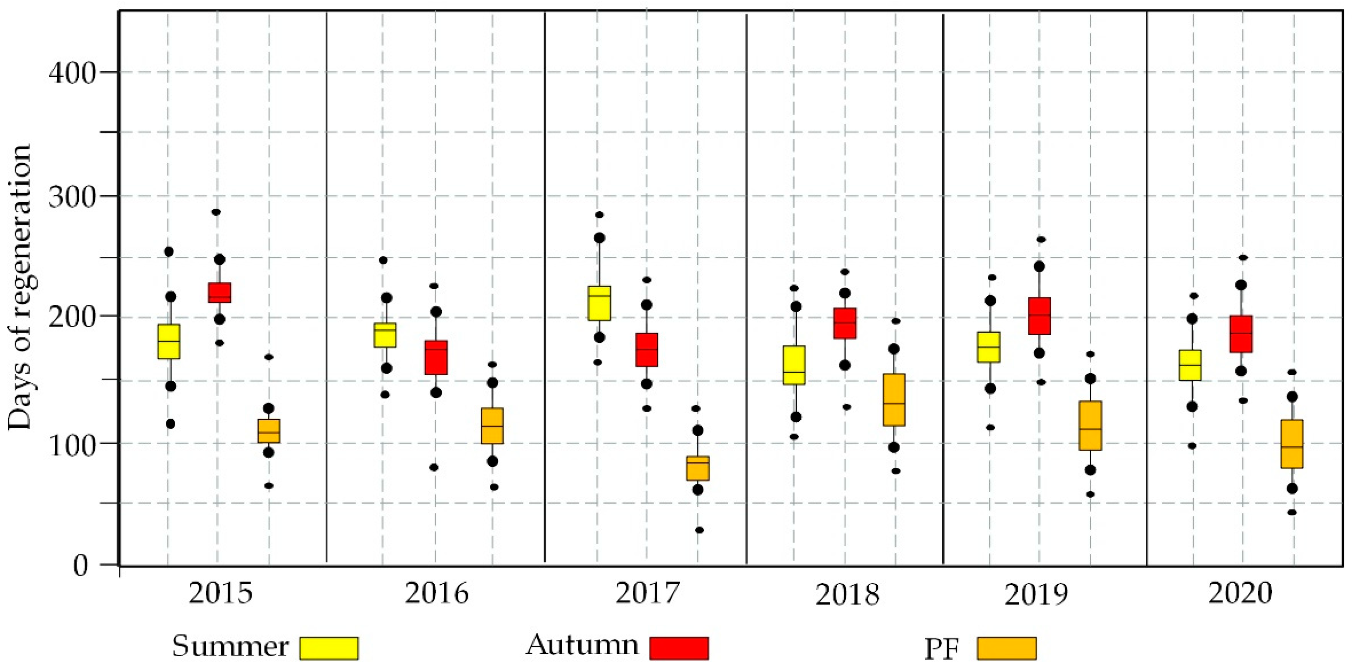
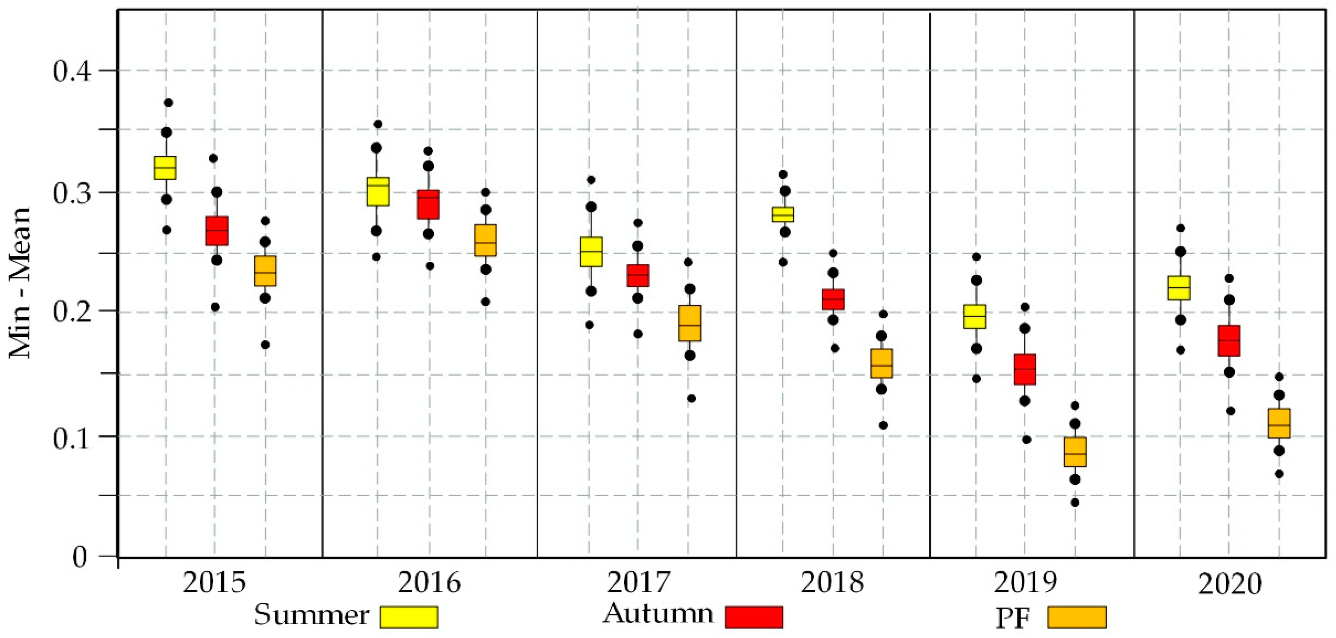
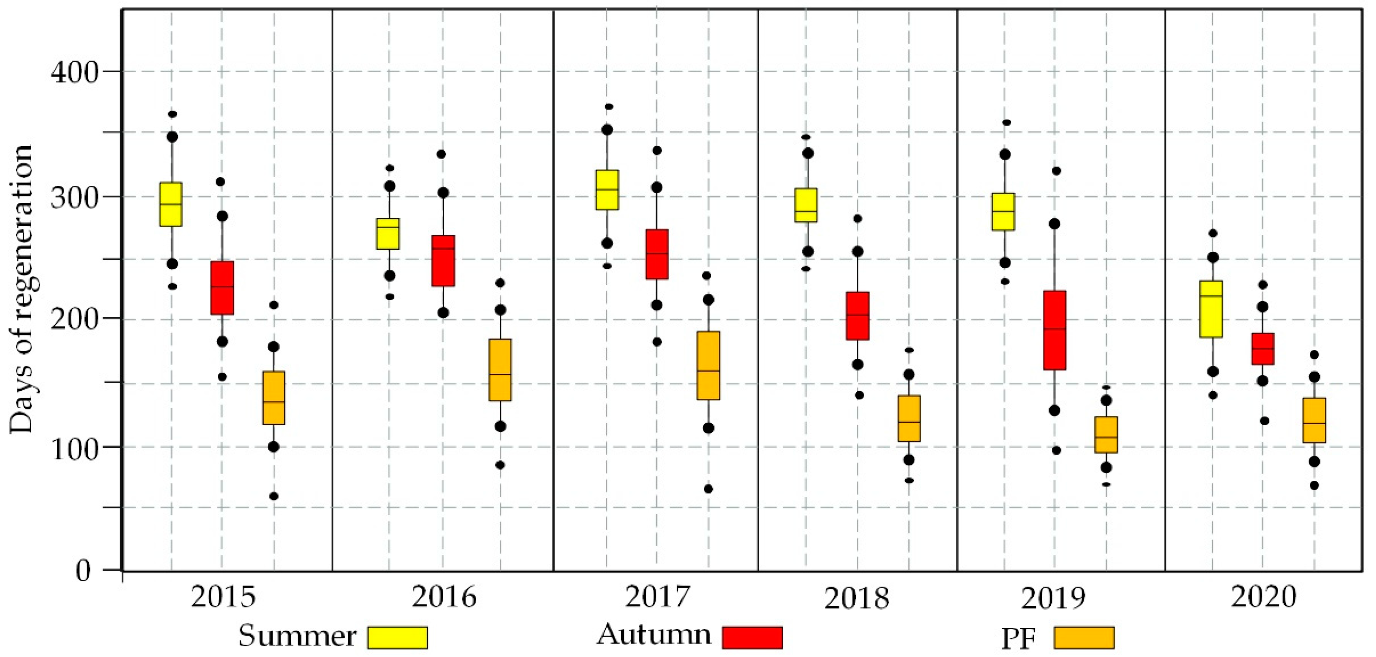
3.1. NDVI
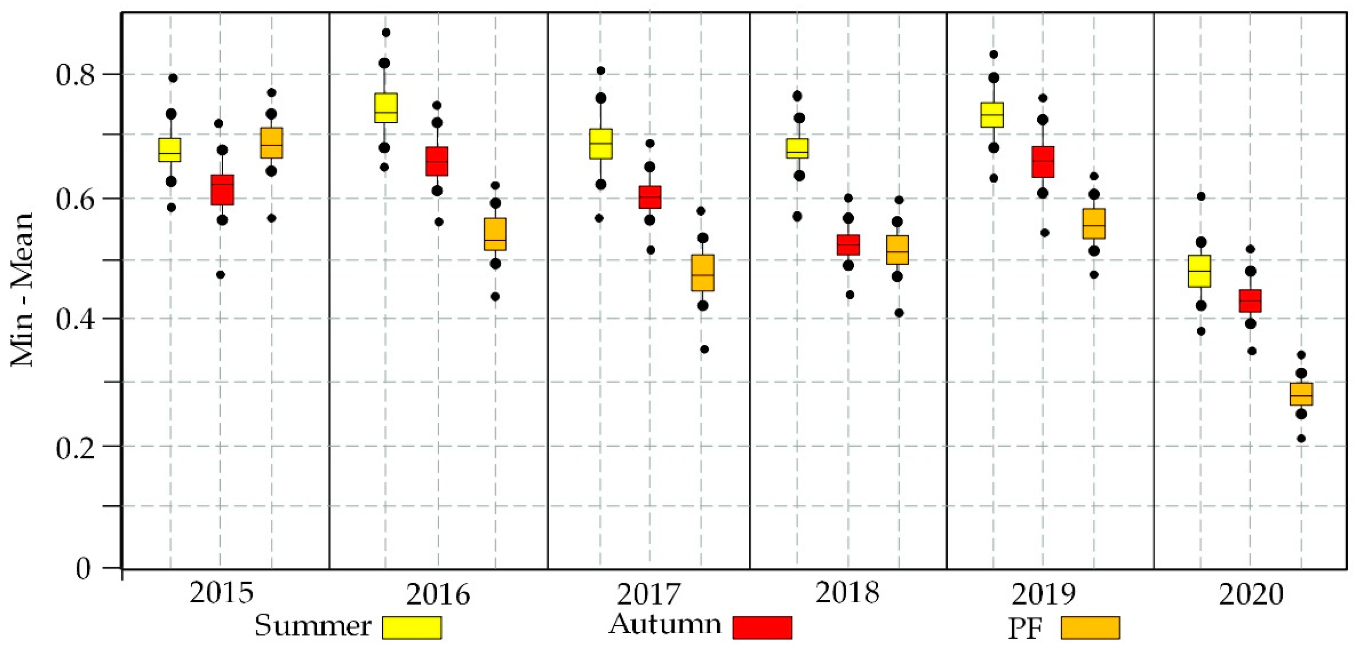
3.2. NBR
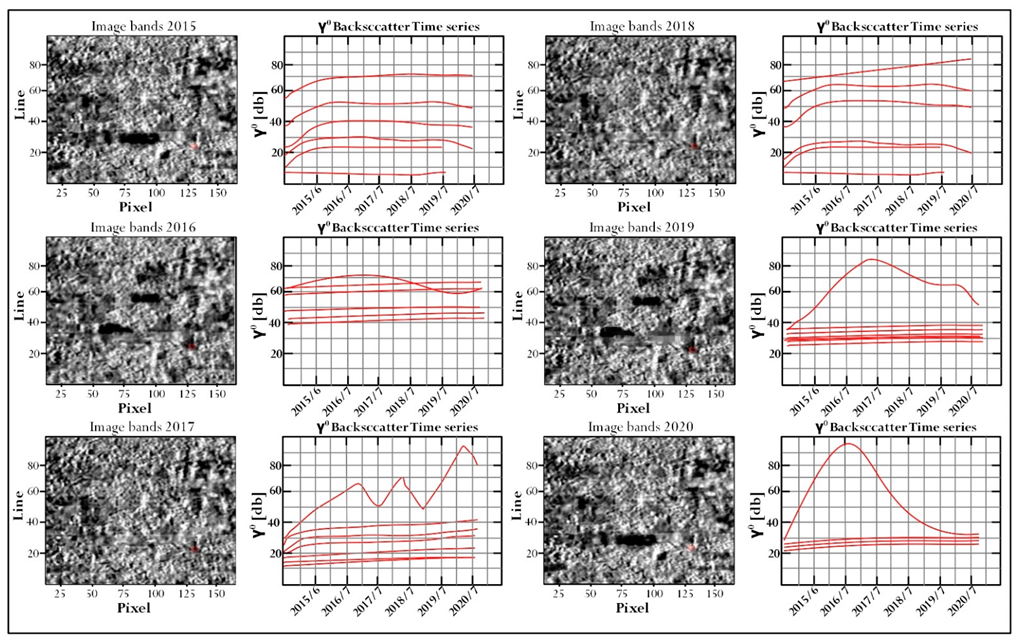
3.3. SAR
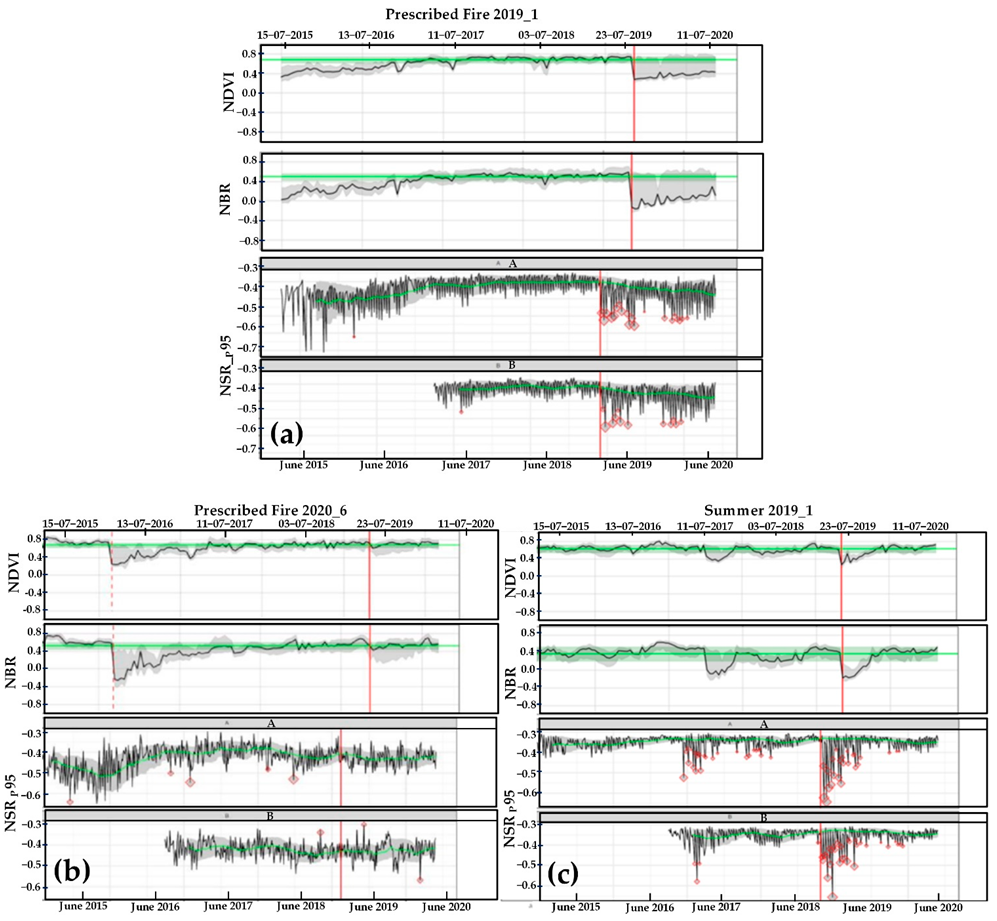
3.4. Comparison between Spectral Indices and SAR
3.5. Burned Area Comparison
4. Discussion
5. Conclusions
Author Contributions
Funding
Data Availability Statement
Acknowledgments
Conflicts of Interest
References
- Bastarrika, A.; Alvarado, M.; Artano, K.; Martinez, M.P.; Mesanza, A.; Torre, L.; Ramo, R.; Chuvieco, E. BAMS: A tool for supervised burned area mapping using landsat data. Remote Sens. 2014, 6, 12360–12380. [Google Scholar] [CrossRef] [Green Version]
- Curt, T.; Borgniet, L.; Bouillon, C. Wildfire frequency varies with the size and shape of fuel types in southeastern France: Implications for environmental management. J. Environ. Manag. 2013, 117, 150–161. [Google Scholar] [CrossRef] [Green Version]
- Tariq, A.; Shu, H.; Li, Q.; Altan, O.; Khan, M.R.; Baqa, M.F.; Lu, L. Quantitative Analysis of Forest Fires in Southeastern Australia Using SAR Data. Remote Sens. 2021, 13, 2386. [Google Scholar] [CrossRef]
- Tariq, A.; Shu, H.; Siddiqui, S.; Mousa, B.G.; Munir, I.; Nasri, A.; Waqas, H.; Lu, L.; Baqa, M.F. Forest fire monitoring using spatial-statistical and Geo-spatial analysis of factors determining forest fire in Margalla Hills, Islamabad, Pakistan. Geomat. Nat. Hazards Risk 2021, 12, 1212–1233. [Google Scholar] [CrossRef]
- Tariq, A.; Shu, H.; Siddiqui, S.; Munir, I.; Sharifi, A.; Li, Q.; Lu, L. Spatio-temporal analysis of forest fire events in the Margalla Hills, Islamabad, Pakistan using socio-economic and environmental variable data with machine learning methods. J. For. Res. 2021, 13, 12. [Google Scholar] [CrossRef]
- Baetens, L.; Desjardins, C.; Hagolle, O. Validation of Copernicus Sentinel-2 Cloud Masks Obtained from MAJA, Sen2Cor, and FMask Processors Using Reference Cloud Masks Generated with a Supervised Active Learning Procedure. Remote Sens. 2019, 11, 433. [Google Scholar] [CrossRef] [Green Version]
- Mohammadi, F.; Bavaghar, M.P.; Shabanian, N. Forest Fire Risk Zone Modeling Using Logistic Regression and GIS: An Iranian Case Study. Small-Scale For. 2014, 13, 117–125. [Google Scholar] [CrossRef]
- Erokhin, S.; Petukhov, A.; Pilyugin, P. Critical Information Infrastructures Security Modeling; IEEE: Piscataway, NJ, USA, 2019; Volume 2019-April, ISBN 9789526865386. [Google Scholar]
- Karnieli, A.; Agam, N.; Pinker, R.T.; Anderson, M.; Imhoff, M.L.; Gutman, G.G.; Panov, N.; Goldberg, A. Use of NDVI and land surface temperature for drought assessment: Merits and limitations. J. Clim. 2010, 23, 618–633. [Google Scholar] [CrossRef]
- Aronstein, B.N.; Alexander, M. Effect of a non-ionic surfactant added to the soil surface on the biodegradation of aromatic hydrocarbons within the soil. Appl. Microbiol. Biotechnol. 1993, 39, 386–390. [Google Scholar] [CrossRef]
- Kim, E.J.; Lee, S.W. Structural equation model for burn severity with topographic variables and susceptible forest cover. Sustainability 2018, 10, 2473. [Google Scholar] [CrossRef] [Green Version]
- Martinis, S.; Twele, A.; Voigt, S. Towards operational near real-time flood detection using a split-based automatic thresholding procedure on high resolution TerraSAR-X data. Nat. Hazards Earth Syst. Sci. 2009, 9, 303–314. [Google Scholar] [CrossRef]
- Solano, F.; Di Fazio, S.; Modica, G. A methodology based on GEOBIA and WorldView-3 imagery to derive vegetation indices at tree crown detail in olive orchards. Int. J. Appl. Earth Obs. Geoinf. 2019, 83, 101912. [Google Scholar] [CrossRef]
- Giglio, L.; Loboda, T.; Roy, D.P.; Quayle, B.; Justice, C.O. An active-fire based burned area mapping algorithm for the MODIS sensor. Remote Sens. Environ. 2009, 113, 408–420. [Google Scholar] [CrossRef]
- Polychronaki, A.; Gitas, I.Z.; Veraverbeke, S.; Debien, A. Evaluation of ALOS PALSAR imagery for burned area mapping in greece using object-based classification. Remote Sens. 2013, 5, 5680–5701. [Google Scholar] [CrossRef] [Green Version]
- Boschetti, L.; Roy, D.P.; Justice, C.O.; Humber, M.L. MODIS-Landsat fusion for large area 30m burned area mapping. Remote Sens. Environ. 2015, 161, 27–42. [Google Scholar] [CrossRef]
- Akagi, S.K.; Yokelson, R.J.; Wiedinmyer, C.; Alvarado, M.J.; Reid, J.S.; Karl, T.; Crounse, J.D.; Wennberg, P.O. Emission factors for open and domestic biomass burning for use in atmospheric models. Atmos. Chem. Phys. 2011, 11, 4039–4072. [Google Scholar] [CrossRef] [Green Version]
- Escuin, S.; Navarro, R.; Fernández, P. Fire severity assessment by using NBR (Normalized Burn Ratio) and NDVI (Normalized Difference Vegetation Index) derived from LANDSAT TM/ETM images. Int. J. Remote Sens. 2008, 29, 1053–1073. [Google Scholar] [CrossRef]
- Jenkins, M.; Collins, L.; Price, O.; Penman, T.; Zylstra, P.; Horsey, B.; Bradstock, R. Environmental values and fire hazard of eucalypt plantings. Ecosphere 2016, 7, e01528. [Google Scholar] [CrossRef] [Green Version]
- Li, W. Mapping urban impervious surfaces by using spectral mixture analysis and spectral indices. Remote Sens. 2020, 12, 94. [Google Scholar] [CrossRef] [Green Version]
- Whittaker, J.; Mercer, D. The Victorian bushfires of 2002-03 and the politics of blame: A discourse analysis. Aust. Geogr. 2004, 35, 259–287. [Google Scholar] [CrossRef]
- Zhang, P.; Nascetti, A.; Ban, Y.; Gong, M. An implicit radar convolutional burn index for burnt area mapping with Sentinel-1 C-band SAR data. ISPRS J. Photogramm. Remote Sens. 2019, 158, 50–62. [Google Scholar] [CrossRef]
- Xu, F.; Wang, H.; Jin, Y.-Q.; Liu, X.; Wang, R.; Deng, Y. Impact of cross-polarization isolation on polarimetric target decomposition and target detection. Radio Sci. 2015, 50, 327–338. [Google Scholar] [CrossRef]
- Axel, A.C. Burned area mapping of an escaped fire into tropical dry forest in Western Madagascar using multi-season Landsat OLI Data. Remote Sens. 2018, 10, 371. [Google Scholar] [CrossRef] [Green Version]
- Pal, S.; Ziaul, S. Detection of land use and land cover change and land surface temperature in English Bazar urban centre. Egypt. J. Remote Sens. Sp. Sci. 2017, 20, 125–145. [Google Scholar] [CrossRef] [Green Version]
- Chu, T.; Guo, X. Remote sensing techniques in monitoring post-fire effects and patterns of forest recovery in boreal forest regions: A review. Remote Sens. 2013, 6, 470–520. [Google Scholar] [CrossRef] [Green Version]
- Rücker, G.; Siegert, F. Burn Scar Mapping and Fire Damage Assessment Using Ers-2 Sar Images in East Kalimantan, Indonesia. Int. Arch. Photogramm. Remote Sens. 2000, 33, 1286–1293. [Google Scholar]
- Ahmad, A.; Ahmad, S.R.; Gilani, H.; Tariq, A.; Zhao, N.; Aslam, R.W.; Mumtaz, F. A Synthesis of Spatial Forest Assessment Studies Using Remote Sensing Data and Techniques in Pakistan. Forests 2021, 12, 1211. [Google Scholar] [CrossRef]
- Schroeder, W.; Oliva, P.; Giglio, L.; Quayle, B.; Lorenz, E.; Morelli, F. Active fire detection using Landsat-8/OLI data. Remote Sens. Environ. 2016, 185, 210–220. [Google Scholar] [CrossRef] [Green Version]
- Khalid, N.; Saeed Ahmad, S. Monitoring Forest Cover Change of Margalla Hills Over a Period of Two Decades (1992-2011): A Spatiotemporal Perspective. J. Ecosyst. Ecography 2015, 6, 174–181. [Google Scholar] [CrossRef]
- Shinwari, M.I.; Khan, M.A. Vegetation Comparison of Sacred, Reserved and Unreserved Sites of Rumli Village at Margalla Hills National Park, Islamabad. Pakistan J. Biol. Sci. 2000, 3, 1681–1683. [Google Scholar] [CrossRef] [Green Version]
- Tariq, A.; Shu, H.; Siddiqui, S.; Imran, M.; Farhan, M. Monitoring Land Use And Land Cover Changes Using Geospatial Techniques, A Case Study Of Fateh Jang, Attock, Pakistan. Geogr. Environ. Sustain. 2021, 14, 41–52. [Google Scholar] [CrossRef]
- Tariq, A.; Shu, H. CA-Markov chain analysis of seasonal land surface temperature and land use landcover change using optical multi-temporal satellite data of Faisalabad, Pakistan. Remote Sens. 2020, 12, 3402. [Google Scholar] [CrossRef]
- Collen, B.; Kock, R.; Heinrich, M.; Smith, L.; Mace, G. Biodiversity and ecosystems. In Thinking Beyond Sectors for Sustainable Development; Ubiquity Press: London, UK, 2015; pp. 3–10. ISBN 9280721127. [Google Scholar]
- Brooks, M.; Lusk, M. (Eds.) Fire Management and Invasive Plants; US Department of the Interior: Arlington VA, USA, 2008.
- Iqbal, M.F.; Riaz Khan, M.; Malik, A.H. Land use change detection in the limestone exploitation area of Margalla Hills National Park (MHNP), Islamabad, Pakistan using geo-spatial techniques. J. Himal. Earth Sci. 2013, 46, 89–98. [Google Scholar]
- Sowter, A.; Bin Che Amat, M.; Cigna, F.; Marsh, S.; Athab, A.; Alshammari, L. Mexico City land subsidence in 2014–2015 with Sentinel-1 IW TOPS: Results using the Intermittent SBAS (ISBAS) technique. Int. J. Appl. Earth Obs. Geoinf. 2016, 52, 230–242. [Google Scholar] [CrossRef]
- Schepers, L.; Haest, B.; Veraverbeke, S.; Spanhove, T.; Borre, J.V.; Goossens, R. Burned Area Detection and Burn Severity Assessment of a Heathland Fire in Belgium Using Airborne Imaging Spectroscopy (APEX). Remote. Sens. 2014, 6, 1803–1826. [Google Scholar] [CrossRef] [Green Version]
- Belenguer-Plomer, M.A.; Tanase, M.A.; Fernandez-Carrillo, A.; Chuvieco, E. Burned area detection and mapping using Sentinel-1 backscatter coefficient and thermal anomalies. Remote Sens. Environ. 2019, 233, 111345. [Google Scholar] [CrossRef]
- Frey, O.; Santoro, M.; Werner, C.L.; Wegmüller, U. DEM-based SAR pixel-area estimation for enhanced geocoding refinement and radiometric Normalization. IEEE Geosci. Remote Sens. Lett. 2013, 10, 48–52. [Google Scholar] [CrossRef]
- Tarimo, J.A.; Madoffe, S.S.; Bakke, A. The effect of fire on the diversity and abundance of wood-living beetles in a miombo woodland, tanzania. South. African For. J. 2000, 187, 51–57. [Google Scholar] [CrossRef]
- Uwe, M.-W.; Jerome, L.; Rudolf, R.; Ferran, G.; Marc, N. Sentinel-2 Level 2a Prototype Processor: Architecture, Algorithms and First Results. In Proceedings of the European Space Agency Living Planet Symposium, Edinburgh, UK, 9–13 September 13; pp. 3–10.
- Oduro, K.A.; Mohren, G.M.J.; Peña-Claros, M.; Kyereh, B.; Arts, B. Tracing forest resource development in Ghana through forest transition pathways. Land Use Policy 2015, 48, 63–72. [Google Scholar] [CrossRef]
- Hassani, B.; Sahebi, M.R.; Asiyabi, R.M. Oil Spill Four-Class Classification Using UAVSAR Polarimetric Data. Ocean Sci. J. 2020, 55, 433–443. [Google Scholar] [CrossRef]
- Zhu, X.X.; Tuia, D.; Mou, L.; Xia, G.-S.; Zhang, L.; Xu, F.; Fraundorfer, F. Deep Learning in Remote Sensing: A Comprehensive Review and List of Resources. IEEE Geosci. Remote Sens. Mag. 2017, 5, 8–36. [Google Scholar] [CrossRef] [Green Version]
- Tansey, K. Vegetation burning in the year 2000: Global burned area estimates from SPOT VEGETATION data. J. Geophys. Res. 2004, 109, D14S03. [Google Scholar] [CrossRef] [Green Version]
- Jagdhuber, T.; Stockamp, J.; Hajnsek, I.; Ludwig, R. Identification of Soil Freezing and Thawing States Using SAR Polarimetry at C-Band. Remote Sens. 2014, 6, 2008–2023. [Google Scholar] [CrossRef] [Green Version]
- Stroppiana, D.; Calò, F.; Imperatore, P.; Pepe, A.; Boschetti, L.; Brivio, P.A.; Lanari, R. Integration of Sentinel-1 and Sentinel-2 images for detecting burned vegetation in California. In Proceedings of the 11th EARSeL Forest Fires SIG Workshop, New Trends in Forest Fire Research Incorporating Big Data and Climate Change Modeling, Chania, Greece, 25–27 September 2017; pp. 25–28. [Google Scholar]
- Stroppiana, D.; Bordogna, G.; Carrara, P.; Boschetti, M.; Boschetti, L.; Brivio, P.A. A method for extracting burned areas from Landsat TM/ETM+ images by soft aggregation of multiple Spectral Indices and a region growing algorithm. ISPRS J. Photogramm. Remote Sens. 2012, 69, 88–102. [Google Scholar] [CrossRef]
- Tariq, A.; Riaz, I.; Ahmad, Z. Land surface temperature relation with normalized satellite indices for the estimation of spatio-temporal trends in temperature among various land use land cover classes of an arid Potohar region using Landsat data. Environ. Earth Sci. 2020, 79, 40. [Google Scholar] [CrossRef]


| Sentinel-1 | Sentinel-2 | ||
|---|---|---|---|
| Polygon Name | Number of Pixel | Polygon Name | Number of Pixels |
| Summer_18_1 | 1294 | Summer_18_1 | 1294 |
| Summer_19_1 | 518 | Summer_19_6 | 1929 |
| Summer_19_3 | 1930 | Summer_19_12 | 516 |
| PF_18_1 | 158 | PF_18_1 | 152 |
| PF_18_6 | 223 | PF_18_6 | 220 |
| PF_18_12 | 1178 | PF_18_12 | 1160 |
| PF_19_1 | 580 | PF_19_1 | 581 |
| Autumn _18_2 | 27 | Autumn _18_2 | 33 |
| Autumn _19_1 | 39 | Autumn _19_1 | 48 |
| Autumn _20_6 | 46 | Autumn _20_6 | 58 |
| Name of Variables | Explanation |
|---|---|
| VH_p5; VH_p20; VH_p40; VH_p60; VH_p80; VH_p95 | VH polarization over various percentiles taken directly from the Sentinel-1 database in GEE |
| VH Range_p80p20; VH Range_p95p5 | Inter-percentile ranges over VH polarization |
| VV_p5; VV_p20; VV_p40; VV_p60; VV_p80; VV_p95 | VV polarization over the six percentiles taken directly from the Sentinel-1 database in GEE |
| VVdivVH_p5; VVdivVH_p20; VVdivVH_p40; VVdivVH_p60; VVdivVH_p80; VVdivVH_p95 | RATIO over the six percentiles |
| VVminusVH_p5; VVminusVH_p20; VVminusVH_p40; VVminusVH_p60; VVminusVH_p80; VVminusVH_p95 | DIFF over the six percentiles |
| VVnormDiffVH_p5; VVnormDiffVH_p20; VVnormDiffVH_p40; VVnormDiffVH_p60; VVnormDiffVH_p80; VVnormDiffVH_p95 | NSR over the six percentiles |
| VVRange_p80p20; VVRange_p95p5 | Inter-percentile ranges over VV polarization |
| Samples | Regeneration | Before Fire | After Fire | (Min–Mean) | |||
|---|---|---|---|---|---|---|---|
| No of Days | Dates | Mean | SD | Mean | SD | ||
| Summer_18_1 | 48 | 2018/05/02 | 0.554 | 0.057 | 0.339 | 0.025 | 0.215 |
| Summer_19_3 | 93 | 2019/05/06 | 0.570 | 0.073 | 0.363 | 0.026 | 0.207 |
| Summer_19_1 | 163 | 2019/07/12 | 0.712 | 0.075 | 0.335 | 0.023 | 0.377 |
| PF_18_1 | 34 | 2018/07/20 | 0.681 | 0.065 | 0.275 | 0.021 | 0.406 |
| PF_18_6 | 432 | 2018/05/14 | 0.657 | 0.082 | 0.470 | 0.031 | 0.187 |
| PF_18_12 | 152 | 2018/05/18 | 0.611 | 0.056 | 0.303 | 0.020 | 0.308 |
| PF_19_1 | 247 | 2019/07/20 | 0.705 | 0.070 | 0.389 | 0.027 | 0.316 |
| Autumn _18_2 | 135 | 2018/10/14 | 0.657 | 0.045 | 0.393 | 0.027 | 0.264 |
| Autumn _19_1 | 69 | 2019/11/13 | 0.698 | 0.059 | 0.355 | 0.026 | 0.343 |
| Autumn _20_6 | 66 | 2020/10/04 | 0.739 | 0.041 | 0.418 | 0.028 | 0.321 |
| Samples | Regeneration | Before Fire | After Fire | (Min–Mean) | |||
|---|---|---|---|---|---|---|---|
| No of Days | Dates | Mean | SD | Mean | SD | ||
| Summer_18_1 | 130 | 2018/05/01 | 0.508 | 0.098 | −0.143 | 0.12 | 0.651 |
| Summer_19_3 | 129 | 2019/05/08 | 0.581 | 0.061 | −0.322 | 0.23 | 0.903 |
| Summer_19_1 | 62 | 2019/07/18 | 0.437 | 0.083 | −0.158 | 0.13 | 0.595 |
| PF_18_1 | 34 | 2018/07/26 | 0.336 | 0.127 | −0.205 | 0.15 | 0.541 |
| PF_18_6 | 55 | 2018/05/03 | 0.350 | 0.154 | −0.125 | 0.11 | 0.475 |
| PF_18_12 | 87 | 2018/05/28 | 0.534 | 0.079 | −0.225 | 0.16 | 0.759 |
| PF_19_1 | 49 | 2019/07/29 | 0.494 | 0.066 | −0.167 | 0.17 | 0.661 |
| Autumn _18_2 | 15 | 2018/10/06 | 0.511 | 0.061 | 0.185 | 0.18 | 0.326 |
| Autumn _19_1 | 24 | 2019/11/11 | 0.390 | 0.071 | −0.206 | 0.19 | 0.596 |
| Autumn _20_6 | 111 | 2020/10/15 | 0.518 | 0.075 | −0.196 | 0.18 | 0.714 |
| NBR-S1 | dNBR-S1 | NBR-S2 | dNBR-S2 | NBR-FD | dNBR-FD | |
|---|---|---|---|---|---|---|
| NBR-S1 | 1.0000 | 0.0735 | 0.8651 | 0.8325 | 0.0536 | 0.0825 |
| dNBR-S1 | 0.0735 | 1.0000 | 0.8932 | 0.6231 | 0.0725 | 0.0539 |
| NBR-S2 | 0.8651 | 0.8932 | 1.0000 | 0.0421 | 0.0852 | 0.0759 |
| dNBR-S2 | 0.8325 | 0.6231 | 0.0421 | 1.0000 | 0.0425 | 0.0679 |
| NBR-FD | 0.0536 | 0.0725 | 0.0852 | 0.0425 | 1.0000 | 0.6481 |
| dNBR-FD | 0.0825 | 0.0539 | 0.0759 | 0.0679 | 0.6481 | 1.0000 |
Publisher’s Note: MDPI stays neutral with regard to jurisdictional claims in published maps and institutional affiliations. |
© 2021 by the authors. Licensee MDPI, Basel, Switzerland. This article is an open access article distributed under the terms and conditions of the Creative Commons Attribution (CC BY) license (https://creativecommons.org/licenses/by/4.0/).
Share and Cite
Tariq, A.; Shu, H.; Gagnon, A.S.; Li, Q.; Mumtaz, F.; Hysa, A.; Siddique, M.A.; Munir, I. Assessing Burned Areas in Wildfires and Prescribed Fires with Spectral Indices and SAR Images in the Margalla Hills of Pakistan. Forests 2021, 12, 1371. https://doi.org/10.3390/f12101371
Tariq A, Shu H, Gagnon AS, Li Q, Mumtaz F, Hysa A, Siddique MA, Munir I. Assessing Burned Areas in Wildfires and Prescribed Fires with Spectral Indices and SAR Images in the Margalla Hills of Pakistan. Forests. 2021; 12(10):1371. https://doi.org/10.3390/f12101371
Chicago/Turabian StyleTariq, Aqil, Hong Shu, Alexandre S. Gagnon, Qingting Li, Faisal Mumtaz, Artan Hysa, Muhammad Amir Siddique, and Iqra Munir. 2021. "Assessing Burned Areas in Wildfires and Prescribed Fires with Spectral Indices and SAR Images in the Margalla Hills of Pakistan" Forests 12, no. 10: 1371. https://doi.org/10.3390/f12101371