Non-Native Earthworms Invade Forest Soils in Northern Maine, USA


Abstract
:1. Introduction
2. Materials and Methods
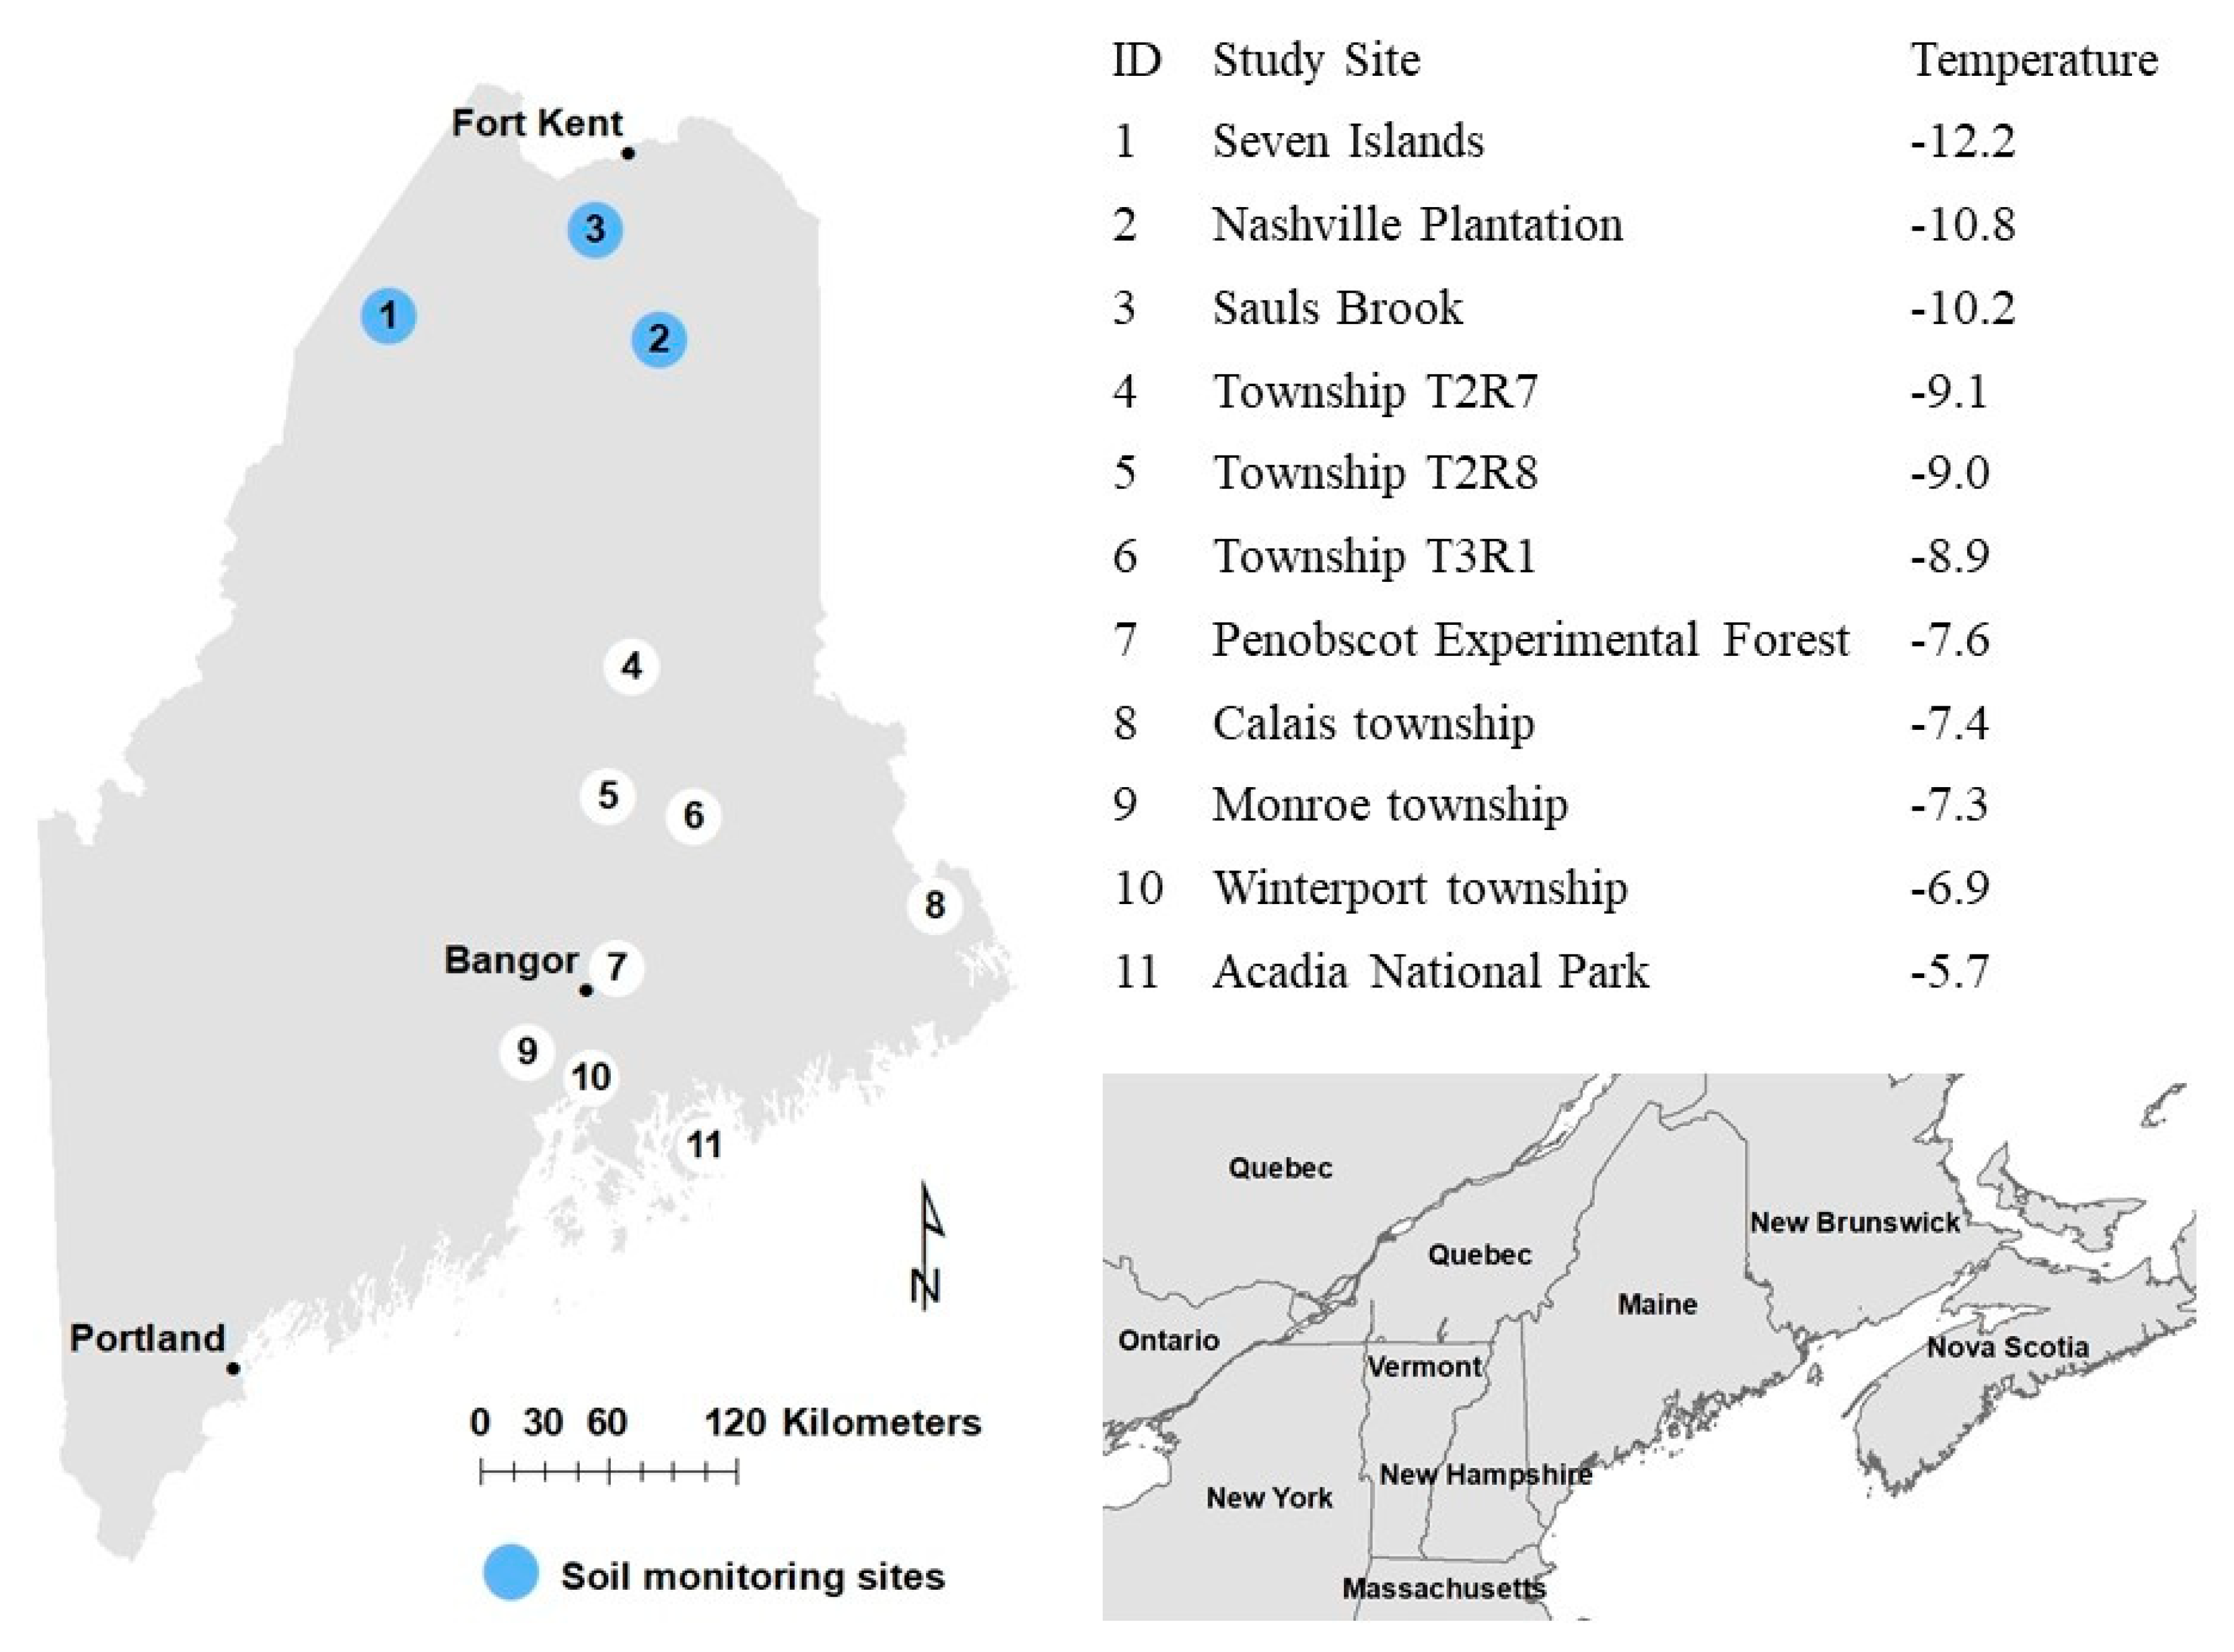
2.1. Study System
2.2. Data Collection
2.3. Laboratory Analyses
2.4. Data Analyses
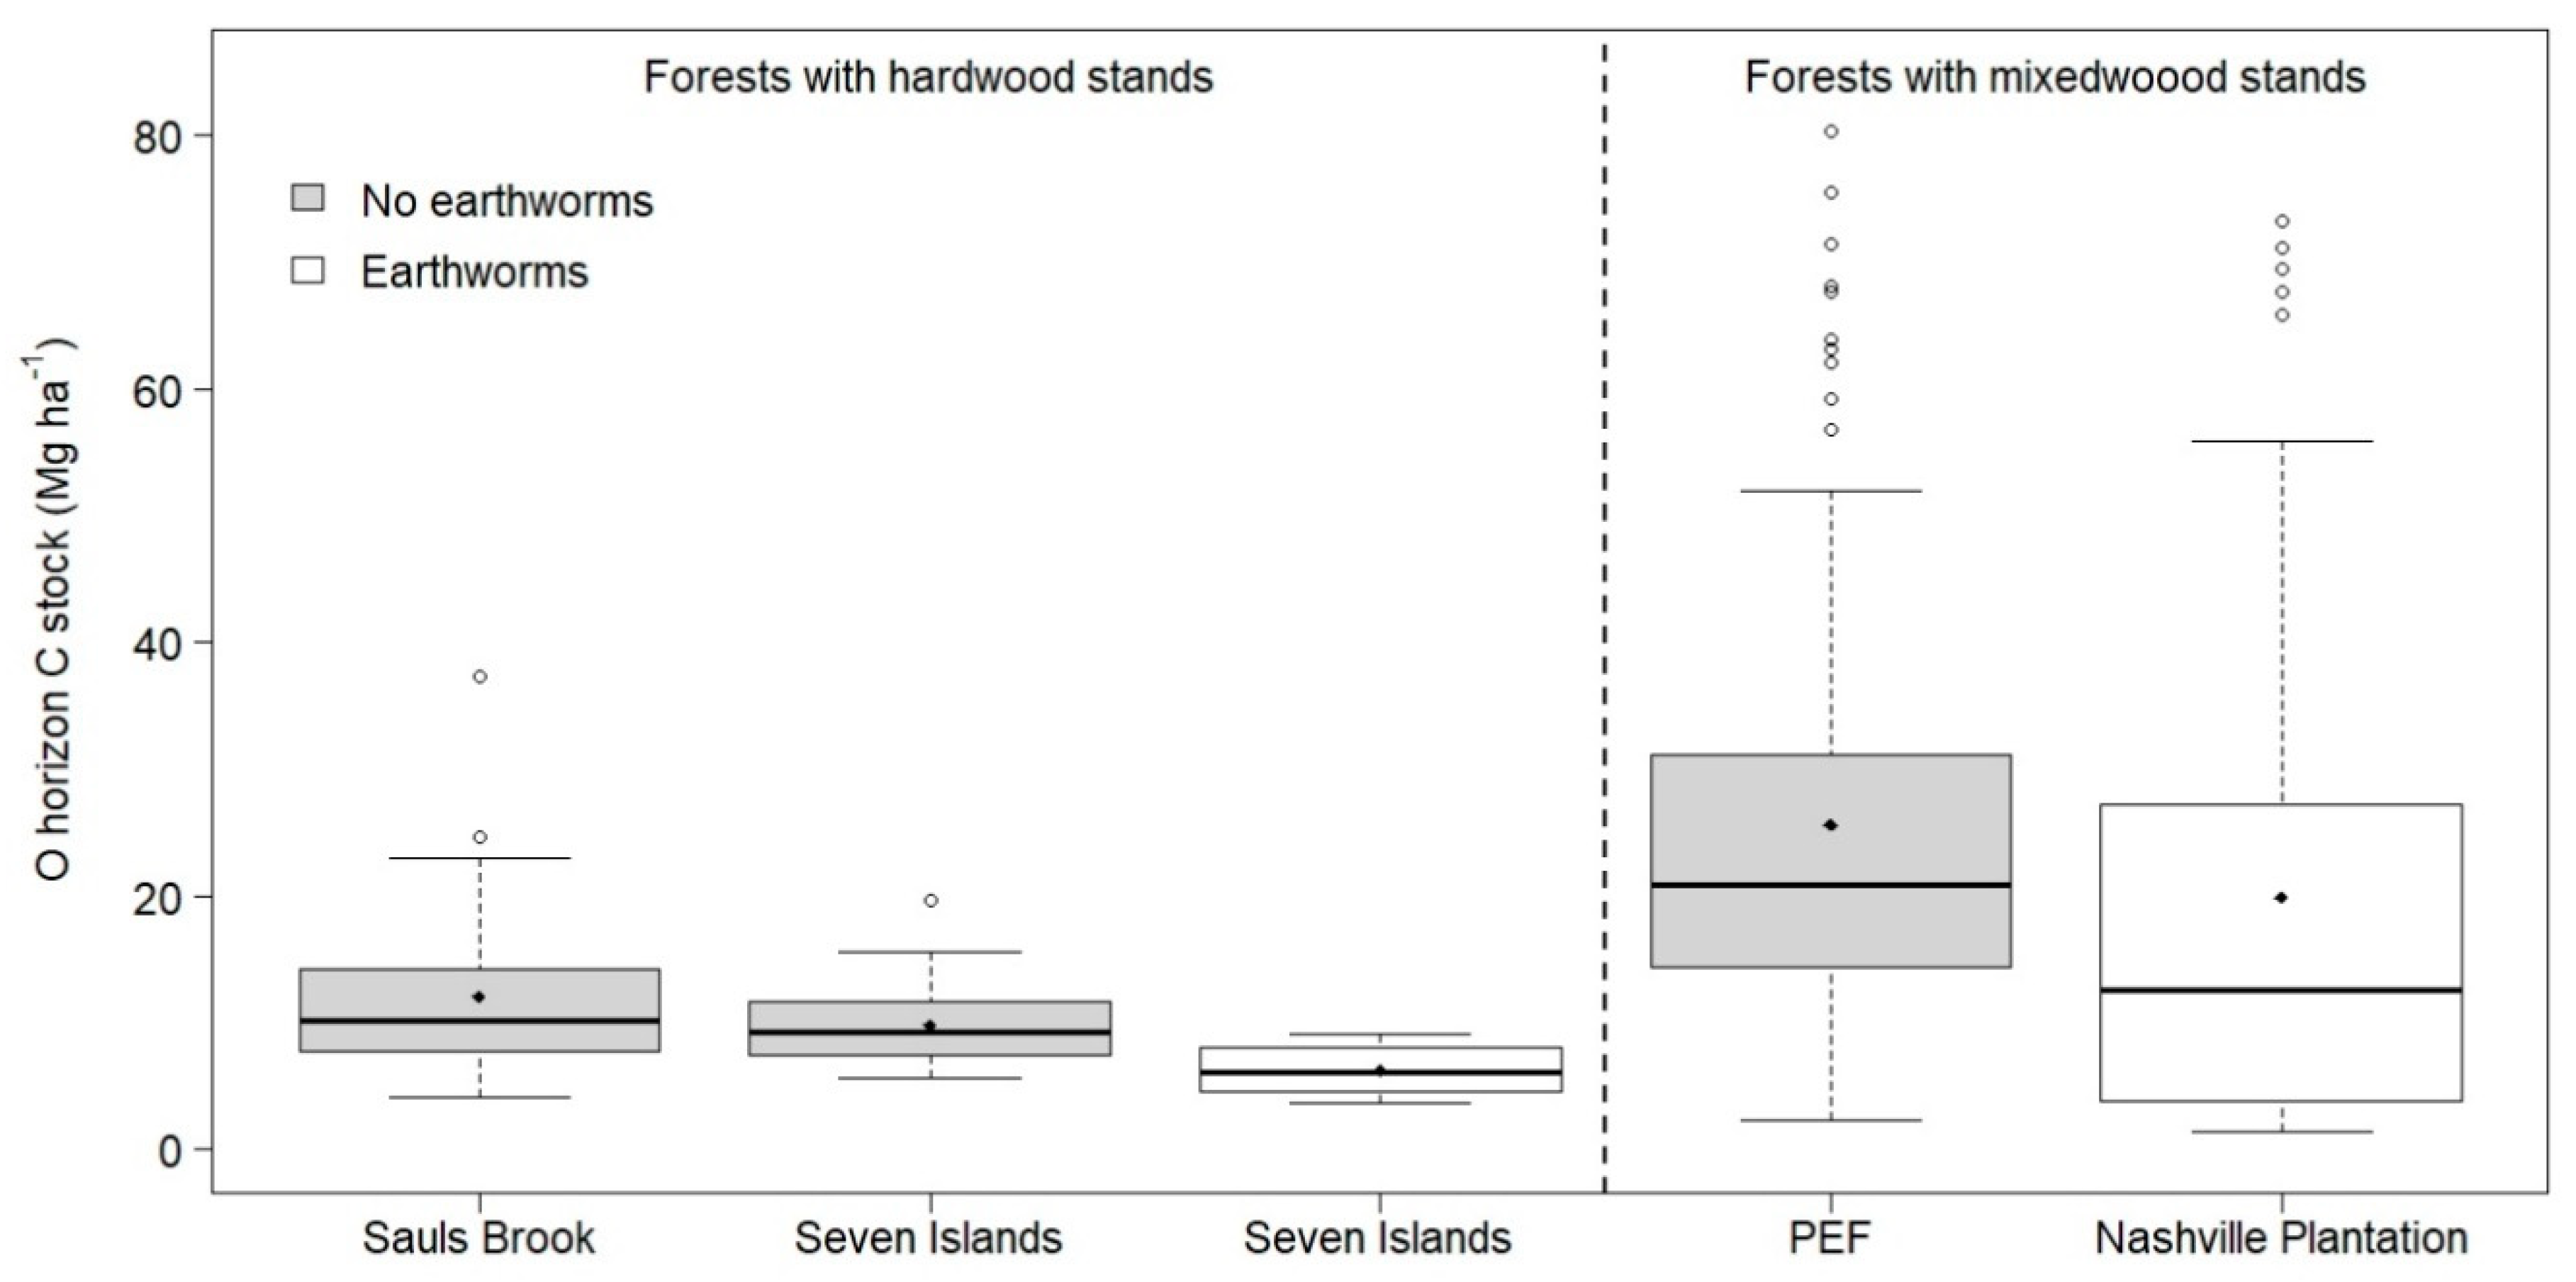
3. Results
4. Discussion
5. Conclusions
Author Contributions
Funding
Institutional Review Board Statement
Informed Consent Statement
Data Availability Statement
Acknowledgments
Conflicts of Interest
References
- Goodale, C.L.; Apps, M.J.; Birdsey, R.A.; Field, C.B.; Heath, L.S.; Houghton, R.A.; Jenkins, J.C.; Kohlmaier, G.H.; Kurz, W.; Liu, S.R.; et al. Forest carbon sinks in the Northern Hemisphere. Ecol. Appl. 2002, 12, 891–899. [Google Scholar] [CrossRef]
- Pacala, S.W.; Hurtt, G.C.; Baker, D.; Peylin, P.; Houghton, R.A.; Birdsey, R.A.; Heath, L.; Sundquist, E.T.; Stallard, R.F.; Ciais, P.; et al. Consistent land- and atmosphere-based U.S. carbon sink estimates. Science 2001, 292, 2316–2320. [Google Scholar] [CrossRef] [PubMed] [Green Version]
- Pan, Y.; Birdsey, R.A.; Fang, J.; Houghton, R.; Kauppi, P.E.; Kurz, W.A.; Phillips, O.L.; Shvidenko, A.; Lewis, S.L.; Canadell, J.G.; et al. A large and persistent carbon sink in the world’s forests. Science 2011, 333, 988–993. [Google Scholar] [CrossRef] [PubMed] [Green Version]
- Woodall, C.W.; Perry, C.H.; Westfall, J.A. An empirical assessment of forest floor carbon stock components across the United States. For. Ecol. Manag. 2012, 269, 1–9. [Google Scholar] [CrossRef]
- Curran, M.P.; Maynard, D.G.; Heninger, R.L.; Terry, T.A.; Howes, S.W.; Stone, D.M.; Niemann, T.; Miller, R.E.; Powers, R.F. An adaptive management process for forest soil conservation. For. Chron. 2005, 81, 717–722. [Google Scholar] [CrossRef] [Green Version]
- Curran, M.P.; Miller, R.E.; Howes, S.W.; Maynard, D.G.; Terry, T.A.; Heninger, R.L.; Niemann, T.; van Rees, K.; Powers, R.F.; Schoenholtz, S.H. Progress towards more uniform assessment and reporting of soil disturbance for operations, research, and sustainability protocols. For. Ecol. Manag. 2005, 220, 17–30. [Google Scholar] [CrossRef]
- Duckert, D.R.; Morris, D.M.; Deugo, D.; Duckett, S.; McPherson, S. Developing site disturbance standards in Ontario: Linking science to forest policy within an adaptive management framework. Can. J. Soil Sci. 2009, 89, 13–23. [Google Scholar] [CrossRef]
- Schaetzl, R.J.; Anderson, S. Soils Genesis and Geomorphology; Cambridge University Press: Cambridge, UK, 2005; p. 40. [Google Scholar]
- Puhlick, J.J.; Fraver, S.; Fernandez, I.J.; Weiskittel, A.R.; Kenefic, L.S.; Kolka, R.K.; Gruselle, M.-C. Factors influencing organic-horizon carbon pools in mixed-species stands of central Maine, USA. For. Ecol. Manag. 2016, 364, 90–100. [Google Scholar] [CrossRef]
- Brady, N.C.; Weil, R.R. The Nature and Properties of Soils, 14th ed.; Pearson Education, Inc.: Upper Saddle River, NJ, USA, 2008; p. 212. [Google Scholar]
- Kuehne, C.; Puhlick, J.; Weiskittel, A.; Cutko, A.; Cameron, D.; Sferra, N.; Schlawin, J. Metrics for comparing stand structure and dynamics between Ecological Reserves and managed forest of Maine, USA. Ecology 2018, 99, 2876. [Google Scholar] [CrossRef] [Green Version]
- Luyssaert, S.; Schulze, E.D.; Borner, A.; Knohl, A.; Hessenmoller, D.; Law, B.E.; Ciais, P.; Grace, J. Old-growth forests as global carbon sinks. Nature 2008, 455, 213–215. [Google Scholar] [CrossRef] [PubMed]
- Puhlick, J.J.; Fraver, S.; Fernandez, I.J.; Teets, A.; Weiskittel, A.R.; Kenefic, L.S. Site quality, disturbance, and vegetation effects on carbon storage and accumulation in old, mixed-species stands in central Maine, USA. Nat. Areas J. 2019, 39, 429–441. [Google Scholar] [CrossRef]
- Gates, G.E. Requiem—For megadrile utopias. A contribution toward the understanding of earthworm fauna of North America. Proc. Biol. Soc. Wash. 1966, 79, 239–254. [Google Scholar]
- Reynolds, J.W. The Earthworms (Lumbricidae and Sparganophilidae) of Ontario; Life Sci. Misc. Pub.: Toronto, ON, Canada, 1977. [Google Scholar]
- Reynolds, J.W. The earthworms (Oligochaeta: Acanthodrilidae, Lumbricidae and Megascolecidea) of Maine, USA. Megadrilogica 2008, 12, 61–72. [Google Scholar]
- Reynolds, J.W. The earthworms (Oligochaeta: Acanthodrilidae, Lumbricidae, Megascolecidea and Sparganophilidae) of the northeastern United States, revisited. Megadrilogica 2010, 14, 101–157. [Google Scholar]
- Reynolds, J.W.; Gorres, J.H.; Knowles, M.E. A checklist by counties of earthworms (Oligochaeta: Acanthodrilidae, Lumbricidae and Megascolecidae) in the states of Maine, New Hampshire and Vermont, USA. Megadrilogica 2015, 17, 125–140. [Google Scholar]
- Blouin, M.; Hodson, M.E.; Delgado, E.A.; Baker, G.; Brussaard, L.; Butt, K.R.; Dai, J.; Dendooven, L.; Peres, G.; Tondoh, J.E.; et al. A review of earthworm impact on soil function and ecosystem services. Eur. J. Soil Sci. 2013, 64, 161–182. [Google Scholar] [CrossRef]
- Dobson, A.M.; Blossey, B.; Richardson, J.B. Invasive earthworms change nutrient availability and uptake by forest understory plants. Plant Soil 2017, 421, 175–190. [Google Scholar] [CrossRef]
- Ferlian, O.; Thakur, M.P.; Gonzalez, A.C.; San Emeterio, L.M.; Marr, S.; Rocha, B.D.; Eisenhauer, N. Soil chemistry turned upside down: A meta-analysis of invasive earthworm effects on soil chemical properties. Ecology 2020, 101, 12. [Google Scholar] [CrossRef] [PubMed]
- Craven, D.; Thakur, M.P.; Cameron, E.K.; Frelich, L.E.; Beausejour, R.; Blair, R.B.; Blossey, B.; Burtis, J.; Choi, A.; Davalos, A.; et al. The unseen invaders: Introduced earthworms as drivers of change in plant communities in North American forests (a meta-analysis). Glob. Chang. Biol. 2017, 23, 1065–1074. [Google Scholar] [CrossRef]
- Moore, J.D.; Gorres, J.H.; Reynolds, J.W. Exotic Asian pheretimoid earthworms (Amynthas spp., Metaphire spp.): Potential for colonisation of south-eastern Canada and effects on forest ecosystems. Environ. Rev. 2018, 26, 113–120. [Google Scholar] [CrossRef]
- Bal, T.L.; Storer, A.J.; Jurgensen, M.F. Evidence of damage from exotic invasive earthworm activity was highly correlated to sugar maple dieback in the Upper Great Lakes region. Biol. Invasions 2018, 20, 151–164. [Google Scholar] [CrossRef]
- Larson, E.R.; Kipfmueller, K.F.; Hale, C.M.; Frelich, L.E.; Reich, P.B. Tree rings detect earthworm invasions and their effects in northern hardwood forests. Biol. Invasions 2010, 12, 1053–1066. [Google Scholar] [CrossRef]
- Korzekwa, K. Earthworm invaders have huge implications for forest health. Soil Horizons 2015, 56, 1–3. [Google Scholar] [CrossRef] [Green Version]
- Fisichelli, N.A.; Miller, K.M. Weeds, worms, and deer: Positive relationships among common forest understory stressors. Biol. Invasions 2018, 20, 1337–1348. [Google Scholar] [CrossRef]
- Owen, R.B.; Galbraith, W.J. Earthworm biomass in relation to forest types, soil, and land use: Implications for woodcock management. Wildl. Soc. Bull. 1989, 17, 130–136. [Google Scholar]
- Simmons, W. Non-Native Earthworms in Maine: A review of Ecological Impacts and an Initial Assessment of Maine’s Earthworm Community; A report for the Reptile, Amphibian, and Invertebrate Group of the Maine Department of Inland Fisheries and Wildlife and The Nature Conservancy; Maine Chapter: Brunswick, ME, USA, 2015. [Google Scholar]
- Callaham, M.A.; Gonzalez, G.; Hale, C.M.; Heneghan, L.; Lachnicht, S.L.; Zou, X.M. Policy and management responses to earthworm invasions in North America. Biol. Invasions 2006, 8, 1317–1329. [Google Scholar] [CrossRef]
- Cornelis, W.M.; Ronsyn, J.; Van Meirvenne, M.; Hartmann, R. Evaluation of pedotransfer functions for predicting the soil moisture retention curve. Soil Sci. Soc. Am. J. 2001, 65, 638–648. [Google Scholar] [CrossRef]
- Schwarzel, K.; Feger, K.H.; Hantzschel, J.; Menzer, A.; Spank, U.; Clausnitzer, F.; Kostner, B.; Bernhofer, C. A novel approach in model-based mapping of soil water conditions at forest sites. For. Ecol. Manag. 2009, 258, 2163–2174. [Google Scholar] [CrossRef]
- Wosten, J.H.M.; Lilly, A.; Nemes, A.; Le Bas, C. Development and use of a database of hydraulic properties of European soils. Geoderma 1999, 90, 169–185. [Google Scholar] [CrossRef]
- Hale, C. Earthworms of the Great Lakes, 2nd ed.; Kollath-Stensaas Publishing: Duluth, MN, USA, 2013. [Google Scholar]
- Loss, S.R.; Hueffmeier, R.M.; Hale, C.M.; Host, G.E.; Sjerven, G.; Frelich, L.E. Earthworm invasions in northern hardwood forests: A rapid assessment method. Nat. Areas J. 2013, 33, 21–30. [Google Scholar] [CrossRef]
- Helms, J.A. The Dictionary of Forestry; Society of American Foresters: Bethesda, MD, USA, 1998. [Google Scholar]
- Akaike, H. Information theory as an extension of the maximum likelihood principle. In Second International Symposium on Information Theory; Petrov, B.N., Csaki, F., Eds.; Akademiai Kiado: Budapest, Hungary, 1972; pp. 267–281. [Google Scholar]
- Pinheiro, J.C.; Bates, D.M.; DebRoy, S.; Sarkar, D.; R Development Core Team. nlme: Linear and Nonlinear Mixed Effects Models 2014. Available online: http://CRAN.R-project.org/package=nlme (accessed on 30 October 2020).
- R Development Core Team. R: A Language and Environment for Statistical Computing; R Foundation for Statistical Computing: Vienna, Austria, 2014. [Google Scholar]
- Fernandez, I.J. Carbon and nutrients in Maine Forest Soils; Technical Bulletin 200; Maine Agricultural and Forest Experiment Station, University of Maine: Orono, ME, USA, 2008. [Google Scholar]
- Puhlick, J.J.; Fernandez, I.J.; Weiskittel, A.R. Evaluation of forest management effects on the mineral soil carbon pool of a lowland, mixed-species forest in Maine, USA. Can. J. Soil Sci. 2016, 96, 207–218. [Google Scholar] [CrossRef] [Green Version]
- Nave, L.E.; Vance, E.D.; Swanston, C.W.; Curtis, P.S. Harvest impacts on soil carbon storage in temperate forests. For. Ecol. Manag. 2010, 259, 857–866. [Google Scholar] [CrossRef]
- Kulmatiski, A.; Vogt, D.J.; Siccama, T.G.; Tilley, J.P.; Kolesinskas, K.; Wickwire, T.W.; Larson, B.C. Landscape determinants of soil carbon and nitrogen storage in southern New England. Soil Sci. Soc. Am. J. 2004, 68, 2014–2022. [Google Scholar] [CrossRef]
- Hagemann, U.; Moroni, M.T.; Gleissner, J.; Makeschin, F. Accumulation and preservation of dead wood upon burial by bryophytes. Ecosystems 2010, 13, 600–611. [Google Scholar] [CrossRef]
- Alban, D.H.; Berry, E.C. Effects of earthworm invasion on morphology, carbon, and nitrogen of a forest soil. Appl. Soil Ecol. 1994, 1, 243–249. [Google Scholar] [CrossRef]
- Hale, C.M.; Frelich, L.E.; Reich, P.B. Changes in hardwood forest understory plant communities in response to European earthworm invasions. Ecology 2006, 87, 1637–1649. [Google Scholar] [CrossRef]
- Hale, C.M.; Frelich, L.E.; Reich, P.B.; Pastor, J. Effects of european earthworm invasion on soil characteristics in northern hardwood forests of Minnesota, USA. Ecosystems 2005, 8, 911–927. [Google Scholar] [CrossRef]
- Fernandez, I.; Birkel, S.; Schmitt, C.; Simonson, J.; Lyon, B.; Pershing, A.; Stancioff, E.; Jacobson, G.; Mayewski, P. Maine’s Climate Future 2020 Update; University of Maine: Orono, ME, USA, 2020; Available online: climatechange.umaine.edu/climate-matters/maines-climate-future/ (accessed on 30 October 2020).
- Frelich, L.E.; Blossey, B.; Cameron, E.K.; Davalos, A.; Eisenhauer, N.; Fahey, T.; Ferlian, O.; Groffman, P.M.; Larson, E.; Loss, S.R.; et al. Side-swiped: Ecological cascades emanating from earthworm invasions. Front. Ecol. Environ. 2019, 17, 502–510. [Google Scholar] [CrossRef] [PubMed]


| Installation and Earthworm Presence | ||||
|---|---|---|---|---|
| Forest Attribute | Sauls Brook No Earthworms | Seven Islands No Earthworms | Seven Islands Earthworms | Nashville Plantation Earthworms |
| Live tree attributes | N = 15 | N = 13 | N = 2 | N = 18 |
| Tree density | 2476 (513) | 994 (231) | 1075 (769) | 5567 (1582) |
| (trees ha−1) | 1483–3249 | 655-1310 | 531–1619 | 3719–9229 |
| QMD | 12.3 (1.9) | 19.9 (3.1) | 19.5 (2.1) | 8.9 (1.3) |
| (cm) | 10.4–16.7 | 16.4–26.7 | 18.1–21.0 | 6.4–11.2 |
| Total basal area | 28.7 (4.6) | 29.7 (4.5) | 29.9 (16.3) | 33.1 (5.5) |
| (m2 ha−1) | 19.1–36.3 | 21.4-36.6 | 18.4-41.4 | 22.7–42.8 |
| Conifer basal area | 22.7 (17.0) | 8.0 (5.3) | 16.4 (12.2) | 34.7 (10.5) |
| (% of total basal area) | 0–48.5 | 0–20.9 | 7.8–25.0 | 16.0–58.3 |
| O horizon attributes | N = 36 | N = 39 | N = 6 | N = 47 |
| Oi horizon C stock | 4.2 (1.5) | 4.6 (1.3) | 4.8 (1.0) | 4.0 (1.6) |
| (Mg ha−1) | 2.2–8.7 | 2.4–8.0 | 3.5–5.8 | 1.5–8.6 |
| Oe + Oa horizon C stock | 7.9 (6.3) | 5.2 (2.4) | 1.5 (2.0) | 15.9 (20.7) |
| (Mg ha−1) | 1.3–34.5 | 1.8–12.6 | 0.2–5.1 | 0–68.0 |
| Total O horizon C stock | 12.1 (6.6) | 9.8 (2.9) | 6.2 (2.0) | 19.9 (21.3) |
| (Mg ha−1) | 4.1–37.4 | 5.7–19.7 | 3.7–9.0 | 1.5–73.3 |
| O horizon depth | 4.8 (1.7) | 4.9 (1.2) | 2.9 (1.1) | 4.1 (3.4) |
| (cm) | 1.4–9.6 | 2.6–7.2 | 1.7–4.9 | 0.4–12.5 |
| Installation and Earthworm Presence | |||
|---|---|---|---|
| O Horizon Component | Sauls Brook No Earthworms | Seven Islands No Earthworms | Seven Islands Earthworms |
| Oi non-woody materials | 35 | 39 | 6 |
| 47.2 (1.0) | 46.9 (0.7) | 43.4 (3.6) | |
| Oi buried wood | 31 | 31 | 6 |
| 49.0 (1.2) | 48.6 (1.4) | 47.7 (0.7) | |
| Oe + Oa fines | 36 | 39 | 4 |
| 44.6 (4.4) | 44.9 (2.7) | 44.2 (2.8) | |
| Oe + Oa PDL | 36 | 31 | 2 |
| 46.1 (3.0) | 47.6 (1.4) | 46.9 (0.8) | |
| Oe + Oa roots | 32 | 21 | 1 |
| 46.9 (0.9) | 46.6 (1.2) | 45.4 (NA) | |
| Oe + Oa buried wood | 29 | 36 | 4 |
| 49.8 (2.2) | 49.8 (2.5) | 46.8 (1.0) | |
| Installation and Earthworm Presence | ||||
|---|---|---|---|---|
| Sauls Brook No Earthworms | Seven Islands No Earthworms | Seven Islands Earthworms | Nashville Plantation Earthworms | |
| a | 2.679 (0.910) | 3.792 (0.998) | 2.857 (0.615) | 3.200 (0.331) |
| b | 0.951 (0.214) | 0.605 (0.170) | 0.750 (0.175) | 1.238 (0.054) |
| R2 | 0.47 | 0.23 | 0.82 | 0.96 |
| RMSE | 2.033 | <0.001 | 0.967 | 1.804 |
Publisher’s Note: MDPI stays neutral with regard to jurisdictional claims in published maps and institutional affiliations. |
© 2021 by the authors. Licensee MDPI, Basel, Switzerland. This article is an open access article distributed under the terms and conditions of the Creative Commons Attribution (CC BY) license (http://creativecommons.org/licenses/by/4.0/).
Share and Cite
Puhlick, J.J.; Fernandez, I.J.; Wason, J.W. Non-Native Earthworms Invade Forest Soils in Northern Maine, USA. Forests 2021, 12, 80. https://doi.org/10.3390/f12010080
Puhlick JJ, Fernandez IJ, Wason JW. Non-Native Earthworms Invade Forest Soils in Northern Maine, USA. Forests. 2021; 12(1):80. https://doi.org/10.3390/f12010080
Chicago/Turabian StylePuhlick, Joshua J., Ivan J. Fernandez, and Jay W. Wason. 2021. "Non-Native Earthworms Invade Forest Soils in Northern Maine, USA" Forests 12, no. 1: 80. https://doi.org/10.3390/f12010080