Article

Response of Soil Microbial Community to C:N:P Stoichiometry along a Caragana korshinskii Restoration Gradient on the Loess Plateau, China

1
College of Agronomy, Northwest Agriculture and Forestry University, Yangling 712100, China
2
The Research Center of Recycle Agricultural Engineering and Technology of Shaanxi Province, Yangling 712100, China
*
Author to whom correspondence should be addressed.
Forests 2020, 11(8), 823; https://doi.org/10.3390/f11080823
Submission received: 18 June 2020 / Revised: 21 July 2020 / Accepted: 24 July 2020 / Published: 29 July 2020
(This article belongs to the Special Issue Impact of Climate Change on Biome Distributions in Forests)

Abstract

:
Soil microorganisms play crucial roles between plants and soil following afforestation. However, the relationship between the microbial community and carbon:nitrogen:phosphorus (C:N:P) stoichiometry in the plant–soil–microbe continuum remains unclear. In this study, we investigated this relationship by collecting plant and soil samples from Caragana korshinskii Kom. plantations with different years of afforestation (17-, 32-, and 42-year-old plantations), and from farmland. Illumina sequencing of the 16S rRNA and internal transcribed spacer (ITS) ribosomal RNA was used to examine the soil microbial community and the C, N, and P concentrations in plants, soil, and microbial biomass. Other soil characteristics were also measured. The results showed that the C and N concentrations in plants (leaves, herbs, and litter), soil, and microbial biomass increased as the vegetation restoration stage increased, but the P concentration in leaves and herbs slightly decreased. The C:P and N:P ratios in the plant–soil–microbe continuum substantially increased over time, particularly that of the microbial biomass. These results suggest that the unbalanced increase of C, N, and P following vegetation restoration may result in a P limitation in plant–soil systems. Moreover, bacterial and fungal alpha diversity significantly increased following afforestation. Afforestation had a greater impact on bacterial diversity (both alpha and beta diversity) than did fungal diversity. Among the dominant bacterial taxa, Proteobacteria increased significantly with afforestation time, whereas Actinobacteria decreased and Acidobacteria peaked in 32-year-old C. korshinskii plantations. However, there were no significant changes in the dominant fungal taxa. Collectively, we found that microbial diversity and dominant phyla were closely associated with the C:P and N:P ratios in the plant–soil–microbe continuum, particularly the N:P ratio. These results suggest that microbial diversity and composition may be limited by the imbalances of C, N, and especially P in afforested ecosystems, which provides evidence of linkages between microbial diversity and plant–soil systems in afforested ecosystems and could help in improving the predictions of sustainably restoring C. korshinskii plantations.

1. Introduction

Afforestation, an effective way to prevent soil erosion, can greatly affect aboveground and belowground ecosystems [1,2,3]. Carbon: nitrogen: phosphorus (C:N:P) stoichiometry, which focuses on the balance of multiple elements and nutrients [4], has been widely used in studies on aboveground and belowground soil nutrient components in terrestrial ecosystems [5]. For example, different substrates (such as litter and root exudation) induced by afforestation can affect C:N:P stoichiometric ratios in the soil [6], which have been used to indicate soil fertility and plant nutrient status [7,8]. The leaf N:P ratio is generally used to determine nutrient limitations in an ecosystem (either N or P limitation) [8,9,10]. Although most studies have focused on changes in the C:N:P stoichiometry in plants and soil [8,11], the stoichiometric ratios of the plant–soil–microbe continuum, particularly that of leaves, herbs, and litter, remain unclear. Thus, there is an urgent need to determine the C:N:P stoichiometry in the plant–soil–microbe continuum to reveal nutrient cycling and sustainable development of afforestation ecosystems in fragile habitats.
Soil microorganisms play a vital part in controlling the feedback between plants and soil nutrients [12] and can change with ecosystem C:N:P stoichiometry [5,13,14]. Close relationships exist between the dominant phyla of soil bacterial communities and soil C, N, and P concentrations. For example, there is a positive relationship between the abundance of Rhizobiales and soil N concentration [15,16], which consequently correlates with the changes in C:P and N:P ratios [2]. Additionally, the changes in β-Proteobacteria, Bacteroidetes, and Acidobacteria abundance are generally related to soil carbon content [17,18,19], and thus depend on C:N and C:P ratios. Zhong [20] suggested that the physical and chemical factors in the soil at different stages of afforestation have a greater impact on the soil microbial community than does the aboveground vegetation characteristics. Overall, soil microbial community diversity and composition are closely related to nutrient balance and C:N:P stoichiometry in an ecosystem. However, there are few studies on how microorganisms affect C:N:P stoichiometry in the plant–soil–microbe continuum, especially during vegetation restoration.
The Loess Plateau is an area with serious soil erosion and low vegetation cover [21]. Some successful measures have been undertaken to control soil erosion and desertification by the Chinese government, including the Grain to Green Program [22]. Because the cultivation of Caragana korshinskii helps to maintain soil moisture and soil carbon sequestration [23], C. korshinskii was planted at a large scale in the area to reduce soil erosion [24]. Extensive research has been conducted on physicochemical characteristics [25,26], soil enzyme activity [3,27], microbial biomass [28], microbial dynamics [2,29], and plant characteristics during vegetation restoration [16,30]. However, there are relatively few studies on the relationship between the microbial community and C:N:P stoichiometry in the plant–soil–microbe continuum, especially for the C. korshinskii restoration chronosequence in the Loess Hilly Region with its fragile ecosystems.
In the current study, Illumina sequencing of 16S rRNA and internal transcribed spacer (ITS) ribosomal RNA was used to determine the microbial (bacterial and fungal) community in C. korshinskii plantations of different ages, and the C, N, and P concentrations in leaves, herbs, litter, soil, and microbial biomass were also determined. We predicted that the C:N:P stoichiometry in plants (leaves, herbs, and litter), soil, and microbial biomass changes synchronously during afforestation, as the increase in vegetation productivity leads to an increase in litter production, soil nutrients, and microbial biomass after vegetation restoration [27]. We also predicted that the soil microbial diversity is closely related to the C:P and N:P ratios in soil and the microbial biomass, given the widely reported P limitation in the area [5]. Therefore, the goals of this study were to (i) describe the C, N, and P concentrations and the C:N:P stoichiometry changes in plants (leaves, herbs, and litter), soil, and microbial biomass during vegetation restoration; (ii) explore the effect of vegetation restoration on soil microbial diversity and composition; and (iii) reveal the response patterns of the microbial community to C:N:P stoichiometry of the plant–soil–microbe continuum.

2. Materials and Methods

2.1. Study Area and Experimental Design

This study was conducted in the Wuliwan watershed (36°51′–36°52′ N, 109°19′–109°21′ E, and 1000–1400 m a.s.l.) of Ansai County, Shaanxi Province, northwest China. The climate type of the study area is a temperate semiarid climate and the average annual temperature is 8.8 °C. The average annual precipitation in this region is 505 mm (rainfall mainly occurs between July and September). The soil type is characterized as Huangmian soil, derived from wind-blown loess deposits. Since the 1970s, this region has been selected as an experimental site for the conservation of soil and water, transforming farmland with slopes > 25° into abandoned land, with trees or shrubs used to restore the environment and improve vegetation and soil ecosystems. Currently, artificial shrublands planted with C. korshinskii Kom. are widely distributed across the area and are in different stages of recovery. Caragana korshinskii Kom. is a leguminous plant, and because it has been used for afforestation, the net primary productivity of the region has significantly improved compared with that of the former crops.
The present study was conducted during August 2016. Based on an age sequence approach, stands from three age groups (17, 32, and 42 years) of the artificially restored C. korshinskii were selected. Each of the three stand age classes was replicated three times, representing nine stands. Additionally, all sites had similar geographical features, such as slope gradients, slope aspect, and altitudes. Before afforestation, these sites had similar farming practices, with the cultivation of soybeans (Glycine max) and foxtail millet (Setaria italica) in rotation. Three active and adjacent sloped farmlands (FL) were selected as controls. Three (20 × 20 m) replicated plots were randomly established in each site for subsequent investigation and sampling. Basic information regarding the sampled sites is provided in Table 1.

2.2. Sampling

Five C. korshinskii with similar growth conditions were randomly selected from each plot for the collection of healthy and mature leaves. Fresh leaves were collected from the upper, middle, and lower parts of the selected shrubs in the four cardinal compass directions in each plot and then were thoroughly mixed to provide one sample. Herbs and litter were randomly collected in five quadrats (1 m × 1 m) in each plot and were thoroughly mixed, as were the leaf samples. In all, samples of 3 age groups × 3 replicate sites × 3 plots each for leaves, herbs, and litter were collected, and the weight of each plant sample was approximately 350 g (fresh weight). All plant samples were oven-dried to a constant weight at 65 °C. Then, plant samples were ground through a 0.1 mm sieve; stored in a dry and cool place; and used to determine the C, N, and P contents of the plants.
Ten replicated soil samples at a depth of 0–10 cm were sampled using a soil auger (5 cm diameter) from each plot in an “S” shape. After removing stones, plant roots, and ground litter, the soil samples from the same plot were thoroughly mixed to provide a composite sample and a total of 36 samples (3 age groups × 3 replicate stands × 3 replicate plots + 3 farmlands × 3 replicate plots) were collected. Then, all soil samples were sifted through a 2 mm sieve and separated into three parts. One part was air-dried and stored at room temperature (25 °C) for the analysis of soil physicochemical properties; one was stored at 4 °C for analysis of microbial biomass; and the remaining was stored at −80 °C for extraction of soil microbial DNA.

2.3. Laboratory Analysis

Soil pH was measured using a pH electrode (Sartorius PB-10, Gottingen, Germany) with a soil to water ratio of 1:2.5. Contents of organic carbon (OC), total nitrogen (TN), and total phosphorus (TP) in plants and soil were determined using the potassium dichromate oxidation method, the Kjeldahl method, and colorimetric method, respectively. Soil microbial biomass carbon (MBC), nitrogen (MBN), and phosphorus (MBP) were measured using a chloroform fumigation-extraction method [31,32,33].

2.4. DNA Extraction and Amplification

The methods of soil DNA extraction, high-throughput sequencing, and sequencing data processing were described in Ren et al. [5]. The methods used and any associated references are also available in the supplementary online material (Supplementary Materials, Appendix S1). In short, DNA was extracted from fresh soil samples three times (0.5 g each time) using a FastDNA spin kit based on the manufacturer’s instructions (MP Biomedicals, Cleveland, OH, USA). The quality and concentrations of extracted DNA were checked using 1% agarose gel electrophoresis and spectrophotometry (NanoDrop2000, Thermo Scientific, Wilmington, DE, USA) [34]. The bacterial 16S rRNA of the V4 region was targeted by the primer combination of 515F (5′-GTGCCAGCMGCCGCGG-3′) and 907R (5′-CCGTC AATTCMTTTRAGTTT-3′) [35]. The specific primers ITS1F (5′-ACTTGGTCATTTAGAGGAAGTAA-3′) and ITS2 (5′-BGCTGCGTTCTTCATCGATGC-3′), which targeted the ITS-1 region of fungi, were used for PCR [36]. The specific process of 16S rRNA and ITS rRNA PCR amplification was described in detail in Ren et al. [5]. The three replicated PCR products were mixed and purified using the Qiagen gel extraction kit (Qiagen, Valencia, CA, USA) and eluted in ddH2O. After electrophoresed using 2% agarose gels, the purified PCR products were mixed and paired-end (2 × 300) sequenced by the Major Biological Institute (Shanghai, China) using the Illumina MiSeq platform.

2.5. Processing the Sequencing Data

According to the three standards described by Caporaso et al. [37], reads were de-multiplexed, quality-filtered, and processed using QIIME (Version 1.9.0) workflow. Sequences were filtered and denoised using the USEARCH (v5.2.32), and similar sequences were clustered with less than 3% dissimilarity. Then, 16S rRNA and ITS rRNA operational taxonomic units (OTUs) were selected from the processed sequences of clustered OTUs at 97% identity using the QIIME pipeline software. Finally, the microbial gene sequences were deposited to the National Center for Biotechnology Information (NCBI) Sequence Read Archive (SRA) database under the accession numbers SRP223565 for bacteria and SRP223564 for fungi.

2.6. Statistical Analyses

The distribution of all data was checked using the Shapiro–Wilk test, and if all variables followed a normal distribution, then a one-way analysis of variance (ANOVA) was performed. The data regarding C, N, and P contents and stoichiometries in the plant–soil–microbe continuum, microbial community composition, and microbial community alpha diversity were analyzed by ANOVA and least significant difference (LSD) multiple comparisons (p < 0.05) to examine differences among the vegetation restoration chronosequences. Moreover, the Shannon–Wiener Index was used to assess the change in microbial alpha diversity during afforestation; nevertheless, non-metric multi-dimensional scaling analysis (NMDS) was applied to reflect soil microbial clusters of different ages. Correlations between the microbial community composition and the C:N:P stoichiometry in the plant–soil–microbe continuum were conducted using redundancy analysis (RDA). The relationship between C:N:P stoichiometry in the plant–soil–microbe continuum and microbial community diversity was identified through Spearman’s rank correlation analysis.

3. Results

3.1. C, N, and P Contents and C:N:P Stoichiometry

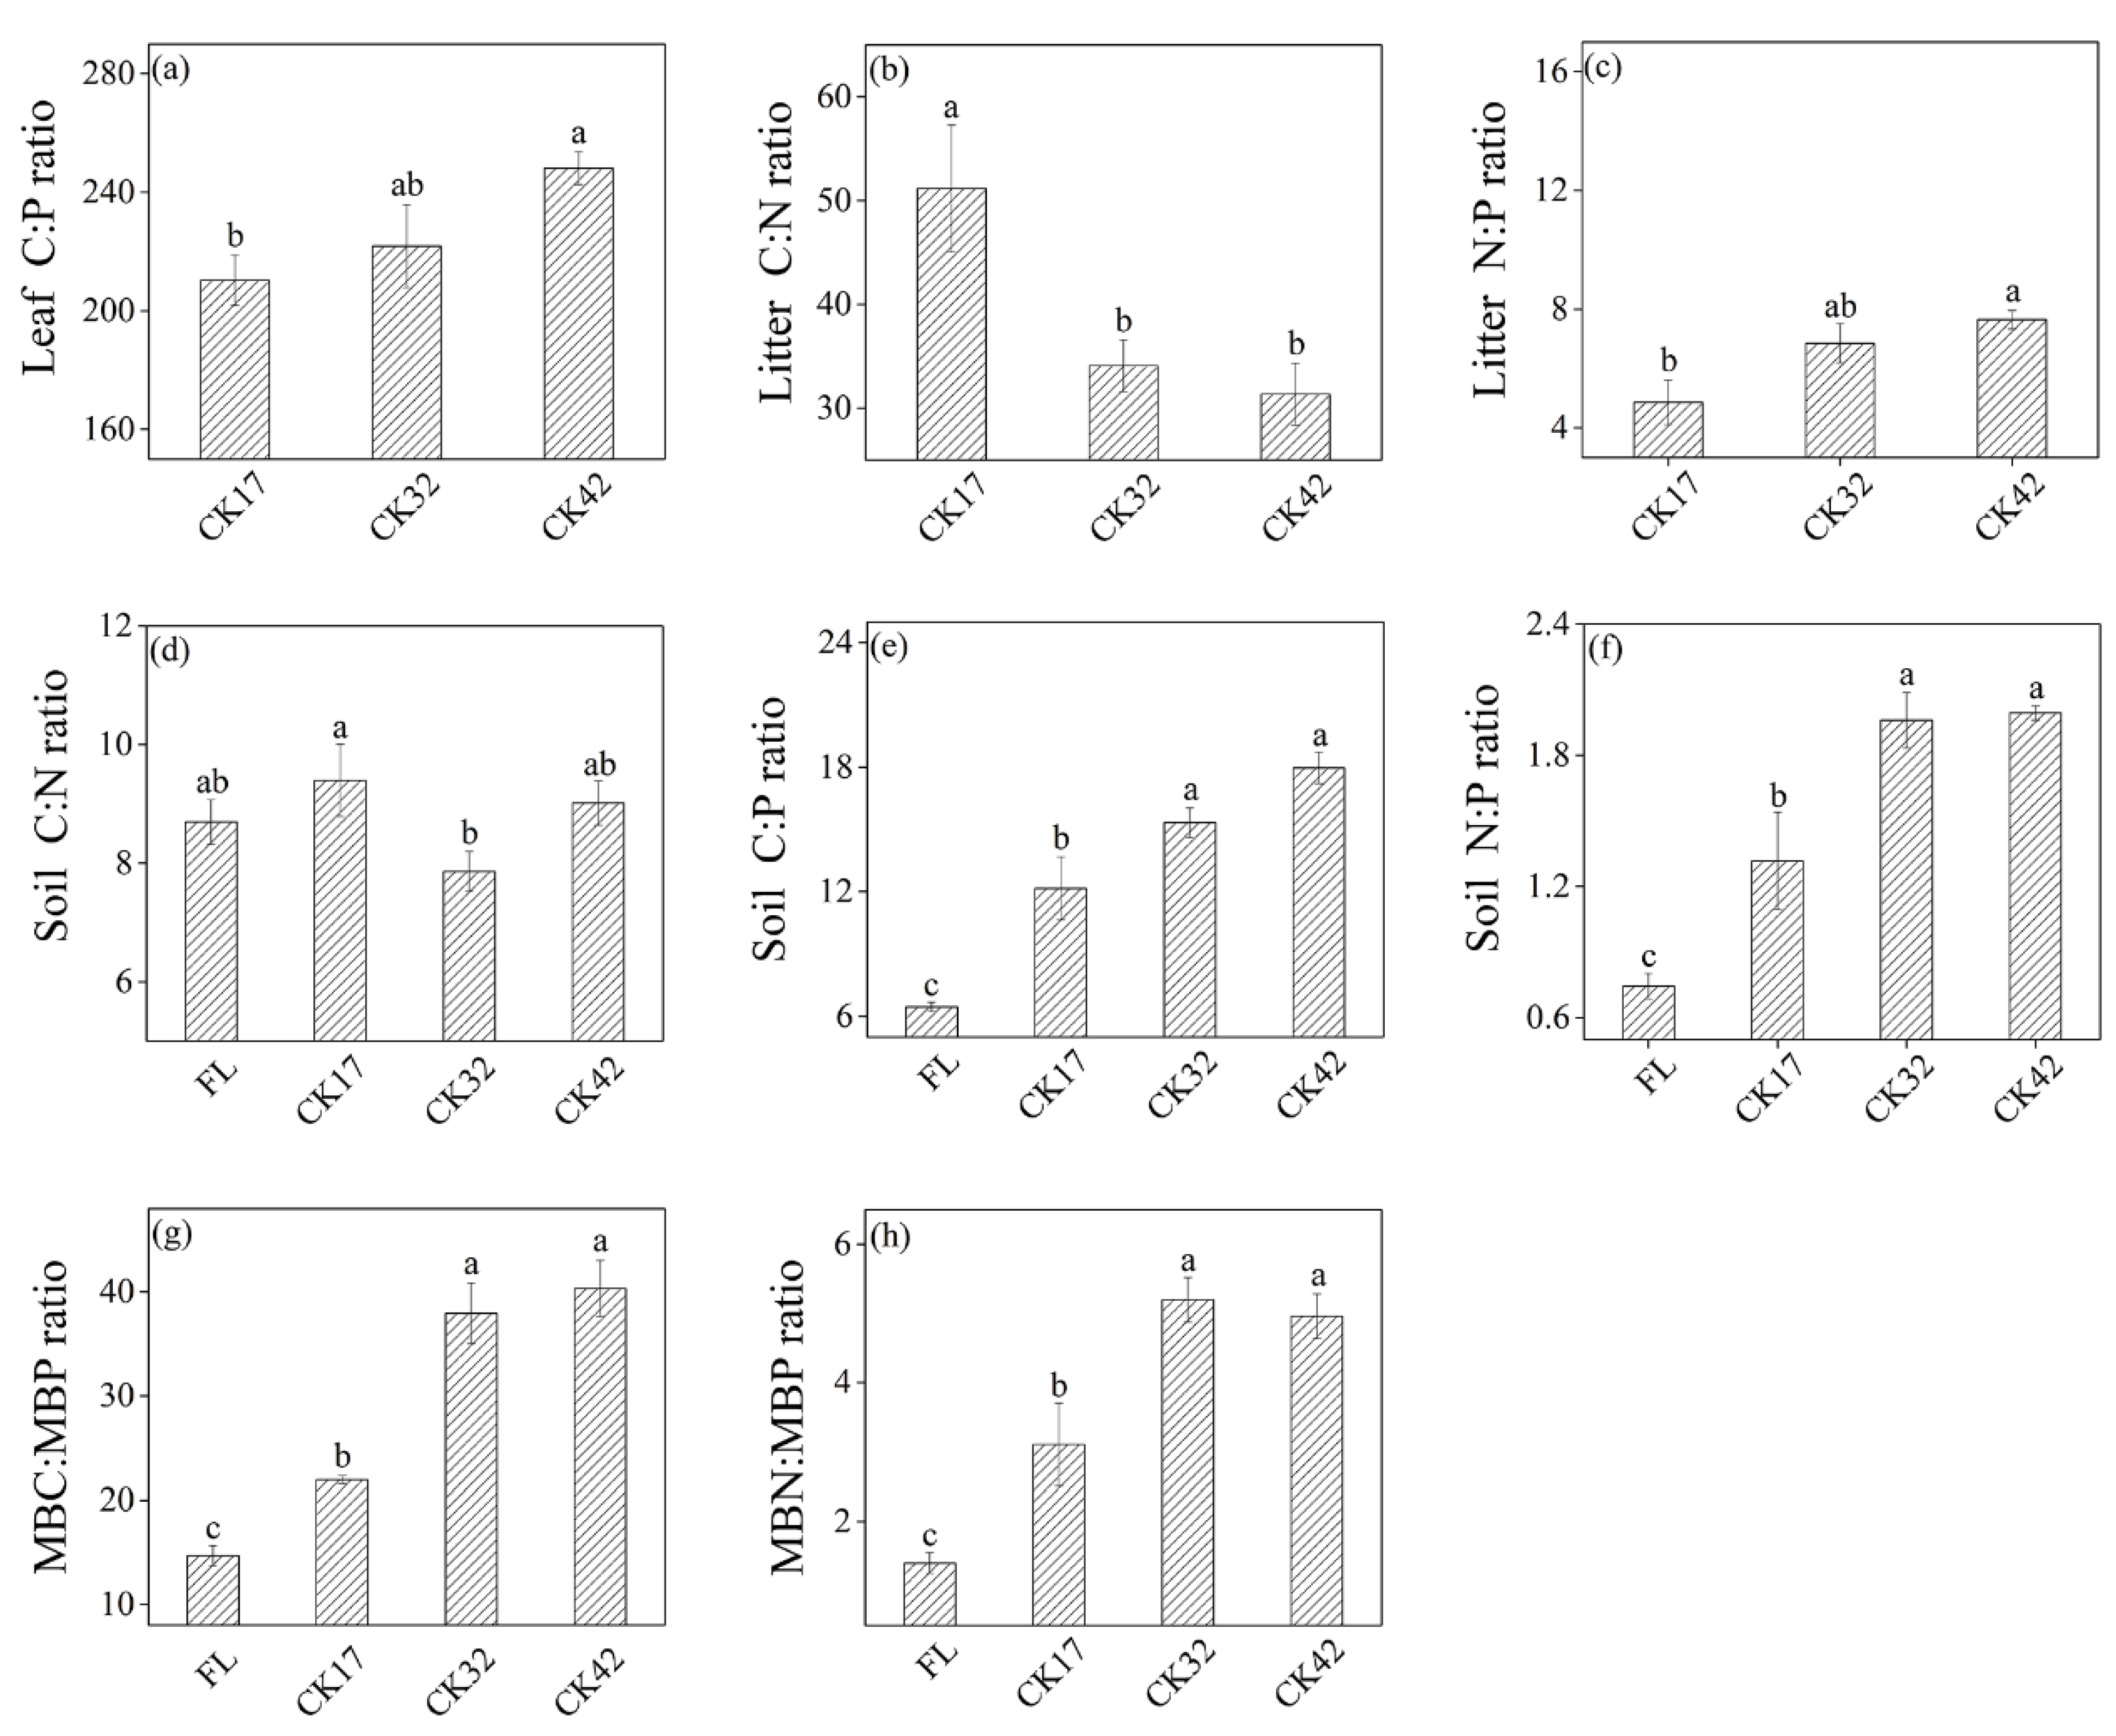
3.1.1. C, N, and P Contents and C:N:P Stoichiometry in Plants

Afforestation chronosequences did not have a significant effect on the C, N, and P concentrations in leaves and herbs (Table 2). However, the C and N concentrations in litter increased by 17.56% and 89.64%, respectively, during afforestation, although the change in phosphorus concentration was not significant. In general, the C:N:P stoichiometry in plants did not change significantly with the increase in afforestation years (Figure S1). Specially, leaf C:P and litter N:P increased by 17.99% and 57.20% following afforestation, respectively, whereas litter C:N decreased by 38.69% (Figure 1).

3.1.2. C, N, and P Contents and C:N:P Stoichiometry in the Soil–Microbe Continuum

Carbon, N, and P contents in soil and microbial biomass significantly changed during afforestation (Table 2). Specifically, compared with FL, the SOC concentration in CK17, CK32, and CK42 increased by 99.66%, 159.40%, and 211.41%, respectively, whereas the TN concentration increased by 88.24%, 191.18%, and 202.94%, respectively. However, the TP concentration did not change significantly with stand age. Moreover, the MBC, MBN, and MBP contents, compared with FL, increased by 146.63%–496.02%, 258.94%–672.14%, and 64.29%–117.35% in CK17, CK32, and CK42, respectively.
The differences in C, N, and P accumulation in soil and microbial biomass led to changes in C:N:P stoichiometry (Figure 1). The soil C:P and N:P ratios increased significantly with the increase in restoration age, whereas the change in the C:N ratio was not significant (Figure S1). Compared with FL, the soil C:P and N:P ratios in CK17, CK32, and CK42 increased by 88.68%, 137.67%, and 178.60% for C:P, and 78.38%, 164.86%, and 168.92% for N:P, respectively. Moreover, there was a similar trend for the C:P and N:P ratios in microbial biomass, which increased by 49.35%–174.47% and 122.14%–271.43%, respectively.

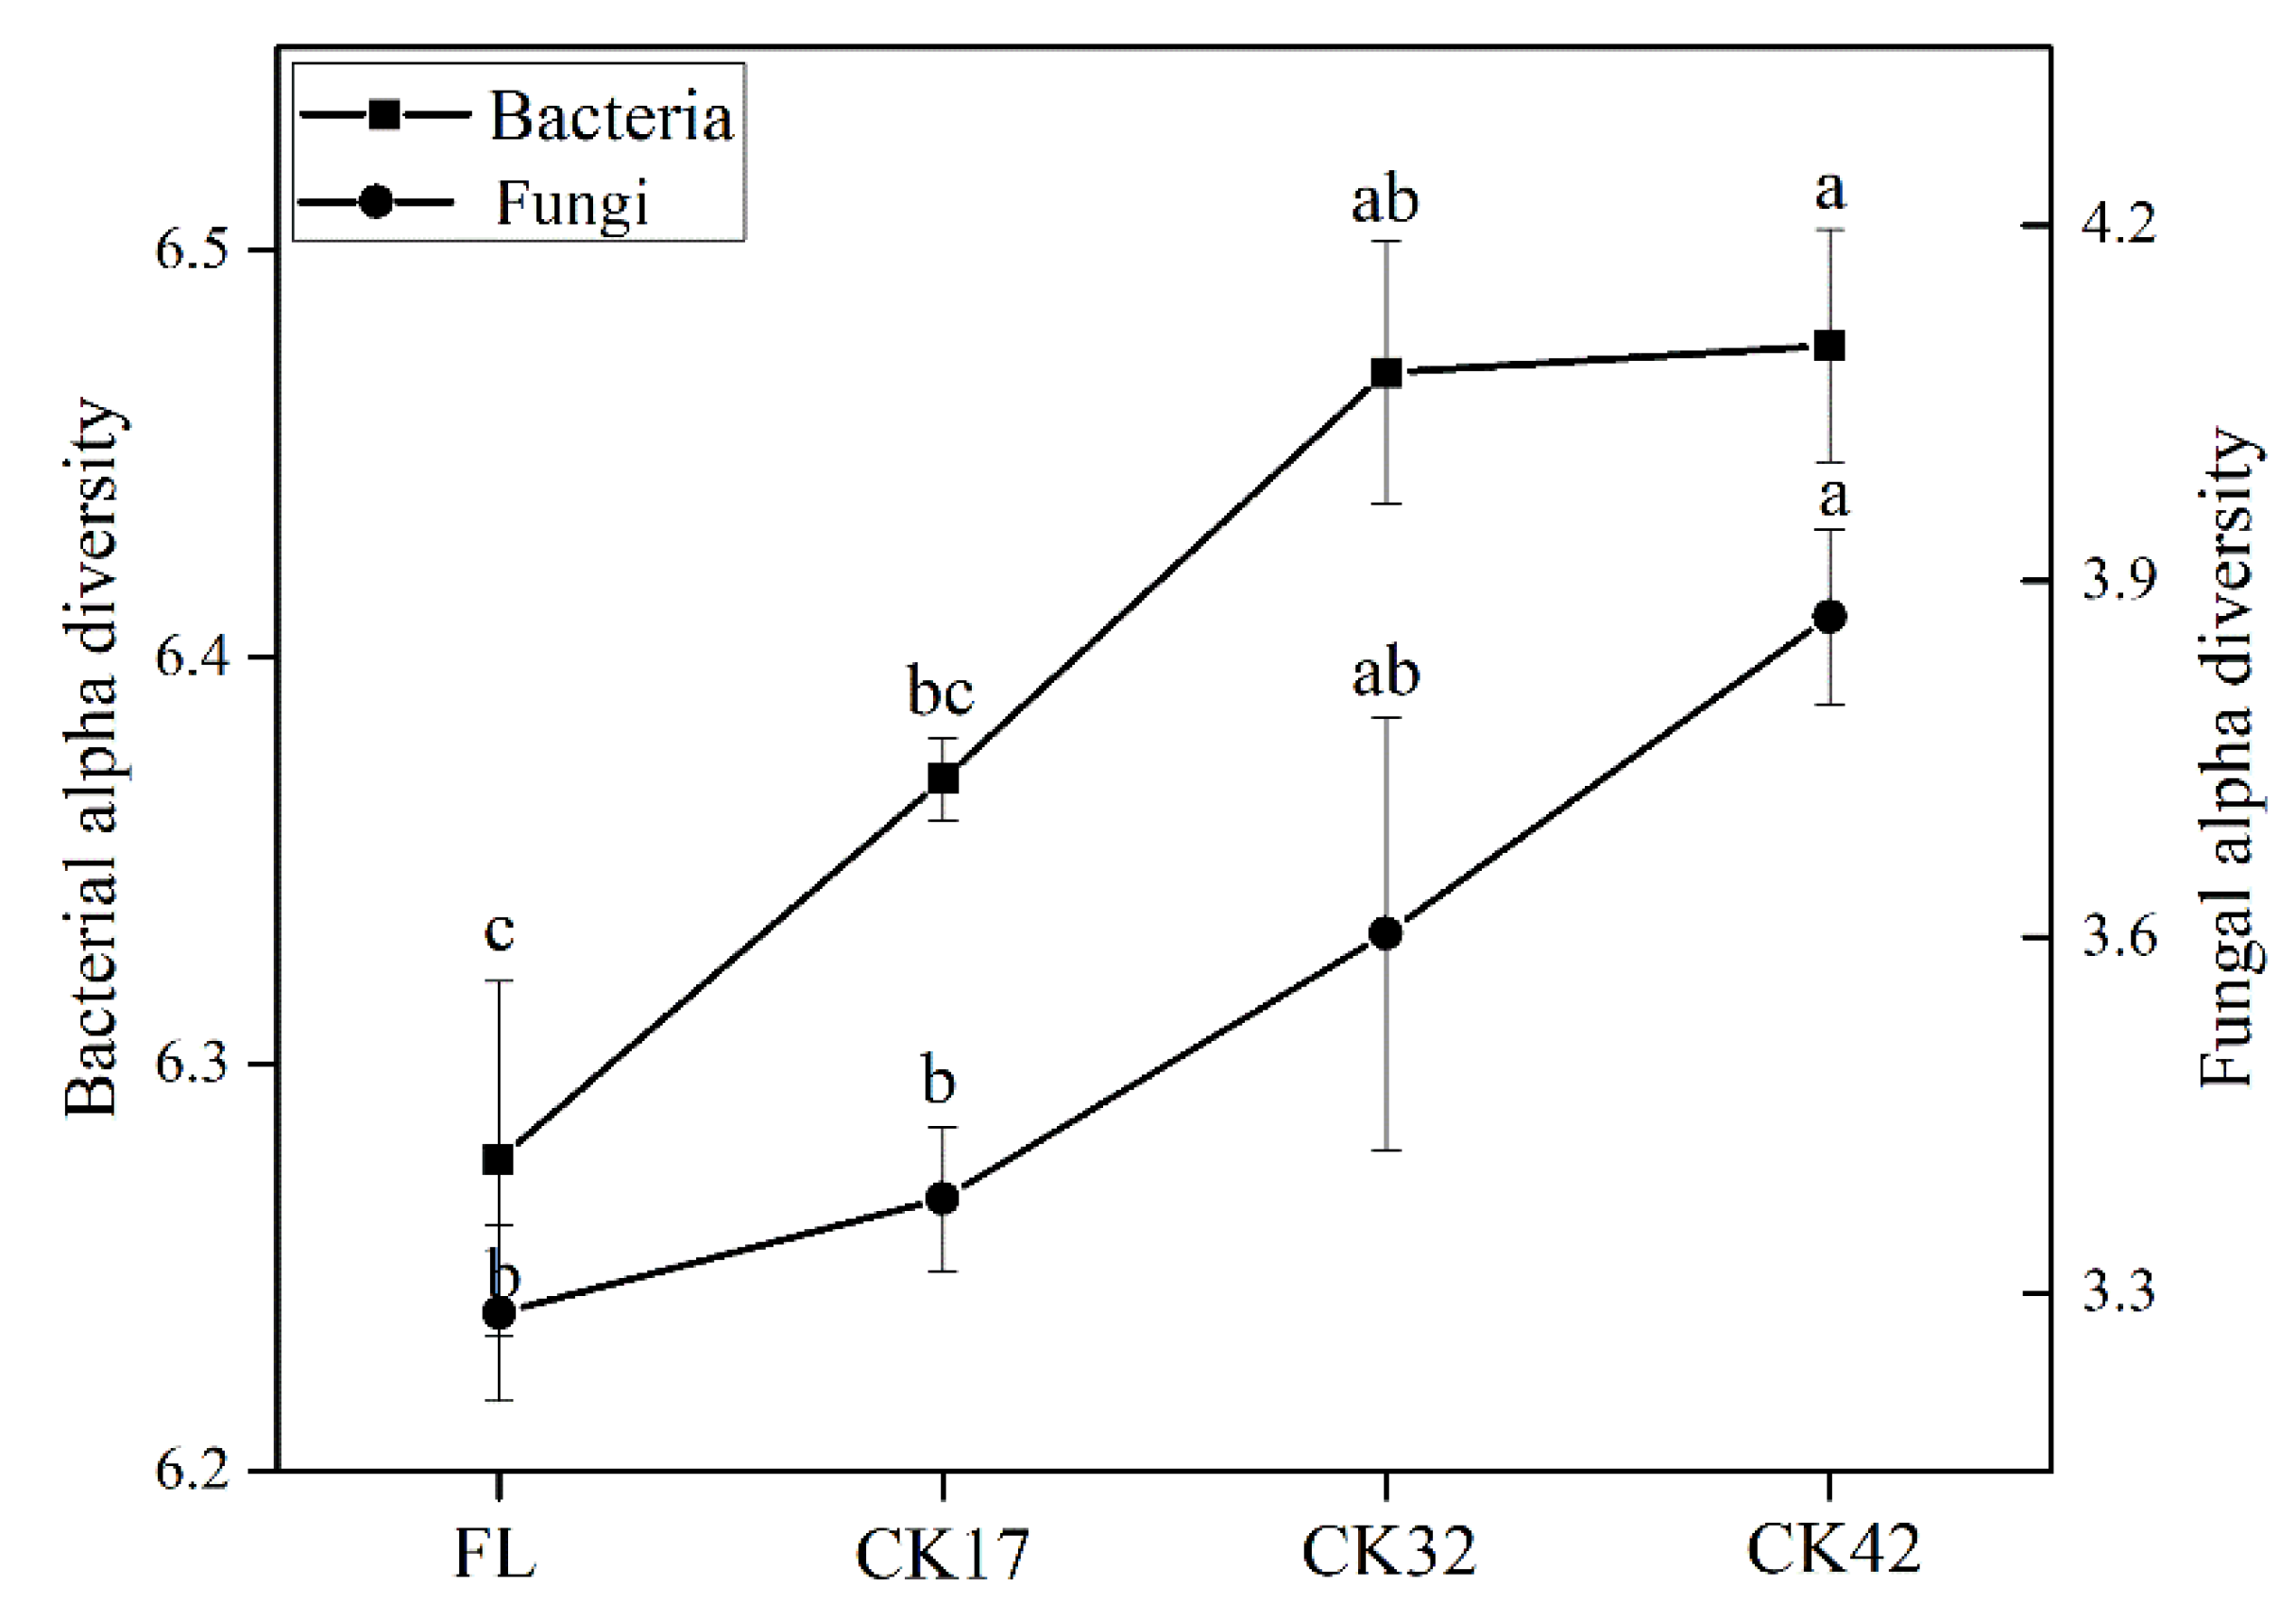
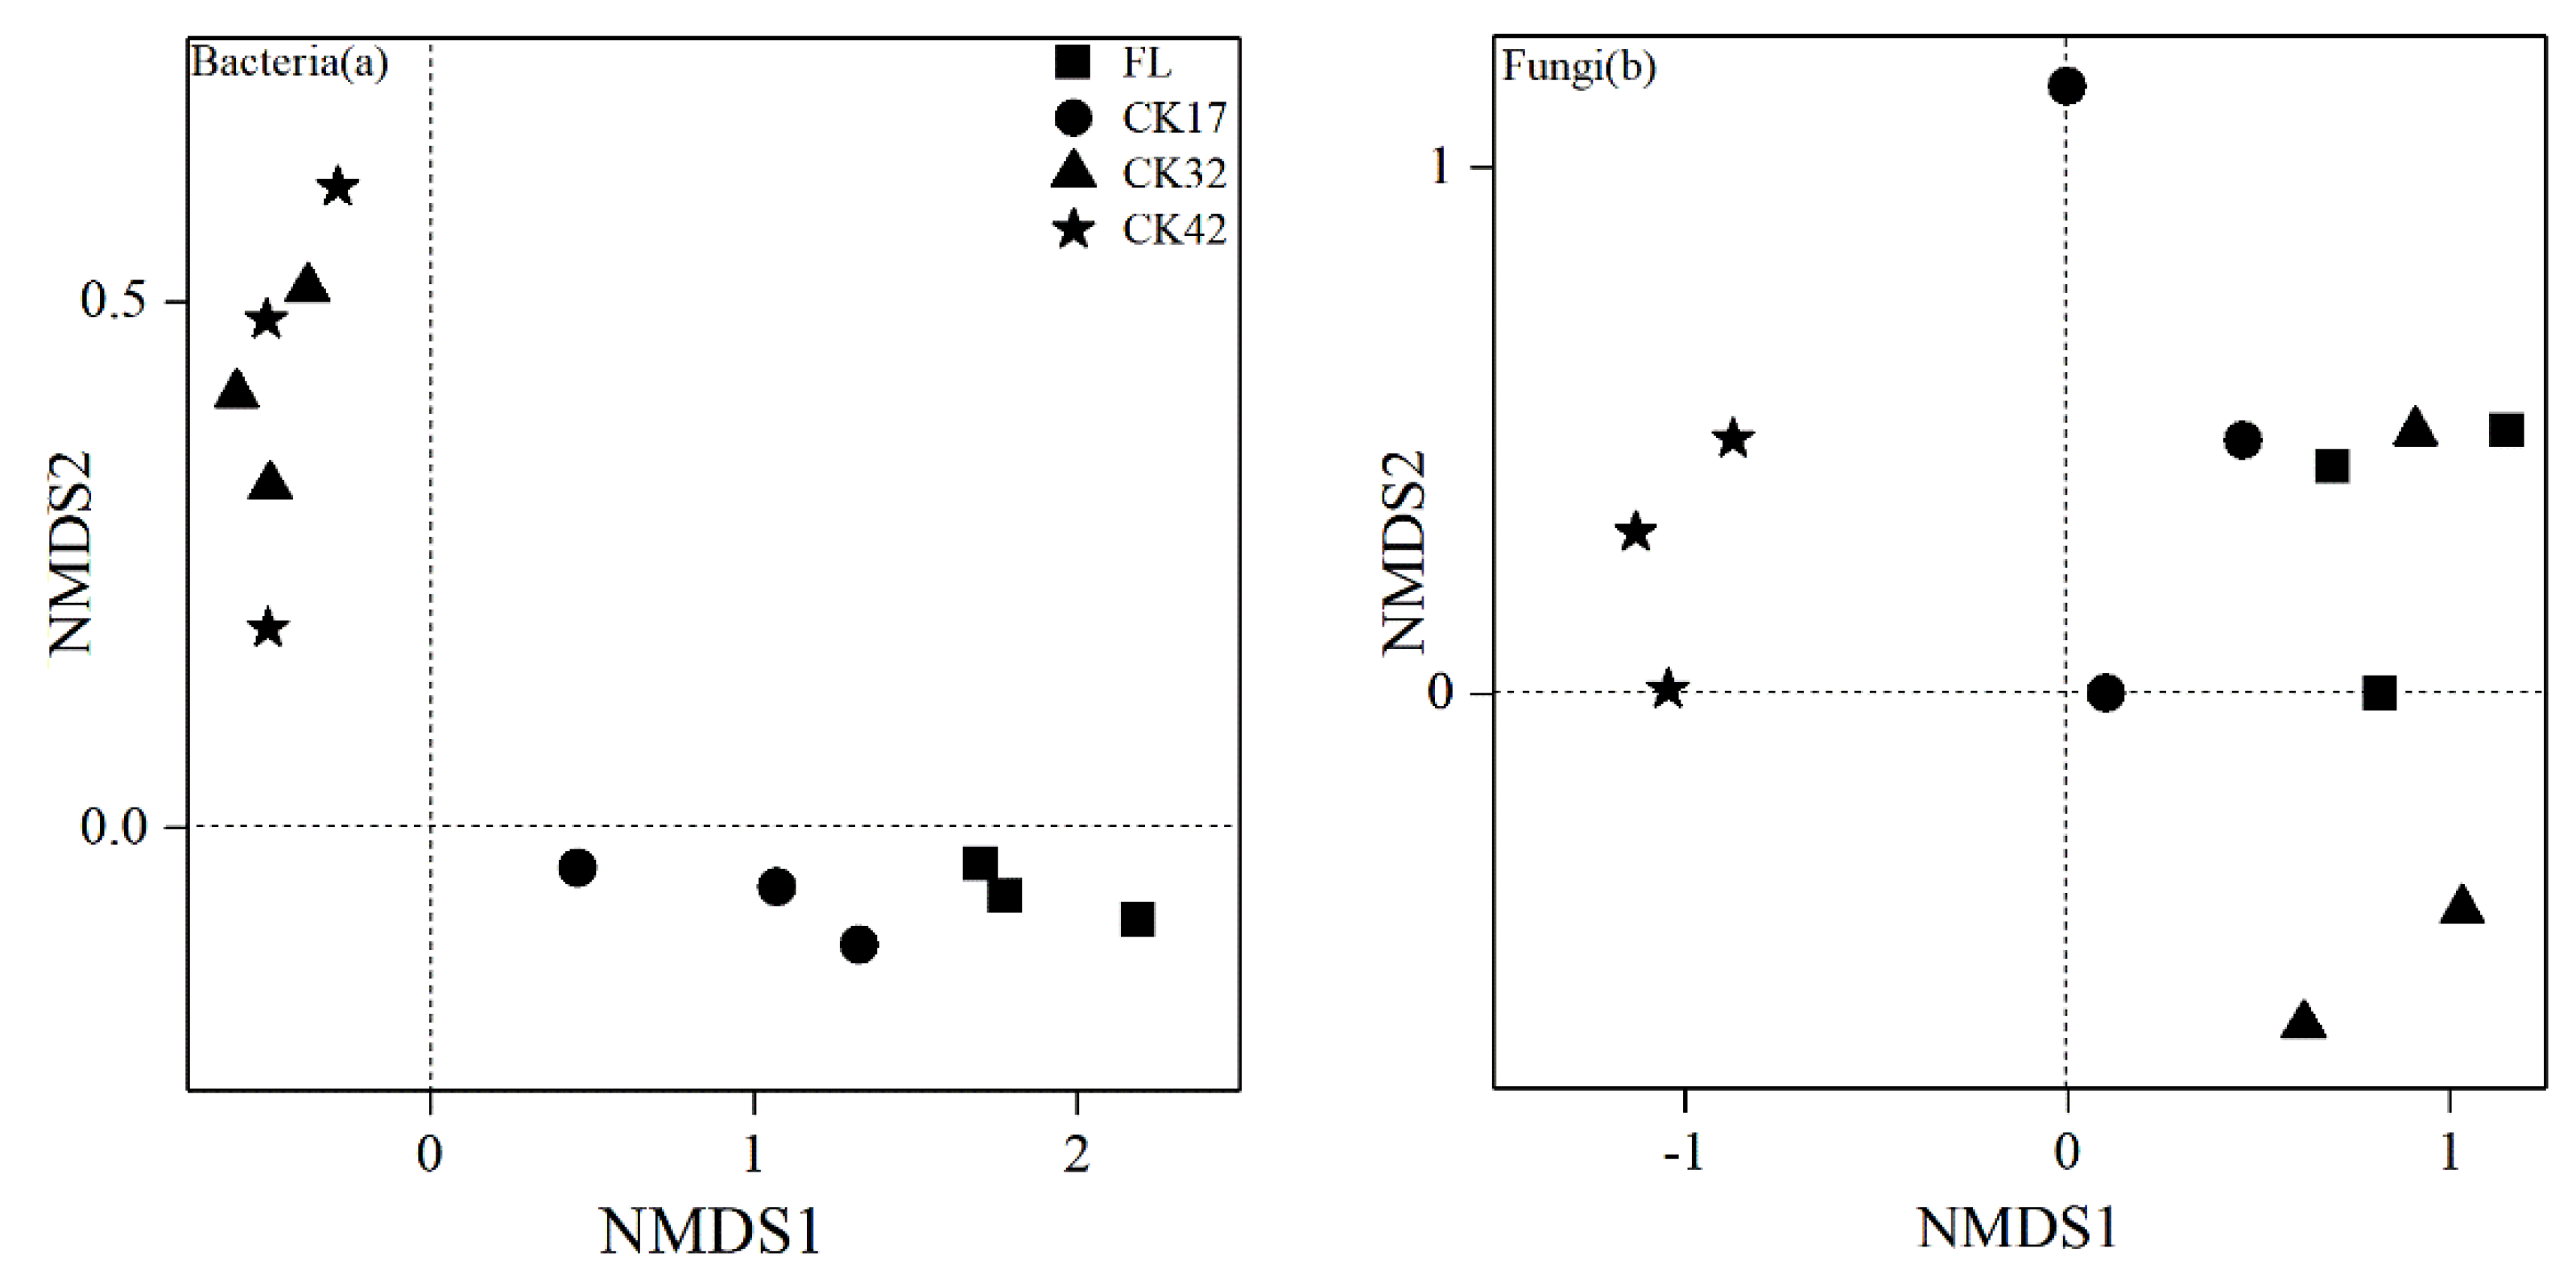
3.2. Changes in Diversity and Composition of Microbial Community

The microbial community alpha diversity increased significantly after afforestation (Figure 2). Compared with FL, bacterial alpha diversity increased by 1.49%, 3.11%, and 3.19% in CK17, CK32, and CK42, respectively, whereas fungal alpha diversity increased by 3.01%, 9.84%, and 17.88%, respectively. The NMDS analysis was utilized to reflect microbial beta diversity among the sites during vegetation restoration (Figure 3). The influence of vegetation restoration on soil bacterial beta diversity was stronger than that on fungal beta diversity, which indicated that the soil bacterial community varied more under afforestation age than did the fungal community. The profiles of bacteria at CK32 and CK42 tended to group together, and those at CK17 and FL grouped together; however, the bacterial profiles of these two latter groups were clearly separated from each other (Figure 3a). The profiles of fungal beta diversity at CK42 were separated from those at other afforestation ages (Figure 3b).
The dominant phyla in the bacterial community were Proteobacteria (29.25%), Actinobacteria (31.92%), Acidobacteria (16.03%), Chloroflexi (6.45%), Gemmatimonadetes (8.21%), Nitrospirae (1.92%), Bacteroidetes (2.37%), Verrucomicrobia (1.02%), and Planctomycetes (0.82%) (Figure 4a). The relative abundance of Proteobacteria increased markedly during afforestation, with average contributions of 25.16%, 25.54%, 31.53%, and 34.78% in FL, CK17, CK32, and CK42, respectively. Actinobacteria showed the opposite trend, and its relative abundance decreased by 21.83%, 39.63%, and 38.28%, respectively, following afforestation (Table S1). Notably, during the recovery of C. korshinskii, the relative abundance of Nitrospirae and Bacteroidetes gradually increased, with the highest increase of 97.58% and 158.21% compared with that of FL. The relative abundance of Acidobacteria and Planctomycetes increased and were most abundant in the CK32 sites, followed by a decrease. The relative abundances of other phyla of bacteria fluctuated in different recovery stages, but the difference was not significant. Additionally, Ascomycota (71.83% of abundance on average), Basidiomycota (8.98%), and Zygomycota (9.74%) were dominant in the fungal community composition at all the sample sites (Figure 4b). The relative abundance of Ascomycota decreased by 4.79%, 5.54%, and 9.55% compared to that of FL at CK17, CK32, and CK42, respectively. However, there was no difference in the relative abundance of Basidiomycota and Zygomycota during vegetation restoration.

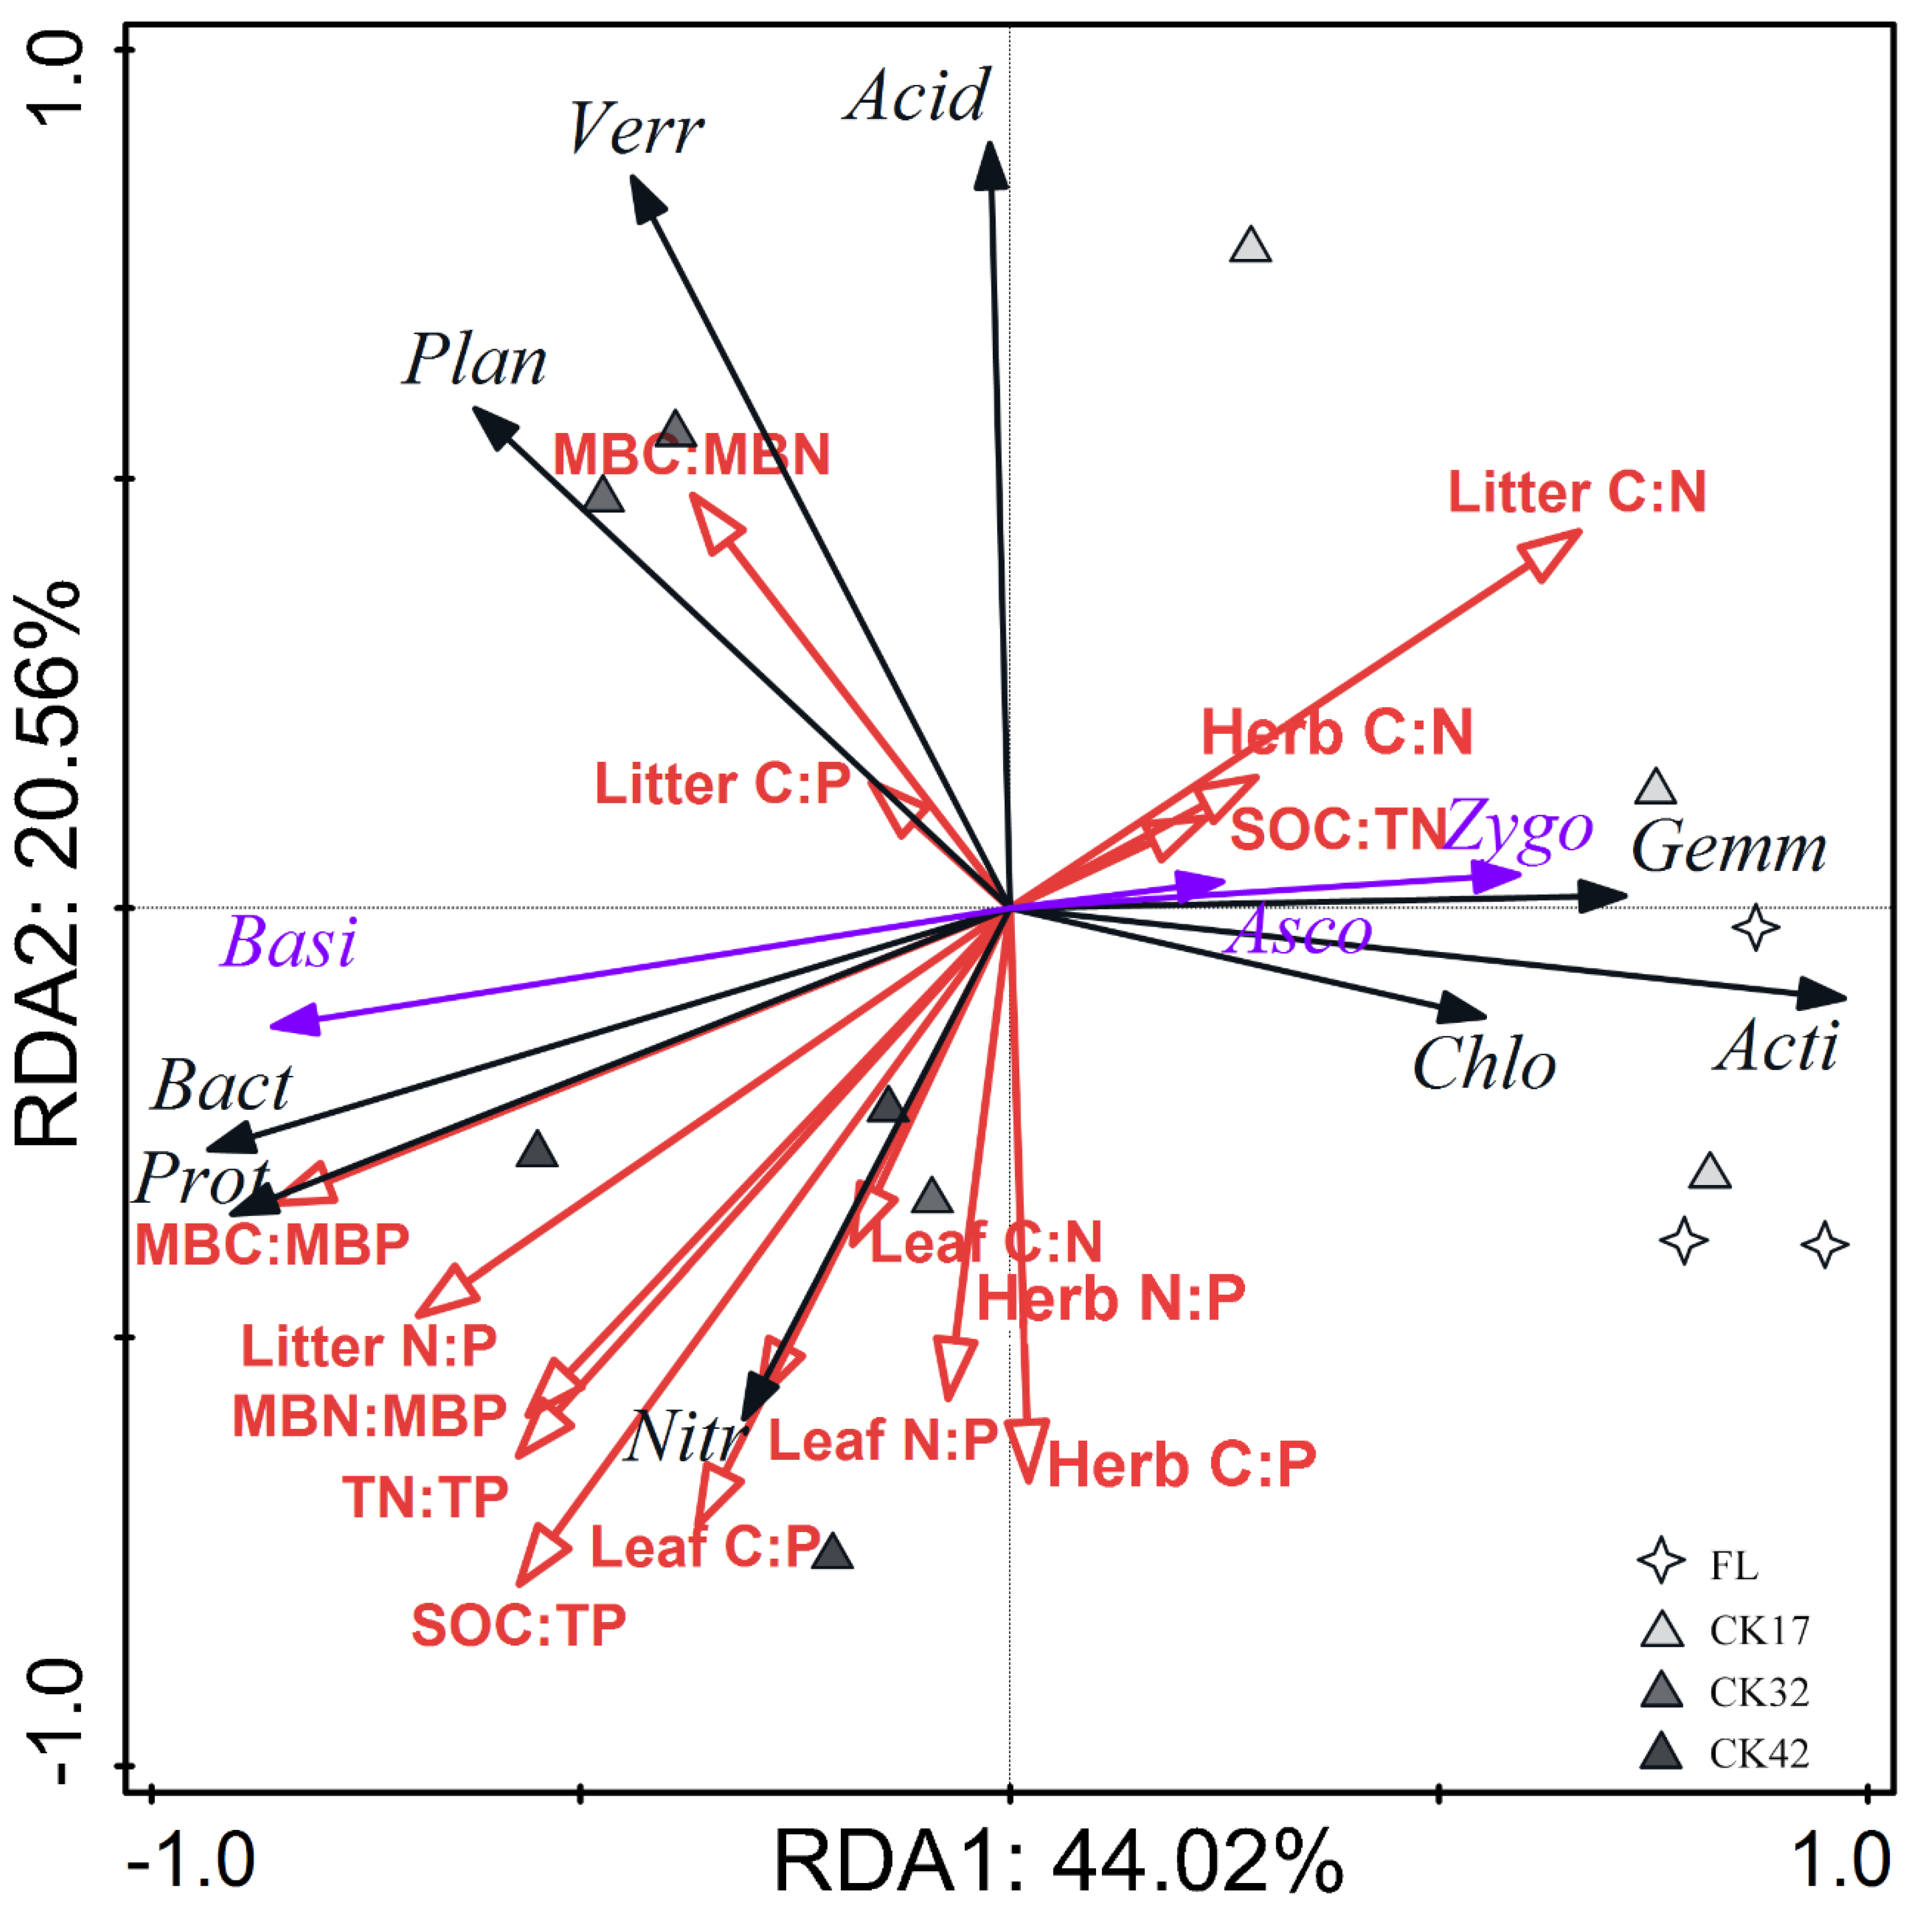
3.3. Correlation of Soil Microbial Composition and Diversity with C:N:P Stoichiometry

Spearman’s rank correlation coefficients showed that microbial diversity was closely related to the C:N:P stoichiometry in the plant–soil–microbe continuum (Figure 5). Generally, the effect of the underground part of vegetation on microbial community diversity was significantly greater than that of the aboveground part of the vegetation. The effect of herb and litter C:N:P stoichiometry on microbial diversity was less than that of leaves and the underground soil and microbial biomass. Additionally, the C:N ratio in plants (leaves, herbs, and litter) was negatively related to microbial diversity (except for fungal beta diversity), and positively correlated with fungal beta diversity. The C:P and N:P ratios were most closely related to changes in microbial community diversity (p < 0.05).
The RDA showed that the C:N:P stoichiometry in the plant–soil–microbe continuum greatly affected the dominant microbial phylum (Figure 6). The two canonical axes explained 44.02% and 20.56% of the total microbial community variation. The order of influence of the plant–soil stoichiometric ratio on the microbial community during afforestation was MBC:MBP, MBC:MBN, and herb C:P. For bacterial responses, Proteobacteria and Bacteroidetes were positively correlated with MBC:MBP, MBC:MBN, litter N:P, and herb C:P, but negatively correlated with the litter C:N ratio. Actinobacteria was positively related to litter C:N and negatively correlated with MBC:MBN; Acidobacteria was negatively correlated with herb C:P and N:P. However, Nitrospirae had significant positive correlations with C:P and N:P ratios in leaves. Planctomycetes and Verrucomicrobia were positively correlated with MBC:MBN. Regarding fungal responses, Basidiomycota was positively related to MBC:MBP and the litter N:P ratio, whereas Ascomycota and Zygomycota were less affected by stoichiometry.

4. Discussion

4.1. Changes in the C:N:P Stoichiometry in the Plant–Soil–Microbe Continuum during Afforestation

Total C and N concentrations in the plant–soil–microbe continuum gradually increased following afforestation (Table 2). A possible explanation for this result is that C. korshinskii grew rapidly and synthesized increasing amounts of organic matter and protein after the sloping farmland was converted to a forest, which increased nutrient concentrations. Many studies have shown that soil nutrients and microbial biomass accumulate because of an increase in the quantity of plant residues (litter and rhizodeposition) on the surface, resulting in increased primary productivity during afforestation [38,39,40]. Overall, the results of our study were in agreement with those of previous studies, indicating that afforestation improved soil nutrients [41,42]. Following afforestation, a disproportionately large increase in C, N, and P contents, which were induced by different ages of recovery, might lead to changes in the C:N:P stoichiometry in the plant–soil–microbe continuum [7,43]. The C:P and N:P ratios in the plant–soil–microbe continuum exhibited an increasing trend during afforestation, whereas the C:N ratio did not change significantly (Figure 1).
In the present study, the concentrations of C and N in litter, soil, and microbial biomass showed obvious changes. However, the P concentration in the plant, soil, and microbial biomass and nutrients in leaves and herbs did not change significantly (Table 2). These results are consistent with those of a previous study that showed afforestation led to a massive increase in the concentration of C and N, but only a small increase in the P concentration [1,44]. This was caused by the different sources of carbon, nitrogen, and phosphorus in the ecosystem. Carbon and N in soil and microbial biomass mainly originated from plant residue (litter and rhizodeposition) on the surface, and as C. korshinskii is a leguminous plant, it caused an increase in soil C and N content [45]. However, P mainly originated from the weathering of rocks and could not be obtained in large quantities from the soil [46]. Most of it was in the form of phosphate, which was difficult to be absorbed and used by plants and other organisms [47]. The reason the C:N ratio had no obvious change in leaves, herbs, and soil was that the C and N concentrations increased at a faster rate than did the P concentration. Moreover, there were obvious changes in the C and N concentrations of litter, soil, and microbial biomass, which led to obvious changes in the C:P and N:P ratios during vegetation restoration.

4.2. Response of Microbial Community to the C:N:P Stoichiometry in the Plant–Soil–Microbe Continuum

Environmental adaptability increases with vegetation restoration, thereby promoting microbial diversity [2,16,48]. The current study showed that, during vegetation restoration, the soil microbial (bacterial and fungal) alpha diversity in the C. korshinskii forest exhibited an increasing trend with the increase in the years since restoration (Figure 2). This was because the nutrient content in the form of litter increased over the years, thereby promoting microbial activity [16,49]. However, because of changes in inputs, the microbial community changed vegetation restoration [12,20,50]. Our study showed that the microbial community of younger stands were similar, whereas that of older stands gathered together, especially the bacterial community, suggesting that the soil bacterial community had a strong ability to adapt to environmental changes over a short period of time. However, with an increase in the recovery period, the differences in the microbial community also increased along an environmental gradient [2,16,48].
The change in soil microbial diversity mainly depended on differences in the composition of the microbial community [16,51]. Consistent with other research, Proteobacteria, Actinobacteria, and Acidobacteria were the dominant species in the bacterial community and contributed the most to variability in the microbial community in this study (Figure 4a). Previous studies have confirmed that β-Proteobacteria and Bacteroidetes are positively related to carbon availability, whereas oligotrophic Actinobacteria and Acidobacteria are adapted to barren conditions [18]. Therefore, increasing the SOC content during afforestation could promote the growth of Proteobacteria and Bacteroidetes. Planting legumes could significantly increase the size and function of the microbial community [52]. Simultaneously, SOC could affect the proportion of soil nutrients and then alter the C:P and N:P ratios, and ultimately affect microorganisms. Moreover, for fungal community composition, the abundance of Ascomycota and Basidiomycota were linked to plant residue degradation and could facilitate soil C accumulation [53,54]. Therefore, there were obvious differences in the soil microbial community attributed to changes in vegetation and soil nutrients after afforestation. Changes in the main phyla of soil microorganisms could also affect changes in soil nutrients.
The soil microbial community was closely related to the C:N:P stoichiometry during the restoration of C. korshinskii [4]. Our study showed that there was a strong correlation between microbial diversity and the C:P and N:P ratios in the plant–soil–microbe continuum, whereas there was a relatively weaker correlation with the C:N ratio (Figure 5). These results suggest that C:P and N:P ratios were a better indicator for changes in the microbial community than the C:N ratio following the conversion of FL to CK. The existing P limitation will affect the synthesis of proteins and ATP energy during vegetation restoration, and then limit the growth of plants and soil microorganisms [55,56]. In particular, C. korshinskii, with its nitrogen fixation ability, caused the gradual accumulation of nitrogen during plant growth, whereas the P limitation gradually increased, which affected microbial diversity.
Among the bacterial community, the change in Proteobacteria abundance was the most obvious and was strongly related to the C:P and N:P ratios (Figure 6). This was caused by its own function; for example, Rhizobiales, which is an order of Alphaproteobacteria, has a nitrogen fixation capacity [57], thereby increasing the accumulation of nitrogen in soil and changing the equilibrium of the N:P ratio [2]. Moreover, the growth rate hypothesis [58] holds that most bacterial growth is linked to an increased demand for P by synthetic ribosomal RNA. Actinobacteria had a stronger correlation with the C:N ratio but little correlation with the N:P ratio. The reason may be that Actinobacteria are oligotrophic and their abundance is greater in a nutritionally deficient ecological environment [18]. Therefore, the correlation between the C:N:P stoichiometric ratio and the abundance of Proteobacteria and Actinobacteria emphasizes that C, N, and P components are important for the bacterial community during afforestation.
In contrast, the soil fungal community had less effect on the C:N:P stoichiometric ratio of the plant–soil system compared with the bacterial community (Figure 6), and this relationship was caused by significant differences in the main phyla of the fungal community. There were significant correlations between the three major phyla and the C:N ratio. The reason for these differences was mainly related to the function of fungi. For example, Ascomycetes and Basidiomycota can quickly decompose plant organic residues, and changes in their abundances are affected by the degradation of plant residues [59,60]. Therefore, vegetation restoration can promote the decomposition of plant residues, thereby promoting the accumulation and conversion of C and N [54], and affecting the C:N:P stoichiometric ratio [4].

5. Conclusions

In our study, the disproportionate increase in C, N, and P nutrients led to increased C:P and N:P ratios, and further reflected the phenomenon of P limitation in the soil during vegetation restoration with C. korshinskii. Soil microbial community diversity and composition also changed significantly, but fungi were more adapted to changing environmental conditions than bacteria following afforestation. Together with the C:N:P stoichiometry in the plant–soil–microbe continuum, microbial diversity and composition were largely related to the N:P ratio, suggesting that P limitation in soil may cause imbalances in the C:P and N:P ratios, and further affect microbial growth, particularly bacterial growth. Collectively, these studies help to further clarify how soil microorganisms adapt to changes in resource imbalances in afforested ecosystems.

Supplementary Materials

The following are available online at https://www.mdpi.com/1999-4907/11/8/823/s1, Figure S1: Changes of C, N, and P stoichiometry in leaf (a,b), herb (c,d,e), litter (f), and microbial biomass (g) among different stages of vegetation restoration. Table S1: Relative abundance of the dominant groups of the soil microbial community at the phylum level following afforestation.

Author Contributions

X.Z., X.H., C.R., and G.Y. conceived and designed the experiment. X.Z. and W.L. performed the data analysis and wrote the manuscript. X.Z., Z.Z., Q.Z., and X.W. conducted the sampling, pre-treatment, and experiment work. All authors have read and agreed to the published version of the manuscript.

Funding

This work was financially supported by the National Natural Science Foundation of China (41907031).

Acknowledgments

The authors greatly appreciate the assistance of Xuqiao Lu and Shaojun Wu (Northwest A & F University, China) for conducting the experiments.

Conflicts of Interest

The authors declare no competing financial interest.

References

  1. Deng, J.; Sun, P.S.; Zhao, F.Z.; Han, X.H.; Yang, G.H.; Feng, Y.Z.; Ren, G.X. Soil C, N, P and its stratification ratio affected by artificial vegetation in subsoil, Loess Plateau China. PLoS ONE 2016, 11, e0151446. [Google Scholar] [CrossRef]
  2. Ren, C.J.; Chen, J.; Deng, J.; Zhao, F.Z.; Han, X.H.; Yang, G.H.; Tong, X.G.; Feng, Y.Z.; Shelton, S.; Ren, G.X. Response of microbial diversity to C:N:P stoichiometry in fine root and microbial biomass following afforestation. Biol. Fert. Soils 2017, 53, 457–468. [Google Scholar] [CrossRef]
  3. Zhang, C.; Liu, G.B.; Xue, S.; Song, Z.L. Rhizosphere soil microbial activity under different vegetation types on the Loess Plateau, China. Geoderma 2011, 161, 115–125. [Google Scholar] [CrossRef]
  4. Mooshammer, M.; Wanek, W.; Zechmeister-Boltenstern, S.; Richter, A. Stoichiometric imbalances between terrestrial decomposer communities and their resources: Mechanisms and implications of microbial adaptations to their resources. Front. Microbiol. 2014, 5, 22. [Google Scholar] [CrossRef] [PubMed] [Green Version]
  5. Ren, C.J.; Zhao, F.Z.; Kang, D.; Yang, G.H.; Han, X.H.; Tong, X.G.; Feng, Y.Z.; Ren, G.X. Linkages of C:N:P stoichiometry and bacterial community in soil following afforestation of former farmland. For. Ecol. Manag. 2016, 376, 59–66. [Google Scholar] [CrossRef]
  6. Fanin, N.; Fromin, N.; Buatois, B.; Hattenschwiler, S. An experimental test of the hypothesis of non-homeostatic consumer stoichiometry in a plant litter-microbe system. Ecol. Lett. 2013, 16, 764–772. [Google Scholar] [CrossRef]
  7. Bui, E.N.; Henderson, B.L. C:N:P stoichiometry in Australian soils with respect to vegetation and environmental factors. Plant Soil 2013, 373, 553–568. [Google Scholar] [CrossRef]
  8. Fan, H.B.; Wu, J.P.; Liu, W.F.; Yuan, Y.H.; Hu, L.; Cai, Q.K. Linkages of plant and soil C:N:P stoichiometry and their relationships to forest growth in subtropical plantations. Plant Soil 2015, 392, 127–138. [Google Scholar] [CrossRef]
  9. Güsewell, S. N:P ratios in terrestrial plants: Variation and functional significance. New Phytol. 2004, 164, 243–266. [Google Scholar] [CrossRef]
  10. Richardson, S.J.; Allen, R.B.; Doherty, J.E. Shifts in leaf N:P ratio during resorption reflect soil P in temperate rainforest. Funct. Ecol. 2008, 22, 738–745. [Google Scholar] [CrossRef]
  11. Cao, Y.; Chen, Y.M. Coupling of plant and soil C:N:P stoichiometry in black locust (Robinia pseudoacacia) plantations on the Loess Plateau, China. Trees Struct. Funct. 2017, 31, 1559–1570. [Google Scholar] [CrossRef]
  12. Liu, J.L.; Ha, V.N.; Shen, Z.; Dang, P.; Zhu, H.L.; Zhao, F.; Zhao, Z. Response of the rhizosphere microbial community to fine root and soil parameters following Robinia pseudoacacia L. afforestation. Appl. Soil Ecol. 2018, 132, 11–19. [Google Scholar] [CrossRef]
  13. Chen, Y.L.; Chen, L.Y.; Peng, Y.F.; Ding, J.Z.; Li, F.; Yang, G.B.; Kou, D.; Liu, L.; Fang, K.; Zhang, B.B.; et al. Linking microbial C:N:P stoichiometry to microbial community and abiotic factors along a 3500-km grassland transect on the Tibetan Plateau. Glob. Ecol. Biogeogr. 2016, 25, 1416–1427. [Google Scholar] [CrossRef]
  14. Mao, C.L.; Wang, Y.B.; Wang, X.J.; Ren, G.X.; Yuan, L.Y.; Feng, Y.Z. Correlations between microbial community and C:N:P stoichiometry during the anaerobic digestion process. Energy 2019, 174, 687–695. [Google Scholar] [CrossRef]
  15. Erlacher, A.; Cernava, T.; Cardinale, M.; Soh, J.; Sensen, C.W.; Grube, M.; Berg, G. Rhizobiales as functional and endosymbiontic members in the lichen symbiosis of Lobaria pulmonaria L. Front. Microbiol. 2015, 6, 53. [Google Scholar] [CrossRef] [PubMed]
  16. Zhang, C.; Liu, G.B.; Xue, S.; Wang, G.L. Soil bacterial community dynamics reflect changes in plant community and soil properties during the secondary succession of abandoned farmland in the Loess Plateau. Soil Biol. Biochem. 2016, 97, 40–49. [Google Scholar] [CrossRef]
  17. McCaig, A.E.; Glover, L.A.; Prosser, J.I. Molecular analysis of bacterial community structure and diversity in unimproved and improved upland grass pastures. Appl. Environ. Microbiol. 1999, 65, 1721–1730. [Google Scholar] [CrossRef] [Green Version]
  18. Fierer, N.; Bradford, M.A.; Jackson, R.B. Toward an ecological classification of soil bacteria. Ecology 2007, 88, 1354–1364. [Google Scholar] [CrossRef]
  19. Axelrood, P.E.; Chow, M.L.; Radomski, C.C.; McDermott, J.M.; Davies, J. Molecular characterization of bacterial diversity from British Columbia forest soils subjected to disturbance. Can. J. Microbiol. 2002, 48, 655–674. [Google Scholar] [CrossRef]
  20. Zhong, Z.K.; Wang, X.; Zhang, X.Y.; Zhang, W.; Xu, Y.D.; Ren, C.J.; Han, X.H.; Yang, G.H. Edaphic factors but not plant characteristics mainly alter soil microbial properties along a restoration chronosequence of Pinus tabulaeformis stands on Mt. Ziwuling, China. For. Ecol. Manag. 2019, 453. [Google Scholar] [CrossRef]
  21. Bai, Z.G.; Dent, D. Recent land degradation and improvement in China. Amibo 2009, 38, 150–156. [Google Scholar] [CrossRef] [PubMed]
  22. Fu, B.J.; Chen, L.D.; Ma, K.M.; Zhou, H.F.; Wang, J. The relationships between land use and soil conditions in the hilly area of the loess plateau in northern Shaanxi, China. Catena 2000, 39, 69–78. [Google Scholar] [CrossRef]
  23. Cao, C.Y.; Jiang, D.M.; Teng, X.H.; Jiang, Y.; Liang, W.J.; Cui, Z.B. Soil chemical and microbiological properties along a chronosequence of Caragana microphylla Lam. plantations in the Horqin sandy land of Northeast China. Appl. Soil Ecol. 2008, 40, 78–85. [Google Scholar] [CrossRef]
  24. Jiang, D.M.; Li, Q.; Liu, F.M.; Jiang, Y.; Liang, W.J. Vertical distribution of soil nematodes in an age sequence of Caragana microphylla plantations in the Horqin Sandy Land, Northeast China. Ecol. Res. 2006, 22, 49–56. [Google Scholar] [CrossRef]
  25. Fu, X.L.; Shao, M.A.; Wei, X.R.; Horton, R. Soil organic carbon and total nitrogen as affected by vegetation types in Northern Loess Plateau of China. Geoderma 2010, 155, 31–35. [Google Scholar] [CrossRef]
  26. Zhong, Z.K.; Han, X.H.; Xu, Y.; Zhang, W.; Fu, S.Y.; Liu, W.C.; Ren, C.J.; Yang, G.H.; Ren, G.X. Effects of land use change on organic carbon dynamics associated with soil aggregate fractions on the Loess Plateau, China. Land Degrad. Dev. 2019, 30, 1070–1082. [Google Scholar] [CrossRef]
  27. Zhang, W.; Qiao, W.J.; Gao, D.X.; Dai, Y.Y.; Deng, J.; Yang, G.H.; Han, X.H.; Ren, G.X. Relationship between soil nutrient properties and biological activities along a restoration chronosequence of Pinus tabulaeformis plantation forests in the Ziwuling Mountains, China. Catena 2018, 161, 85–95. [Google Scholar] [CrossRef]
  28. Zhang, C.; Liu, G.B.; Xue, S.; Wang, G.L. Changes in rhizospheric microbial community structure and function during the natural recovery of abandoned cropland on the Loess Plateau, China. Ecol. Eng. 2015, 75, 161–171. [Google Scholar] [CrossRef]
  29. Zhang, C.; Liu, G.B.; Song, Z.L.; Wang, J.; Guo, L. Interactions of soil bacteria and fungi with plants during long-term grazing exclusion in semiarid grasslands. Soil Biol. Biochem. 2018, 124, 47–58. [Google Scholar] [CrossRef]
  30. Kou, M.; Garcia-Fayos, P.; Hu, S.; Jiao, J.Y. The effect of Robinia pseudoacacia afforestation on soil and vegetation properties in the Loess Plateau (China): A chronosequence approach. For. Ecol. Manag. 2016, 375, 146–158. [Google Scholar] [CrossRef]
  31. Vance, E.D.; Brookes, P.C.; Jenkinson, D.S. An extraction method for measuring soil microbial biomass C. Soil Biol. Biochem. 1987, 19, 703–707. [Google Scholar] [CrossRef]
  32. Brookes, P.C.; Landman, A.; Pruden, G.; Jenkinson, D.S. Chloroform fumigation and the release of soil nitrogen: A rapid direct extraction method to measure microbial biomass nitrogen in soil. Soil Biol. Biochem. 1985, 17, 837–842. [Google Scholar] [CrossRef]
  33. Brookes, P.C.; Powlson, D.S.; Jenkinson, D.S. Phosphorus in the soil microbial biomass. Soil Biol. Biochem. 1984, 16, 169–175. [Google Scholar] [CrossRef]
  34. Caporaso, J.G.; Kuczynski, J.; Stombaugh, J.; Bittinger, K.; Bushman, F.D.; Costello, E.K.; Fierer, N.; Pena, A.G.; Goodrich, J.K.; Gordon, J.I.; et al. QIIME allows analysis of high-throughput community sequencing data. Nat. Methods 2010, 7, 335–336. [Google Scholar] [CrossRef] [PubMed] [Green Version]
  35. Biddle, J.F.; Fitz-Gibbon, S.; Schuster, S.C.; Brenchley, J.E.; House, C.H. Metagenomic signatures of the Peru Margin subseafloor biosphere show a genetically distinct environment. Proc. Natl. Acad. Sci. USA 2008, 105, 10583–10588. [Google Scholar] [CrossRef] [PubMed] [Green Version]
  36. Mukherjee, P.K.; Chandra, J.; Retuerto, M.; Sikaroodi, M.; Brown, R.E.; Jurevic, R.; Salata, R.A.; Lederman, M.M.; Gillevet, P.M.; Ghannoum, M.A. Oral mycobiome analysis of HIV-infected patients: Identification of Pichia as an antagonist of opportunistic fungi. PLoS Pathog. 2014, 10, e1003996. [Google Scholar] [CrossRef] [PubMed]
  37. Caporaso, J.G.; Lauber, C.L.; Walters, W.A.; Berg-Lyons, D.; Huntley, J.; Fierer, N.; Owens, S.M.; Betley, J.; Fraser, L.; Bauer, M.; et al. Ultra-high-throughput microbial community analysis on the Illumina HiSeq and MiSeq platforms. ISME J. 2012, 6, 1621–1624. [Google Scholar] [CrossRef] [Green Version]
  38. Wang, Q.K.; Wang, Y.P.; Wang, S.L.; He, T.X.; Liu, L. Fresh carbon and nitrogen inputs alter organic carbon mineralization and microbial community in forest deep soil layers. Soil Biol. Biochem. 2014, 72, 145–151. [Google Scholar] [CrossRef]
  39. Hu, Y.L.; Zeng, D.H.; Ma, X.Q.; Chang, S.X. Root rather than leaf litter input drives soil carbon sequestration after afforestation on a marginal cropland. For. Ecol. Manag. 2016, 362, 38–45. [Google Scholar] [CrossRef]
  40. Lai, Z.R.; Zhang, Y.Q.; Liu, J.B.; Wu, B.; Qin, S.G.; Fa, K.Y. Fine-root distribution, production, decomposition, and effect on soil organic carbon of three revegetation shrub species in northwest China. For. Ecol. Manag. 2016, 359, 381–388. [Google Scholar] [CrossRef]
  41. Fan, J.; Wang, J.Y.; Hu, X.F.; Chen, F.S. Seasonal dynamics of soil nitrogen availability and phosphorus fractions under urban forest remnants of different vegetation communities in Southern China. Urban For. Urban Green. 2014, 13, 576–585. [Google Scholar] [CrossRef]
  42. Zhu, H.H.; He, X.Y.; Wang, K.L.; Su, Y.R.; Wu, J.S. Interactions of vegetation succession, soil bio-chemical properties and microbial communities in a Karst ecosystem. Eur. J. Soil Biol. 2012, 51, 1–7. [Google Scholar] [CrossRef]
  43. Zhao, F.Z.; Kang, D.; Han, X.H.; Yang, G.H.; Yang, G.H.; Feng, Y.Z.; Ren, G.X. Soil stoichiometry and carbon storage in long-term afforestation soil affected by understory vegetation diversity. Ecol. Eng. 2015, 74, 415–422. [Google Scholar] [CrossRef]
  44. Zhang, C.; Xue, S.; Liu, G.B.; Song, Z.L. A comparison of soil qualities of different revegetation types in the Loess Plateau, China. Plant Soil 2011, 347, 163–178. [Google Scholar] [CrossRef]
  45. O’Dea, J.K.; Jones, C.A.; Zabinski, C.A.; Miller, P.R.; Keren, I.N. Legume, cropping intensity, and N-fertilization effects on soil attributes and processes from an eight-year-old semiarid wheat system. Nutr. Cycl. Agroecosyst. 2015, 102, 179–194. [Google Scholar] [CrossRef] [Green Version]
  46. Walker, T.W.; Syers, J.K. The fate of phosphorus during pedogenesis. Geoderma 1976, 15, 1–19. [Google Scholar] [CrossRef]
  47. Vance, C.P. Symbiotic nitrogen fixation and phosphorus acquisition. Plant nutrition in a world of declining renewable resources. Plant Physiol. 2001, 127, 390–397. [Google Scholar] [CrossRef]
  48. Siles, J.A.; Margesin, R. Abundance and diversity of bacterial, archaeal, and fungal communities along an altitudinal gradient in alpine forest soils: What are the driving factors? Microb. Ecol. 2016, 72, 207–220. [Google Scholar] [CrossRef] [Green Version]
  49. Zhao, F.Z.; Bai, L.; Wang, J.Y.; Deng, J.; Ren, C.J.; Han, X.H.; Yang, G.H.; Wang, J. Change in soil bacterial community during secondary succession depend on plant and soil characteristics. Catena 2019, 173, 246–252. [Google Scholar] [CrossRef]
  50. Liu, L.; Gundersen, P.; Zhang, W.; Zhang, T.; Chen, H.; Mo, J. Effects of nitrogen and phosphorus additions on soil microbial biomass and community structure in two reforested tropical forests. Sci. Rep. 2015, 5, 14378. [Google Scholar] [CrossRef]
  51. Xiang, X.J.; Shi, Y.; Yang, J.; Kong, J.J.; Lin, X.G.; Zhang, H.Y.; Zeng, J.; Chu, H.Y. Rapid recovery of soil bacterial communities after wildfire in a Chinese boreal forest. Sci. Rep. 2014, 4, 3829. [Google Scholar] [CrossRef] [PubMed] [Green Version]
  52. Han, X.M.; Wang, R.Q.; Liu, J.; Wang, M.C.; Zhou, J.; Guo, W.H. Effects of vegetation type on soil microbial community structure and catabolic diversity assessed by polyphasic methods in North China. J. Environ. Sci. 2007, 19, 1228–1234. [Google Scholar] [CrossRef]
  53. Clemmensen, K.E.; Bahr, A.; Ovaskainen, O.; Dahlberg, A.; Ekblad, A.; Wallander, H.; Stenlid, J.; Finlay, R.D.; Wardle, D.A.; Lindahl, B.D. Roots and associated fungi drive long-term carbon sequestration in boreal forest. Science 2013, 339, 1615–1618. [Google Scholar] [CrossRef] [PubMed]
  54. Stursova, M.; Zifcakova, L.; Leigh, M.B.; Burgess, R.; Baldrian, P. Cellulose utilization in forest litter and soil: Identification of bacterial and fungal decomposers. FEMS Microbiol. Ecol. 2012, 80, 735–746. [Google Scholar] [CrossRef]
  55. Elser, J.J.; Acharya, K.; Kyle, M.; Cotner, J.; Makino, W.; Markow, T.; Watts, T.; Hobbie, S.; Fagan, W.; Schade, J.; et al. Growth rate-stoichiometry couplings in diverse biota. Ecol. Lett. 2003, 6, 936–943. [Google Scholar] [CrossRef] [Green Version]
  56. Pii, Y.; Mimmo, T.; Tomasi, N.; Terzano, R.; Cesco, S.; Crecchio, C. Microbial interactions in the rhizosphere: Beneficial influences of plant growth-promoting rhizobacteria on nutrient acquisition process. A review. Biol. Fertil. Soils 2015, 51, 403–415. [Google Scholar] [CrossRef]
  57. Van der Heijden, M.G.A.; Bardgett, R.D.; van Straalen, N.M. The unseen majority: Soil microbes as drivers of plant diversity and productivity in terrestrial ecosystems. Ecol. Lett. 2008, 11, 296–310. [Google Scholar] [CrossRef]
  58. Elser, J.J.; Dobberfuhl, D.R.; MacKay, N.A.; Schampel, J.H. Organism size, life history, and N:P stoichiometry. BioScience 1996, 46, 674–684. [Google Scholar] [CrossRef] [Green Version]
  59. Bastida, F.; Hernández, T.; Albaladejo, J.; García, C. Phylogenetic and functional changes in the microbial community of long-term restored soils under semiarid climate. Soil Biol. Biochem. 2013, 65, 12–21. [Google Scholar] [CrossRef]
  60. Hannula, S.E.; Boschker, H.T.; de Boer, W.; van Veen, J.A. 13C pulse-labeling assessment of the community structure of active fungi in the rhizosphere of a genetically starch-modified potato (Solanum tuberosum) cultivar and its parental isoline. New Phytol. 2012, 194, 784–799. [Google Scholar] [CrossRef]
Figure 1. Changes of C, N, and P stoichiometry in leaf (a), litter (b,c), soil (d,e,f), and microbial biomass (g,h) among different stages of vegetation restoration. Error bars indicate the standard errors of the means. Means with different lowercase letters indicate significant differences among different stages of vegetation restoration based on one-way ANOVA followed by an LSD test (p < 0.05).
Forests 11 00823 g001
Figure 2. The alpha diversity of soil bacterial and fungal communities among different stages of vegetation restoration. Error bars indicate the standard errors of the means. Means with different lowercase letters indicate significant differences among different stages of vegetation restoration based on one-way ANOVA followed by an LSD test (p < 0.05).
Forests 11 00823 g002
Figure 3. Non-metric multi-dimensional scaling analysis (NMDS) of the beta diversity of soil bacterial (a) and fungal (b) communities based on Bray–Curtis distances among different stages of vegetation restoration.
Forests 11 00823 g003
Figure 4. Relative abundance of the dominant groups of soil bacterial (a) and fungal (b) communities at the phylum level. The data for the average relative abundances from three replicates were calculated as the ratio between the abundance of the sequence type and the total number of sequences. All calculations used normalized data. Prot: Proteobacteria; Acti: Actinobacteria; Acid: Acidobacteria; Chlo: Chloroflexi; Gemm: Gemmatimonadetes; Nitr: Nitrospirae; Bact: Bacteroidetes; Verr: Verrucomicrobia; Plan: Planctomycetes; Asco: Ascomycota; Basi: Basidiomycota; Zygo: Zygomycota.
Forests 11 00823 g004
Figure 5. Spearman’s rank correlation coefficient between the alpha (Shannon Index) and beta diversities (NMDS1) of microbial communities, the C:N:P stoichiometric ratio in plant, soil, and microbial biomass. * & ** Significant at p < 0.05 and p < 0.01, respectively.
Forests 11 00823 g005
Figure 6. Ordination plots of the results from the redundancy analysis (RDA) to explore the relationships between the C:N:P stoichiometric ratio (red arrows) and the abundance of soil bacterial (black arrows) and fungal (purple arrows) communities at the phylum level. SOC: soil organic carbon; TN: total nitrogen; TP: total phosphorus; MBC: microbial biomass carbon; MBN: microbial biomass nitrogen; MBP: microbial biomass phosphorus. Prot: Proteobacteria; Acti: Actinobacteria; Acid: Acidobacteria; Chlo: Chloroflexi; Gemm: Gemmatimonadetes; Nitr: Nitrospirae; Bact: Bacteroidetes; Verr: Verrucomicrobia; Plan: Planctomycetes; Asco: Ascomycota; Basi: Basidiomycota; Zygo: Zygomycota.
Forests 11 00823 g006
Table 1. Geographical features and soil physical properties at different stages of vegetation restoration.
Restoration Stages AGeographical CoordinatesElevation (m)Slope Gradient (°)Slope Aspect (°) BCrown Density (%) CUnderstory Coverage (%) CClay Content (%)Silt Content (%)Sand Content (%)SBD (g·m−3)SWC (%)pH
FL36°51′54.6″ N, 109°21′4.9″ E1205.015.4NbyW75--20.49 (0.66) a45.59 (1.01) b33.92 (0.39)1.30 (0.00) a9.77 (0.05) c8.24 (0.05)
CK1736°44′25.1″ N, 109°15′41.0″ E1280.038.5SbyW63436018.83 (0.45) b46.58 (0.85) b34.59 (0.43)1.21 (0.02) b10.30 (0.44) bc8.17 (0.01)
CK3236°51′55.5″ N, 109°21′0.9″ E1259.835.7SbyW47557517.51 (0.30) b51.48 (2.04) ab31.01 (1.74)1.12 (0.02) c11.66 (0.43) ab8.18 (0.15)
CK4236°52′11.7″ N, 109°21′0.2″ E1307.839.1NbyE85627015.74 (0.09) c55.27 (2.97) a29.00 (2.99) NS1.04 (0.02) d12.97 (0.61) a8.07 (0.01) NS
A FL: farmland; CK17, CK32, and CK42 mean that the Caragana korshinskii plantations had been restored for approximately 17 years, 32 years, and 42 years, respectively. B NbyW, SbyW, and NbyE represent north by west, south by west, and north by east, respectively. C Crown density and understory coverage in farmland were not considered because the farmland was harvested. The crown density and understory coverage were taken as the average percentage of ground surface covered by the shadow of the foliage and understory vegetation species in each quadrat, respectively. SBD: soil bulk density; SWC: soil water content. The values are represented as the mean values followed by standard errors in parentheses (n = 3). Lowercase letters indicate a significant difference at the 0.05 (p < 0.05) level at different stages of vegetation restoration for the individual variables based on a one-way ANOVA followed by an LSD test. NS = not significant (p > 0.05).
Table 2. The C, N, and P contents in leaf, herb, litter, soil, and microbial biomass at different stages of vegetation restoration.
VariablesRestoration Stages A
FL BCK17CK32CK42
Leaf OC (g·kg−1)-427.63 (29.45)438.80 (13.31)475.61 (4.95) NS
Leaf TN (g·kg−1)-34.93 (0.11)34.15 (0.08)35.48 (1.72) NS
Leaf TP (g·kg−1)-2.03 (0.06)1.99 (0.09)1.92 (0.03) NS
Herb OC (g·kg−1)-422.31 (22.27)432.40 (10.80)434.62 (7.33) NS
Herb TN (g·kg−1)-11.91 (0.77)12.89 (0.99)13.67 (0.28) NS
Herb TP (g·kg−1)-1.95 (0.37)1.78 (0.36)1.53 (0.03) NS
Litter OC (g·kg−1)-389.36 (7.04) b413.03 (6.15) b457.72 (6.48) a
Litter TN (g·kg−1)-7.82 (0.88) b12.24 (0.91) a14.83 (1.24) a
Litter TP (g·kg−1)-1.66 (0.21)1.80 (0.14)1.94 (0.14) NS
SOC (g·kg−1)2.98 (0.05) d5.95 (0.33) c7.73 (0.19) b9.28 (0.31) a
TN (g·kg−1)0.34 (0.01) c0.64 (0.05) b0.99 (0.05) a1.03 (0.02) a
TP (g·kg−1)0.46 (0.02)0.50 (0.04)0.50 (0.01)0.52 (0.01) NS
MBC (mg·kg−1)71.69 (2.16) d176.81 (11.71) c323.38 (11.00) b427.29 (13.90) a
MBN (mg·kg−1)6.82 (0.49) c24.48 (3.47) b44.57 (3.23) a52.66 (2.44) a
MBP (mg·kg−1)4.90 (0.18) c8.05 (0.45) b8.60 (0.57) b10.65 (0.35) a
A FL: farmland; CK17, CK32, and CK42 mean that the Caragana korshinskii plantations had been restored for approximately 17 years, 32 years, and 42 years, respectively. B The OC, TN, and TP contents in leaves, herbs, and litter were not taken into account because the farmland was harvested. SOC: soil organic carbon; TN: total nitrogen; TP: total phosphorus; MBC: microbial biomass carbon; MBN: microbial biomass nitrogen; MBP: microbial biomass phosphorus. The values are represented as the mean values followed by standard errors in parentheses (n = 3). Lowercase letters indicate a significant difference at the 0.05 (p < 0.05) level at different stages of vegetation restoration for the individual variables based on a one-way ANOVA followed by an LSD test. NS = not significant (p > 0.05).

