Impacts of Climate Change on Wildfires in Central Asia

Abstract
:1. Introduction
2. Methods
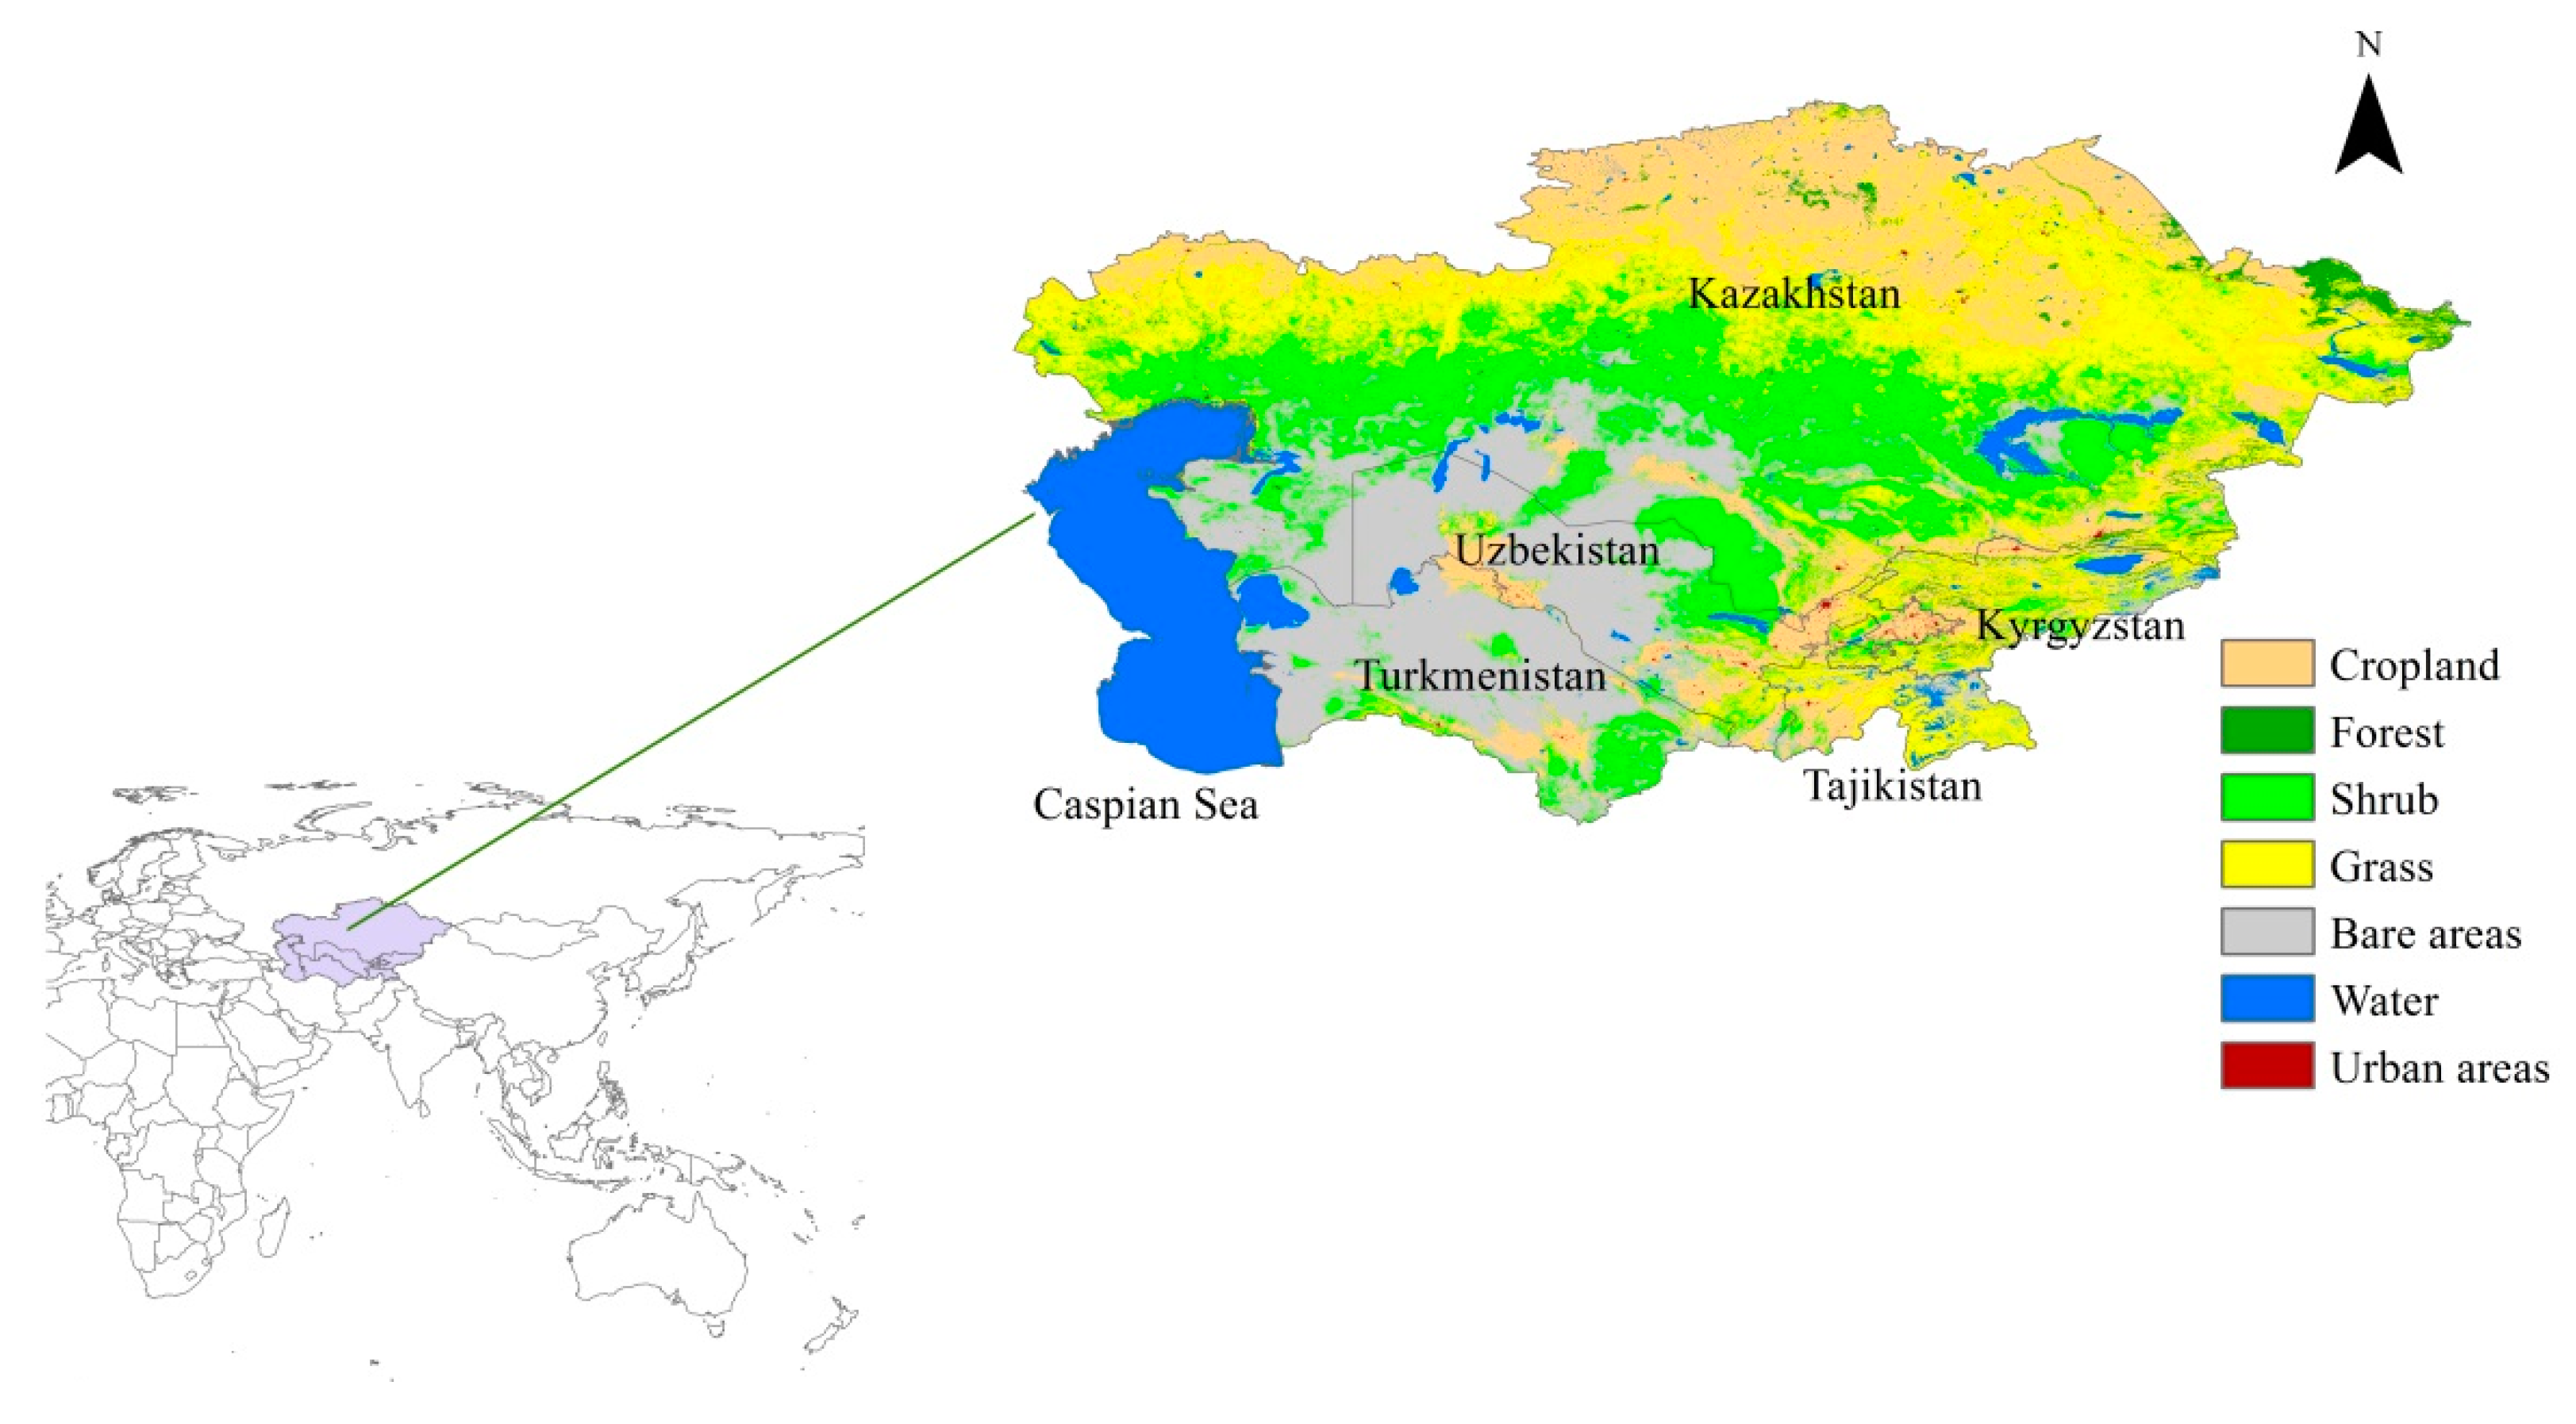
2.1. Study Area
2.2. Data Sources
2.3. Climate Data Processing
2.4. Fire Weather Indices Calculation
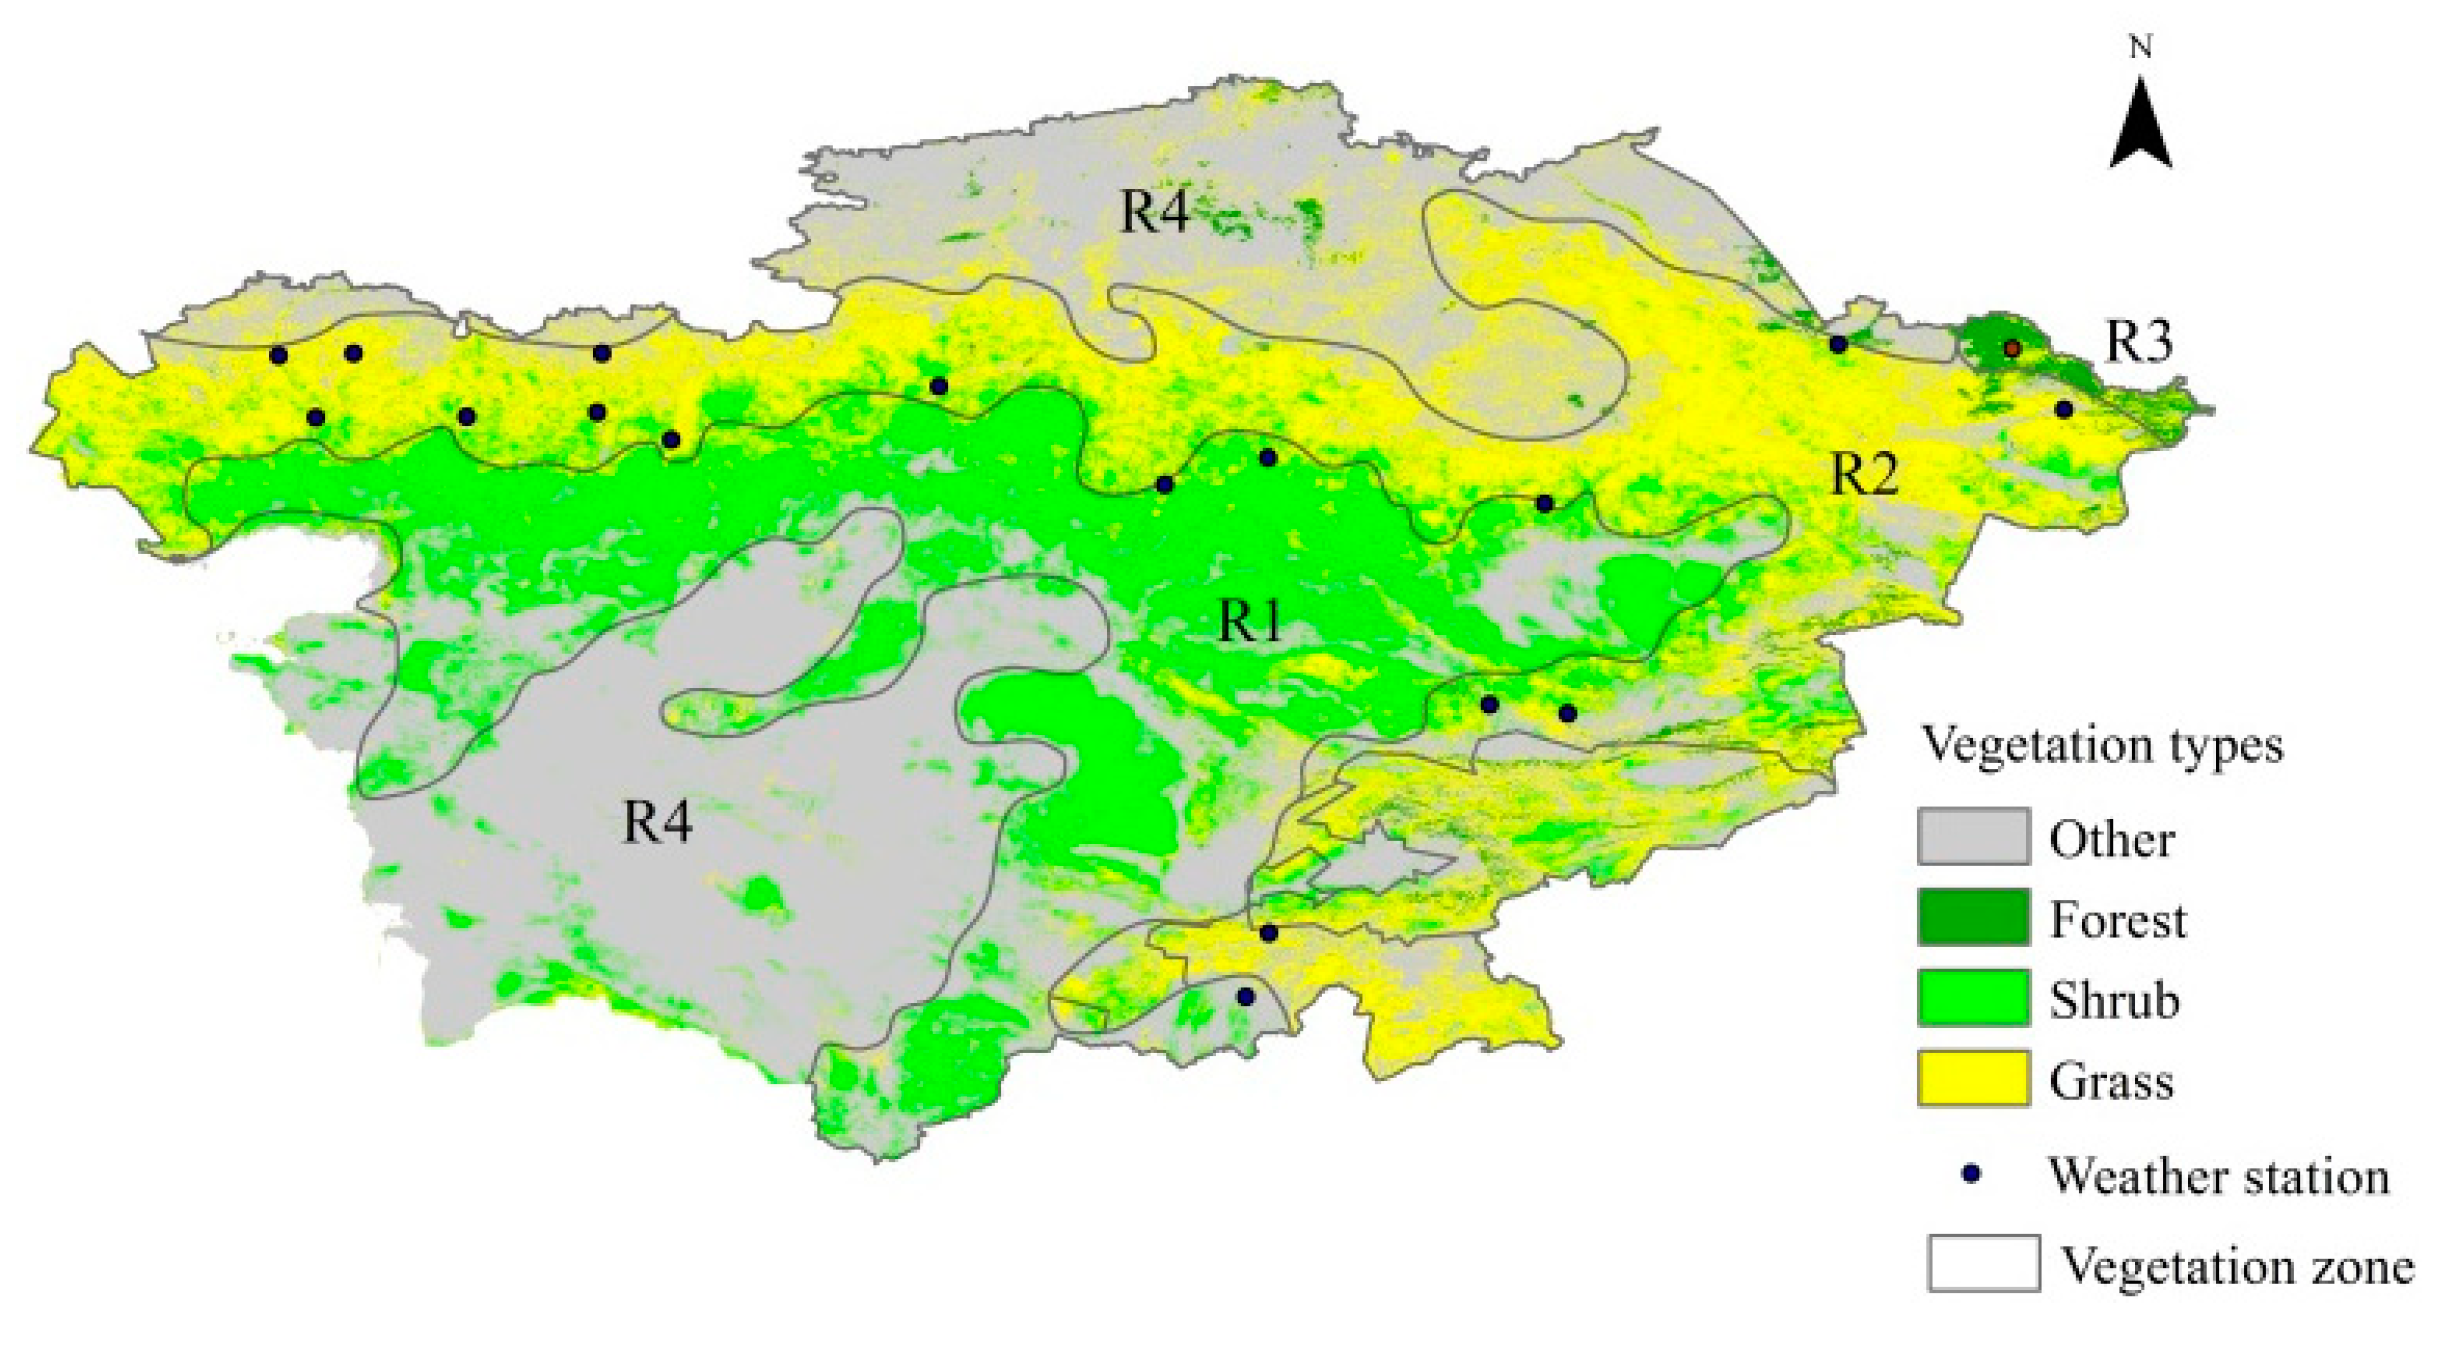
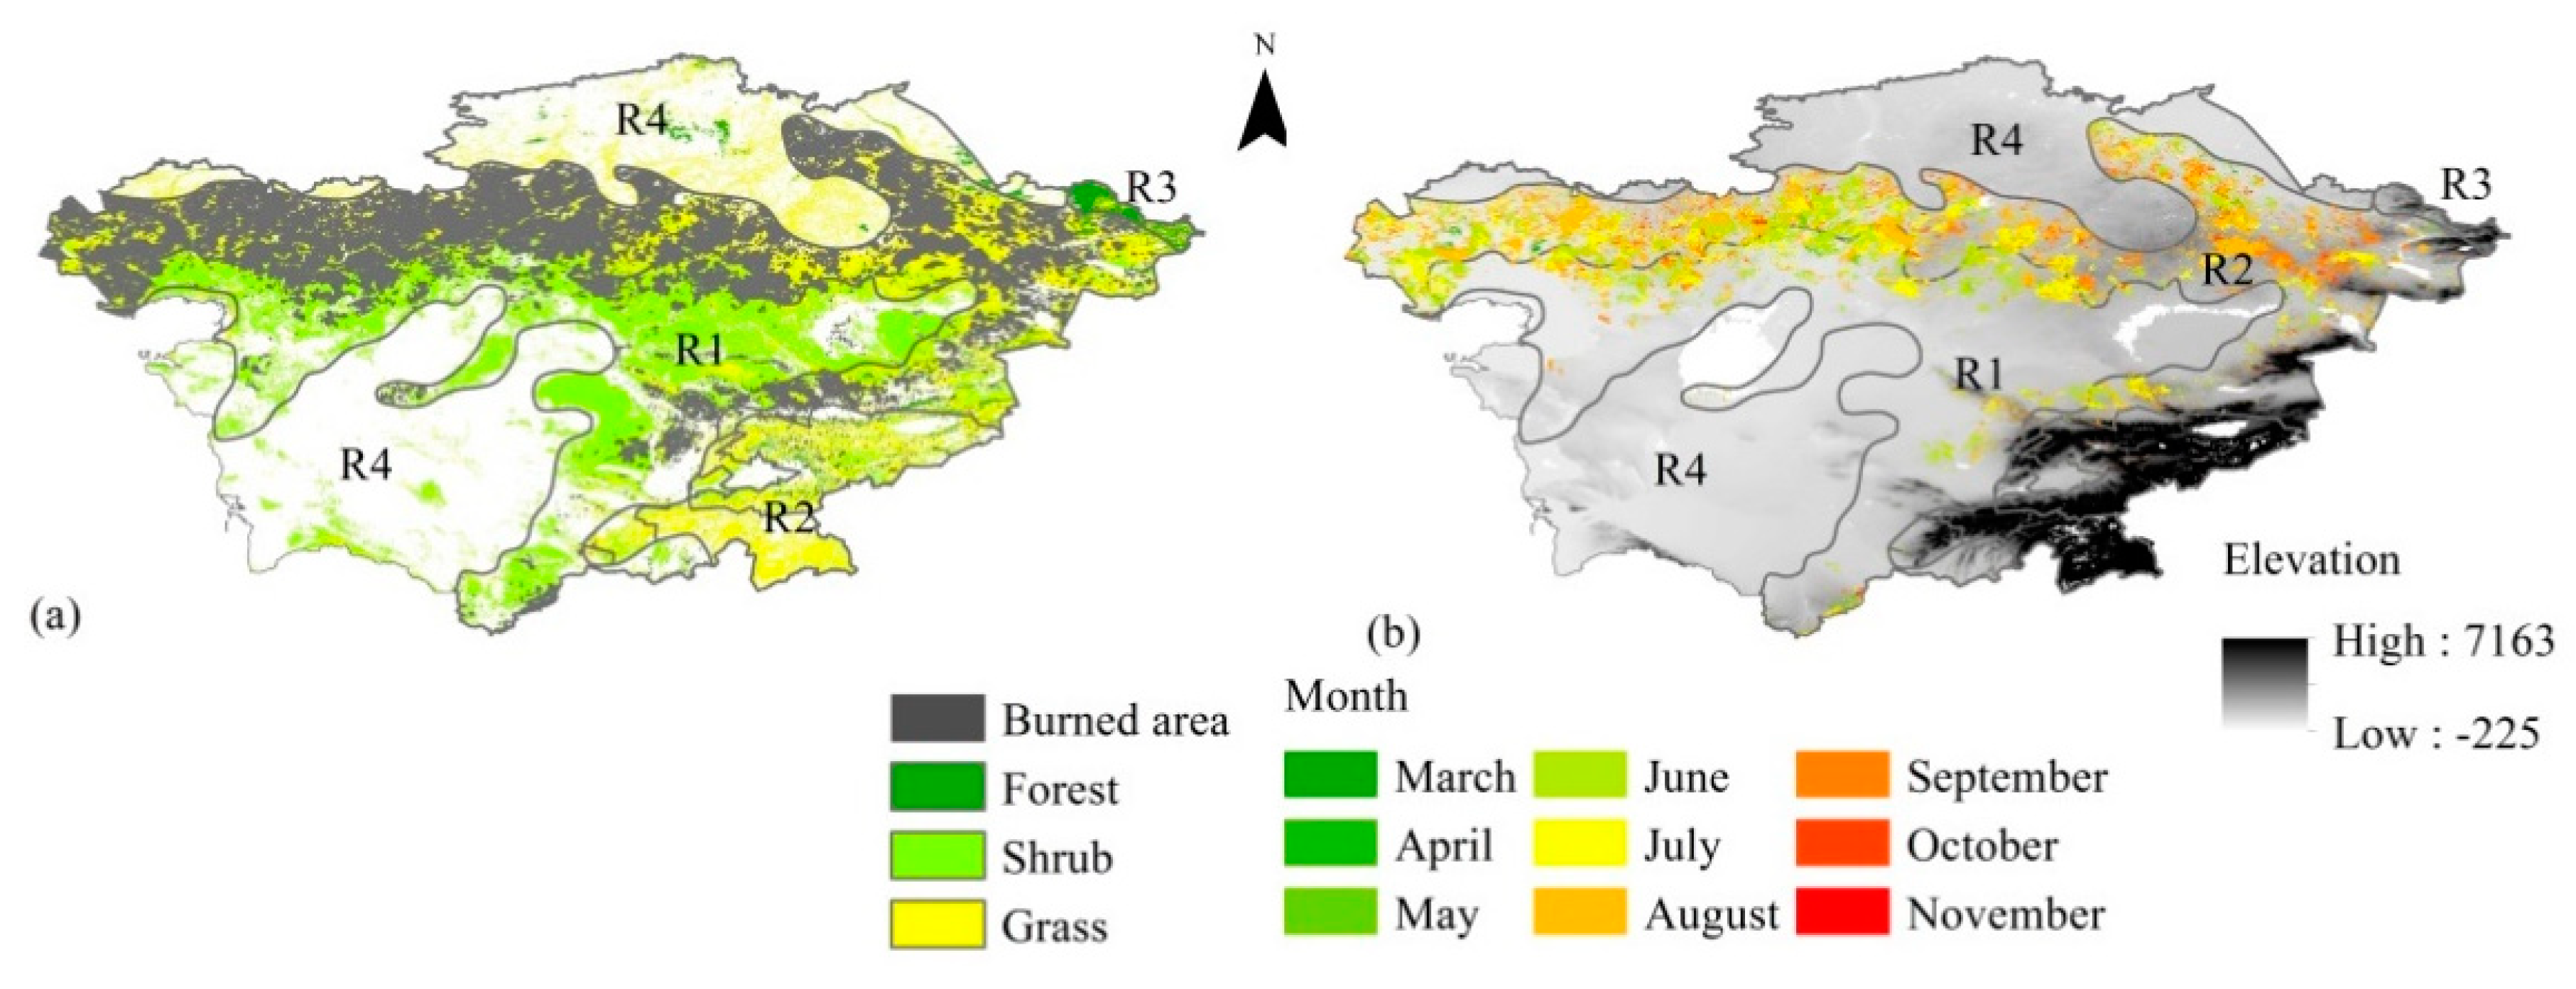
2.5. Vegetation Zone
2.6. Burned Areas
2.7. Data Processing
3. Results
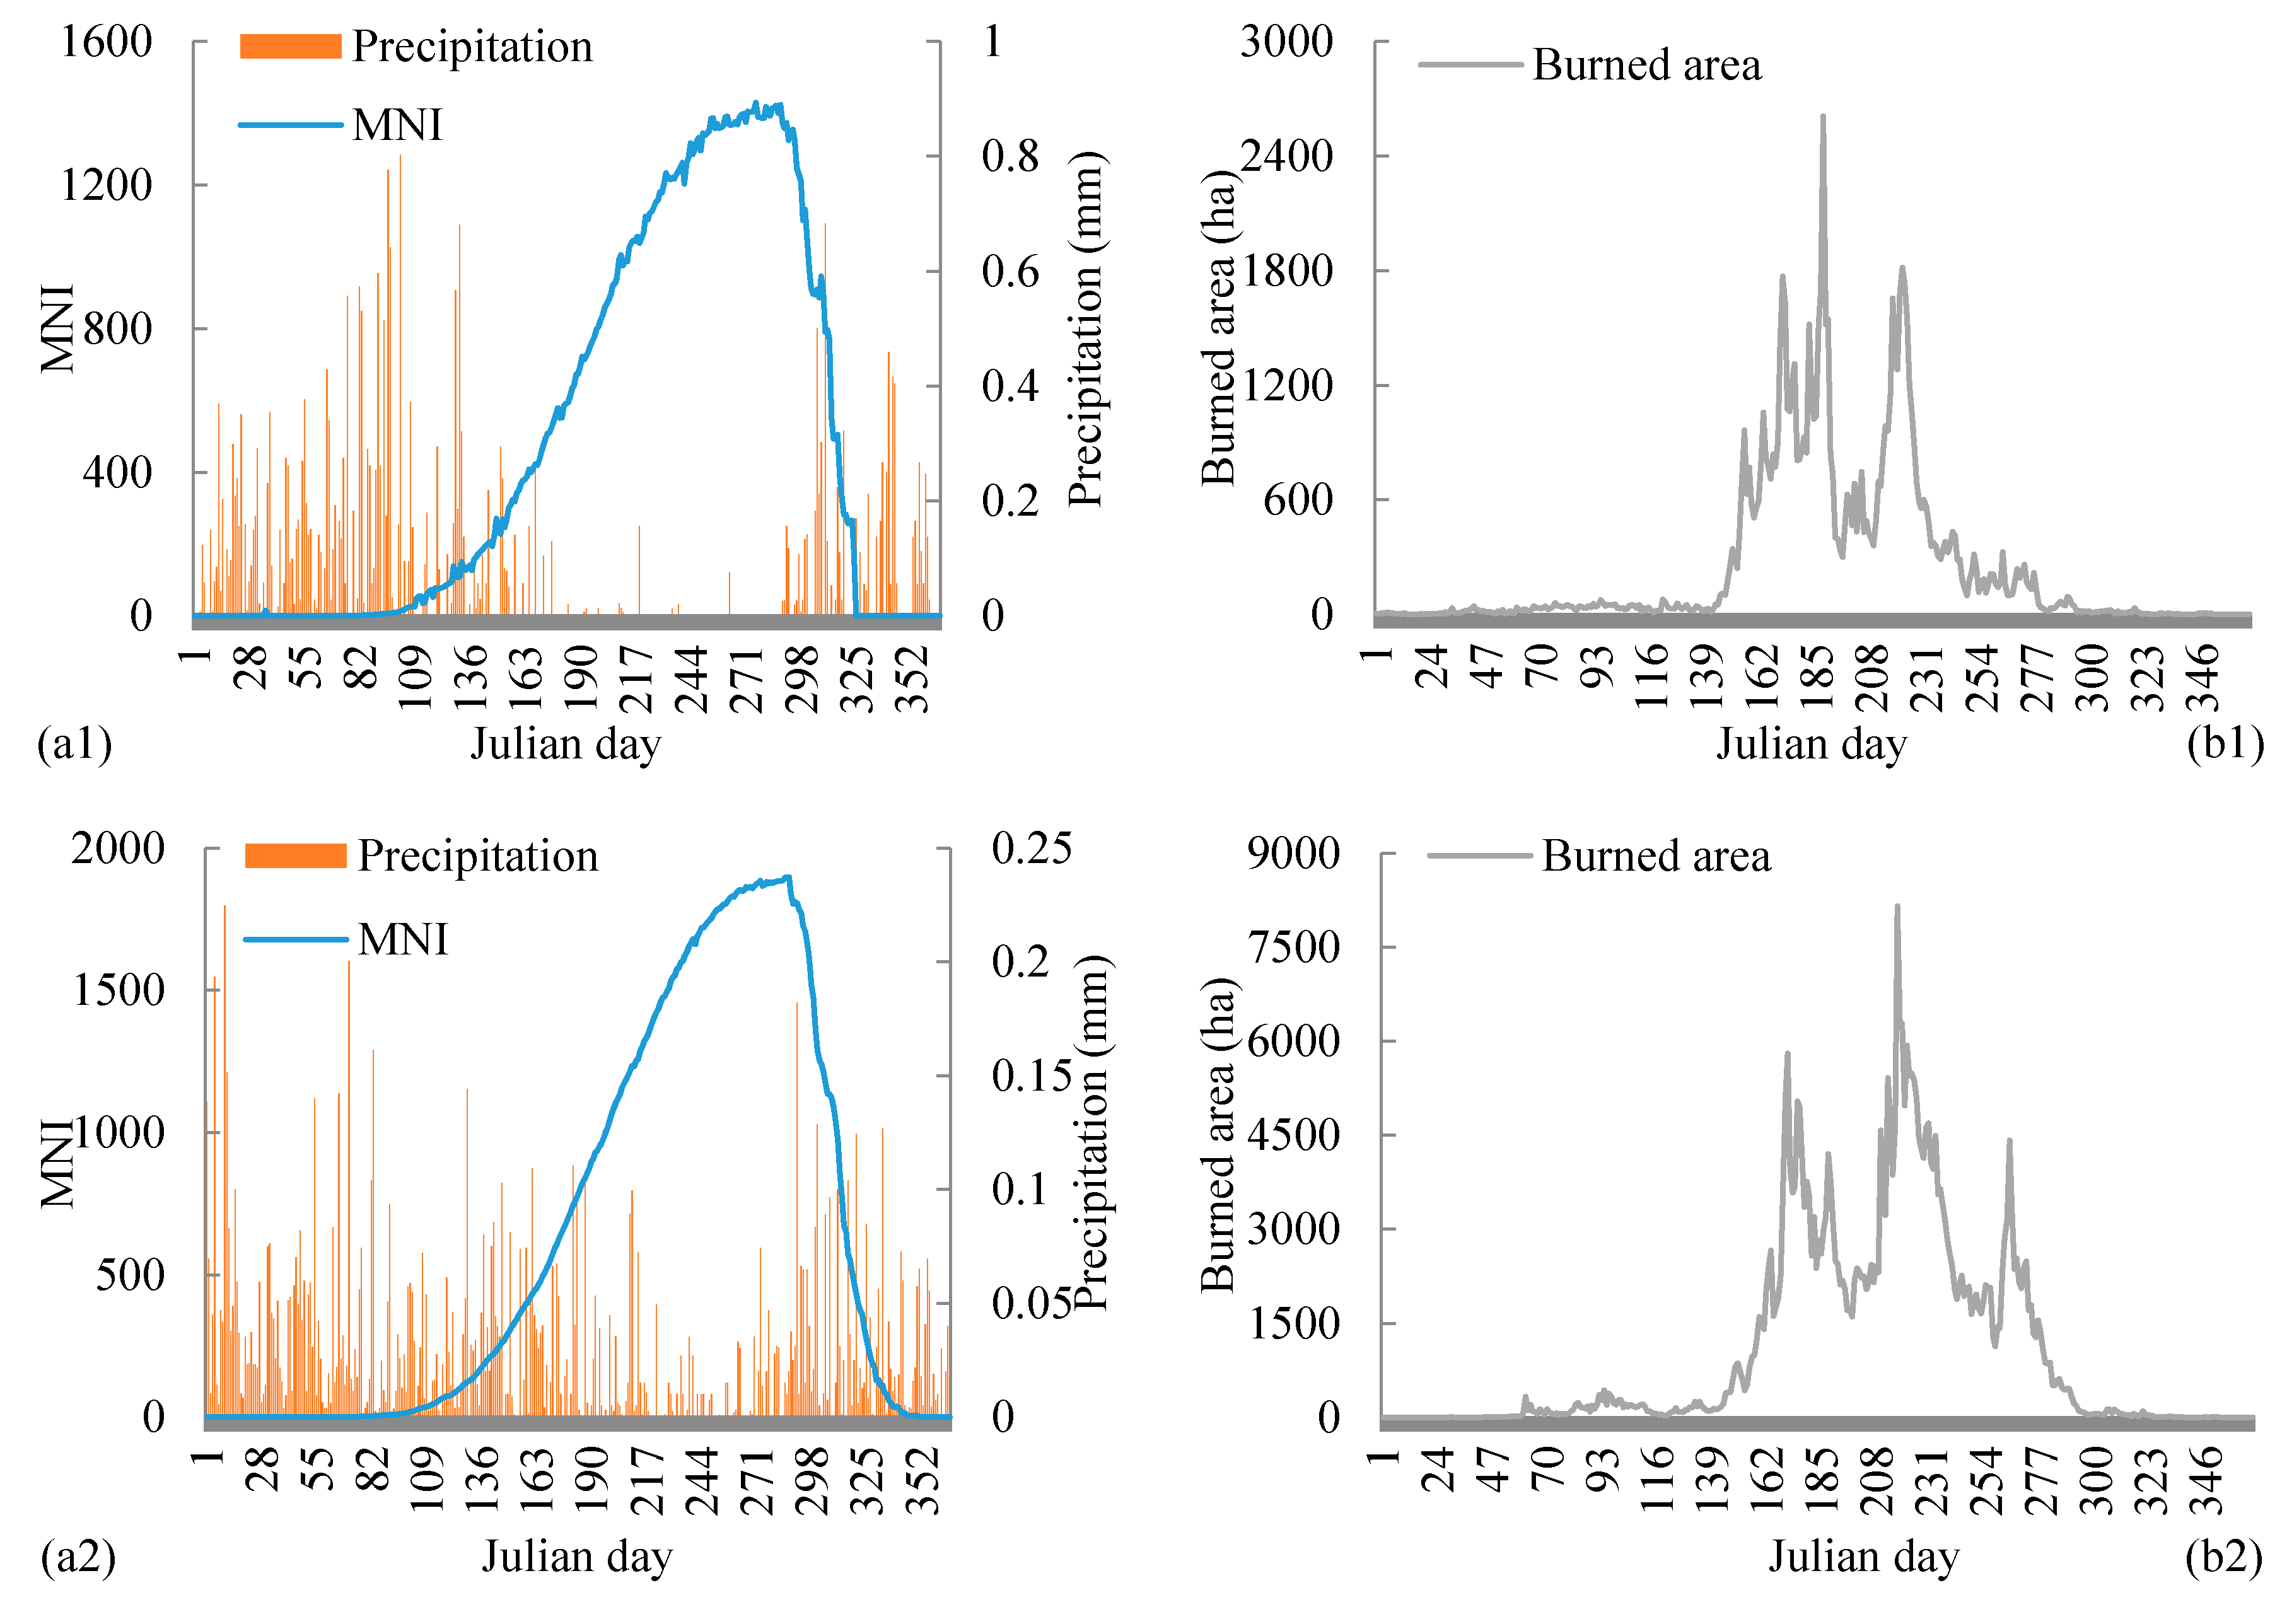
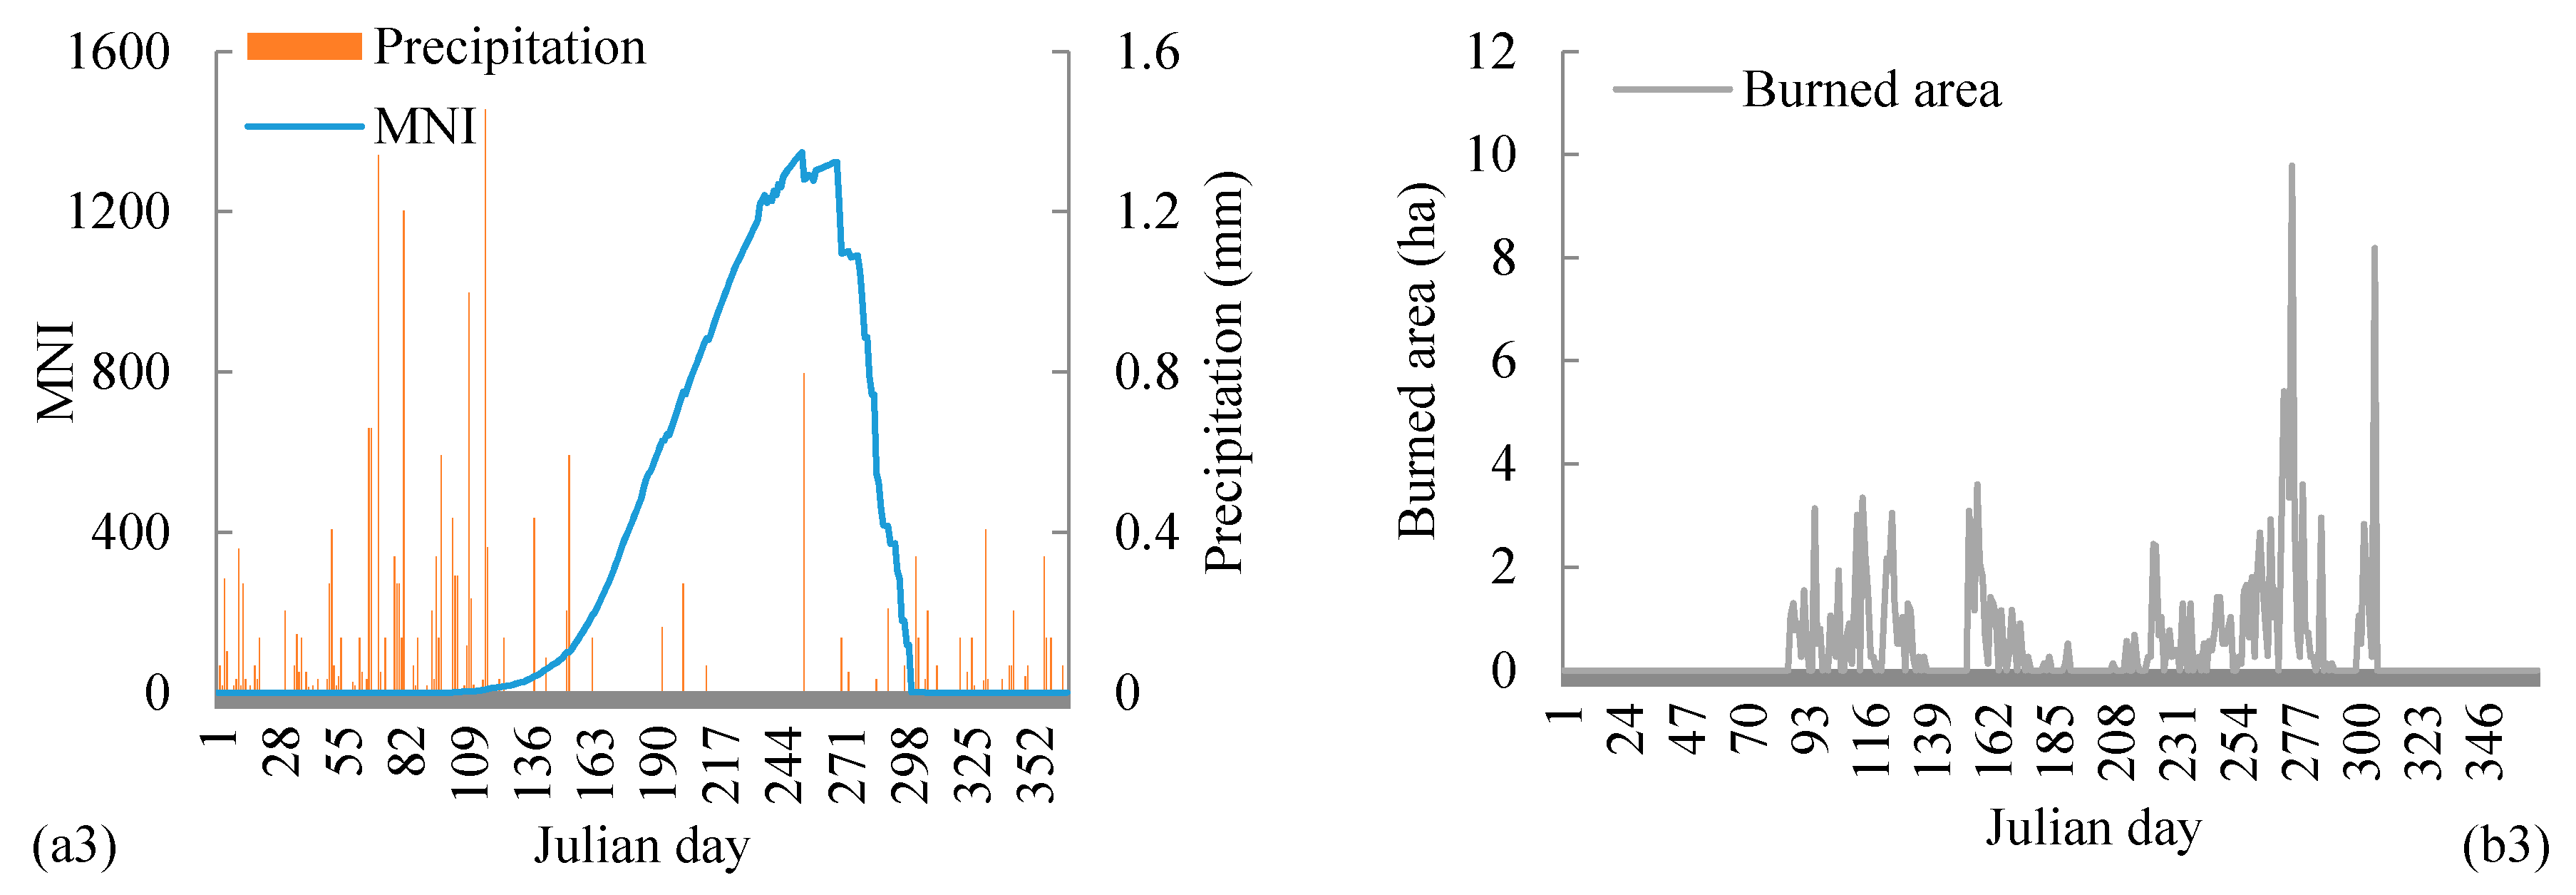
3.1. Fire seasons for Each Vegetation Zone
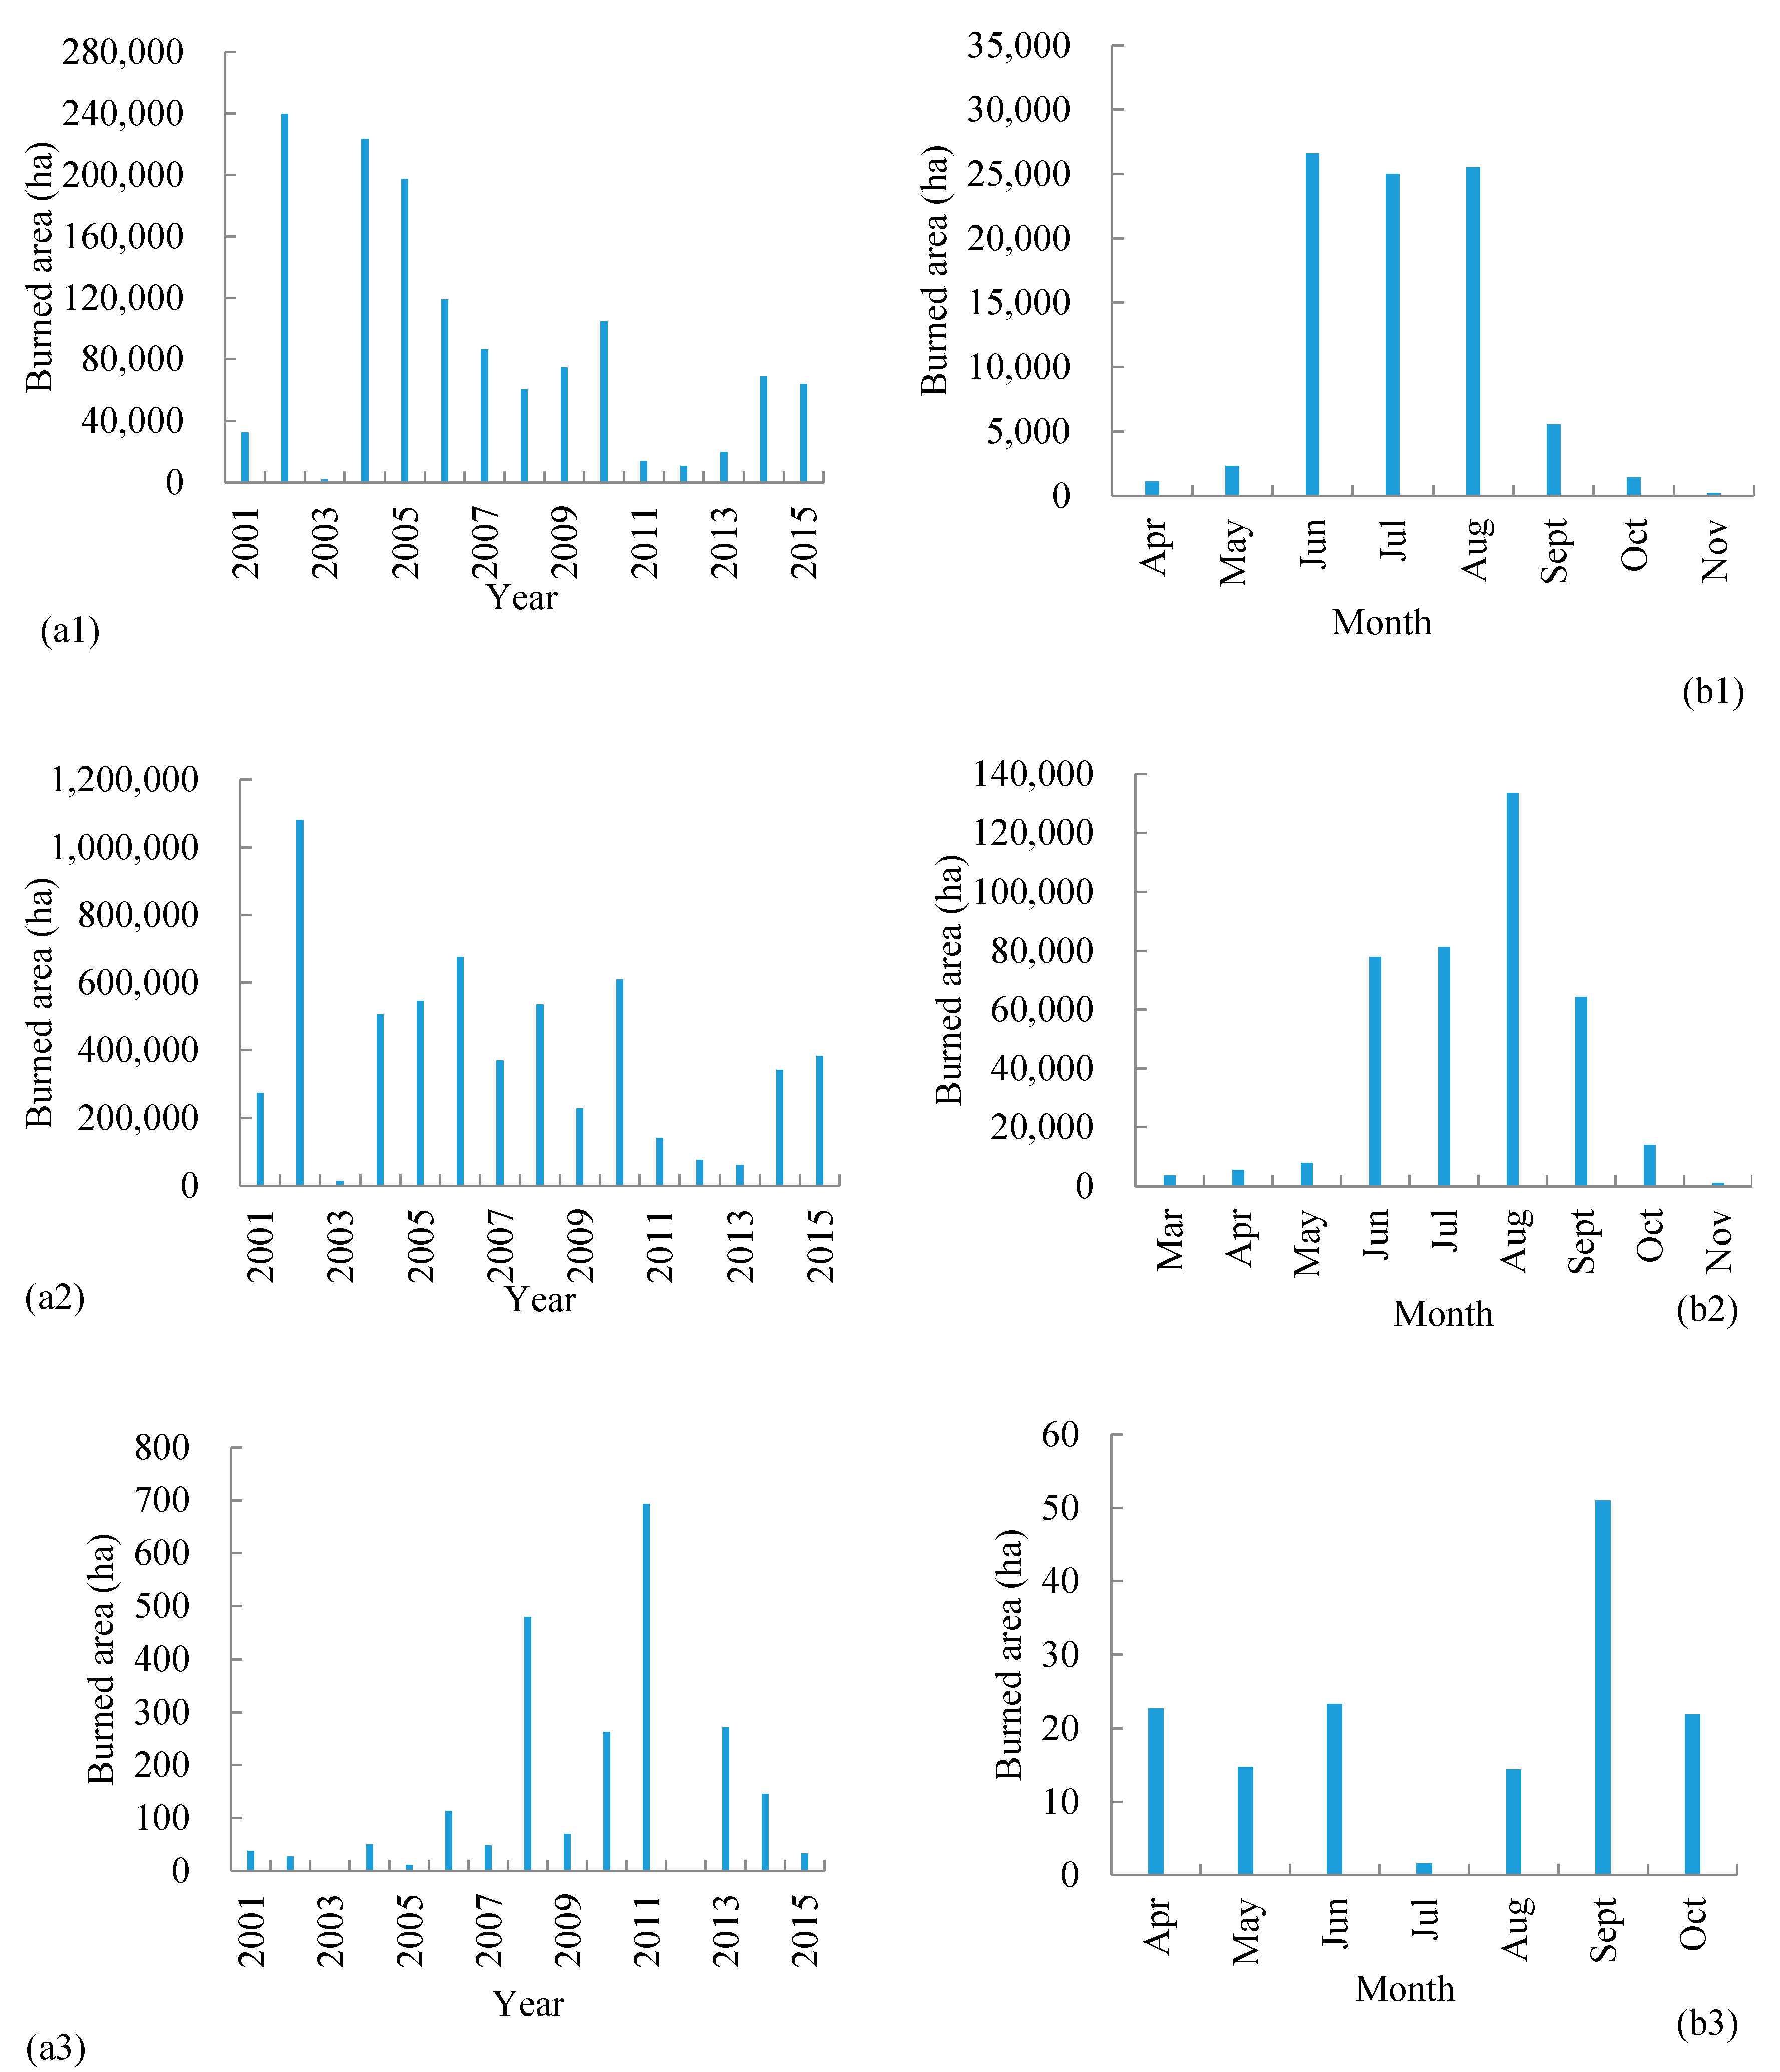
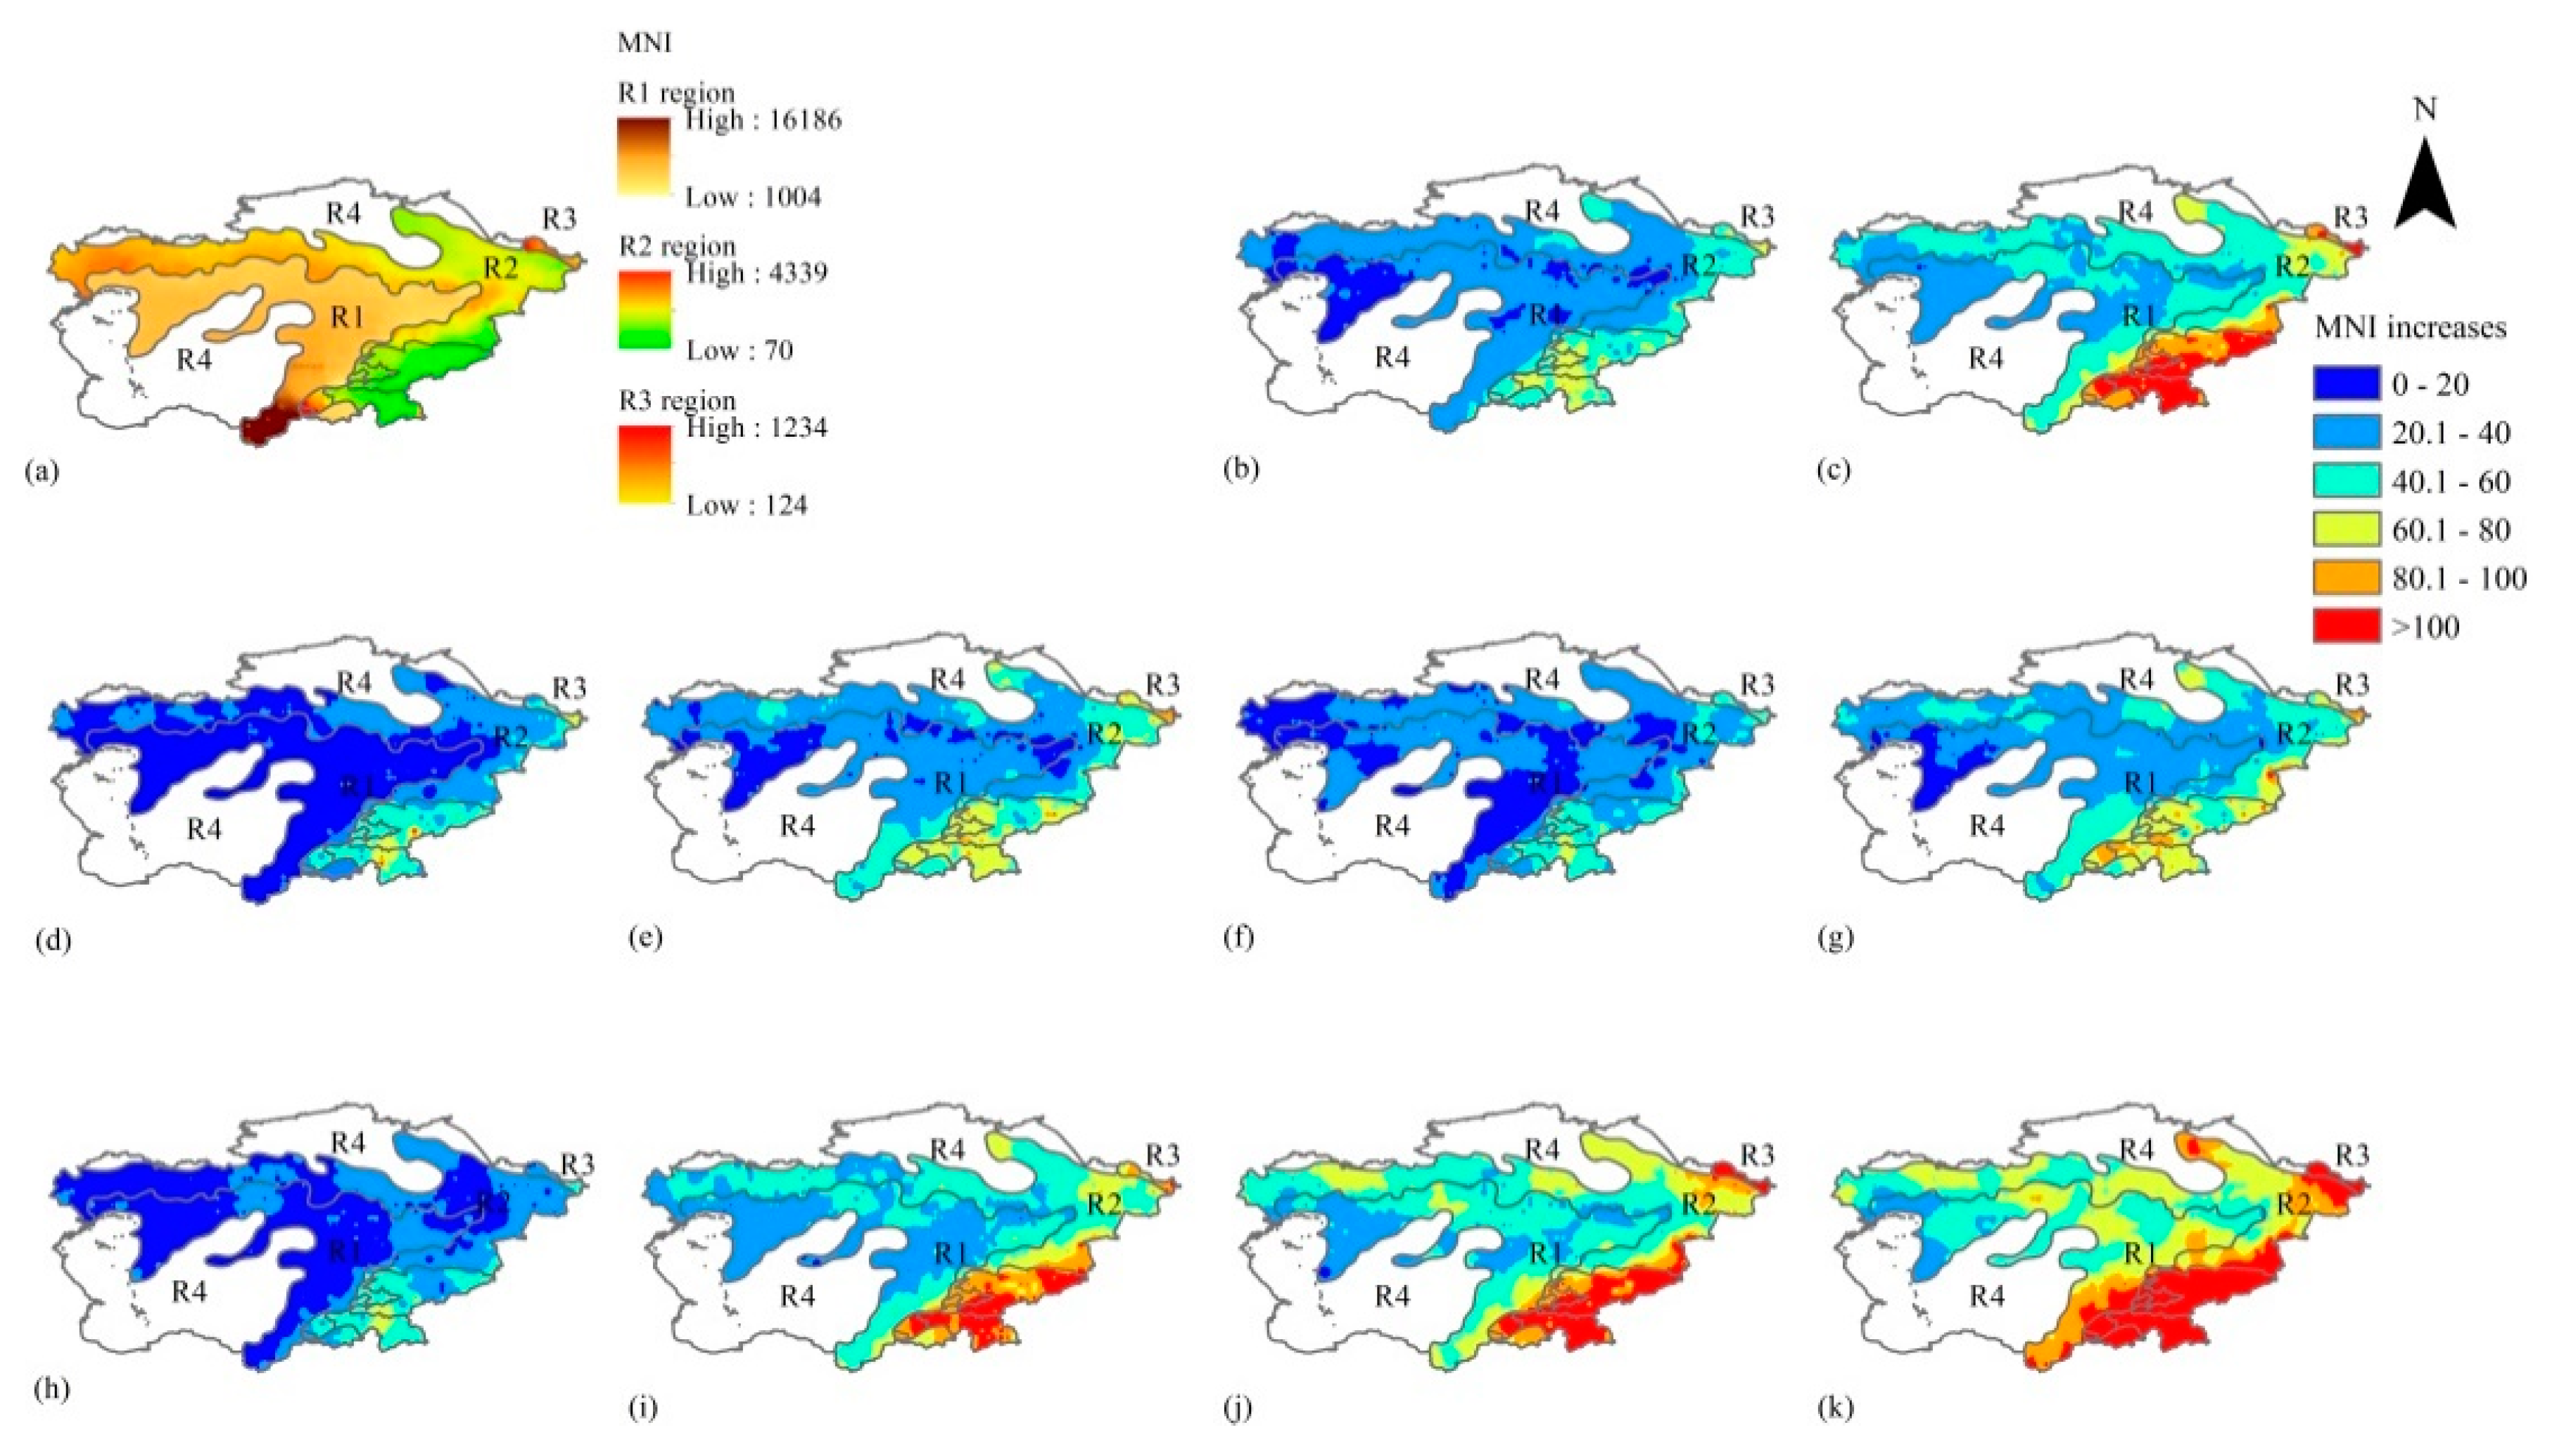
3.2. Distribution of Burned Areas in the 2001–2015 Period
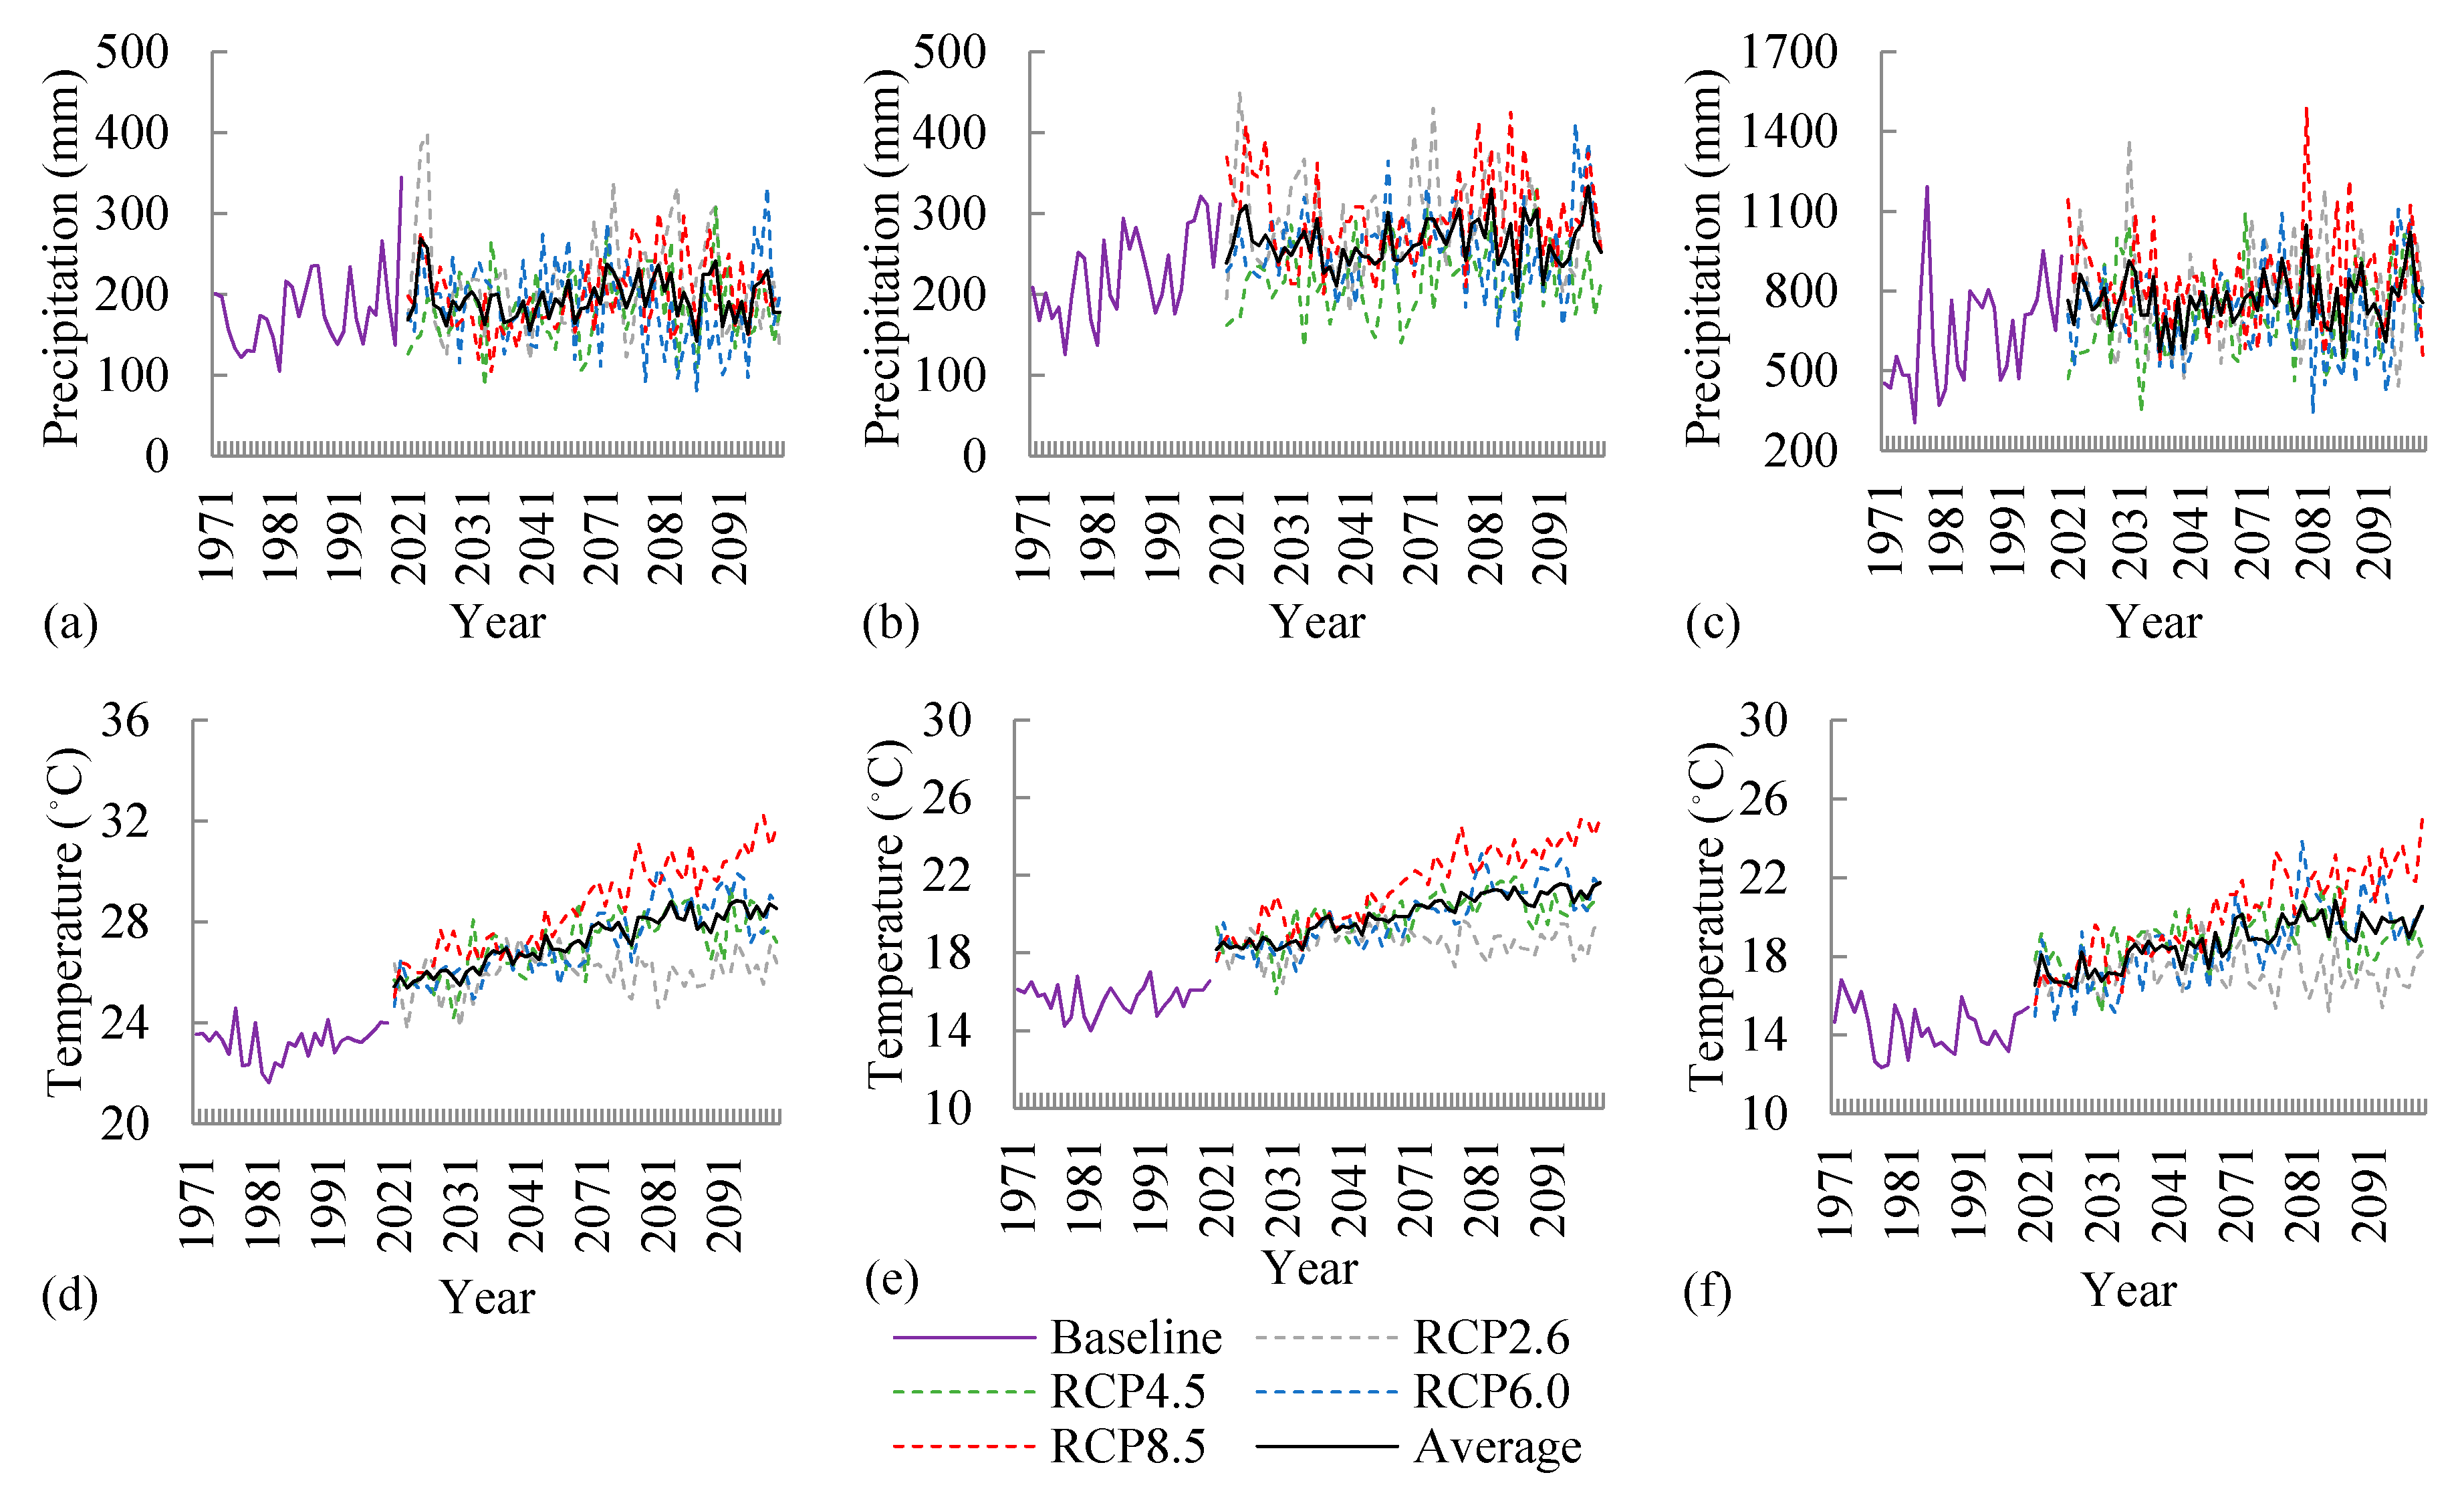
3.3. Climate Change in the 2030s and 2080s
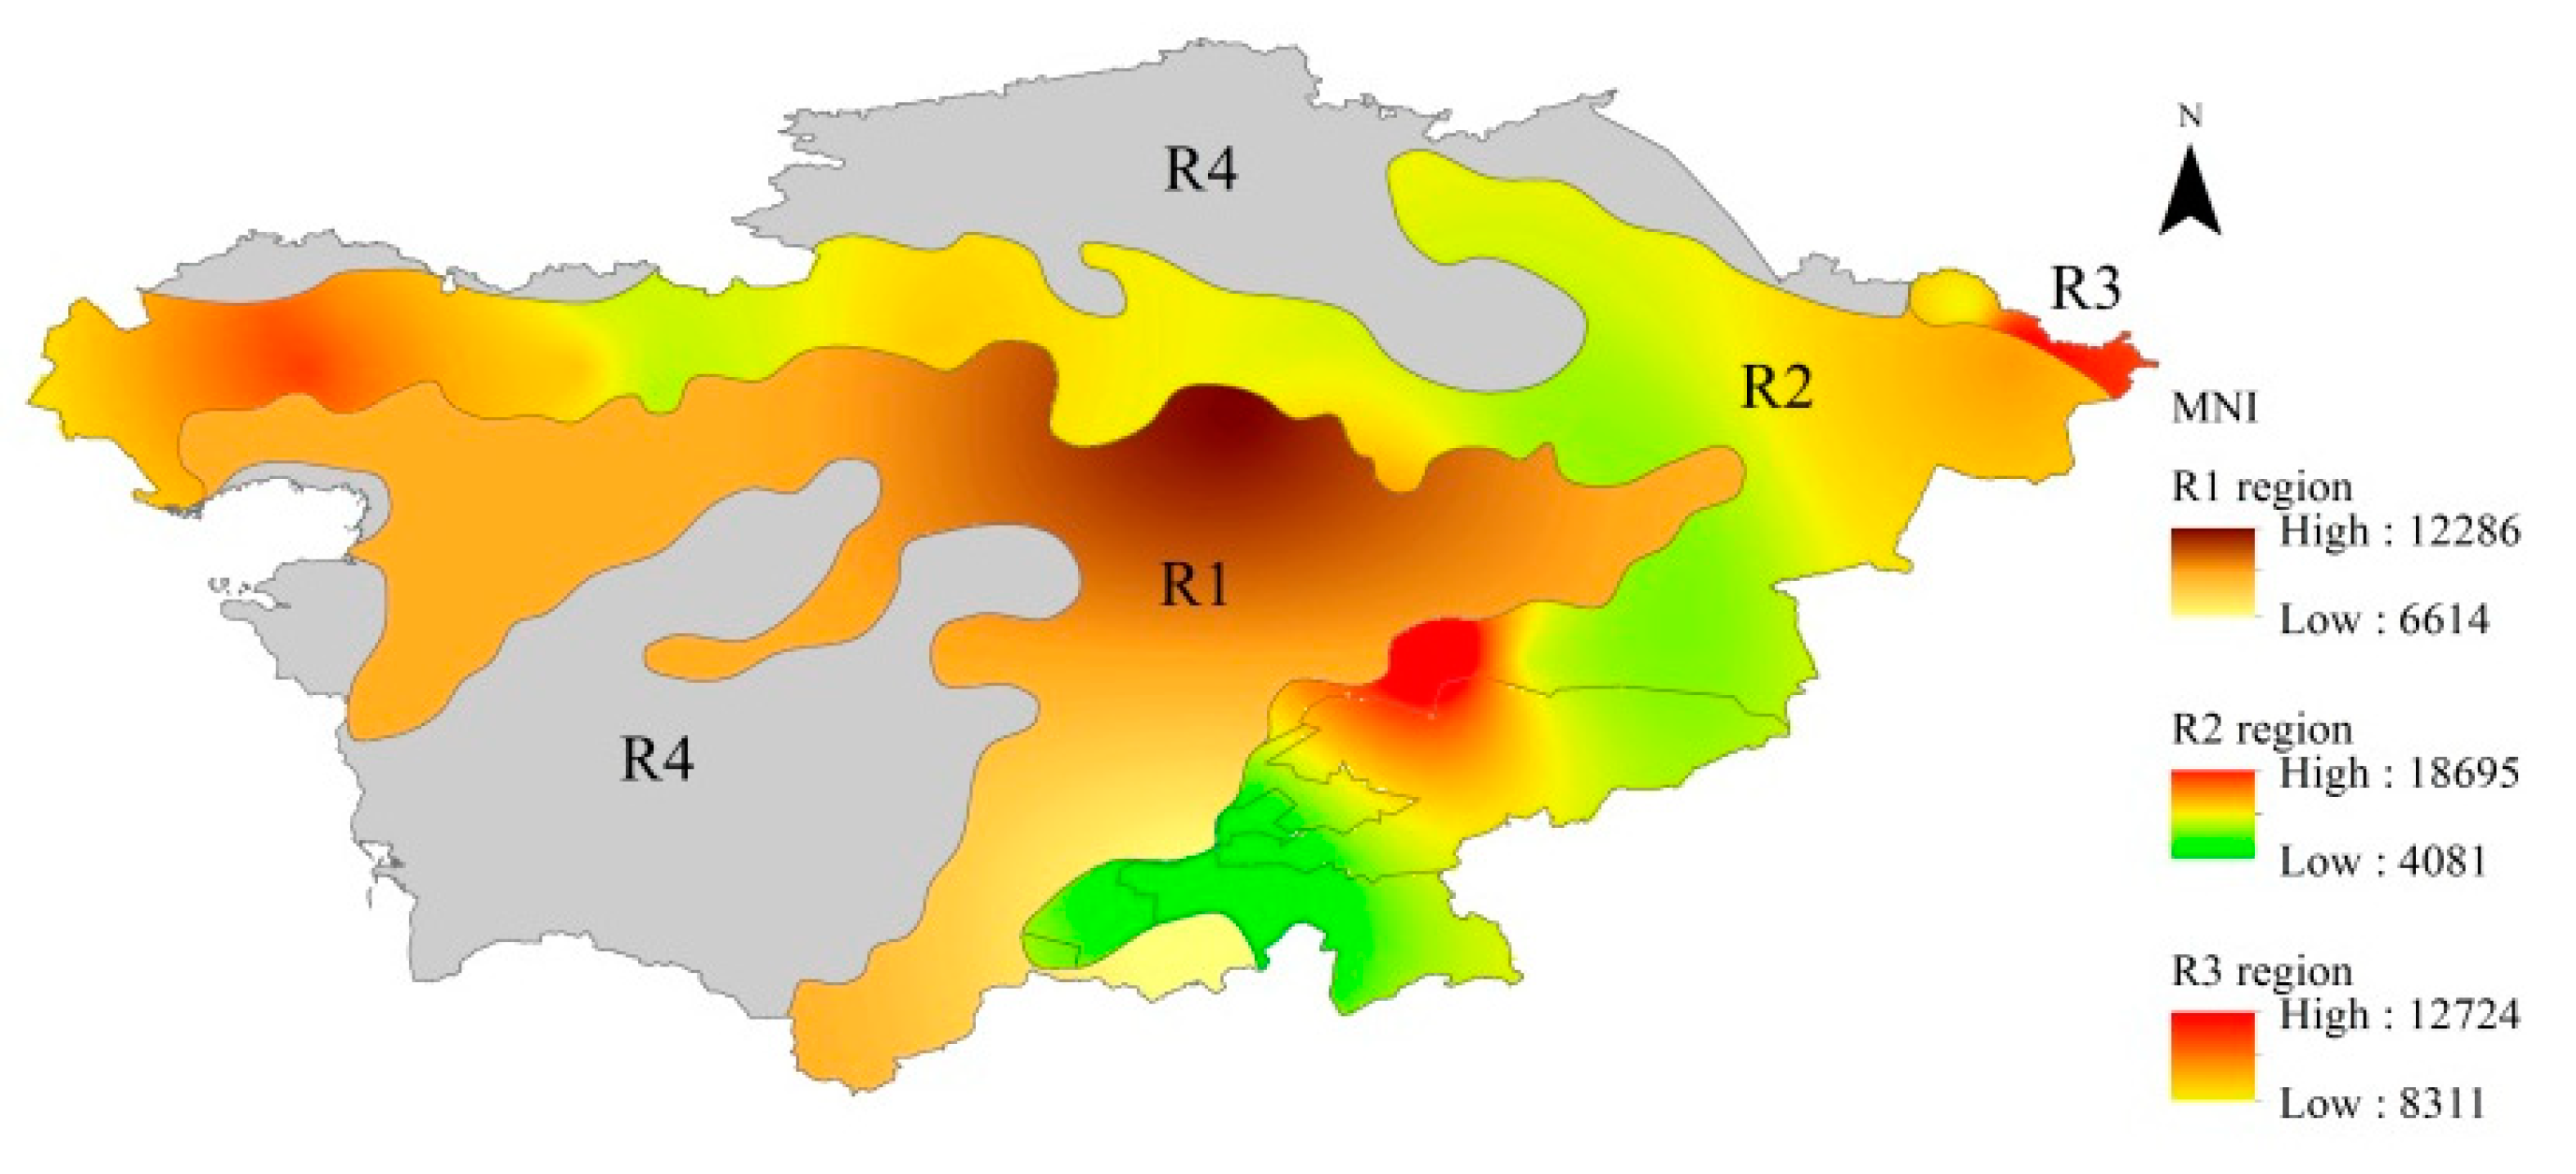
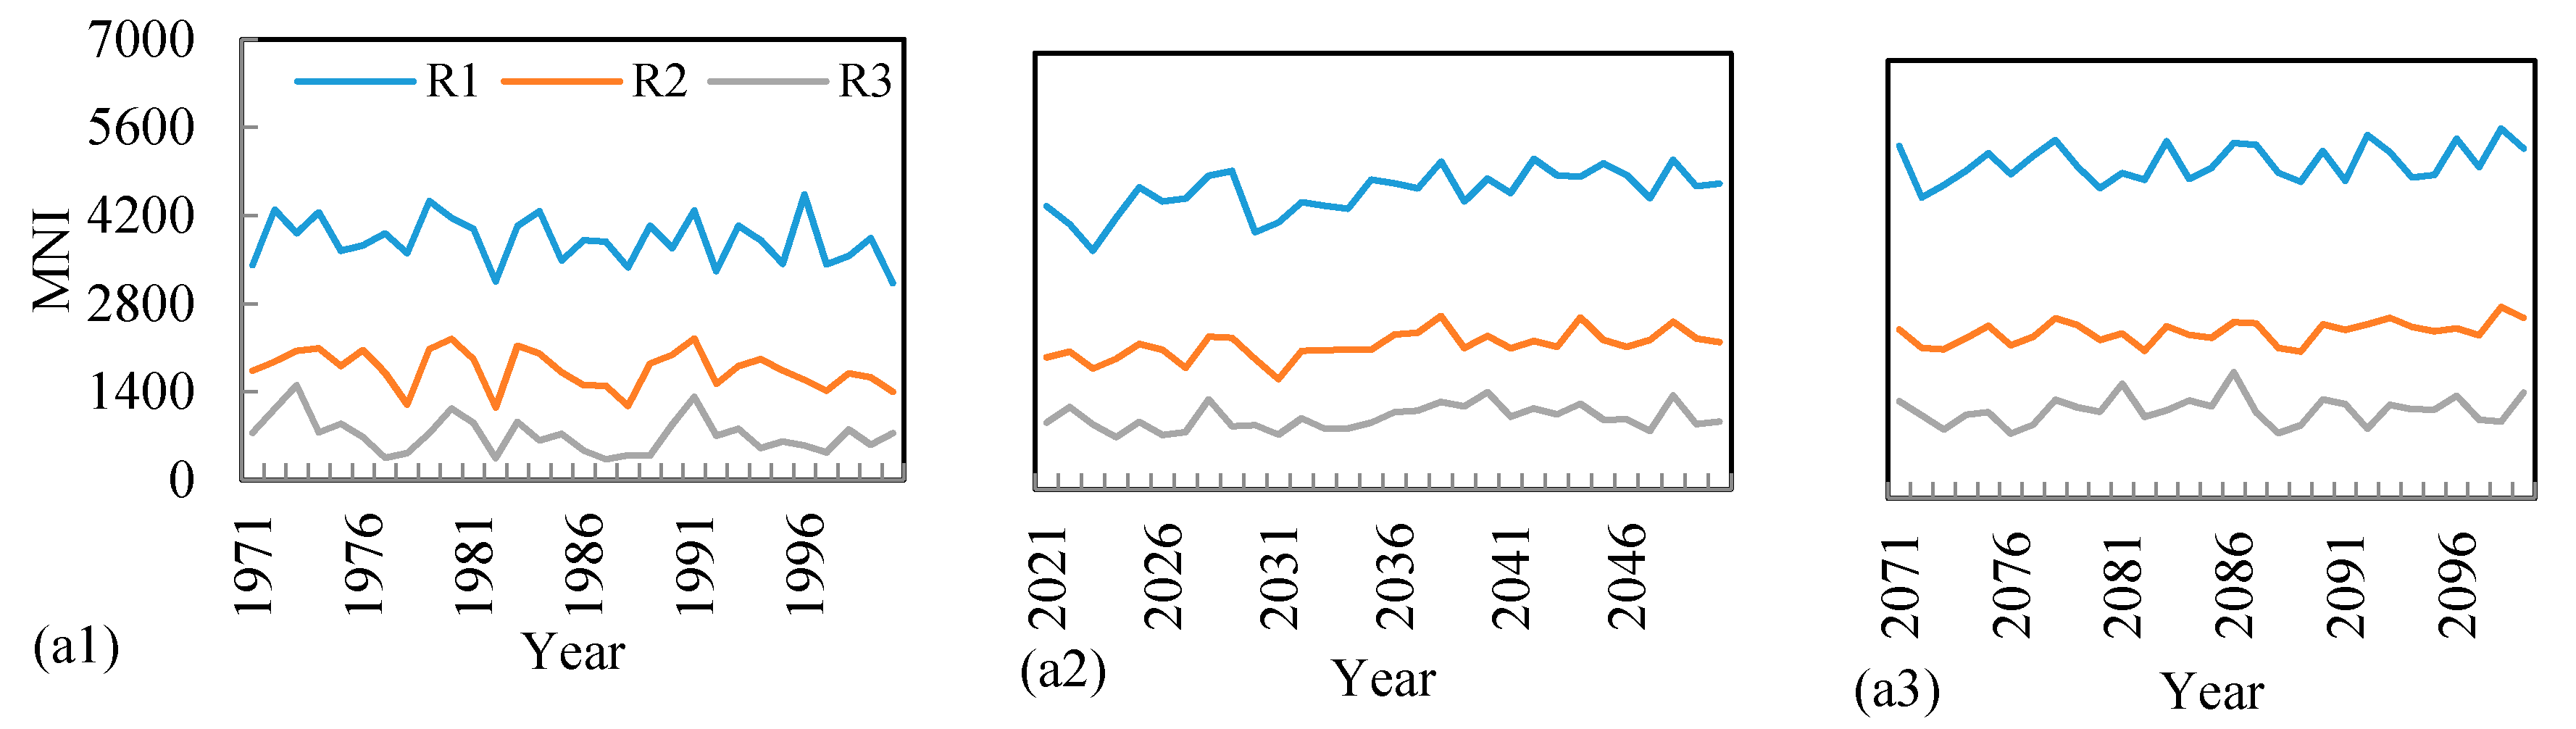
3.4. MNI Changes in the 2030s and 2080s
4. Discussion
5. Conclusions
Author Contributions
Funding
Conflicts of Interest
References
- Marlon, J.R.; Bartlein, P.J.; Carcaillet, C.; Gavin, D.G.; Harrison, S.P.; Higuera, P.E.; Prentice, I.C. Climate and human influences on global biomass burning over the past two millennia. Nat. Geosci. 2008, 1, 697–702. [Google Scholar] [CrossRef]
- Girardin, M.P.; Portier, J.; Remy, C.C.; Ali, A.A.; Paillard, J.; Blarquez, O.; Bergeron, Y. Coherent signature of warming-induced extreme sub-continental boreal wildfire activity 4800 and 1100 years BP. Environ. Res. Lett. 2019, 14, 124042. [Google Scholar] [CrossRef] [Green Version]
- Viatte, C.; Strong, K.; Patonwalsh, C.; Mendonca, J.; Oneill, N.T.; Drummond, J.R. Measurements of CO, HCN, and C2H6 Total Columns in Smoke Plumes Transported from the 2010 Russian Boreal Forest Fires to the Canadian High Arctic. Atmos. Ocean 2013, 51, 522–531. [Google Scholar] [CrossRef]
- Arkhipov, V.; Moukanov, B.M.; Khaidarov, K.; Goldammer, J.G. Overview on forest fires in Kazakhstan. Int. For. Fire News 2000, 22, 40–48. Available online: http://hdl.handle.net/11858/00-001M-0000-0014-9566-B (accessed on 10 May 2020).
- Keyser, A.R.; Westerling, A.L. Predicting increasing high severity area burned for three forested regions in the western United States using extreme value theory. For. Ecol. Manag. 2019, 432, 694–706. [Google Scholar] [CrossRef]
- Tansey, K.; Grégoire, J.M.; Stroppiana, D.; Sousa, A.; Silva, J.M.; Pereira, J.M.; Peduzzi, P. Vegetation burning in the year 2000: Global burned area estimates from SPOT VEGETATION data. J. Geophys. Res. Atmos. 2004, 109, D14S03. [Google Scholar] [CrossRef] [Green Version]
- Atkin, M. Inside Central Asia: A Political and Cultural History of Uzbekistan, Turkmenistan, Kazakhstan, Kyrgyzstan, Tajikistan, Turkey, and Iran by Dilip Hiro. Int. J. Middle East Stud. 2011, 43, 190–192. [Google Scholar] [CrossRef]
- Kleine, M.; Colak, A.H.; Kirca, S.; Saghebtalebi, K.; Orozumbekov, A.; Lee, D.K. Rehabilitating degraded forest landscapes in West and Central Asia. IUFRO World Ser. 2009, 20, 5–26. [Google Scholar]
- Liu, Y.; Stanturf, J.; Goodrick, S. Trends in global wildfire potential in a changing climate. For. Ecol. Manag. 2010, 259, 685–697. [Google Scholar] [CrossRef]
- Flannigan, M.; Cantin, A.S.; De Groot, W.J.; Wotton, M.; Newbery, A.; Gowman, L.M. Global wildland fire season severity in the 21st century. For. Ecol. Manag. 2013, 294, 54–61. [Google Scholar] [CrossRef]
- AghaKouchak, A.; Huning, L.S.; Chiang, F.; Sadegh, M.; Vahedifard, F.; Mazdiyasni, O.; Mallakpour, I. How do natural hazards cascade to cause disasters? Nature 2018, 561, 458–460. [Google Scholar] [CrossRef] [PubMed] [Green Version]
- Liang, S.; Hurteau, M.D.; Westerling, A.L. Large-scale restoration increases carbon stability under projected climate and wildfire regimes. Front. Ecol. Environ. 2018, 16, 207–212. [Google Scholar] [CrossRef] [Green Version]
- San-Miguel-Ayanz, J.; Durrant, T.; Boca, R.; Libertà, G.; Branco, A.; de Rigo, D.; Ferrari, D.; Maianti, P.; Artés Vivancos, T.; Costa, H.; et al. Forest Fires in Europe, Middle East and North Africa 2017; Publications Office of the European Union: Luxemburg, 2018; EUR 29318; ISBN 978-92-79-92831-4. [Google Scholar] [CrossRef]
- Kovats, R.S.; Valentini, R.; Bouwer, L.M.; Georgopoulou, E.; Jacob, D.; Martin, E.; Rounsevell, M.; Soussana, J.F. Europe. In Climate Change 2014: Impacts, Adaptation, and Vulnerability. Part B: Regional Aspects. Contribution of Working Group II to the Fifth Assessment Report of the Intergovernmental Panel on Climate Change; Barros, V.R., Field, C.B., Dokken, D.J., Mastrandrea, M.D., Mach, K.J., Bilir, T.E., Chatterjee, M., Ebi, K.L., Estrada, Y.O., Genova, R.C., et al., Eds.; Cambridge University Press: Cambridge, UK, 2015. [Google Scholar]
- Wotton, B.M.; Nock, C.A.; Flannigan, M.D. Forest fire occurrence and climate change in Canada. Int. J. Wildland Fire 2010, 19, 253–271. [Google Scholar] [CrossRef]
- Torzhkov, I.O.; Kushnir, E.A.; Konstantinov, A.V.; Koroleva, T.; Efimov, S.V.; Shkolnik, I.M. Assessment of Future Climate Change Impacts on Forestry in Russia. Russ. Meteorol. Hydrol. 2019, 44, 180–186. [Google Scholar] [CrossRef]
- Klein, I.; Gessner, U.; Kuenzer, C. Regional land cover mapping and change detection in Central Asia using MODIS time-series. Appl. Geogr. 2012, 35, 219–234. [Google Scholar] [CrossRef]
- Goldammer, J.G.; Davidenko, E.P.; Kondrashov, L.G.; Ezhov, N.I. Recent trends of forest fires in Central Asia and opportunities for regional cooperation in forest fire management. In Proceedings of the Regional Forest Congress Forest Policy: Problems and Solutions, Bishkek, Kyrgyzstan, 25–27 November 2004. [Google Scholar]
- Kazakhstan International Security Exhibition. 2012 Forest Fires in Kazakhstan up by 41%. Available online: https://www.aips.kz/en/home/9-press-center/news/137-forest-fires-in-kazakhstan-up-by-41 (accessed on 18 June 2020).
- Cao, X.; Meng, Y.; Chen, J. Mapping grassland wildfire risk of the world. In World Atlas of Natural Disaster Risk; Springer: Berlin/Heidelberg, Germany, 2015; pp. 277–283. [Google Scholar]
- Loboda, T.V.; Giglio, L.; Boschetti, L.; Justice, C.O. Regional fire monitoring and characterization using global NASA MODIS fire products in dry lands of Central Asia. Front. Earth Sci. 2012, 6, 196–205. [Google Scholar] [CrossRef]
- Warneke, C.; Bahreini, R.; Brioude, J.; Brock, C.A.; De Gouw, J.A.; Fahey, D.W.; Veres, P.R. Biomass burning in Siberia and Kazakhstan as an important source for haze over the Alaskan Arctic in April 2008. Geophys. Res. Lett. 2009, 36, L02813. [Google Scholar] [CrossRef] [Green Version]
- Babu, K.V.S.; Kabdulova, G.; Kabzhanova, G. Developing the Forest Fire Danger Index for the Country Kazakhstan by Using Geospatial Techniques. J. Environ. Inf. Lett 2019, 1, 48–59. [Google Scholar] [CrossRef] [Green Version]
- Spivak, L.; Arkhipkin, O.; Sagatdinova, G. Development and prospects of the fire space monitoring system in Kazakhstan. Front. Earth Sci. 2012, 6, 276–282. [Google Scholar] [CrossRef]
- Van Wagner, C.E.; Forest, P. Development and Structure of the Canadian Forest Fire Weather Index System; Forestry Technical Report; Canadian Forestry Service: Ottawa, ON, Canada, 1987; p. 35.
- Bedia, J.; Herrera, S.; Gutiérrez, J.M.; Benali, A.; Brands, S.; Mota, B.; Moreno, J.M. Global patterns in the sensitivity of burned area to fire-weather: Implications for climate change. Agric. For. Meteorol. 2015, 214, 369–379. [Google Scholar] [CrossRef] [Green Version]
- Nesterov, V.G. Forest fire Potential and Methods of Its Determination; Goslesbumizdat Publishing House: Moscow, Russia, 1949. [Google Scholar]
- Zhdanko, V.A. Scientific basis of development of regional scales and their importance for forest fire management. In Contemporary Problems of Forest Protection from Fire and Firefighting; Melekhov, I.S., Ed.; Lesnaya Promyshlennost Publishing: Moscow, Russia, 1965. [Google Scholar]
- Sherstyukov, B.G. Index of Forest Fire. Yearbook of Weather, Climate and Ecology of Moscow; Moscow State University Publishing: Moscow, Russia, 2002. [Google Scholar]
- Ganatsas, P.; Antonis, M.; Marianthi, T. Development of an adapted empirical drought index to the Mediterranean conditions for use in forestry. Agric. For. Meteorol. 2011, 151, 241–250. [Google Scholar] [CrossRef]
- Niu, R.; Zhai, P. Study on forest fire danger over Northern China during the recent 50 years. Clim. Chang. 2012, 111, 723–736. [Google Scholar] [CrossRef]
- Karouni, A.; Daya, B.; Bahlak, S. A comparative study to find the most applicable fire weather index for Lebanon allowing to predict a forest fire. J. Commun. Comput. 2013, 11, 1403–1409. Available online: http://www.wanfangdata.com.cn/details/detail.do?_type=perio&id=David_20171208_2213 (accessed on 10 June 2020).
- Groisman, P.Y.; Sherstyukov, B.G.; Razuvaev, V.N.; Knight, R.W.; Enloe, J.G.; Stroumentova, N.S.; Karl, T.R. Potential forest fire danger over Northern Eurasia: Changes during the 20th century. Glob. Planet. Chang. 2007, 56, 371–386. [Google Scholar] [CrossRef] [Green Version]
- Mouillot, F.; Schultz, M.G.; Yue, C.; Cadule, P.; Tansey, k.; Ciais, P.; Chuvieco, E. Ten years of global burned area products from space borne remote sensing—A review: Analysis of user needs and recommendations for future developments. Int. J. Appl. Earth Obs. Geoinf. 2014, 26, 64–79. [Google Scholar] [CrossRef] [Green Version]
- Hall, J.V.; Loboda, T.V.; Giglio, L.; Hall, J.V.; Loboda, T.V.; Giglio, L.; Mccarty, G.W. A MODIS-based burned area assessment for Russian croplands: Mapping requirements and challenges. Remote Sens. Environ. 2016, 184, 506–521. [Google Scholar] [CrossRef] [Green Version]
- Zhu, C.; Kobayashi, H.; Kanaya, Y.; Zhu, C.; Kobayashi, H.; Kanaya, Y.; Saito, M. Size-dependent validation of MODIS MCD64A1 burned area over six vegetation types in boreal Eurasia: Large underestimation in croplands. Sci. Rep. 2017, 7, 1–9. [Google Scholar] [CrossRef]
- Ruan, H.W.; Yu, J.J. Changes in land cover and evapotranspiration in the five CentralAsian countries from 1992 to 2015. Acta Geogr. Sin. 2019, 74, 1292–1304. [Google Scholar] [CrossRef]
- Yang, G.; Teng, Y.; Shu, L.F.; Cai, H.Y.; Di, X.Y. Review of Forest and Grassland Fire Prevention Along “the Belt and Road”. World For. Res. 2018, 31, 82–88. [Google Scholar] [CrossRef]
- Global Forest Resources Assessment 2015. Available online: http://www.fao.org/3/a-au190e.pdf (accessed on 10 June 2020).


| Rain/mm | 0 | 0.1–0.9 | 1.0–2.9 | 3.0–5.9 | 6.0–14.9 | 15.0–19.9 | ≥20.0 |
|---|---|---|---|---|---|---|---|
| K | 1.0 | 0.8 | 0.6 | 0.4 | 0.2 | 0.1 | 0 |
© 2020 by the authors. Licensee MDPI, Basel, Switzerland. This article is an open access article distributed under the terms and conditions of the Creative Commons Attribution (CC BY) license (http://creativecommons.org/licenses/by/4.0/).
Share and Cite
Zong, X.; Tian, X.; Yin, Y. Impacts of Climate Change on Wildfires in Central Asia. Forests 2020, 11, 802. https://doi.org/10.3390/f11080802
Zong X, Tian X, Yin Y. Impacts of Climate Change on Wildfires in Central Asia. Forests. 2020; 11(8):802. https://doi.org/10.3390/f11080802
Chicago/Turabian StyleZong, Xuezheng, Xiaorui Tian, and Yunhe Yin. 2020. "Impacts of Climate Change on Wildfires in Central Asia" Forests 11, no. 8: 802. https://doi.org/10.3390/f11080802