Article

Application of Haralick’s Texture Features for Rapid Detection of Windthrow Hotspots in Orthophotos

1
Bavarian Institute of Forestry (LWF), Division “Climate and Soil”, Hans-Carl-von-Carlowitz-Platz 1, D-85354 Freising, Germany
2
Bavarian Institute of Forestry (LWF), Division “Information Technologies and Remote Sensing”, Hans-Carl-von-Carlowitz-Platz 1, 85354 Freising, Germany
*
Author to whom correspondence should be addressed.
Forests 2020, 11(7), 763; https://doi.org/10.3390/f11070763
Submission received: 8 May 2020 / Revised: 9 July 2020 / Accepted: 12 July 2020 / Published: 16 July 2020
(This article belongs to the Section Forest Inventory, Modeling and Remote Sensing)

Abstract

:
Windthrow and storm damage are crucial issues in practical forestry. We propose a method for rapid detection of windthrow hotspots in airborne digital orthophotos. Therefore, we apply Haralick’s texture features on 50 × 50 m cells of the orthophotos and classify the cells with a random forest algorithm. We apply the classification results from a training data set on a validation set. The overall classification accuracy of the proposed method varies between 76% for fine distinction of the cells and 96% for a distinction level that tried to detect only severe damaged cells. The proposed method enables the rapid detection of windthrow hotspots in forests immediately after their occurrence in single-date data. It is not adequate for the determination of areas with only single fallen trees. Future research will investigate the possibilities and limitations when applying the method on other data sources (e.g., optical satellite data).

1. Introduction

Wind is a major forest disturbance agent and a key component of the forest dynamics in many forest ecosystems, particularly in temperate forests [1,2,3]. Storms are extreme wind events that cause severe damages in forests. For forest management, it is necessary to obtain precise information about the areas where storm events have caused windthrow damage. This information is relevant for several reasons, such as for forest protection in managed forests, as well as for understanding the growth processes after disturbances in unmanaged forests [4,5]. According to Intergovernmental Panel on Climate Change (IPCC), such extreme events will become more frequent in the future as climate change progresses [6].
In the past, several studies have been conducted to derive storm damage and windthrow damage from remote sensing data. These studies can be roughly distinguished by two parameters—“single-data or multiple-data use” and “applied remote sensing data”. For the detection of wind-caused changes in the past, often the multiple-data use approach has been followed, which is based on the comparison of multitemporal data. Recent studies however tried to detect changes by the use of “single data”, which are acquired only once after a storm event. Regarding the parameter “applied remote sensing data”, two main subcategories can be distinguished that have been used to detect windthrow damages: The first subcategory is “data from satellite systems”. These are mostly radar data or optical satellite data with different resolutions on the ground. The second subcategory is “aerial photograph data”. These data mainly are derived from remote sensing systems mounted on airplanes. In recent studies, data were used from systems where optical camera systems had been mounted on unmanned aerial vehicles or systems (abbreviated as UAV and UAS, respectively).
In the following section, we try to give an overview of the considered studies and their main findings, categorized by these two parameters. This is followed by a section on the methodological aspects. At the end, we try to summarize and finally describe the main objectives of the present study in concrete terms.
Hame et al. [7] presented a study on an unsupervised change detection and recognition system for forestry. As an input, they used two images acquired on different dates and user-defined parameter lists for classification. They tested their methods in a Southern Finnish boreal forest using Landsat Thematic Mapper data. They could reliably detect and identify clearcut areas (overall classification accuracy of 65.7%). They concluded that the method could provide information on forest damage, since the type of spectral change was consistent in damaged areas, despite the minor magnitude of the change. In the year 2000, Miller et al. [8] investigated the potential of digital photogrammetric techniques in the provision of spatial data on forest canopies. Such data have applications in the monitoring of the onset and progression of abiotic damage, such as windthrow, and as inputs for predictive models of wind damage. They tested the derivation of the digital elevation models and orthophotographs at multiple dates over the lifetime of a forest study site measuring 7 km2 in Wales. Their results indicated that accurate estimates of canopy heights at fine spatial resolution are possible. Within this study, no quantitative metrics for the detection of windthrow areas or volume were given. In 2005, Womble [9] summarized the existing remote sensing applications for windstorm damage detection but did not focus on forest aspects in detail. Fransson et al. presented [10] a study that focused on the investigation and evaluation of windthrown forest mapping using satellite remotely sensed data from synthetic aperture radar sensors (SAR). They carried out their study at a test site in the south of Sweden that is dominated by coniferous trees. To simulate a windthrown forest, trees were manually felled. They found that not all tested sensors are equally suitable to detect windthrow areas because of the coarse spatial resolutions of some systems. Windthrow areas were clearly visible in Radarsat-2 and TerraSAR-X HH polarized images in this study. Within the study, no quantitative metrics for the detection of windthrow areas were given. In 2013, Jonikavicius and Mozgeris [11] published the results of a study on the rapid assessment of wind-storm-caused damage using satellite images and stand-wise forest inventory data. Two Landsat 5 Thematic Mapper images from June and September 2010 and data from a forest stand register were used to assess the forest damage caused by a storm in August 2010 in Lithuania. The percentage of damage in terms of the wind-fallen or broken tree volume was predicted for each forest compartment within a zone potentially affected by the storm using a non-parametric k-nearest neighbor technique. Satellite-imagery-based difference images and general forest stand characteristics were used as auxiliary data sets for prediction. The total wind-damaged volume was underestimated by 2.2% for coniferous-dominated stands and by 4.2% for broadleaf stands. The overall accuracy of identification of wind-damaged areas was around 95–98%, based solely on difference data from satellite images gathered on two dates. In the year 2014, Elatawneh et al. [12] published the results of a study carried out in the eastern part of Bavaria in Germany. They investigated the potential of optical RapidEye satellite data for timely updates of forest cover databases to reflect both regular forest management activities and sudden changes due to bark beetle infestations and storms. In the case of a sudden event, the forest cover database served as a baseline for damage assessment. They carried out a RapidEye (RE) data analysis on a windthrow that occurred in July 2011. The RE analysis for the damage assessment was completed two weeks after the post-event data was taken, with an accuracy value of 96% and a kappa coefficient of 0.86. In 2014, Baumann et al. [13] presented an approach to separate windfall disturbance from clearcut harvesting using Landsat data. In the first step, they extracted training data based on tasseled cap transformed bands and histogram thresholds with minimal user input. Then, they used a support vector machine classifier to separate disturbed areas into “windfall” and “clearcut harvests”. They tested their algorithms in the temperate forest zone in Russia and in the southern boreal forest zone of the United States. The forest cover change classifications were highly accurate (~90%) and windfall classification accuracies were greater than 75% for both study areas. Additionally, in 2014 Chehata et al. [14] presented an approach for object-based change detection in windstorm-damaged forests using high-resolution satellite-born multispectral images. Firstly, they optimized the image segmentation and classification steps via an original calibration procedure. Secondly, an automatic bitemporal classification procedure enabled the separation of damaged and intact areas thanks to a new descriptor based on the level of fragmentation of the obtained regions. The method was assessed in a maritime pine forest using bitemporal HR Formosat-2 multispectral images acquired before and after windstorm Klaus, which occurred in January 2009 in southwestern France. The binary overall classification accuracy reached 87.8% and outperformed a pixel-based k-means classification with no feature selection. In 2015, Furtuna at al. [15] evaluated a change detection approach for the assessment of forest disturbances rates caused by windthrow. They presented an approach to detect long term changes using Landsat time series data. Estimates of disturbance rates were derived using 8 sample sites selected across the Apuseni mountains in Romania from 2010 to 2014. They found evidence of systematic changes in the forest ecosystem by analyzing multitemporal surface data. The study did not present quantitative metrics for the detection of windthrow areas. In 2016 Pirotti et al. [16] presented a kernel cross-correlation approach for unsupervised quantification of damage from windthrow in forests. In the proposed method, they analyzed aerial RGB images with a ground sampling distance of 0.2 m using an adaptive template matching method. For comparison purposes, ground truth data were acquired for 10 sample sites in Northern Italy by ground sampling. Regression results for the comparison of ground-sample-based volume estimation of windthrow damages and model results had an R2 value of 0.92 and a relative absolute error value of 34%. They interpreted their initial results as encouraging for further investigations on more finely tuned kernel template metrics to define an unsupervised image analysis process to automatically assess forest damage from windthrow. In 2017, Duan et al. [17] presented an approach the coarse-to-fine windthrown tree extraction based on unmanned aerial vehicle images. The developed method was tested using UAV imagery collected over rubber plantations on Hainan Island after the Nesat Typhoon in China in October 2011. Coarse extraction of the affected area was done by analysis of the image spectrum and textural features. Fine extraction of the individual trees was achieved using a line detection algorithm. The completeness of the windthrown trees in the study area was 75.7% and the correctness was 92.5%. Einzmann et al. [18] carried out a study on windthrow detection in European forests using very high resolution optical data. They presented a two-stage change detection approach applying commercial very high resolution optical Earth observation data to spot forest damage. First, an object-based bitemporal change analysis was carried out to identify windthrow areas larger than 0.5 ha. A hybrid change detection approach at the pixel level subsequently identified small groups of fallen trees, combining the most important features of the previous processing steps. For two test sites in Bavaria in the south of Munich, the object-based change detection approach identified over 90% of windthrow areas (>0.5 ha). Another study from 2017 was presented by Mokros et al. [19]. For the identification of damage locations and losses, they used a fixed-wing UAV with a mounted RGB camera system and an additional mounted Airborne Laserscanning device. The images were acquired in the Czech Republic over approximately 200 ha, where five large windthrow areas occurred. The results were compared with terrestrial reference data, as well as with Landsat-derived data. The results of the UAV (25.09 ha) and the combined UAV–ALS system (25.56 ha) were statistically similar to the ground-based reference data (25.39 ha). The Landsat results (19.8 ha) differed significantly. The estimate for the salvage logging for the whole area from UAV and the forest management plan overestimated the salvage logging measured by foresters by 4.93% (525 m3) when only the most represented tree species were considered. Kingfield and de Beurs described the altering of spectral signatures of different land cover types by tornadoes. Within this study, Landsat surface reflectance was used to explore how 17 tornadoes modified the spectral signature, NDVI, and ‘‘tassled cap’’ parameters inside forest, grassland, and urban land cover areas. Land cover influences the magnitude of change observed, particularly in spring and summer imagery, with most tornado-damaged surfaces exhibiting a higher median reflectance in the visible and shortwave infrared images, and a lower median reflectance in the near-infrared spectral range. These changes result in a higher median tasseled cap brightness, lower tasseled cap greenness and wetness, and lower NDVI values relative to unaffected areas. Other factors affecting the magnitude of change in reflectance include the season, vegetation condition, land cover heterogeneity, and tornado strength [20]. In 2018, Chirici et al. [21] presented research on the assessment of forest windthrow damage using single-date, post-event airborne laser scanning data. They followed a two-stage strategy. ALS data were used to delineate damaged forest stands and for an initial evaluation of the volume of fallen trees. The total volume of fallen trees was estimated using a two-stage model-assisted approach, where variables from ALS were used as auxiliary information in the difference estimator. The proposed methods produced maps of damaged forests, as well as estimates of damaged forests in terms of the total volume of fallen trees and the uncertainty of estimates. The application of the proposed method on data from a windstorm in Tuscany (Italy) in March 2015 showed that ground-based line intersection sampling values and ALS-based estimates fitted together very well at the stand level. In 2019, Hamdi et al. [22] presented a study on forest damage assessments using deep learning on high-resolution remote sensing data. They tested and implemented an algorithm based on Convolutional Neural Networks in an ESRI ArcGIS environment for automatic detection and mapping of damaged areas. The algorithm was trained and tested on a forest area in the eastern part of Bavaria, Germany. It is based on a modified U-net architecture that was optimized for the pixelwise classification of multispectral aerial remote sensing data. The Neural network was trained on labeled damaged areas from after-storm aerial orthophotos of a 109 km2 forest area with RGB and NIR bands and 0.2 m spatial-resolution. They found an overall accuracy of 92% for the binary classification of the pixels in the two categories ‘damaged’ and ‘undamaged’. 2019 Panagiotidis et al. [23] published research on the detection of fallen logs from high-resolution UAV images. They described a line template matching algorithm that can be used for the detection of fallen stems in an automated procedure, e.g., for post-windthrow events. The study was conducted in western Bohemia. They found an overall accuracy of 78% and a Cohen’s kappa value of 0.44 for the automated detection of fallen logs from this data source. Also in 2019, Rüetschi et al. [24] presented a study on the rapid detection of windthrow events using Sentinel-1 C-band SAR data. In the first step, they radiometrically corrected several S1 acquisitions of approximately 10 days before and 30 days after storm events on two test sites in Germany and Switzerland. Afterwards, they generated SAR composite images for before and after the storm. They developed a change detection method to suggest potential locations of windthrown areas with a minimum extent of 0.5 ha, based on two parameters. While the results from the independent study area in Germany indicated that the method is very promising for the areal detection of windthrow events, with a producer’s accuracy of 88%, its performance was less satisfactory for the detection of scattered windthrown areas.
According to Haralick et al. [25], “texture is one of the important characteristics used in identifying objects or regions of interest in an image, whether the image be a photomicrograph, an aerial image, or a satellite image”. In this basic article, they described the computation of easily calculated texture metrics, which have been widely used since then. Hall-Beyer [26] stressed that the most commonly used texture measures are those that are derived from grey-level cooccurrence matrices. In the past, texture measures or texture metrics have been used several times in forestry contexts. In 1994, Kushwaha et al. [27] described the application of image texture for forest classification. They applied different basic texture metrics to differentiate and classify forests affected by shifting cultivation in north-eastern India. They found the most accurate classification for a combination of several texture metrics. In 2000, Franklin et al. [28] incorporated texture into the classification of forest species composition from airborne multispectral images. In a test for forests in New Brunswick, the application of texture to selected land cover types resulted in an overall 12% improvement in classification accuracy. Also in the year 2000, Simard et al. [29] investigated the use of decision tree and multiscale texture techniques for classification of JERS-1 SAR data over tropical forests. They found that on the one hand the construction of exploratory decision trees could improve classification results, while on the other hand radar amplitude is important for separating basic land cover categories. In 2003, Butusov [30] wrote a paper about unsupervised forest classification of Landsat-7 images using texture and spectral characteristics. Texture characteristics were calculated using direct a wavelet transformation and some texture metrics. The unsupervised forest classification was carried out for the test fragment of Landsat-7 images of the Bulunskiy forestry in the Saha Republic (Yakutiya). The only usage of texture metrics for classification turned out to be insufficient. Better results were achieved by the joint usage of texture metrics and spectral characteristics. In 2004, Coburn and Roberts [31] presented a multiscale texture analysis procedure for improved forest stand classification. The multiscale approach achieved a higher degree of classification accuracy compared to previously known approaches. In 2007, Lu and Wen [32] presented a survey of image classification methods and techniques for improving classification performance. This literature review suggested that designing a suitable image processing procedure is a prerequisite for successful classification of remotely sensed data into a thematic map. The effective use of multiple features of remotely sensed data and the selection of a suitable classification method are especially significant for improving classification accuracy. As already mentioned, Duan et al. [17] applied Haralick’s texture features in a forestry context to detect windthrown trees in UAV-derived pictures.
The main aim of this study is the automated detection of windthrow “hotspots” in digital airborne photographs with a high spatial resolution by application of Haralick’s texture features. Hotspots are defined in a practical forestry context, meaning areas of a certain size should be detected that have a high priority for salvage logging. We want to develop a computationally extensive, easily accessible method for the detection of damaged areas from high-resolution aerial photographs, specifically orthophotos. It should be possible to apply the method on single-date data taken shortly after a storm or a windthrow event, because the prerequisite of the change detection approach (comparison of data before and after a storm event) is not often fulfilled in practice. The method should be applicable for European forest conditions with pure and mixed stands.

2. Materials and Methods

2.1. Material

On the 18th of August 2017, a storm named “Kolle” caused severe damage in Bavarian forests. Across Bavaria, about 2.3 Million cubic meters of wood were windthrown. Hotspots were in the eastern part of Bavaria, especially in the growth region of the Bavarian Forest, near the borders with the Czech Republic and Austria [33]. The upper illustration in Figure 1 shows the geographical location. This region is well-forested, with a proportion of forest land of about 52%. According to the results of the 3rd National Forest Inventory in Germany, forests in this region are dominated by Norway Spruce (50.6%), European Beech (17.3%), and Silver Fir (9.2%) [34].
On the 29th and 30th of August 2017, an aerophotogrammetric campaign, conducted by ILV Fernerkundung GmbH, commenced in this region of Bavaria. Aerial photos were taken with a digital mapping camera (DMC) system with four spectral channels (red, green, blue, and near infrared). The overlap in the flight direction was 80% and 50% perpendicular to the flight direction. The spatial resolution on the ground was 20 × 20 cm per pixel. Digital aerial photographs were orthorectified into digital orthophotos using an already existing terrain model of the Bavarian Surveying Administration.
We applied our algorithms on a 6 × 6 km clip of this data set, which is located in the north-west of the city Hauzenberg (LAT 48.660216, LON 13.622688). Figure 1 shows the geographical location of the region in the lower area. Coordinates of the clipped region and the training region are listed in Table 1.

2.2. Methods

2.2.1. Preliminary Visual Classification

As described in Section 2.2.2, we subdivided our area of interest into small cells measuring 50 × 50 m. The content of the 14,400 cells was interpreted and preliminary visually classified by an independent person. Detected windthrow intensities were classified into the categories listed in Table 2.

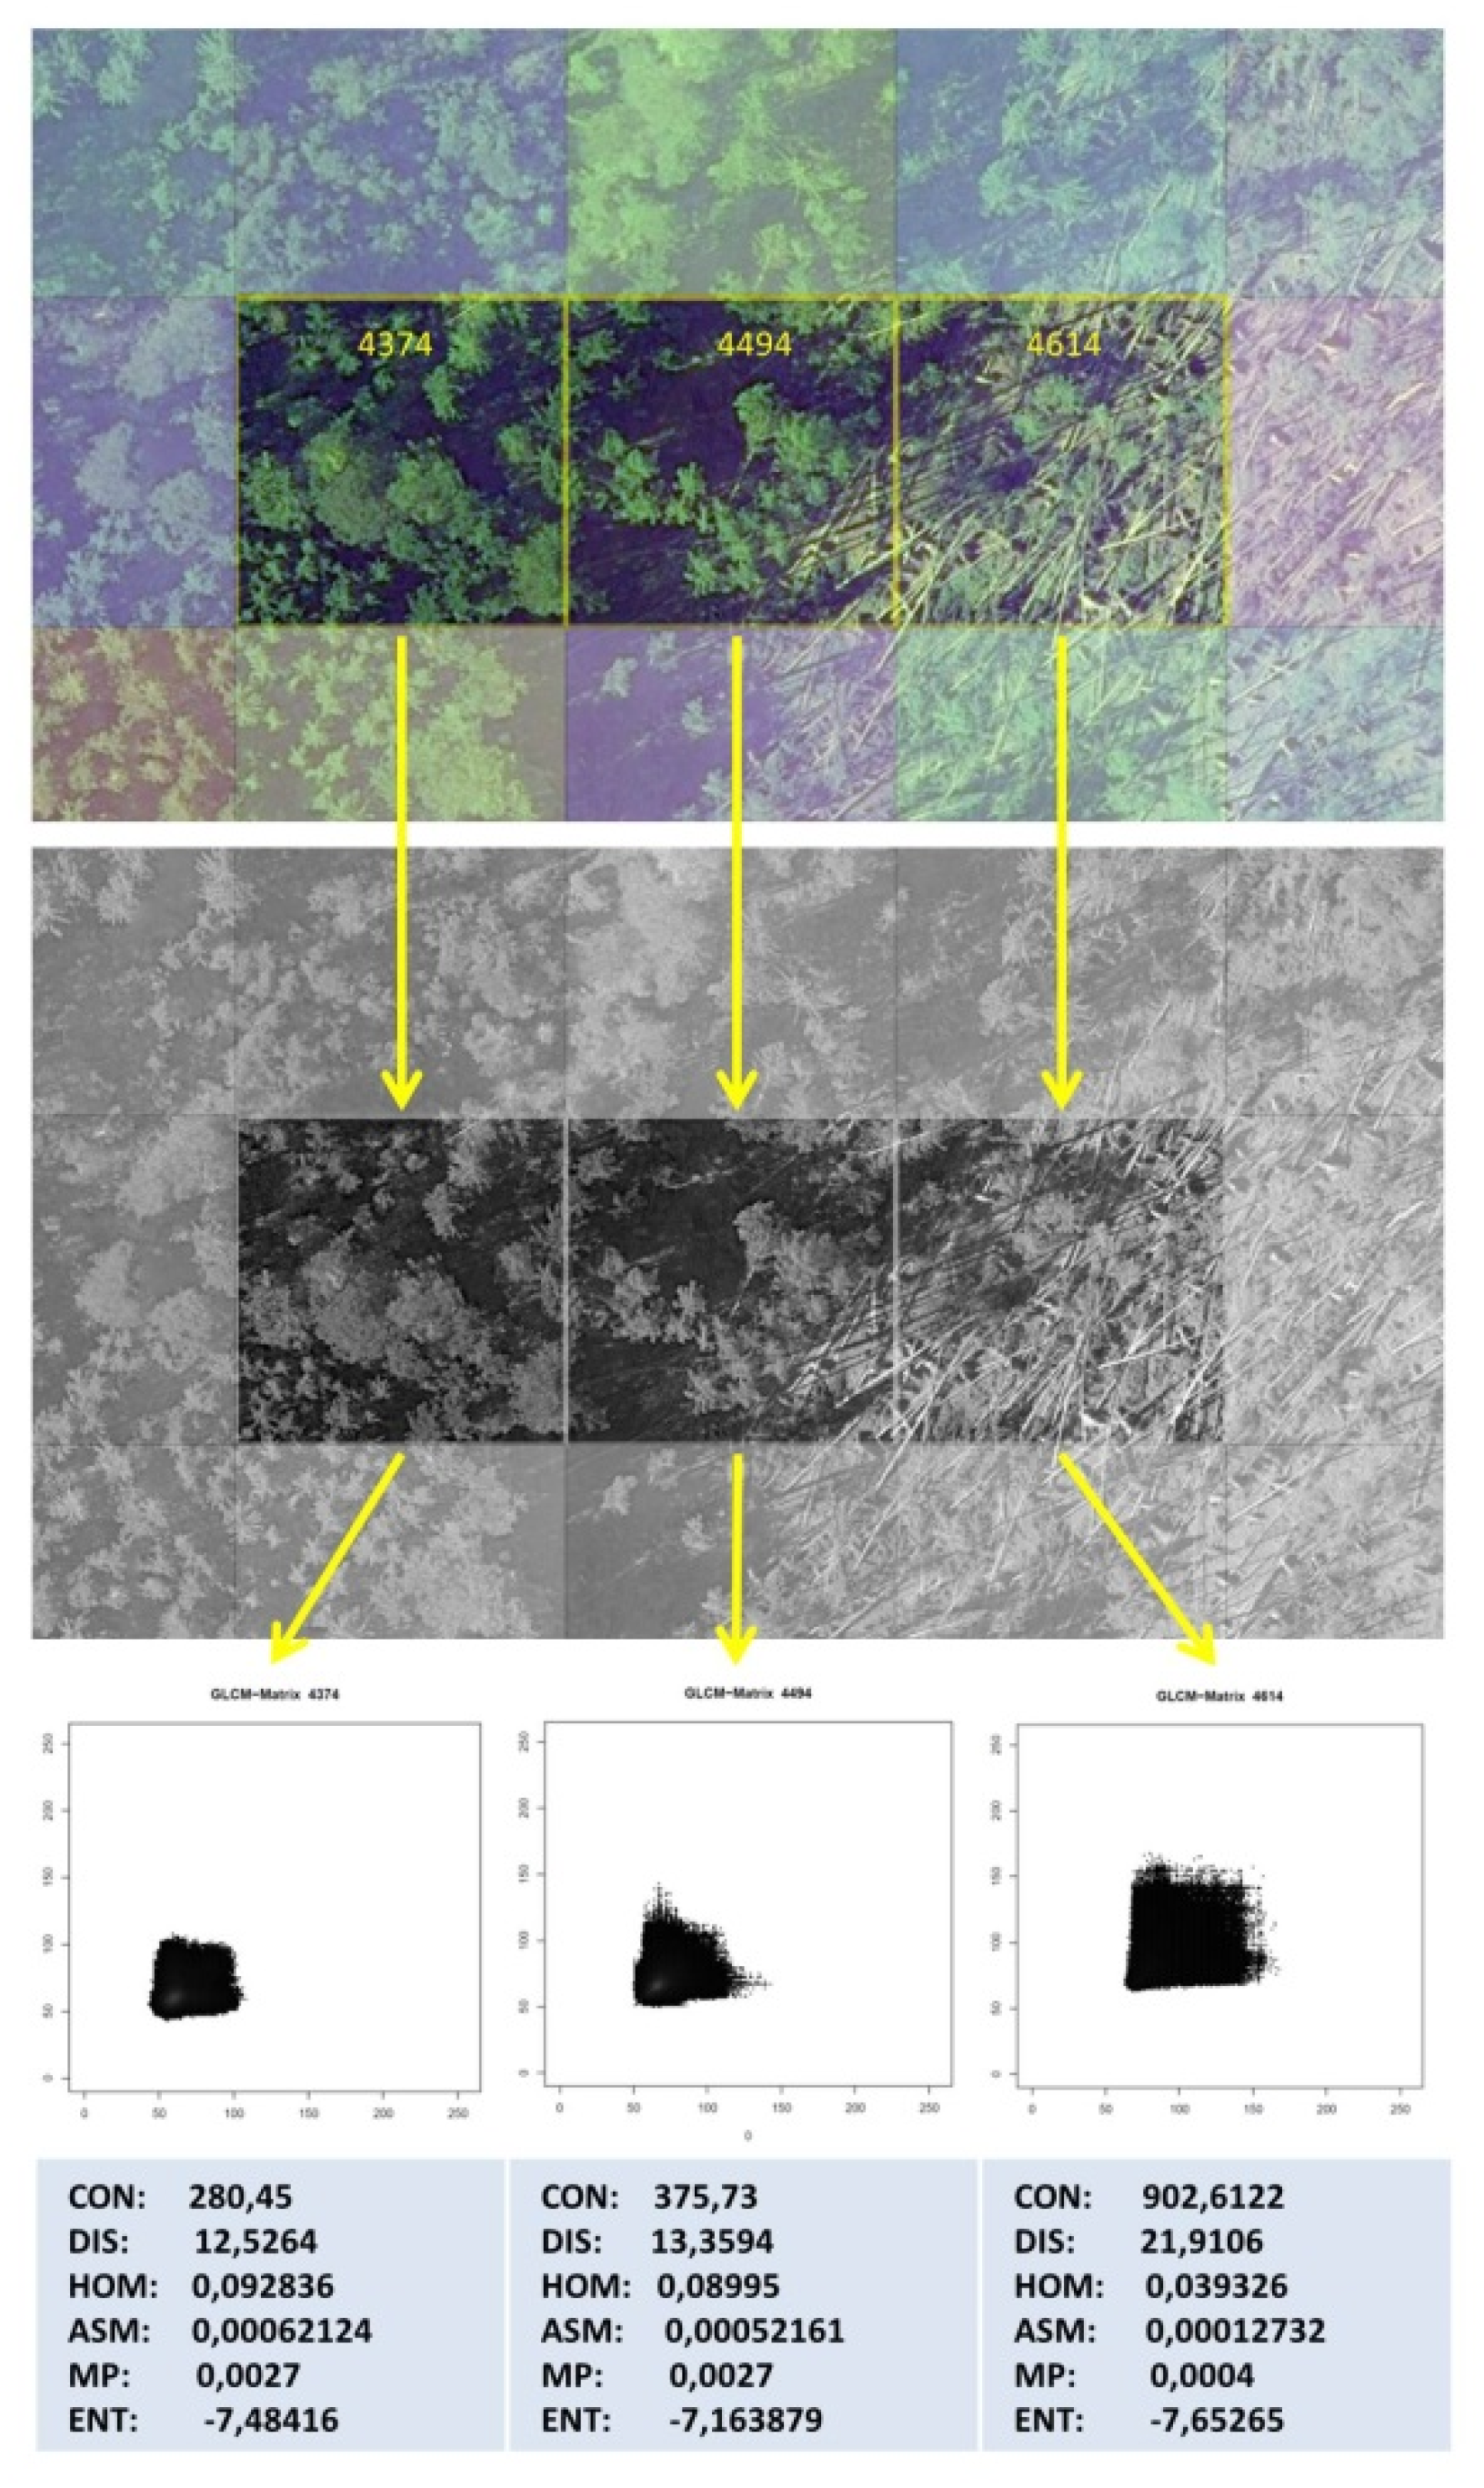
2.2.2. Description of the Method

We applied a two-staged method. In the first stage, we trained a random forest classifier for the training data set described in Section 2.1 and shown in Figure 1. In the second step, we applied the trained classifier on the remaining test data. In the following section, we describe the method in detail.
At the beginning of the process, we subdivided the whole area of interest into smaller cells. In our case, we subdivided the 6 × 6 km area into 50 × 50 m cells, resulting in 14,400 cells. We followed the assumption that this cell size overlaid over an orthophoto with a spatial resolution of 20 cm enables the interpretation and classification of the categories listed in Table 2. We also assumed that a cell size of one-quarter hectare is a relevant size for the detection of windthrow hotspots. The training area consists of 1800 cells. The training area was chosen subjectively with the aim of determining an area with a comparable proportion of forest and non-forest areas within. Another prerequisite was the existence of windthrow cells and no windthrow cells within the training area. Technically, this step was fulfilled by generating gridded shapefiles in a batch process in R [35], using the “shapefiles” package [36]. In the next step, we sorted out raster cells covered with forests. Therefore, we applied the so-called “ALKIS-TN” layer provided by the Bavarian land surveying authorities (LDBV). Raster cells with no forest cover and raster cells at the borderline of forests were excluded from proceeding further. We used 7349 cells for further processing, 1326 of which were within the training area. Within a batch process we further cropped the raster data from the underlying digital orthophoto by the extent of the cell shapes. Hereafter, we call these data “raster cells”. In our case, cropped raster cells had an extent of 250 × 250 pixels. Technically, this step was done by application of the crop function in the “raster” package [37]. In the next step, we turned the color values (RGB values) of each pixel of the raster cells into grey level values for calculation of the grey-level cooccurrence matrices (GLCMs). Therefore, we applied the “rgb2grey” function of the “ripa” package [38]. In the following processing step, for each raster cell Haralick’s texture metrics were calculated, as described in Table 3. The applied texture metrics belong to two groups. Measures related to contrast use weights related to the distance from the GLCM diagonals (“contrast group”). The second group of metrics are related to the orderliness (“orderline group”). They describe how regular the pixel value differences are within a cell [39].
Technically, this step was done by applying the “RTextureMetrics” package [40]. Figure 2 gives a visual impression of the processing steps up until this point.
The raster cells numbering 4374, 4494, and 4614 in Figure 2 all lay within the training area. They represent the three different categories of windthrow intensities. Here, 4374 represents a cell that was not affected by windthrow. Cell 4494 represents a cell were about 30% of the area was affected by storm Kolle. In this case, the storm-damaged area is located compactly in the lower right side of the cell. The other possible case, whereby damages are distributed across the whole cell but where no more than 50% of the area is affected, is not shown in Figure 2. Cell 4614 represents a forest cell with severe storm damage. Also not shown is an example for a cell where only single trees were blown down.
After finishing this cell-wise calculation for each cell, we compared the calculated texture metric values between the categories of windthrow intensities. To quantify the results, we applied analysis of variance (AOV), two-sided t-test-statistics, and Mann–Whitney–Wilcoxon tests. To assess whether the developed method was suitable for the detection of windthrow hotspots, we established three evaluation groups, as described in Table 4.
We classified the training data by applying a random forest classifier [41,42], which required the two input parameters—the number of decision trees (ntree) and number of random split variables (mty). We determined the optimal value for ntree by out-of-bag error convergence (OOB), while mty was based on the square root of the input characteristic number. In the last step, we applied the trained random forest classifier on the test or evaluation data. To quantify the results, we calculated commonly used metrics, such as the (balanced) accuracy, specificity, and Cohen’s kappa.

3. Results

3.1. Differences in Texture Metrics

Figure 3 shows notched boxplots for texture metric values. According to Chambers [43], notches that do not overlap indicate significant differences of the median values of the distributions. Additionally, in Table 5 the p-values for a two sample Welsh t-test are listed.
In the left column (severe only), the boxplot labeled “windthrow” represents the values for “severe” windthrow cells only. For the mean of each texture metric parameter in the left column, we found differences between windthrow cells and no windthrow cells, which were highly significant (p-values < 0.001).
In the column in the middle (rough), the boxplot labeled “windthrow” combines the values of “severe” and “medium” windthrow cells. We also found highly significant differences (p < 0.001) between the two categories for the means of all texture metric parameters.
In the right column in Figure 3, the boxplots for all categories according to Table 3 are shown in a comparative manner. The mean and medium values increase (CON, DIS, ENT) or decrease (HOM, ASM, MP) with increasing windthrow severity. As shown in Table 6, the analysis of variance also shows that there are differences in the mean values between the categories for all texture metrics. An additional conducted t-test proved these differences. In all cases we found highly significant differences for the mean values of texture metrics, except for entropy (ENT).
All boxplots show large variations in the values. Interquartile ranges and whiskers overlap in most cases between the displayed categories.
In Table 6, mean values for texture metrics for fine distinction are listed. In the last column of Table 6, p-values of a one-way ANOVA (AOV) are listed. The presented values indicate significant differences between for all texture metrics in at least two groups of fine distinction. Because one-way ANOVA is an overall test statistic, we applied Kolmogorov–Smirnov test statistics on all compared texture metric values of fine distinction.
The resulting p-values from Kolmogorov–Smirnov tests indicated that the texture metric values were generally not normally distributed, so we further tested these with Mann–Whitney–Wilcoxon tests to find out if all groups showed differences. The results of these non-parametric tests are listed in Table 7 for the null hypothesis formulated in the uppermost line. At the significance level of 0.05, we conclude that all texture metrics are non-identical, except for ENT for distinction between the E, M, and S groups. These promising results encouraged us to apply classification techniques to distinguish “windthrow raster cells” and “no-windthrow raster cells” by their texture metric values.

3.2. Classification Results

The confusion matrix in Table 8 for the “severe only” group shows that 145 severely damaged cells and 5630 of the “no windthrow” cells were predicted correctly. This results in an accuracy value of about 96%, or about 76% for balanced accuracy, listed in Table 9. For Cohen’s kappa, which explains how well the classifier performed as compared to how well it would have performed simply by chance, the rounded value of 0.52 relatively high. In comparison to the accuracy measure for the “rough” group, the value of about 91% is slightly less than in the “severe only” group, but the balanced accuracy value of 77% and Cohen’s kappa indicate a better performance for the prediction for these levels of distinction. For the “fine” grouped prediction, the overall classification accuracy of the prediction is about 75%, which is comparable to the other distinctions, while Cohen’s kappa indicates a value of about 0.35, indicating bad prediction performance for all cells. Balanced accuracy values for the fine distinction vary between 55% and 83%, with high values for the prediction for “severe windthrow cells” (S) and for “no windthrow cells” (K), and comparatively low values for cells with “single fallen trees” (E) and “medium” damage (M).
The sensitivity measure, which gives information on how often windthrow cells are predicted correctly, was about 58% for the “rough” group, which was slightly better than for the “severe only” group with 54%. The variation of the resulting sensitivity measures for the “fine” group was within 17% (rounded) for cells with only “single fallen trees” and about 92% for “no windthrow” cells, which was much higher. This can be interpreted as a poor prediction performance for cells with little damage caused by wind or storms.
The specificity measure indicates the true negative rate, which indicates the relative number of predicted “no windthrow” cells that are truly no windthrow cells in reality. For the “severe only” and the “rough” groups, we found high values of about 98% and 95%, respectively. For the “fine” group, we found a value of about 53% for “no windthrow ” cells (K) and high values of up to 97% for the other cell groups (E, M, S), meaning the classifier for this distinction often classified undamaged forest cells as cells in which windthrow damage occured.
To finish off the results chapter in Figure 4 a comparison of the results of visual classification and of Random Forest classification is shown. To summarize the results we conclude that undamaged forest cells and windthrow cells can be distinguished by application of Haralick’s texture features on aerial images with the described resolution. The geolocated orthophotos derived from overlapping aerial photographs have to be segmented into small cells of 50 × 50 m. Before a predictive classification using a random forest classifier can be performed, the algorithm has to be trained with training data from a small part of the aerial image. We achieved the best results for the distinction of severely damaged cells and medium damaged cells, with windthrow cells on the one side and cells with single fallen trees and “no windthrow” cells on the other side.

4. Discussion

4.1. Discussion of the Results

With values ranging between 75% and 95%, we found comparable accuracy values to previous studies, even though it is not possible to compare all cited studies directly. Our study can be best compared with the study of Hamdi et al. [22], since it was carried out on the same data basis and in the same study area.
The accuracy values of 95% found in our study for the “severe only” group, in which we distinguished between two groups in a binary manner (severely damaged cells on the one side against all other cells on the other side), were very good, but differentiating between these two groups is not really helpful for forest practice. The applied remote sensing data source (aerial photographs with a resolution on the ground of 20 × 20 cm per pixel) enabled the visual detection of compact windthrow hotspots easily. On the other hand, the grouping into the “rough” group seemed to have a high practical relevance. The affected forest areas must be localized quickly to assess the damage and to avoid subsequent damage, as storm-damaged trees provide breeding material for insects [44]. According to Einzmann et al. [19], even small windthrow areas have to be detected to remove damaged trees before they are infested by bark beetles or other diseases. Unfortunately, the proposed method of this study does not enable the detection of single, wind-blown, or wind-broken trees, as the results of the fine evaluation grouping have shown.
The detection accuracy of this study, in combination with the resolution, is not only relevant for forest management in Central Europe, but also for silviculture in unmanaged forests in other parts of the world, for example where shelterwood cuttings or partial cuttings are common, because the automated detection of windthrow areas of the defined size can help in understanding and predicting growth processes in these kind of forests [1,4,5].

4.2. Discussion of the Applied Techniques and the Developed Method

Texture metrics are nothing new—the basic idea of pixel-based quantification of properties based on textural differences was originally formulated by Haralick et al. in 1973 [22]. According to Tönnies [45], texture metrics are often applied for segmentation of images. In a forestry context, texture metrics have been applied several times, mostly for classification of a forest area.
Detection of windthrow areas has occurred in the past, mostly based on a change detection approach, which compares pre-storm event data and post-storm event data. Numerous studies have used satellite data. Newer studies tried to detect windthrow areas by only using data taken once after a storm or windthrow event. Especially, these studies tried to detect windthrow areas following the object-based classification approach [32], which tries to detect objects of interest and combine them with larger units of interest. Another characteristic of the newer studies is the increase in resolution of the underlying remote sensing data.
Our approach implements a well-established and well-tested technique on a high-resolution remote sensing data source. Here, we were not interested in the detection of objects (for windthrown “fallen trees”) but wanted to identify small cells in which the objects of interest occurred. The identification of these cells was done by comparison with undisturbed cells.
The presented approach has several advantages and disadvantages, which we want to discuss in this section. The first advantage is that the proposed method requires comparatively little computing effort. This is in contrast to the study of Hamdi et al. [22], who also worked with aerial photographs of the same area with the same spatial resolution. Their detection accuracy was slightly better, but they described the hardware requirements related to the necessary GPU computing power as one limiting factor. In this context, another advantage of our approach is that it can be conducted by applying software that is generally available and completely free. This is in contrast to all of the cited studies, which have used free software as a supplement at best. The next advantage is that the presented method enables not only the detection of hotspots, but also enables a rough estimation of the severity of the damage caused by a storm event. Unfortunately, this is limited to the detection of cells where about half of the cell or more shows damage. Another advantage of our method is that remote sensing data are only needed once after a storm event. This avoids many of the problems experienced in the cited change detection approaches, especially because of inconsistencies in the positional accuracy of bitemporal remote sensing data. The latter advantage of the proposed method is also a disadvantage, because remote sensing data (in our case aerial photographs) must have been taken immediately after a storm event took place. The storm-damaged trees have to be visible in the data because they cause the differences in texture metrics in damaged cells in comparison to cells that are not affected by windthrow. If salvage logging has already taken place, it is expected that the proposed method will not work as well, whereby a decrease in accuracy is expected.

4.3. Starting Points for Further Research

The proposed method has shown promising results that encourage us to plan further research in this context. There are some general things that should be done to generalize the results. One possible starting point is the understanding of the required cell size in the context of the spatial resolution of the remote sensing data source. In this study, we followed the assumption that a cell size of 50 × 50 m enables the detection of windthrow hotspots for forest practitioners. This cell size should be varied in further investigations, because on the one hand smaller cells could provide more detailed information about the location of windthrow cells, while on the other hand they could help in understanding the limitations of the proposed method of detecting windthrow hotspots via cells. The application for this method for other post-event remote sensing data (particularly aerial photographs) should prove the transferability and the universality of the presented approach. In the context of the proposed work chain, especially the calculation of texture metrics [39] and the training of the random forest classifier, parameter tuning could help to optimize the classification results or to identify limitations. Additionally, the sensitivity to brightness variations from topographic shadowing and photographic exposure should be examined in the future.

5. Conclusions

The application of the well-established Haralick’s texture features enables the rapid detection of windthrow hotspots in single-date digital orthophotos with high precision. One big advantage of the presented method is that it is not computationally demanding, and the applied components are all available for free. Before the results of this study can be generalized, further research in this context should be done, involving optimization of the cell size or testing of the method on other data with varying parameters.

Author Contributions

H.-J.K. conceived and designed the experiments. H.-J.K. performed the experiments. H.-J.K. analyzed the data. H.-J.K. and C.S. contributed materials and analysis tools. H.-J.K., C.S., and R.S. wrote the paper. All authors have read and agreed to the published version of the manuscript.

Funding

The study was funded by Bavarian Ministry of Nutrition, Agriculture, and Forestry, through the grant “Environmental Monitoring”, D25.

Acknowledgments

We are grateful for the help of Elias Rank, who classified data in his traineeship at the Bavarian Institute of Forestry in February and March 2019. We are also grateful for the comments and suggestions of two anonymous reviewers who helped to improve the paper.

Conflicts of Interest

The authors declare no conflict of interest.

References

  1. Ruel, J.C. Understanding windthrow: Silvicultural implications. For. Chron. 1995, 71, 434–445. [Google Scholar] [CrossRef]
  2. Gardiner, B.; Blennow, K.; Carnus, J.-M.; Fleischer, P.; Ingemarson, F.; Landmann, G. (Eds.) Living with Storm Damage to Forests; European Forest Institute (EFI): Joensuu, Finland, 2013; p. 132. [Google Scholar]
  3. Seidl, R.; Müller, J.; Wohlgemut, T. Konzepte, Störungen und Biodiversität. In Störungsökologie; Wohlgemut, T., Jentsch, A., Seidl, R., Eds.; UTB: Stuttgart, Germany, 2019; pp. 75–90. [Google Scholar]
  4. Montoro Girona, M.; Morin, H.; Lussier, J.M.; Ruel, J.C. Post-cutting mortality following experimental silvicultural treatments in unmanaged boreal forest stands. Front. For. Glob. Chang. 2019, 2, 4. [Google Scholar] [CrossRef] [Green Version]
  5. Girona, M.M.; Rossi, S.; Lussier, J.M.; Walsh, D.; Morin, H. Understanding tree growth responses after partial cuttings: A new approach. PLoS ONE 2017, 12, e0172653. [Google Scholar]
  6. IPCC. Managing the Risks of Extreme Events and Disasters to Advance Climate Change Adaption; Field, C.B., Barros, V., Stocker, T.F., Qin, D., Dokken, D.J., Ebi, K.L., Mastrandrea, M.D., Mach, K.J., Plattner, G.-K., Allen, S.K., et al., Eds.; Cambridge University Press: Cambridge, UK, 2012; p. 582. [Google Scholar]
  7. Hame, T.; Heiler, I.; San Miguel-Ayanz, J. An unsupervised change detection and recognition system for forestry. Int. J. Remote Sens. 1998, 19, 1079–1099. [Google Scholar] [CrossRef]
  8. Miller, D.R.; Quine, C.P.; Hadley, W. An investigation of the potential of digital photogrammetry to provide measurements of forest charactersitics and abiotic damage. For. Ecol. Manag. 2000, 135, 279–288. [Google Scholar] [CrossRef]
  9. Womble, J.A. Remote-Sensing Applications to Windstorm Damage Assessment, Diss; Texas Tech. University: Lubbock, TX, USA, 2005; p. 348. [Google Scholar]
  10. Fransson, J.; Pantze, A.; Eriksson, L. Mapping of windthrown forests using satellite SAR images. In Proceedings of the IGARSS 2010 Symposium, Remote Sensing: Global Vision for Local Action, Honolulu, HI, USA, 25–30 July 2010; pp. 1242–1245. [Google Scholar]
  11. Jonikavicius, D.; Mozgeris, G. Rapid Assessment of wind storm-caused forest damage using satellite images and stand-wise forest inventory data. iForest 2013, 6, 150–155. [Google Scholar] [CrossRef] [Green Version]
  12. Elatawneh, A.; Wallner, H.; Manakos, I.; Schneider, T.; Knoke, T. Forest cover database updates using multi-seasonal RapidEye data—Storm event assessment in the Bavarian Forest National Park. Forests 2014, 5, 1284–1303. [Google Scholar] [CrossRef] [Green Version]
  13. Baumann, M.; Ozgodan, M.; Wolter, P.T.; Krylov, A.; Vladimirova, N.; Radeloff, V.C. Landsat remote sensing of forest windfall disturbance. Remote Sens. Environ. 2014, 143, 171–179. [Google Scholar] [CrossRef]
  14. Chehata, N.; Orny, C.; Boukis, S.; Guyon, D.; Wigneron, J.P. Object-based change detection in wind-storm damaged forests using high resolution multispectral images. Int. J. Remote Sens. 2014, 35, 4758–4777. [Google Scholar] [CrossRef]
  15. Furtuna, P.; Haidu, I.; Holobaca, I.H.; Alexe, M.; Rosca, C.; Petrea, D. Assessment of the forest disturbance rate caused by windthrow using remote sensing techniques. In Proceedings of the PIERS Proceedings, Prague, Czech Republic, 6–9 July 2015; pp. 162–166. [Google Scholar]
  16. Pirotti, F.; Travaglini, D.; Gionatti, F.; Kutchartt, E.; Bottalico, F.; Chirici, G. Kernel fetures cross-correlation for unsupervised quantification of damage from windstorms in forests. In Proceedings of the International Archives of the Photogrammetry, Remote Sensing and Spatial Information Sciences, XXIII ISPRS Congress, Prague, Czech Republic, 12–19 July 2016; Volume XLI–B7, pp. 17–22. [Google Scholar] [CrossRef]
  17. Duan, F.; Wand, Y.; Deng, L. A novel approach for coarse-to-fine windthrown tree extraction based on Unmanned Aerial vehicle images. Remote Sens. 2017, 9, 306. [Google Scholar] [CrossRef]
  18. Einzmann, K.; Immitzer, M.; Böck, S.; Bauer, O.; Schmitt, A.; Atzberger, C. Windthrow detection in European Forests with very high-resolution optical data. Forests 2017, 8, 21. [Google Scholar] [CrossRef] [Green Version]
  19. Mokros, M.; Vybost’ok, J.; Merganic, J.; Hollaus, M.; Barton, I.; Koren, M.; Tomastik, J.; Cernava, J. Early stage forest windthrow estimation based on Unmanned Aircraft System Imagery. Forests 2017, 8, 306. [Google Scholar] [CrossRef] [Green Version]
  20. Kingfield, D.M.; de Beurs, K.M. Landsat Identification of Tornado Damage by Land Cover and an Evaluation of Damage Recovery in Forests. J. Appl. Meteorol. Climatol. 2017, 56, 965–987. [Google Scholar] [CrossRef]
  21. Chirici, G.; Bottalico, F.; Gianetti, F.; del Perudia, B.; Travaglini, D.; Nocentini, S.; Kutchard, E.; Marchi, E.; Foderi, C.; Fioravanti, M.; et al. Assessing forest windthrow damage using single-date, post event airborne laser scanning data. Forestry 2018, 91, 27–37. [Google Scholar] [CrossRef] [Green Version]
  22. Hamdi, Z.M.; Brandmeier, M.; Straub, C. Forest damage assessment using deep learning on high resolution remote sensing data. Remote Sens. 2019, 11, 1976. [Google Scholar] [CrossRef] [Green Version]
  23. Panagiotidis, D.; Abdollahnejad, A.; Surovy, P.; Kuzelka, K. Detection of fallen logs from high-resolution UAV images. N. Z. J. For. Sci. 2019, 49. [Google Scholar] [CrossRef]
  24. Rüetschi, M.; Small, D.; Waser, L.T. Rapid detection of windthrows using Sentinal-1 C-Band SAR data. Remote Sens. 2019, 11, 115. [Google Scholar] [CrossRef] [Green Version]
  25. Haralick, R.M.; Shanmugam, K.; Dinstein, I. Textural features for image classification. IEEE Trans. Syst. Man Cybern. 1973, SMC-3, 610–621. [Google Scholar] [CrossRef] [Green Version]
  26. Hall-Beyer, M. GLCM Texture: A Tutorial. 3rd Version; Univ. of Calgary: Calgary, AB, Canada, 2017; p. 75. [Google Scholar]
  27. Kushwaha, S.P.S.; Kuntz, S.; Oesten, G. Applications of image texture in forest classification. Int. J. Remote Sens. 1994, 15, 2273–2284. [Google Scholar] [CrossRef]
  28. Franklin, S.E.; Hall, R.J.; Moskal, L.M.; Maudie, A.J.; Lavi’gne, M.B. Incorporating texture into classification of forest species composition from airborne multispectral images. Int. J. Remote Sens. 2000, 21, 61–79. [Google Scholar] [CrossRef]
  29. Simard, M.; Saatchi, S.S.; de Grandi, G. The use of decision tree and multiscale texture for classification of JERS-1 SAR data over tropical forest. IEEE Trans. Geosci. Remote Sens. 2000, 38, 2310–2320. [Google Scholar] [CrossRef] [Green Version]
  30. Butusov, O.B. Unsupervised forest classification on Landsat-7 images using texture and spectral charactersitics. Mapp. Sci. Remote Sens. 2003, 40, 91–104. [Google Scholar]
  31. Coburn, C.A.; Roberts, A.C.B. A multiscale texture analysis procedure for improved forest stand classification. Int. J. Remote Sens. 2004, 25, 4287–4308. [Google Scholar] [CrossRef] [Green Version]
  32. Lu, D.; Weng, Q. A survey of image classification methods and techniques for improving classification performance. Int. J. Remote Sens. 2007, 28, 823–870. [Google Scholar] [CrossRef]
  33. Bayerisches Staatsministerium für Ernährung, Landwirtschaft und Forsten. Jahresbericht 2017. 2018. Available online: http://www.stmelf.bayern.de/wald/forstverwaltung/jahresbericht/index.php (accessed on 19 March 2020).
  34. Bayerisches Staatsministerium für Ernährung, Landwirtschaft und Forsten. Die Bundeswaldinventur 2012 für Bayern. 2014. Available online: http://www.bundeswaldinventur.bayern.de (accessed on 4 December 2019).
  35. R Core Team. R: A Language and Environment for Statistical Computing; R Foundation for Statistical Computing: Vienna, Austria, 2019; Available online: https://www.R-project.org/ (accessed on 17 December 2019).
  36. Stabler, B. Package ‘Shapefiles’ (A R-Package to Read and Write ESRI-Shapefiles). 2013. Available online: https://cran.r-project.org/web/packages/shapefiles/index.html (accessed on 20 February 2020).
  37. Hijmans, R.J. Package ‘Raster’ (A R-Package for Reading, Writing, Manipulating, Analyzing and Modelling of Gridded Spatial Data. 2020. Available online: https://cran.r-project.org/web/packages/raster/index.html (accessed on 21 February 2020).
  38. Perciano, T. Package ‘Ripa’ (A R-Package for Image Processing and Analysis). 2016. Available online: https://cran.r-project.org/web/packages/ripa/index.html (accessed on 22 May 2018).
  39. Hall-Beyer, M. Practial guidelines for choosing GLCM textures to use in landscape classification tasks over a range of moderate spatial scales. Int. J. Remote Sens. 2017, 38, 1312–1338. [Google Scholar] [CrossRef]
  40. Klemmt, H.-J. RTextureMetrics—A R Package for Calculation of Texture Metrics. 2014. Available online: https://cran.r-project.org/web/packages/RTextureMetrics/ (accessed on 7 September 2016).
  41. Breiman, L. Random Forests. Mach. Learn. 2001, 54, 5–32. [Google Scholar] [CrossRef] [Green Version]
  42. Cutler, D.R.; Edwards, T.C.; Beard, K.H.; Cutler, A.; Hess, K.T. Random forests for classification in ecology. Ecology 2007, 88, 2783–2792. [Google Scholar] [CrossRef]
  43. Chambers, J.M. Graphical Methods for Data Analysis; CRC Press: Boca Raton, FL, USA, 2018; p. 410. ISBN 135108920X. [Google Scholar]
  44. Seidl, R.; Rammer, W. Climate change amplifies the interactions between wind and bark beetle disturbances in forest landscapes. Landsc. Ecol. 2016, 32, 1–14. [Google Scholar] [CrossRef] [Green Version]
  45. Tönnies, K.D. Texturbasierte Segmentierung. In Grundlagen der Bildverarbeitung, 1st ed.; Pearson Studium: Munich, Germany, 2003; pp. 218–221. ISBN 3-8273-7155-4. [Google Scholar]
Figure 1. A 6 × 6 km clip from an aerial photo campaign in the growth region of the Bavarian Forest. On the lower right side, the city of Hauzenberg is shown. Pictures were taken at the end of August 2017. The yellow rectangle, measuring 3 × 1.5 km, represents the training region for the algorithms. Validation was done for the whole area (training region excluded).
Forests 11 00763 g001
Figure 2. Visual representation of the underlying cell-wise workflow of this study. In the top line, three raster cells numbering 4374, 4494, and 4614 with different windthrow intensities are shown. The grey line below represents the step where RGB values are turned into grey-level values. In the line below, grey-level cooccurrence matrix (GLCM) value distributions are shown. In the last grey section, the calculated texture metrics are shown for the raster cells with differing windthrow intensities.
Forests 11 00763 g002
Figure 3. Boxplots for texture metric distributions. In the left column, “severe only” cells are combined. In the middle column, “severe only” and “medium” cells are combined. In the right column, the distributions for all categories (see Table 4) are shown in a comparative manner.
Forests 11 00763 g003
Figure 4. Comparison of classification results. In the left column results of the visual classification are shown. In the right column the results of the random forest classification are presented. The results of the differentiation (according to Table 4) are represented by lines. Each pixel represents a raster cell with a size of 50 × 50 m. Green cells represent forest areas that were not affected by storm damage, while red cells represent windthrow cells (in case of fine distinction: orange = E, red = M, dark-red = S). White cells indicate no forest area.
Forests 11 00763 g004
Table 1. Coordinates of clipped region and training region.
SW (Gauss–Krüger Zone 4, Easting/Northing)NE
(Gauss–Krüger Zone 4, Easting/Northing)
SW
(WGS 84, Lat/Lon)
NE
(WGS 84, Lat/Lon)
Whole clipping region (validation set)4614,000/
5392,000
4620,000/
5398,000
48.655247/
13.545912
48.708058/
13.629057
Training region (training set)4615,200/
5392,950
4616,450/
5395,450
48.663567/
13.562458
48.685808/
13.580123
Table 2. Categories of windthrow intensities used in this study.
Category (Shortcut)Description
Forest area not affected by windthrow (no windthrow, K)Undisturbed forests
Single windthrown trees (except single windthrown trees with no disturbance, E)Only single windthrown trees can be visually detected, the affected area is less than 10% of the cell
Light and medium windthrow intensity (medium, M)Above 10% and up to 50% of the forest cover of a raster cell is affected by windthrow
Severe windthrow intensity (severe, S)Above 50% and up to 100% of the forest cover of a raster cell is affected by windthrow
Table 3. List of the applied texture metrics.
LabelNameFormulaGroup
CONContrast i , j = 0 N 1 P i , j ( i j ) 2 contrast group
DISDissimilarity i , j = 0 N 1 P i , j | i j | contrast group
HOMHomogenity i , j = 0 N 1 P i , j 1 + ( i j ) 2 contrast group
ASMAngular Second Moment i , j = 0 N 1 P i , j 2 orderline group
MPMaximum Probability m a x ( P i , j ) orderline group
ENTEntropy i , j = 0 N 1 P i , j ( l n ( P i , j ) ) orderline group
Table 4. Evaluation groups for detection of windthrow hotspots. For details of the abbreviationsrefer to Table 2.
LabelWindthrowNo Windthrow
severe onlySM, E, K
roughS, ME, K
fineS, M, EK
Table 5. Mean values and p-values for the Welsh t-test for the calculated texture metrics in “severe only” and “rough” groups.
Severe Only Rough
Textura MetricMean of “Windthrow”Mean of “No Windthrow”p-Value (Significance)Mean of “Windthrow”Mean of “No Windthrow”p-Value (Significance)
CON556.91910353.16690<2.2 × 10⁻¹⁶ (***)488.4625345.2069<2.2 × 10⁻¹⁶ (***)
DIS17.2188913.65396<2.2 × 10⁻¹⁶ (***)16.05113.51007<2.2 × 10⁻¹⁶ (***)
HOM0.056420.09345<2.2 × 10⁻¹⁶ (***)0.06575030.0953861<2.2 × 10⁻¹⁶ (***)
DIS0.000250.00074<2.2 × 10⁻¹⁶ (***)0.0003314040.000768352<2.2 × 10⁻¹⁶ (***)
MP0.001000.00349<2.2 × 10⁻¹⁶ (***)0.0014819120.003646079<2.2 × 10⁻¹⁶ (***)
ENT−7.57416−7.48786<2.2 × 10⁻¹⁶ (***)−7.555.060−7.482.981<2.2 × 10⁻¹⁶ (***)
***: p-values < 0.001.
Table 6. Mean values and diagnostic values for an analysis of variance for the texture metrics in the “fine” group.
Fine
Mean Values AOV
Texture MetricSingle Tree (E)Medium (M)Severe (S)No Windthrow (K)F-Valuep-Value
CON386.5521441.2797556.9191336.8318638.7<2.2 × 10⁻¹⁶ (***)
DIS14.3403115.2467317.2188913.4189505.9<2.2 × 10⁻¹⁶ (***)
HOM0.081587210.072056360.056416480.09817586580.3<2.2 × 10⁻¹⁶ (***)
ASM0.0005039760.0003891280.0002476550.000821906235.1<2.2 × 10⁻¹⁶ (***)
MP0.0023891060.0018109380.0010045340.03900698370.3<2.2 × 10⁻¹⁶ (***)
ENT−7.51123−7.541893−7.574163−7.46917835.1<2.2 × 10⁻¹⁶ (***)
***: p-values < 0.001.
Table 7. p-values of non-parametric Mann–Whitney–Wilcoxon tests for the compared groups with fine distinction. Null hypothesis is indicated in bold letters. (abbreviations according to Table 3).
K = EK = MK = SE = ME = SM = S
CON<2.2 × 10⁻¹⁶<2.2 × 10⁻¹⁶<2.2 × 10⁻¹⁶<2.2 × 10⁻¹⁶<2.2 × 10⁻¹⁶<2.2 × 10⁻¹⁶
DIS<2.2 × 10⁻¹⁶<2.2 × 10⁻¹⁶<2.2 × 10−167.518 × 10⁻⁵<2.2 × 10⁻¹⁶<2.2 × 10⁻¹⁶
HOM<2.2 × 10⁻¹⁶<2.2 × 10⁻¹⁶<2.2 × 10⁻¹⁶<2.2 × 10⁻¹⁶<2.2 × 10⁻¹⁶<2.2 × 10⁻¹⁶
ASM<2.2 × 10⁻¹⁶<2.2 × 10⁻¹⁶<2.2 × 10⁻¹⁶<2.2 × 10⁻¹⁶<2.2 × 10⁻¹⁶<2.2 × 10⁻¹⁶
MP<2.2 × 10⁻¹⁶<2.2 × 10⁻¹⁶<2.2 × 10⁻¹⁶<2.2 × 10⁻¹⁶<2.2 × 10⁻¹⁶<2.2 × 10⁻¹⁶
ENT6.76 × 10−83.09 × 10−25.68 × 10−50.38650.33440.1117
Table 8. Confusion matrices for random forest classification for the cells, grouped into the three categories of “severe only”, “rough”, and “fine”.
Severe Only 1 Reference
PredictionKW
K5630122
W126145
Rough 2Reference
PredictionKW
K5075294
W245409
Fine 3Reference
PredictionEKMS
E1392378719
K549412115130
M77808529
S7344113189
1W: severe only cells; K: all others. 2W: severe only and medium cells; K: cells with single fallen trees and no windthrow cells. 3E: cells with single fallen trees; M: medium damaged cells; S: severely damaged cells; K: no windthrow cells.
Table 9. Diagnostic values of the random forest classification (prediction) of the cells in this study, grouped into the three categories “severe only”, “rough”, and “fine”.
Overall StatisticsSevere OnlyRough
Accurcacy0.95880.9105
Kappa0.51750.5524
Sensivity0.543070.58179
Specificity0.978110.95395
Positive Predicted Value0.535060.62538
Negative Predicted Value0.978790.94524
Prevalence0.044330.11672
Detection Rate0.024070.06791
Detection Prevalence0.044990.10858
Balanced Accuracy0.760590.76787
Overall statisticsfine
Accuracy0.7528
Kappa0.3548
Statistics by classesEKMS
Sensivity0.165870.91950.194950.70787
Specificity0.933850.52630.966710.96004
Positive Predicted Value0.288380.84950.313650.45107
Negative Predicted Value0.873850.6920.938980.98608
Prevalence0.139130.74410.072390.04433
Detection Rate0.023080.68420.014110.03138
Detection Prevalence0.080030.80540.044990.06957
Balanced Accuracy0.549860.72290.580830.83395

