Modeling Drying of Degenerated Calluna vulgaris for Wildfire and Prescribed Burning Risk Assessment


Fire Disasters Research Group, Department of Safety, Chemistry and Biomedical Laboratory Sciences, Western Norway University of Applied Sciences, 5528 Haugesund, Norway
Forests 2020, 11(7), 759; https://doi.org/10.3390/f11070759
Submission received: 19 June 2020
/
Revised: 9 July 2020
/
Accepted: 10 July 2020
/
Published: 14 July 2020
(This article belongs to the Special Issue Forest Fire Risk Prediction)
Abstract
:Research highlights: Moisture diffusion coefficients for stems and branches of degenerated Calluna vulgaris L. have been obtained and a mathematical model for the drying process has been developed and validated as an input to future fire danger modeling. Background and objectives: In Norway, several recent wildland–urban interface (WUI) fires have been attributed to climate changes and accumulation of elevated live and dead biomass in degenerated Calluna stands due to changes in agricultural activities, i.e., in particular abandonment of prescribed burning for sheep grazing. Prescribed burning is now being reintroduced in these currently fire prone landscapes. While available wildfire danger rating models fail to predict the rapidly changing fire hazard in such heathlands, there is an increasing need for an adapted fire danger model. The present study aims at determining water diffusion coefficients and develops a numerical model for the drying process, paving the road for future fire danger forecasts and prediction of safe and efficient conditions for prescribed burning. Materials and methods: Test specimens (3–6 mm diameter) of dead Calluna stems and branches were rain wetted 48 h and subsequently placed in a climate chamber at 20 °C and 50% relative humidity for mass loss recordings during natural convection drying. Based on the diameter and recorded mass versus time, diffusion coefficients were obtained. A numerical model was developed and verified against recoded mass loss. Results: Diffusion coefficients were obtained in the range 1.66–10.4 × 10⁻¹¹ m2/s. This is quite low and may be explained by the very hard Calluna “wood”. The large span may be explained by different growth conditions, insect attacks and a varying number of years of exposure to the elements after dying. The mathematical model described the drying process well for the specimens with known diffusion coefficient. Conclusions: The established range of diffusion coefficients and the developed model may likely be extended for forecasting moisture content of degenerated Calluna as a proxy for fire danger and/or conditions for efficient and safe prescribed burning. This may help mitigate the emerging fire risk associated with degenerated Calluna stands in a changing climate.
1. Introduction
Wildfires represent an increasing threat to people and property in the wildland–urban interface (WUI) worldwide, in particular in the USA, Canada, Australia and the countries surrounding the Mediterranean Sea [1,2,3]. In Europe, the number of fires has in recent years decreased while the impact of the WUI fires has generally become more severe both with respect to the number of fatalities and the number of lost structures [4]. Recently, this has also been an issue in coastal Norway [5,6,7]. This area was part of the North-Western Europe cultural landscape that originated soon after the introduction of livestock husbandry, stretching from Portugal to the Arctic Circle. The heathlands of Western Norway was thus managed by anthropogenic fire regimes to increase pasture value and herbivore production [8], keeping the landscapes virtually free of severe fires. The combination of grazing and prescribed burning was vital for maintaining vegetation composition and successional dynamics in this semi-natural environment [9,10]. Fire removed old vegetation and prevented shrubs and trees from re-establishing in the habitat and was therefore of ecological importance [11]. Fire frequencies were set by the local landuse, and 10–20-year burning rotations were common, although regional and local variation occurred [12,13]. After the fire, a number of grasses and herbs established, including the Calluna regenerating from seeds and through resprouting from stems and subterranean organs [14]. Despite some years with difficult weather conditions, prescribed fire management generally worked well [15]. The Calluna stands in coastal Norway are adapted to these burning cycles to the extent that smoke-adapted germination is observed [16].
A lack of prescribed burning and fire suppression leaves the Calluna to grow larger. Today, this unique coastal landscape is therefore endangered through the lack of traditional management, resulting in older Calluna stands, much accumulated biomass, nature-type degeneration and a succession of bushes and shrubs [14]. This process also results in increasing amounts of dead material on the ground (as litter) as well as in the standing vegetation (dead plants). Due to these changes, the heathlands are now, according to the EC Habitat Directive 92/43/EEC, of international conservation importance [17,18,19]. Similar trends are also observed in Mediterranean Calluna stands, where scrub and woodland encroachment can be observed. There, combinations of prescribed fire, mowing and increased grazing/browsing will be necessary to achieve the long-term conservation of heathlands [20,21]. In old Calluna stands, dead branches constitute the lower canopy [22]. Spot and line fire ignited field burns revealed much more intense fires in old stands (more than 50 years since last burning), compared to young stands (approximately 10 years old) [23]. When unmanaged, Norwegian heathlands gradually develop vegetation compositions where species such as juniper, pine, spruce and birch enter the heathlands as part of a succession. This additionally contributes in the biomass build-up and in particular, junipers (Juniperus communis L.) with their highly flammable resinous foliage contribute considerably to rapid spread of fire [24].
In addition to the fire safety aspect, there are a number of motivations for the increased interest in resuming heathlands in coastal Norway. Among the most important motivations we find, e.g., biodiversity [17], cultural values [25], aesthetics [26], tourism [27] and concerns regarding the trend to increase local food production. Farmers may ask for some limited economic support for prescribed burning and the application success rate is currently high. Grazing is important to keep the heathland habitat. The Old Norse Sheep breed is particularly suited for being kept outside all year grazing the evergreen Calluna, i.e., a practice that stems back to the Viking Age. In the 1970s, the breed was reduced to about 1000 individuals at the islands of Austevoll community, Norway, but now counts 30,000+ individuals. The breed, which is locally branded as Norsk Villsau (Norwegian Wild Sheep), is even protected by a national regulation [28]. Many bird species depend on open landscapes, and the current local decline in, e.g., the majestic Eurasian eagle-owl (Bubo bubo L.) population is of national concern [17]. This comes along with early 19th century introduction of the black-listed Sitka spruce (Picea sitchensis L.) currently invading large areas of Norwegian heathlands [29,30]. Due to all these reasons, managing heathlands by fire to remove old Calluna plants and invasive species, and support Calluna regeneration, is increasingly popular. For resuming prescribed burning, the fire danger needs to be known.
Modern methods, such as remote sensing, may be used for assessing the current fire danger [31,32]. In contrast to remote sensing presenting the current fire danger, fire weather index systems have previously been developed to predict wildfire risk a few days into the future. Anderson and Anderson [33] refined the fine fuel moisture code (FFMC) of the Canadian Fire Weather Index System to predict the fine gorse (Ulex europaeus L.) shrub fuel moisture content, i.e., branches less than 5 mm diameter. The elevated dead fuel moisture content was poorly predicted by the FFMC. Their effort to improve the FFMC prediction accuracy through regression modeling was also unsuccessful. Another approach to predict fire behavior in such fuels is therefore required.
Fire behavior in heathlands is influenced by several factors, such as stand age influencing fuel load, structure and height [33], the fraction of dead fuel [34], fuel moisture content [35,36] and wind speed [37,38,39]. Recent results also indicate that critical differences in fire severity and fuel consumption, including possible destruction of soil seedbanks, can also be linked to the ground fuel layer flammability [30]. Davies et al. [22] revealed that for dry periods during wintertime, live Calluna stems showed no moisture gradient along the height. They also experienced rapid changes in live stems moisture content when the ground was frozen. During field studies in Scottish heathlands, Davies and Legg [40] for on-site spot and line fire ignition discovered a threshold value of lower canopy dead fine fuel moisture content for sustained burning. This shows that keeping track of the dead fuel moisture content is important for evaluating the fire danger of degenerated Calluna dominated heathlands. Being able to predict the fuel moisture content and the wind conditions, fire danger warnings may be issued, and when the fire danger is in a low range, conditions for safe prescribed burning may also possibly be predicted. This would require knowledge of the moisture diffusion coefficient in the critical fuel component, i.e., the elevated dead Calluna stems and branches acting as kindling fuel for engaging the whole Calluna plants in fire [40]. There is indeed a need for understanding and predicting how fast this biomass dries in order to issue valid fire danger ratings.
In Norway, there was no record of subzero temperatures wildfires until January 2014. However, due to decreasing snow cover during recent decades, in combination with accumulated live and dead biomass, the probability for such wildfires was on the rise, though unnoticed by the fire brigades. During January 2014, two surprising wildfires took place in the Atlantic heathlands at Flatanger and Frøya, Norway, 1.9° (210 km) south of the Arctic Circle. The first of these, the 15 km2 Flatanger fire, destroyed more structures than any fire in Norway since 1923 [5]. The reasons for the destruction were many, such as a fire start in the darkness, storm strength wind, extremely rugged terrain, few hours of daylight, no access roads, frozen lakes, rivers and creeks limiting the access to fire water as well as the long distances covered by the fire [7]. On top of that, the climatic conditions had also resulted in the wooden structures, mainly homes, farm buildings, huts and boat sheds, being very susceptible to fire due to a period of dry air exposure [41]. These fires, as well as severe fires in South Western Norway heathlands in April 2019, one of these a result of lost control in prescribed burning, have demonstrated that there is a need for improved fire danger predictions.
In other areas, e.g., the Gulf of Mexico coastal region, prescribed fire is increasingly used as a management tool to restore declining native ecosystems. However, since treated sites are more susceptible to biological invasion of, e.g., Chinese tallow (Triadica sebifera L.) [42] this is a delicate balance. A review on the dynamics of prescribed burning, tree mortality and injury in managing oak natural communities to minimize economic losses in North America was done by Dey et al. [43]. This is indeed easier in the Calluna dominated heathlands, which represent an anthropogenic landscape that used to be managed by regular burning. However, given the current condition of the heathland, the fire risk is considerably higher than for managed heath and there is an urgent need for research to get a grip on the fire danger associated with degenerated heathlands in need of prescribed burning to (a) reduce the accumulated biomass representing the potential fire fuel and (b) return the landscapes to the previous farmland.
Sorption curves for most wildland fuel, Calluna stems and branches included, are not available, i.e., the sorption data for wood [44] currently represents the best available alternative. Diffusion coefficients are, however, established for some plant species. Pith diffusion coefficient for sunflower obtained by Sun et al. [45] was about 1–2.5 × 10⁻⁹ m2/s. Diffusion coefficient for willow stems was reported by Gigler et al. [46] to be 3 × 10⁻¹⁰ m2/s. The value reported for willow stems match with the typical diffusion coefficients for humidity transport in wood, i.e., 1–5 × 10⁻¹⁰ m2/s as reported by Baronas et al. [47]. Studying dehydration kinetics of fermented cocoa beans, Adrover and Brasiello [48] found typical diffusion coefficients of 7.5 × 10⁻¹¹ m2/s at 25 °C. Domínguez-Pérez et al. [49] found for roasted cocoa beans moisture diffusion coefficients in the range 1.26–5.70 × 10⁻¹⁰ m2/s. For lemongrass, Nguyen et al. [50] found effective diffusion coefficient in the range from 7.64 × 10⁻¹¹ to 1.48 × 10⁻¹⁰ m2/s. Schmalko and Alzamora [51,52] studied shrinking, apparent density, sorption curves and moisture diffusion coefficients for yerba mate. For the xylem, the values varied between 1.7 × 10⁻¹⁰ and 8.3 × 10⁻⁹ m2/s. Faggion et al. [53] analyzed drying of yerba mate twigs ranging from 3.5 to 10 mm thickness and established that convection dominated the heat and mass transfer. Betie et al. [54] recorded and modeled the power and instrument transformers insulation paper drying process by thermogravimetric analyses to ensure safe transformer operations. Similar moisture diffusion coefficient studies have, however, not been found for Calluna stands.
The purpose of the present study is to analyze the drying processes of representative elevated dead biomass associated with degenerated (old) Calluna stands, i.e., similar to stands resulting in the January 2014 fires in Flatanger and Frøya [5,6,7], Trøndelag and the April 2019 fires in Tysvær and Sokndal, Rogaland. Based on drying tests, the moisture diffusion coefficient is obtained for selected test specimens at controlled ambient conditions. A numerical model for the involved mass and heat transfer is developed and the modeled results are compared to the results from the drying tests. The potential future outcome is that the model may later on be integrated in, e.g., the Canadian Fire Danger Rating Model for providing reasonable hour by hour fire danger modeling of the degenerated Calluna dominated heathlands currently representing an increasing fire threat in coastal Norway. It may also be used as a tool for assessing safe conditions for prescribed burning. The test specimens and climate chamber mass loss recordings are presented in Section 2. The results from drying tests and numerical modeling are presented and discussed in Section 3. Possible future impact and possible obstacles for future use is also presented in Section 3. Concluding remarks are presented in Section 4. The background theory and numerical model are outlined in Appendix A.
2. Materials and Methods
In heathland fires, the lower Calluna canopy fuel moisture content (FMC) is of high importance regarding sustained fire spread [40]. The drying experiments were therefore arranged to determine the drying rate of dead Calluna stems and branches. Test specimens were collected from Calluna stands in the degeneration phase, i.e., old Calluna stands, from an area south of Haugesund (H), N 59.362, E 5.325 and Ytstevika (Y), N 61.941, E 5.027. These Calluna stands, which are quite representative of the Norwegian coastal heath, had been left unmanaged and not been exposed to prescribed burning or natural fires over the last 50+ years. Some of the plants in these stands died through age while others died through extreme desiccation during the winter of 2014. Such die backs have also been observed in Scotland [55]. Since the Calluna plants may spread by sprouting, test specimens were collected with a minimum of 50 m separation to make sure that they were collected from different plants. The test specimens were stored dry (40–50% relative humidity (RH)) at room temperature prior to further treatment.
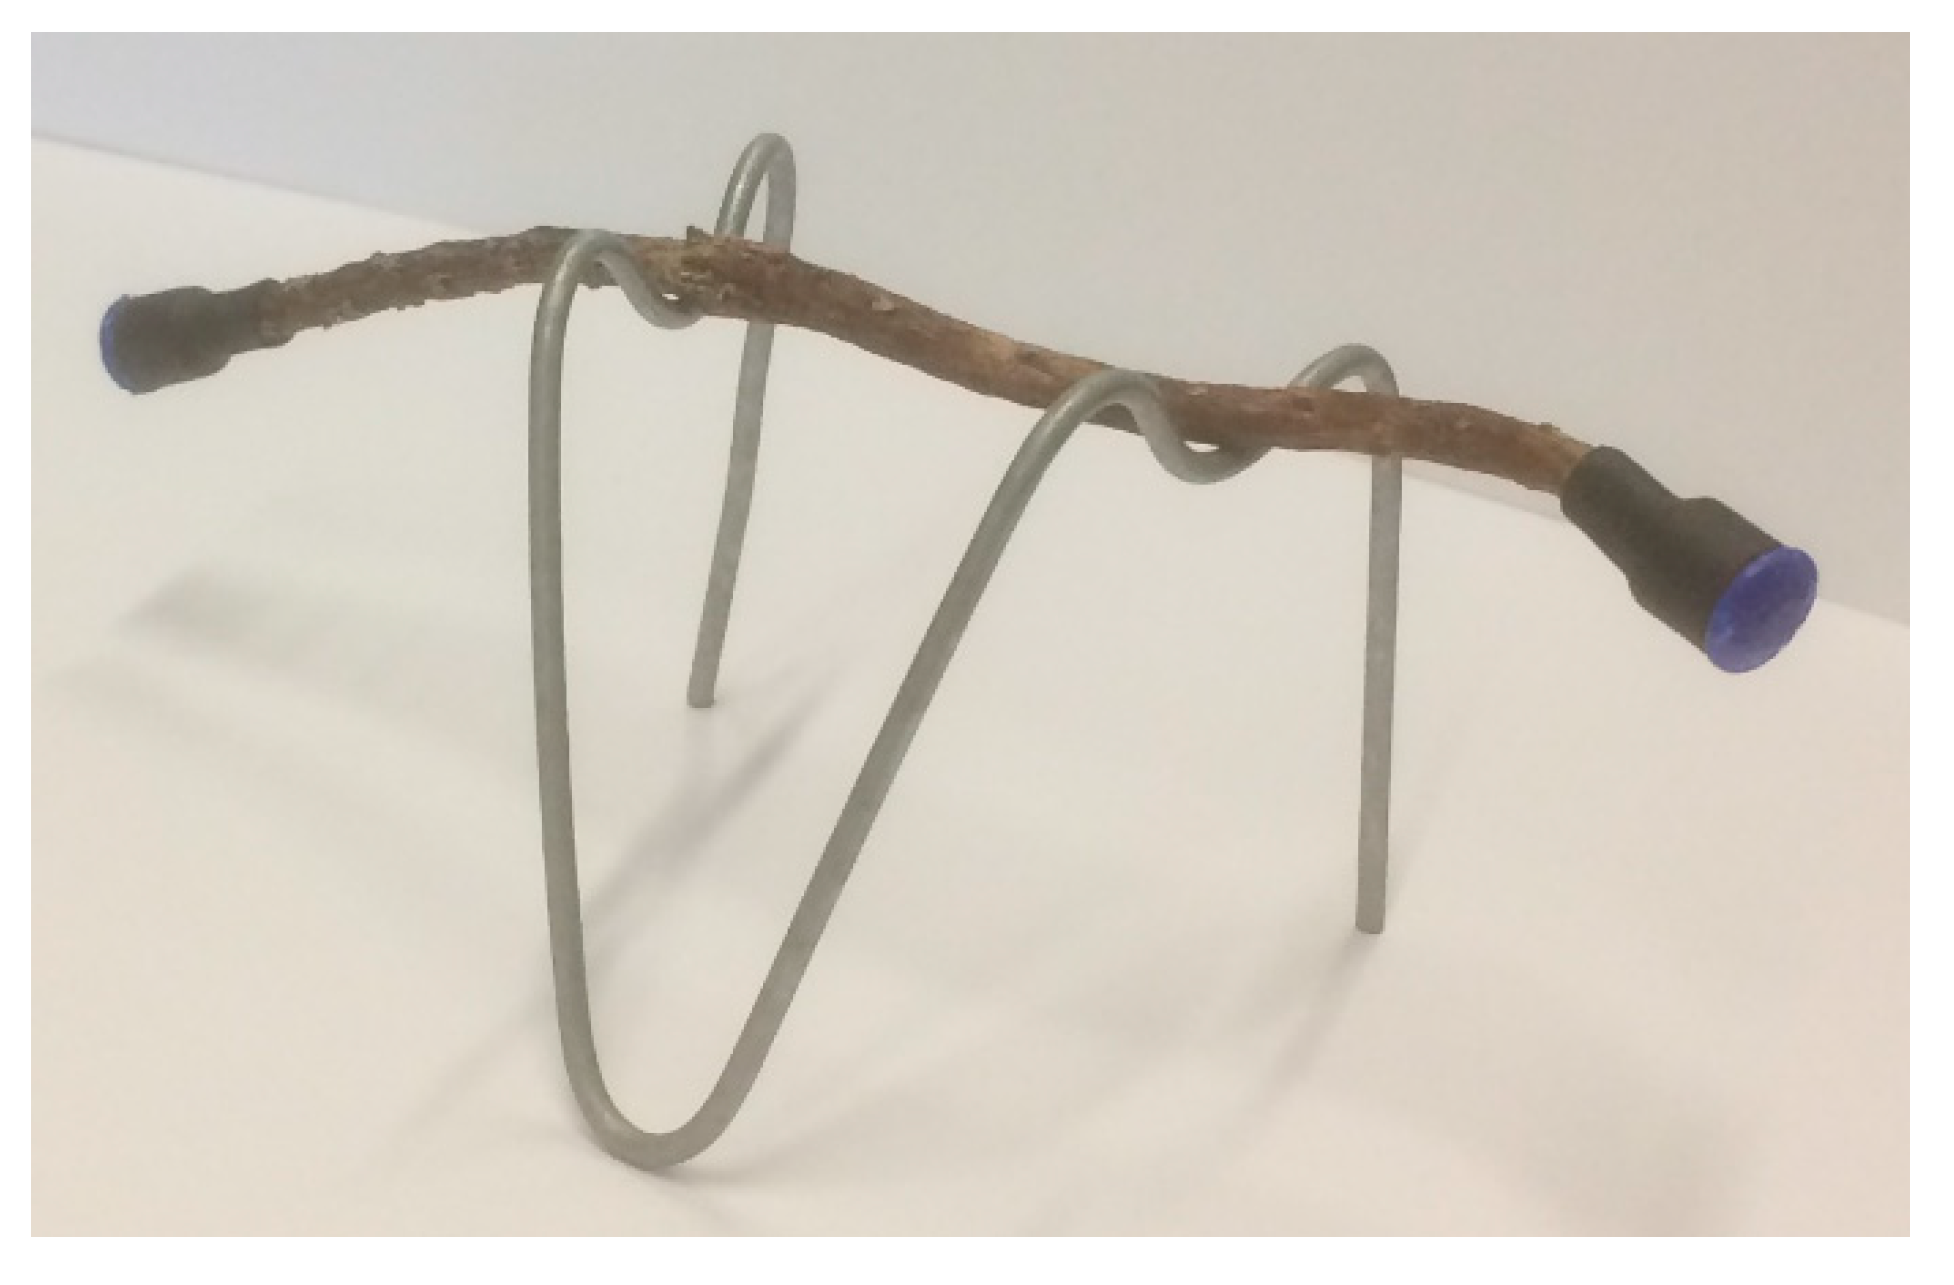
The test specimen diameter was recorded with a caliper at 10 different locations, and it was rotated to get a proper average reading. Test specimens of 3–7 mm diameter were cut to about 200 mm length, placed on a stainless steel grid and gently sprayed with deionized water for 48 h (rate 1 mm/h) prior to the drying tests. After wetting, each test specimen was then cut to 110–160 mm length. They were then equipped with short (3–4 mm) plastic lids to prevent axial drying, as seen in Figure 1.
The drying tests were performed in a climate chamber (Binder KBWF 720) at 20 °C and 50% RH. To ensure vibrational noise dampening, the procedure as explained by Log et al. [7] was used. This included placing a 50 mm thick Styrofoam plate on the lowest grid shelf for noise dampening. A 5 mm thick glass plate rested on the Styrofoam plate and the balance (Sartorius CP324S, resolution 0.1 mg) was placed on top of the glass plate. To limit humidity accumulation in the vicinity of the drying test specimens, the balance side doors were kept open. The air drafts close to the test specimens were recorded to be in the order of 1 cm/s, i.e., practically stagnant air conditions. This set-up has been previously shown to give a noise ratio of as low as ± 0.3 mg root mean square and a ramping of less than 0.01 mg/h [7].
The test specimens were put on stainless steel tripod sample holders designed to minimize the contact area, and the mass loss was recorded every minute until equilibrium moisture content was achieved. This corresponded to a fractional mass loss of less than 10−7/h (10−5%/h). This could typically take a week of drying. After each drying test, the test specimen dry mass was recorded after oven drying for 48 h at 80 °C and then for 48 h at 105 °C. This allowed comparison with results obtained by Davies and Legg [40], who dried their Calluna test specimens at 80 °C to minimize the loss of volatile organic compounds, and for comparison with recommended drying at 105 °C [56].
Based on the recorded mass loss versus time it is possible to obtain the test specimen humidity diffusion coefficient. In the present study, this requires knowledge about the test specimen diameter and the time needed to dry half way () and three quarters of the way () towards the new equilibrium condition. The total number of test specimens was 12 and each drying experiment lasted for one week. All tests revealed the (s) and (s), i.e., respectively the time to reach half and three quarters of the final mass loss. The individual test specimen humidity diffusion coefficients were calculated using Equation (A14), as outlined in Appendix A.
A numerical model was developed for calculating the drying of similar rain wetted Calluna stems and branches. The theory behind the model and the numerical approach is outlined in Appendix A. The modeled mass loss during drying was compared to the results obtained in the climate chamber.
3. Results and Discussion
3.1. Drying Test Results
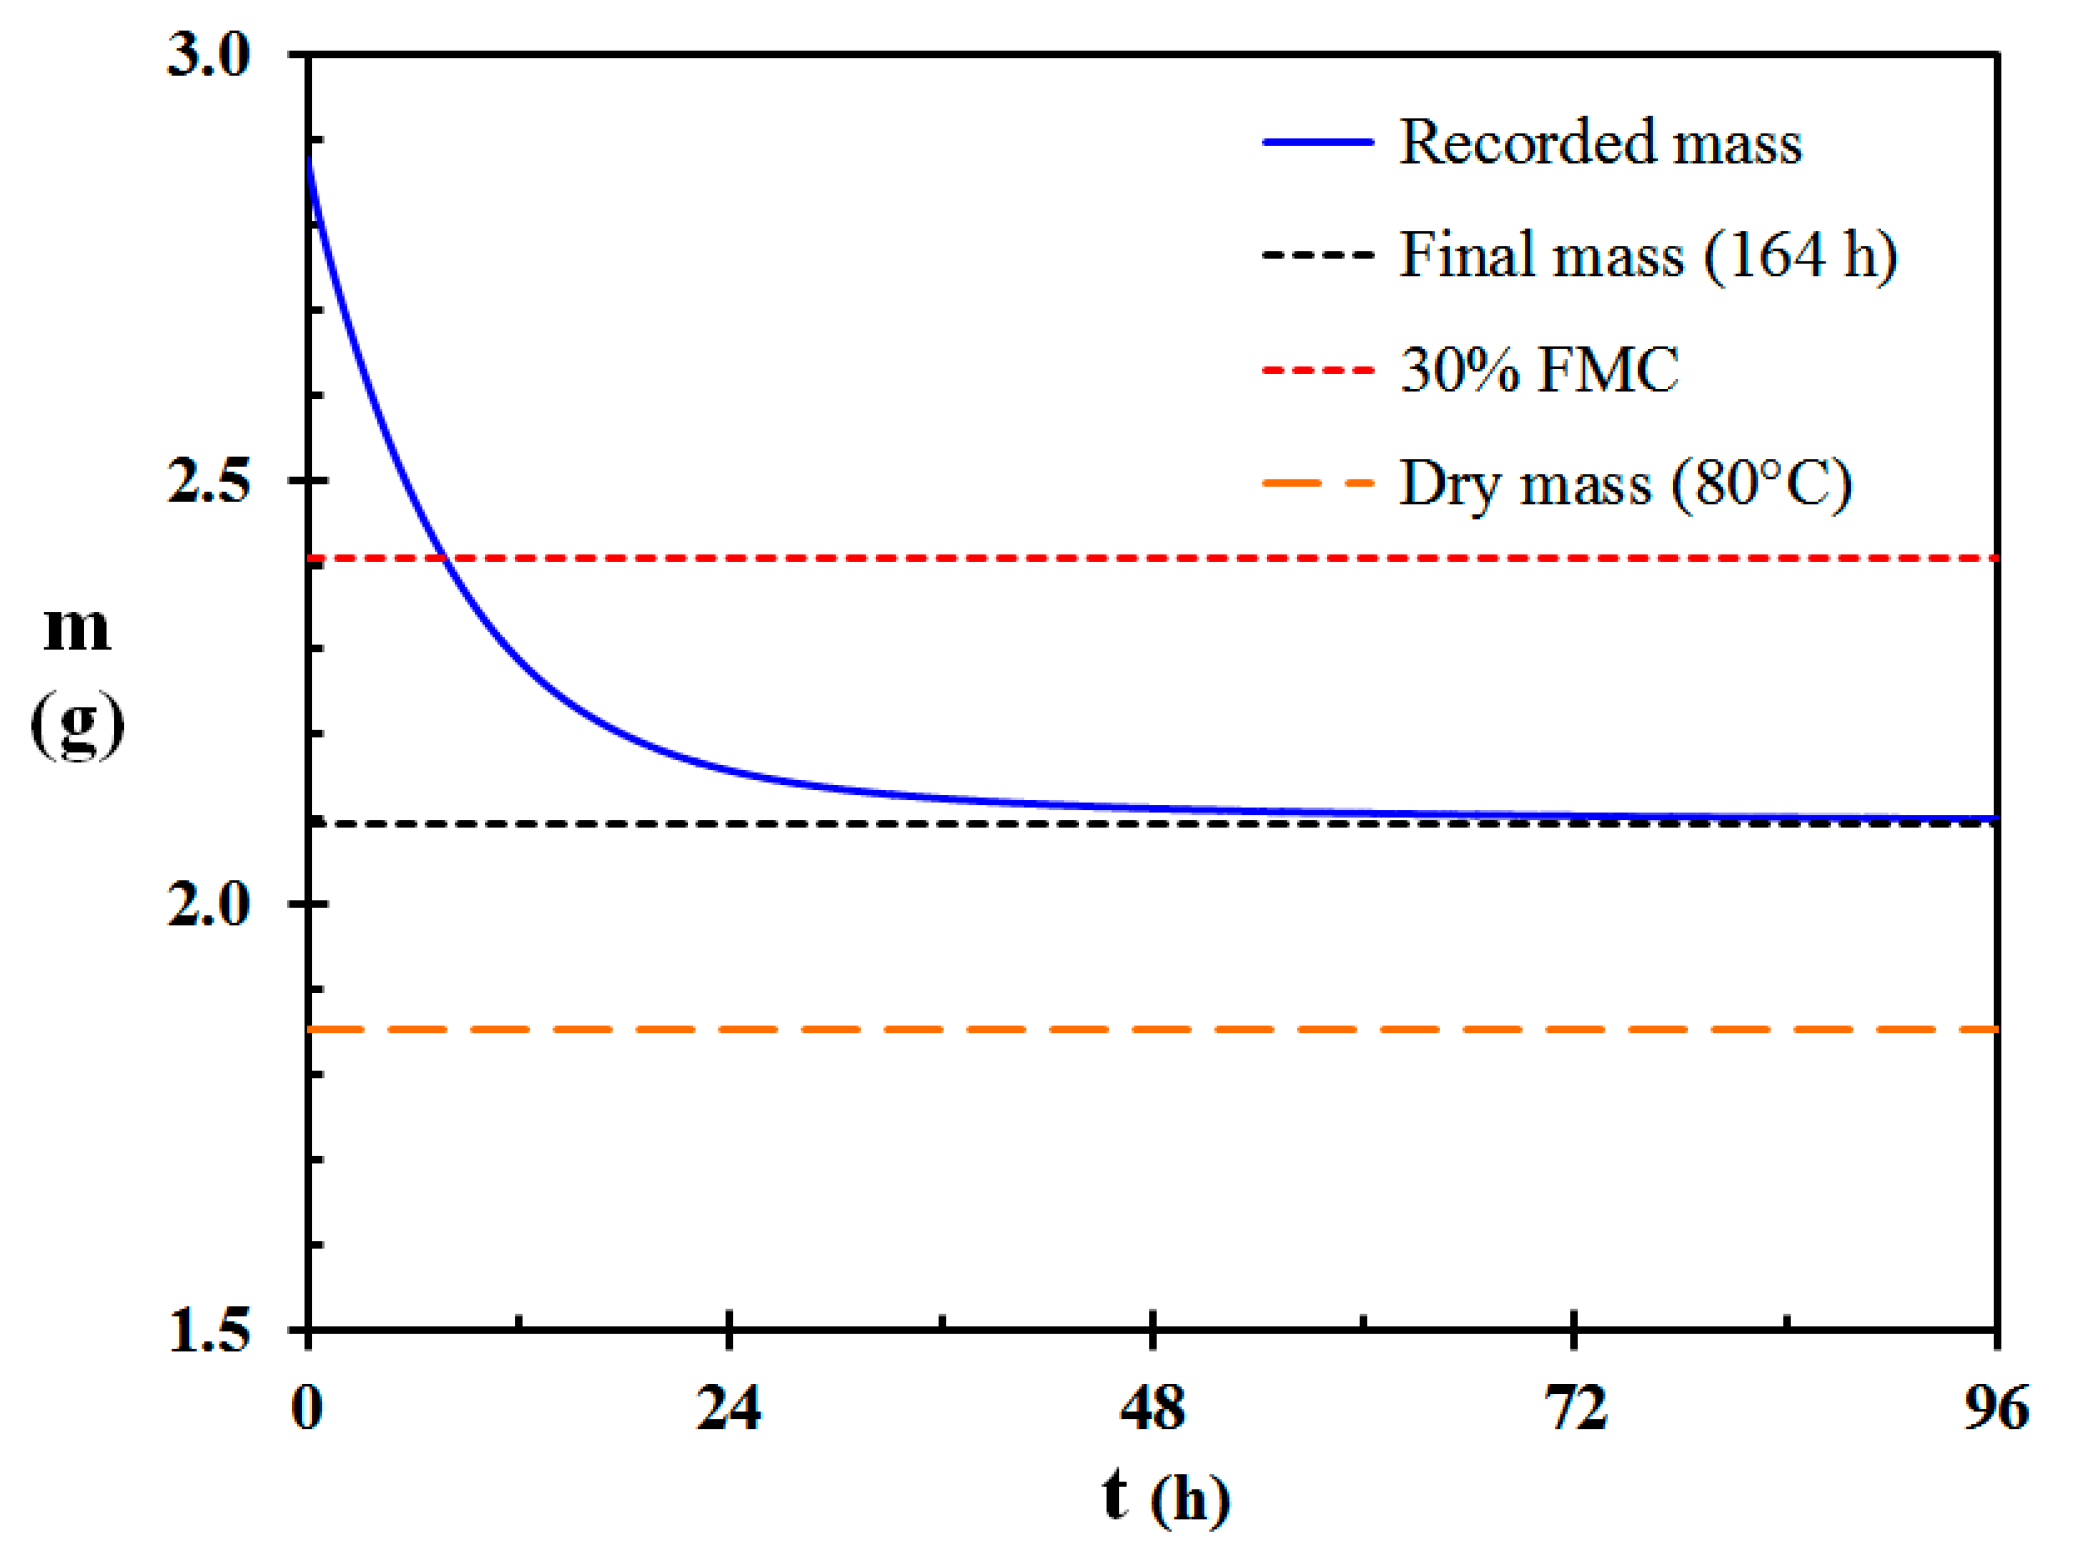
The mass loss versus time for a 6.01 mm (±0.11 mm SD) diameter and 129 mm long test specimen is first presented in detail. When put in the climate chamber, the mass was 2.8767 g. After 164 h (6.8 days) in the climate chamber the strict relative mass loss (based on the dry mass) requirement of 10−7/h was met. The mass was then 2.0964 g, which corresponds to a water mass loss of 0.7803 g. The mass loss as a function of time for the first 96 h (4 days) is presented in Figure 2.
Subsequent oven drying the test specimen at 80 °C for 48 h resulted in a dry mass of 1.8523 g. According to Davies et al. [34], 30% FMC for dead Calluna stems and branches represents the limit for sustained burning succeeding on-site spot and line fire ignition. For the presented test specimen this corresponds to a mass of 2.4080 g, which was reached at 27,970 s (7.77 h). This indicates that degenerated Calluna stands in 50% RH and 20 °C could change from rain wet to combustible within 8 h.
Drying in stagnant air, and starting from rain wet conditions, must be considered as very special conditions. In real conditions, the relative humidity may not be 100% during the nights or succeeding rainy conditions. Hence, the dead branches and stems may be partially dry when possibly exposed to sunlight, lower RH or windy conditions, or a combination thereof. Sunny weather usually generates thermal effects, which in elsewise stagnant conditions may initiate buoyantly driven wind. This would then significantly increase the associated drying rates. The fast drying under real conditions may explain the local prescribed burner groups experience that while not being able to get the Calluna dominated heather alight in the morning, it may burn at dangerous rates in the early afternoon.
The dimensionless mass of water being evaporated during drying is shown in Figure 3. The recorded values for and , respectively 21,005 s (5.83 h) and 42,650 s (11.85 h), are also marked on the figure. Using the recorded values for , and the test specimen radius, the moisture diffusion coefficient according to Appendix A, Equation (A14), was found to be 4.73 × 10⁻¹¹ m2/s. When the moisture diffusion coefficient is known, it may be used for the numerical model presented in Appendix A.4.
3.2. Variation in Recorded Diffusion Coefficients
A total of 12 degenerated Calluna branches were wetted and subsequently dried separately on the balance in the climate chamber at 50% RH as previously described. The test specimen data and the calculated moisture diffusion coefficient for these test specimens are given in Table 1.
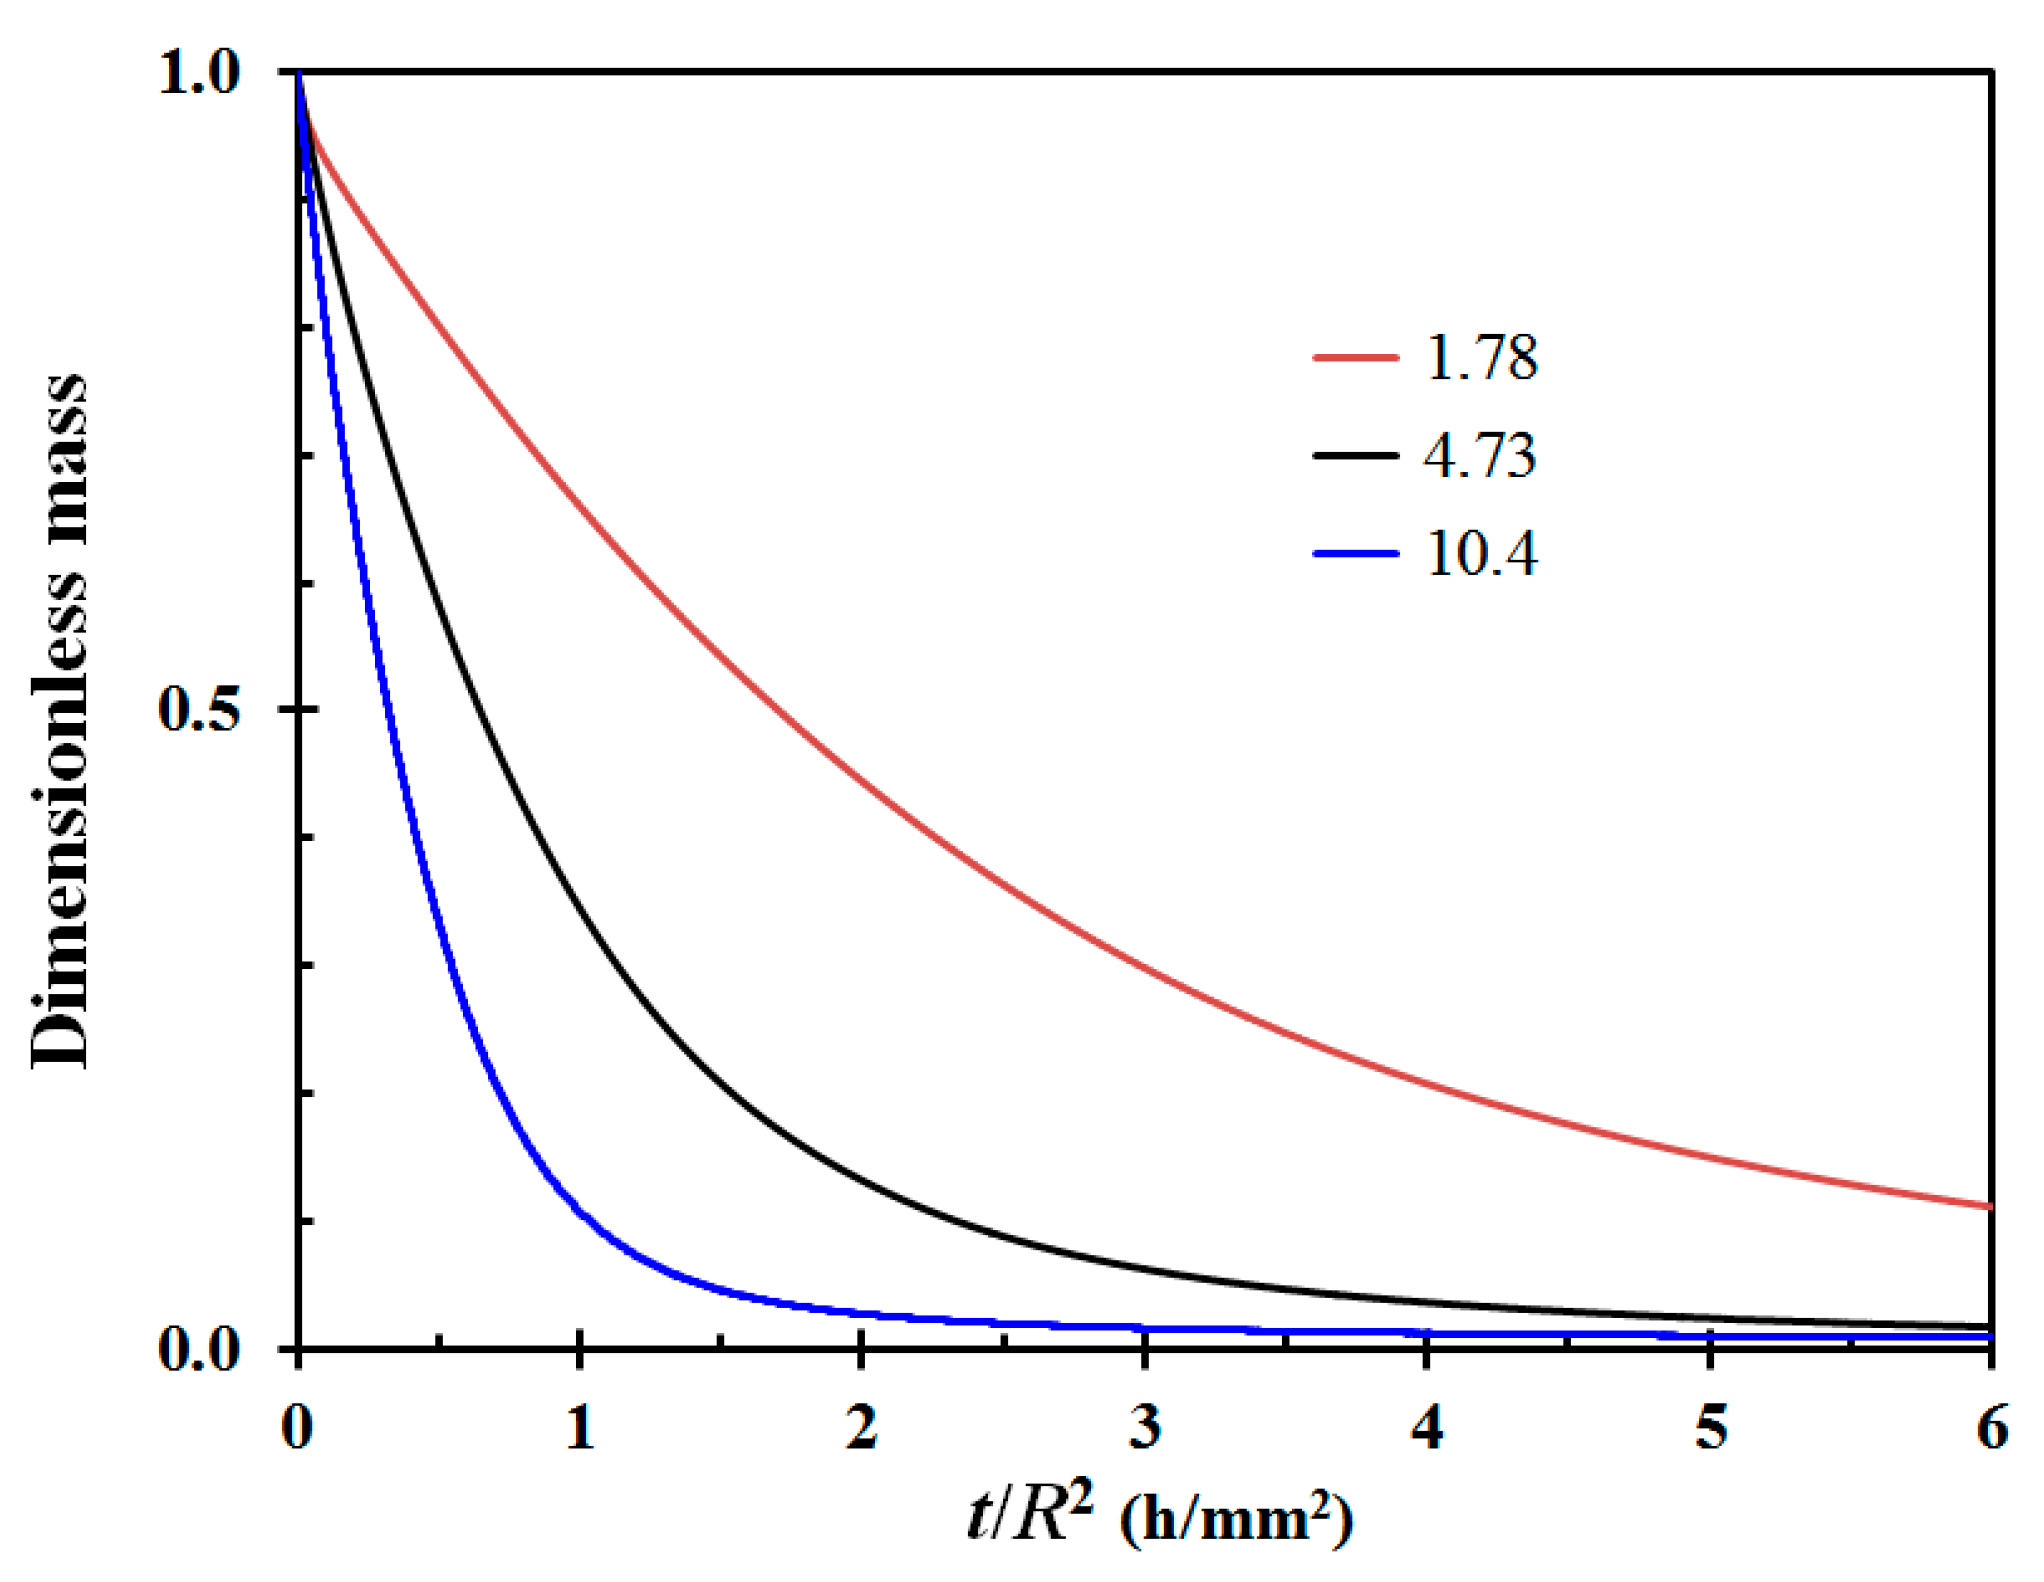
It is quite clear from these drying experiments that the obtained moisture diffusion coefficients vary considerably, i.e., from 1.66 × 10⁻¹¹ to 10.4 × 10⁻¹¹ m2/s. The average diffusion coefficient was 4.16 × 10⁻¹¹ m2/s, with a standard deviation as high as 2.69 × 10⁻¹¹ m2/s. Two of the test specimens displayed a moisture diffusion coefficient close to twice the value of the third highest one, respectively 8.96 × 10⁻¹¹ m2/s and 10.4 × 10⁻¹¹ m2/s. The drying time is according to Appendix A, Equation (A12), a function of radius squared. Normalizing the drying time by the radius squared may then be used to demonstrate the difference in drying time due to varying diffusion coefficients. This is shown in Figure 4 for selected drying tests involving low, medium and high diffusion coefficients.
The present study is, however, not the only study revealing large ranges in moisture diffusion coefficients. Baronas et al. [47] reports typical diffusion coefficients for moisture transport in wood in the range 1–5 × 10⁻¹⁰ m2/s. For lemongrass, Nguyen et al. [50] found effective diffusion coefficient in the range from 7.64 × 10⁻¹¹ to 1.48 × 10⁻¹⁰ m2/s. Schmalko and Alzamora [51,52] recorded xylem moisture diffusion coefficients for yerba mate in the range from 1.7 × 10⁻¹⁰ to 8.3 × 10⁻⁹ m2/s.
There may be several reasons for the large differences in observed moisture diffusion coefficients in the present study. To name a few: the Calluna plants may have grown in areas where there were differences in nutrients giving faster or slower growth rates and thereby softer or harder wood. The dead branches collected may have been dead for a varying number of years, and insect attacks may have made some of them more permeable than others. Cycles of freezing and thawing may in some locations have resulted in crack development and crack expansion thereby resulting in increased porosity for some of the test specimens. Additionally, not to forget, the diameter was varying along the quite tortuous branches, as seen in Figure 1, which in the present study were assumed to be perfect cylinders. It was, however, surprising for the author that the obtained diffusion coefficient varied nearly an order of magnitude from 1.66 × 10⁻¹¹ to 10.4 × 10⁻¹¹ m2/s. Given the many factors making impact on the degenerated Calluna plants during years of exposure to the elements, as well as possible insect attacks, it may be assumed that collecting more samples could have revealed both higher and lower diffusion coefficients.
For future fire danger modeling, the observed variation makes it clear that one cannot assume one single value for the moisture diffusion coefficient. When modeling, the best approach may rather be to use a range of diffusion coefficients, ranging from 1 × 10⁻¹¹ to 20 × 10−11 m2/s, and probably putting more weight on the recorded average value, i.e., about 4 × 10⁻¹¹ m2/s.
3.3. Numerical Modeling Results
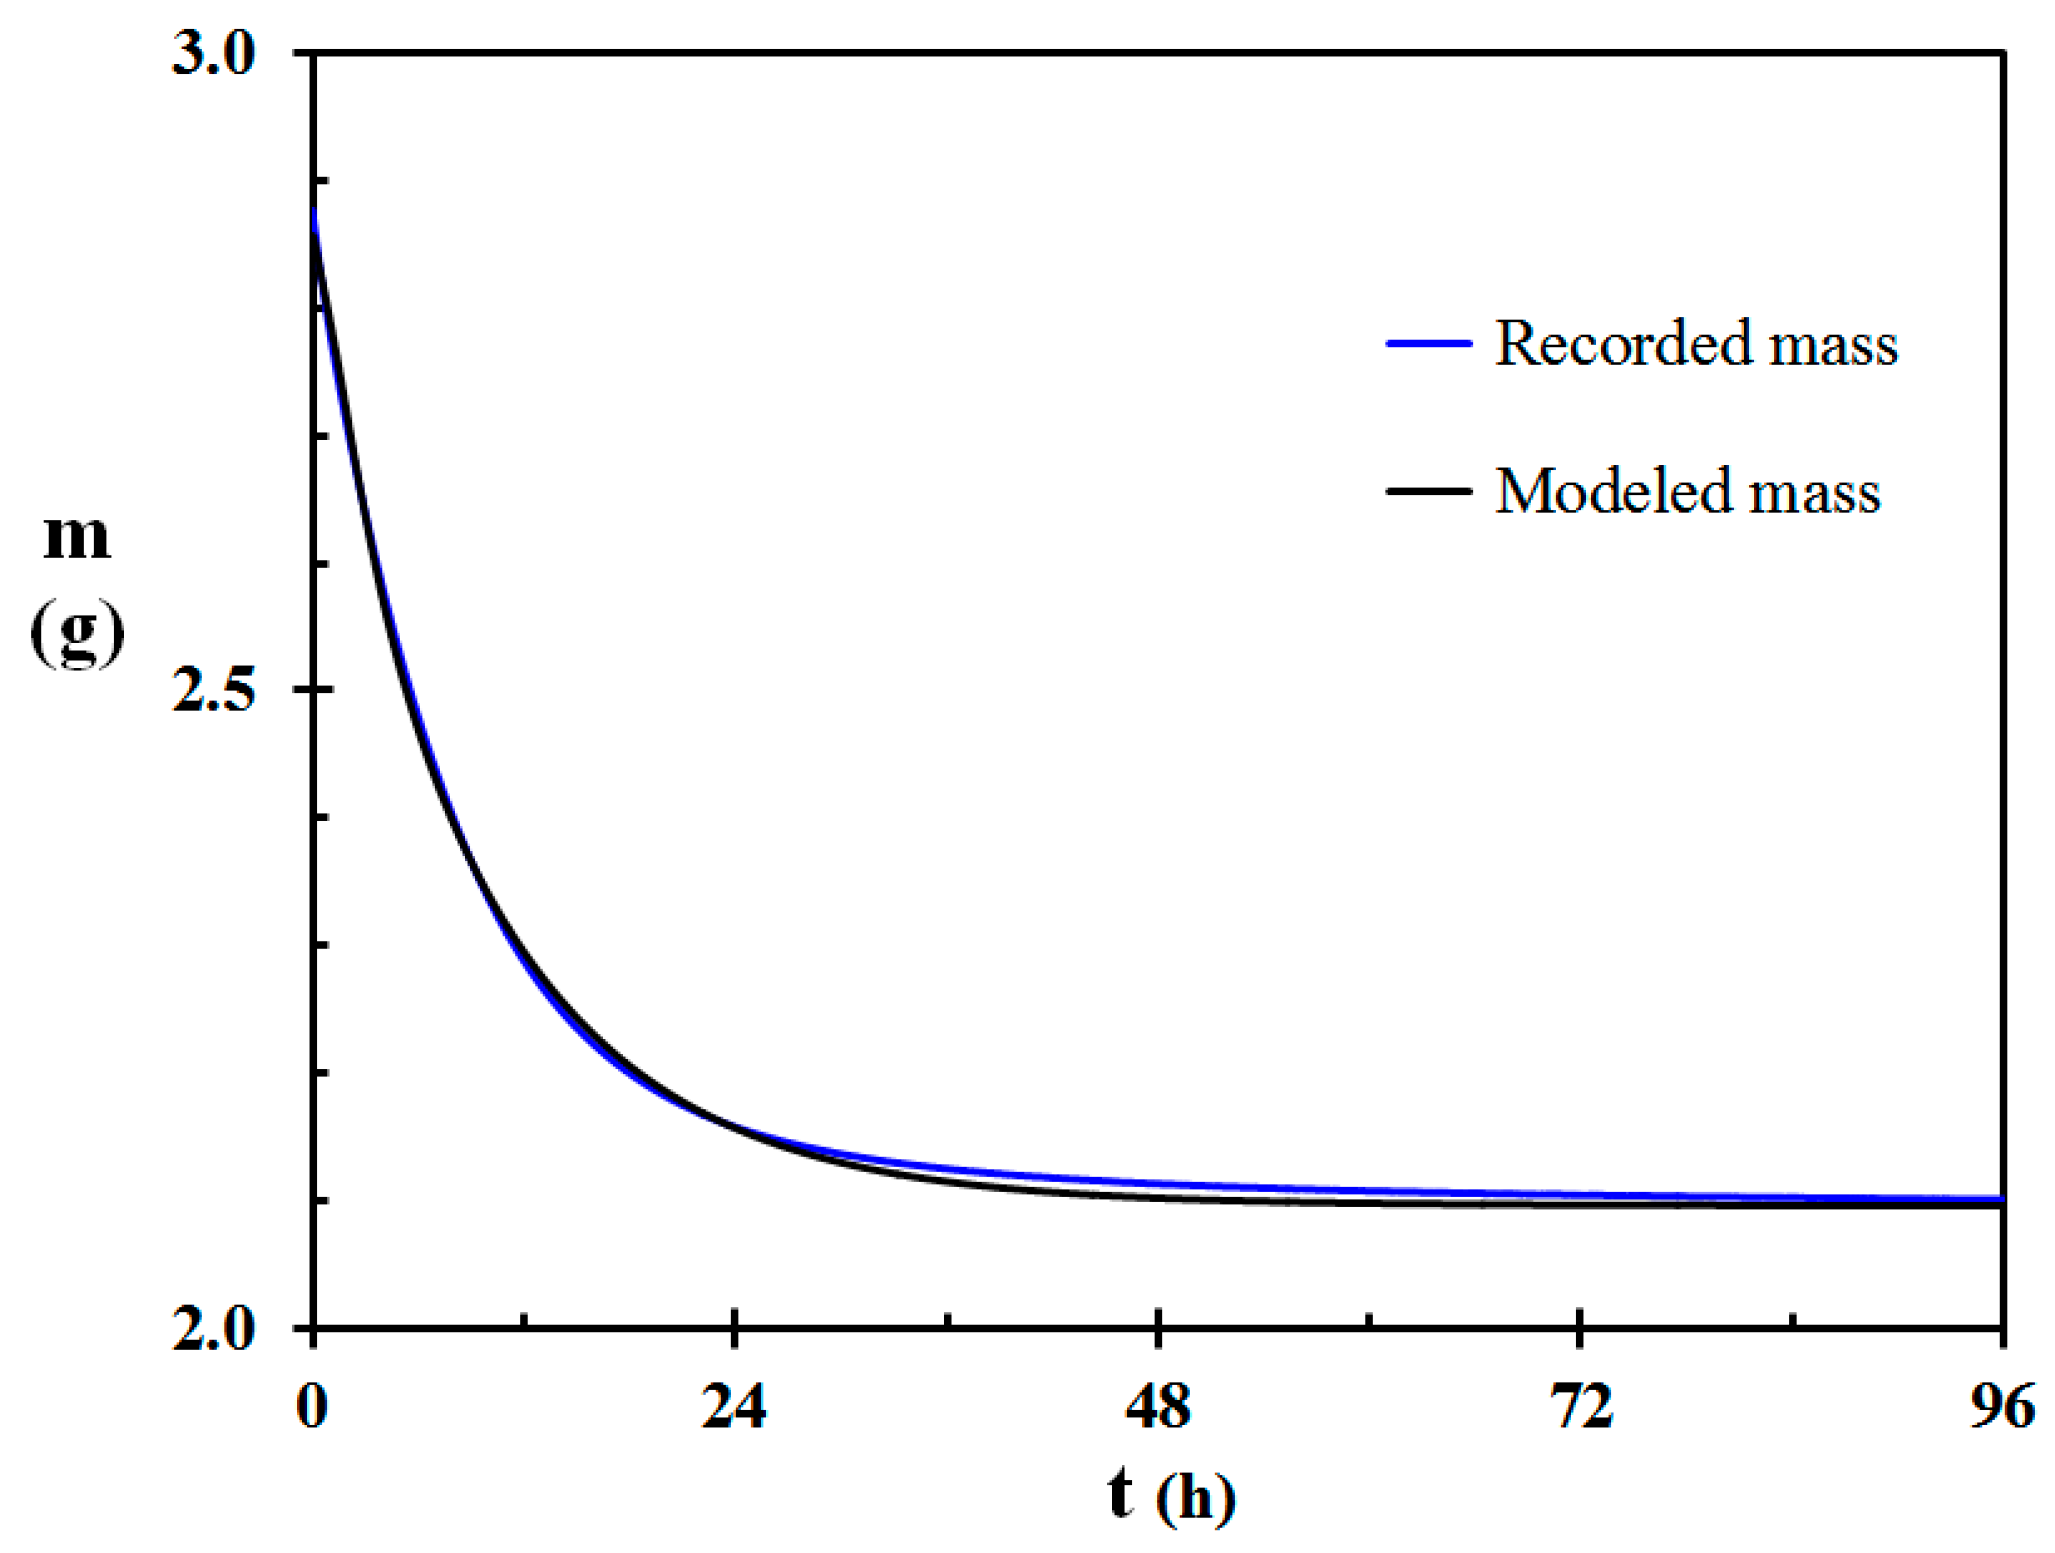
Recorded and modeled mass as a function of time for the 6.01 mm (±0.11 mm) diameter Calluna test specimen is shown in Figure 5. The modeled mass during drying generally follows the recorded values quite well. Some deviations between these two curves may, however, be observed.
There may be several explanations for the deviation between the recorded and modeled mass loss as seen in Figure 5. It may partly be due to the moisture diffusion coefficient varying some with water concentration. The engineering expressions for the convective heat transfer coefficient may also be imprecise. The convective heat transfer to the test specimen may also be slightly increased due to minor air currents in the climate chamber, however, without being too severe. According to the modeling, the heat transfer to the test specimen was dominated by convection. This is in agreement with the findings by Faggion et al. [53]. The heat transfer by radiation is, however, not negligible. The assumption of constant emissivity of the Calluna twig surface may not be strictly correct since the emissivity may vary with the surface water content.
The modeling does, however, give a good indication about the mass loss during free convection drying, and the deviations shown in Figure 5 were quite representative also for the other test specimens. The main reason for the quite good fit is that the model uses a moisture diffusion coefficient established from the drying test, i.e., the modeling is therefore not strictly independent but validates that the modeling method is reliable. It may therefore be concluded that when the moisture diffusion coefficient is known, the modeling gives quite reliable results. If adjusted to the engineering equations describing forced convection drying, it is therefore likely that extending the model for forced convection may work well also for field conditions.
3.4. Future Possibilities
In the present study the drying tests were performed in a climate chamber with stagnant, or at least very close to stagnant ambient conditions, i.e., under free convection. With knowledge of the moisture diffusion coefficients for dead elevated parts of degenerated Calluna stands, modeling drying under forced convection should be possible. By collecting field data about the average branch thicknesses, modeling of drying of complete Calluna plant communities may be possible.
Anderson and Anderson [33] were not able to predict the elevated dead fuel moisture content of gorse (Ulex europaeus L.). By recording moisture diffusion coefficients of elevated dead branches and stems of gorse, it is quite likely that the approach presented in the present study can solve the difficulties encountered for gorse, as well as for similar potential fire fuels.
Based on hourly temperature, relative humidity, wind and insolation forecasts, the presented mathematical model may be expanded to predict the fire danger conditions of degenerated Calluna stands. Getting good estimates of the fire danger 48 h into the future would be very beneficial for the fire brigades. Being better prepared may assist in preventing losses as experienced in the Flatanger WUI fire [5,6,7]. Permanent manning of rural fire stations on high risk days, allowing for a significantly faster response in the case of a fire, could also be decided based on proper fire danger modeling. This is in line with fleet allocations, as suggested by Pérez et al. [57] according to the seasons, although for shorter periods, or even single days, when the fire risk is expected to be particularly high. The fire brigades could also ban prescribed burning on days of too high fire danger predictions. This would help reduce the fire disaster risk as suggested by Log et al. [58].
Modeling real conditions, e.g., 48 h ahead would also be of great value when planning to perform prescribed burning. Knowledge about days when prescribed burning can be done efficiently and knowledge about days when the risk of losing control is too high would be very valuable and may result in less contradiction regarding prescribed burning [59].
4. Conclusions
Drying of rain wet degenerated Calluna stems and branches under free convection condition at 50% relative humidity revealed moisture diffusion coefficients in the range from 1.66 × 10⁻¹¹ to 10.4 × 10⁻¹¹ mm2/s. The mean value was 4.16 ± 2.69 × 10⁻¹¹ mm2/s. Numerical modeling of the natural convection drying process gave results close to the recorded mass loss. This is promising regarding future expansion of the numerical model to field conditions, i.e., forced convection, wind and insolation. Based on weather forecasts, this may pave the road for forecasting the dryness of the degenerated Calluna stands for safe prescribed burning as well as for alarming about high fire danger. The fire brigades may use such predictions to be better prepared if the conditions are likely to develop into high danger and may use this information to ban prescribed burning on high risk days.
Funding
The present work was supported by the Norwegian Research Council, grant no 298993 “Reducing fire disaster risk through dynamic risk assessment and management (DYNAMIC)” and the Fire Disaster Research Group, Western Norway University of Applied Sciences (HVL). The APC was funded by HVL.
Acknowledgments
The author appreciate the help from Liv Guri Velle for collecting Calluna branches at Nerlandsøy and the support from Gunnar Thuestad for wetting the test specimens and performing some of the drying tests while the author was on a mission to the Arctic areas of Norway. The improvements suggested by the two anonymous reviewers are highly appreciated.
Conflicts of Interest
The authors declare no conflict of interest.
Appendix A. (Theory and Model Description)
Appendix A.1. Water Vapor Concentration in Air
The exchange of humidity adsorbed, , to water in the gas phase, , may be described by:
and the process may thermodynamically be described by:
where (J/mol), (J/mol) and (J/mol∙K) are the Gibbs energy, enthalpy and entropy of the vaporization process described in Equation (A1). The drying process is entropy driven, and as the enthalpy of water evaporation is very high, the evaporation process results in temperature depletion during drying. The heat required for the drying process of a suspended stem or branch is supplied through convection and heat radiation.
The saturation vapor pressure of water is an almost exponential function of temperature, Tc (°C), and may be expressed by [60]:
The corresponding vapor concentration of water at a given temperature, T (K), may then be obtained by:
where (0.01802 kg/mol) is the molecular mass of water and (8.314 J/K∙mol) is the universal gas constant. The dryness of the air relative to the saturation conditions is usually expressed as the air relative humidity (RH), i.e., RH = / = /.
In Western Norway coastal areas, the relative humidity is generally quite high. In conditions of adiabatically heated air, e.g., due to high pressure subsidence or foehn wind, clear skies are often experienced. During the spring months of March and April, the sun’s heat radiation adds significantly to the ambient air temperature increase. This further lowers the relative humidity of the ambient air. The sun also directly heats the wildland fuel, which thereby experience very low humidity air in the close vicinity of the fuel surface. This results in drying of the heather, and in particular, drying of the dead biomass fraction, which has no access to soil humidity. This drying renders the accumulated and elevated dead heathland biomass very prone to fires.
Appendix A.2. Wooden Fuel Equilibrium Moisture Content (EMC)
Dependent on the previous sorption history and the current conditions, dead cellulose based biomass, such as wood and dead Calluna stems and branches, adsorb humidity from or release humidity to, the surrounding air. Cellulosic materials consists of complicated molecular structures with free hydroxyl groups, which may result in hysteresis effects when exposed to cycles of dry and humid air [61,62]. However, given a very long time, i.e., t → ∞, the corresponding equilibrium moisture content (EMC) for representative wooden materials may be calculated by [44]:
where
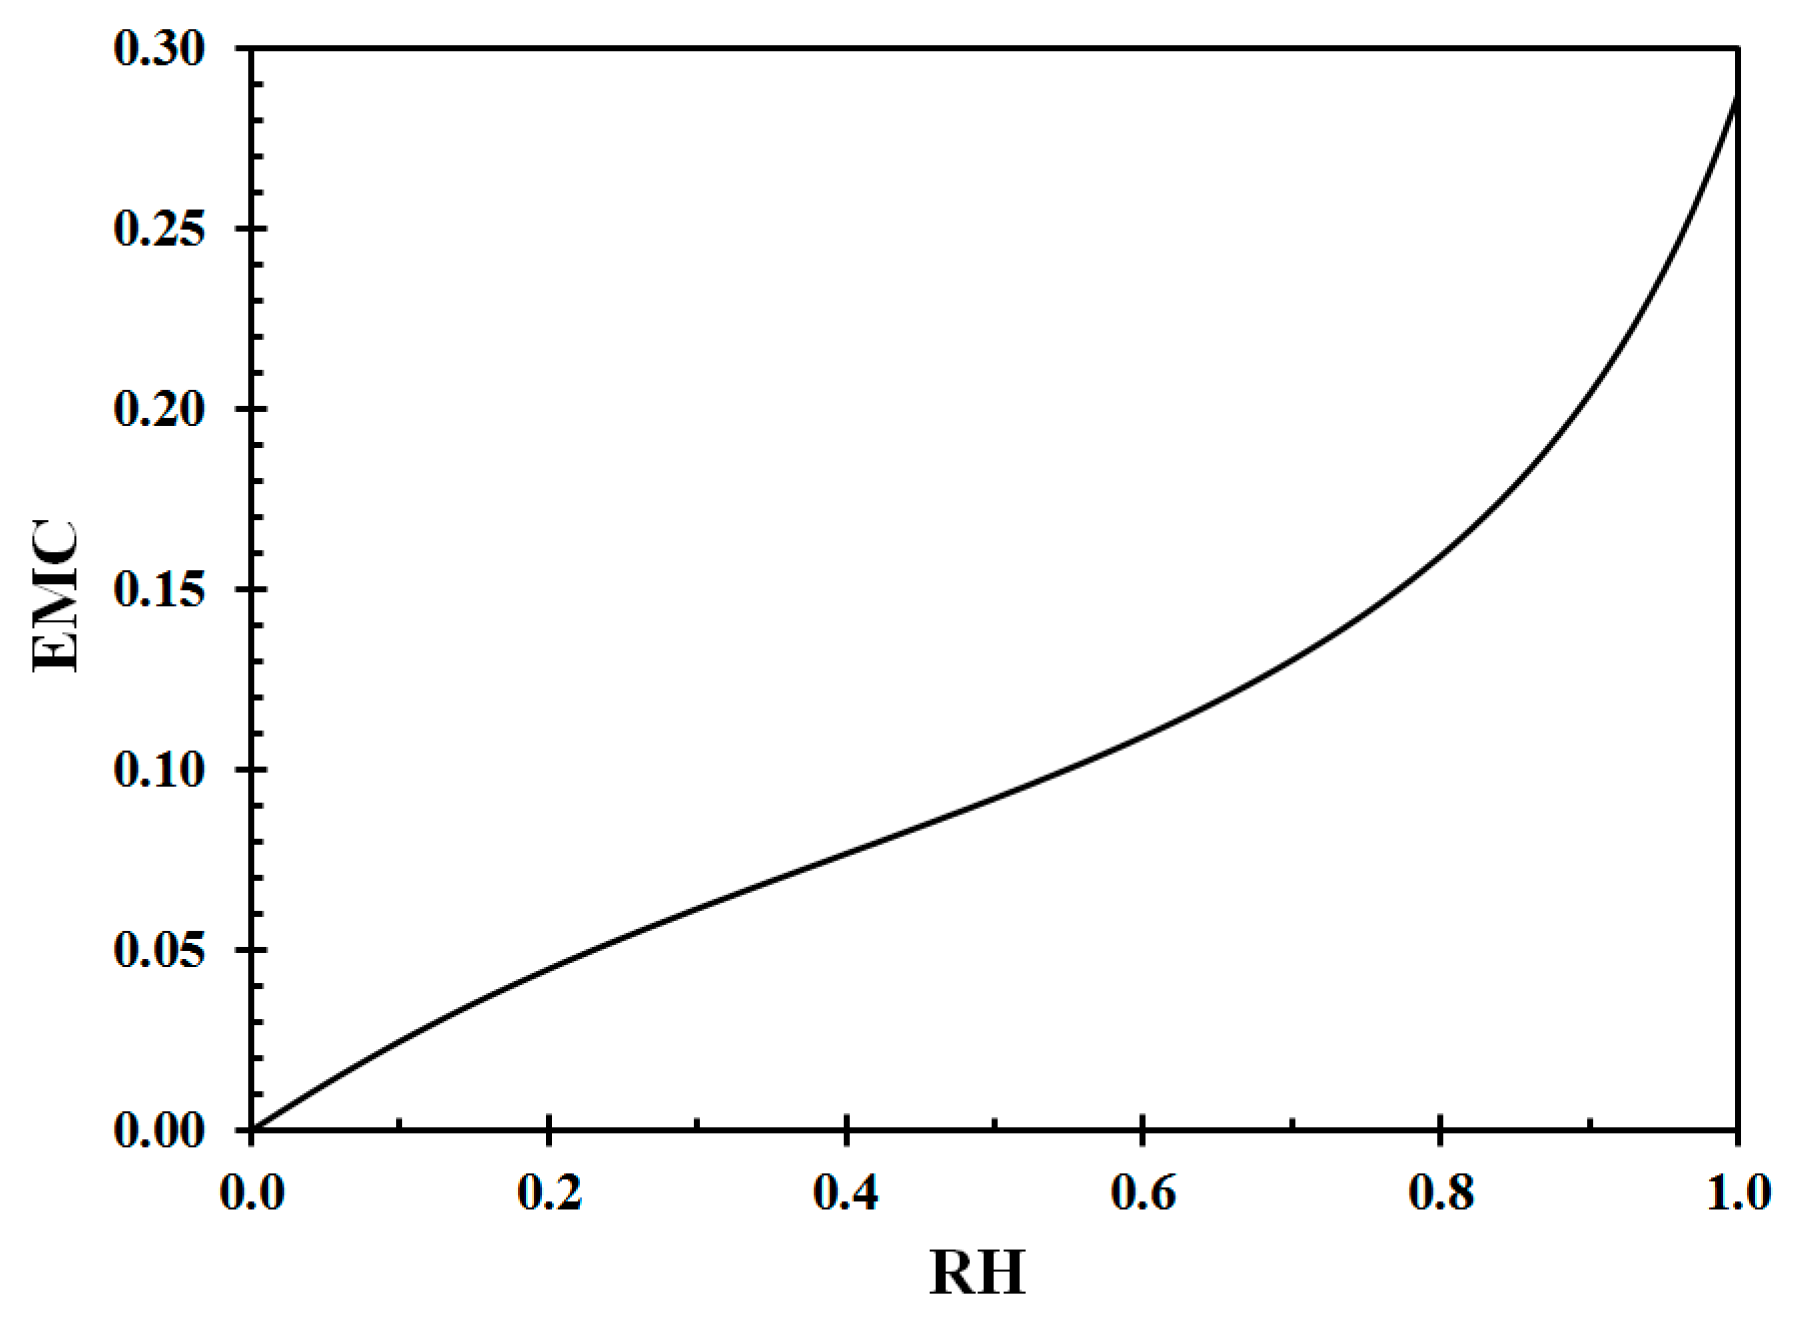
The wood EMC corresponding to Equation (A5) at 22 °C is presented in Figure A1 and the inverse curve is shown in Figure A2.
Figure A1.
Equilibrium moisture content (EMC) at 22 °C as a function of relative humidity (RH). Data from Equation (A6) [44].
Figure A1.
Equilibrium moisture content (EMC) at 22 °C as a function of relative humidity (RH). Data from Equation (A6) [44].

Figure A2.
Relative humidity (RH) as a function of equilibrium moisture content (EMC) at 22 °C. Data from Equation (A6) [44].
Figure A2.
Relative humidity (RH) as a function of equilibrium moisture content (EMC) at 22 °C. Data from Equation (A6) [44].

For modeling purposes, the 4th order polynomials developed by Log [63] based on the data presented in Figure A1 and Figure A2 is used in the present study, i.e.,
The regression coefficients obtained for Equations (A6) and (A7) were very close to unity. For simplicity, assuming that the hysteresis does not dominate the sorption processes, Equations (A6) and (A7), can then be used to model transport of humidity between Calluna twig surfaces and the surrounding air. It should be noted that the “wood” in Calluna stems and branches do not necessarily follow exactly the same relationship as a representative wooden material. Since such data is missing for most wildland fuel, Calluna twigs and stems included, the data for wood [44] currently represents the best available alternative.
Appendix A.3. Transport of Humidity in Dead Calluna Stems and Branches
The transport of humidity in solids may be expressed by Fick’s law of diffusion:
Twigs and branches of dead Calluna may mathematically be best described as cylindrical objects, where the internal humidity transport may be described by the associated heat equation:
If the stem/branch has a uniform concentration at t = 0, for simplicity assumed to be unity, and for t > 0 the surface concentration is, due to the supply of dry air, kept at a new lower concentration, for simplicity zero, the dimensionless concentration within the cylinder is given by [64]:
where and are Bessel functions of the first kind for integers 0 and 1, respectively, and where ±, n = 1, 2, … are the roots of = 0. The Fourier number, , is in this case given by:
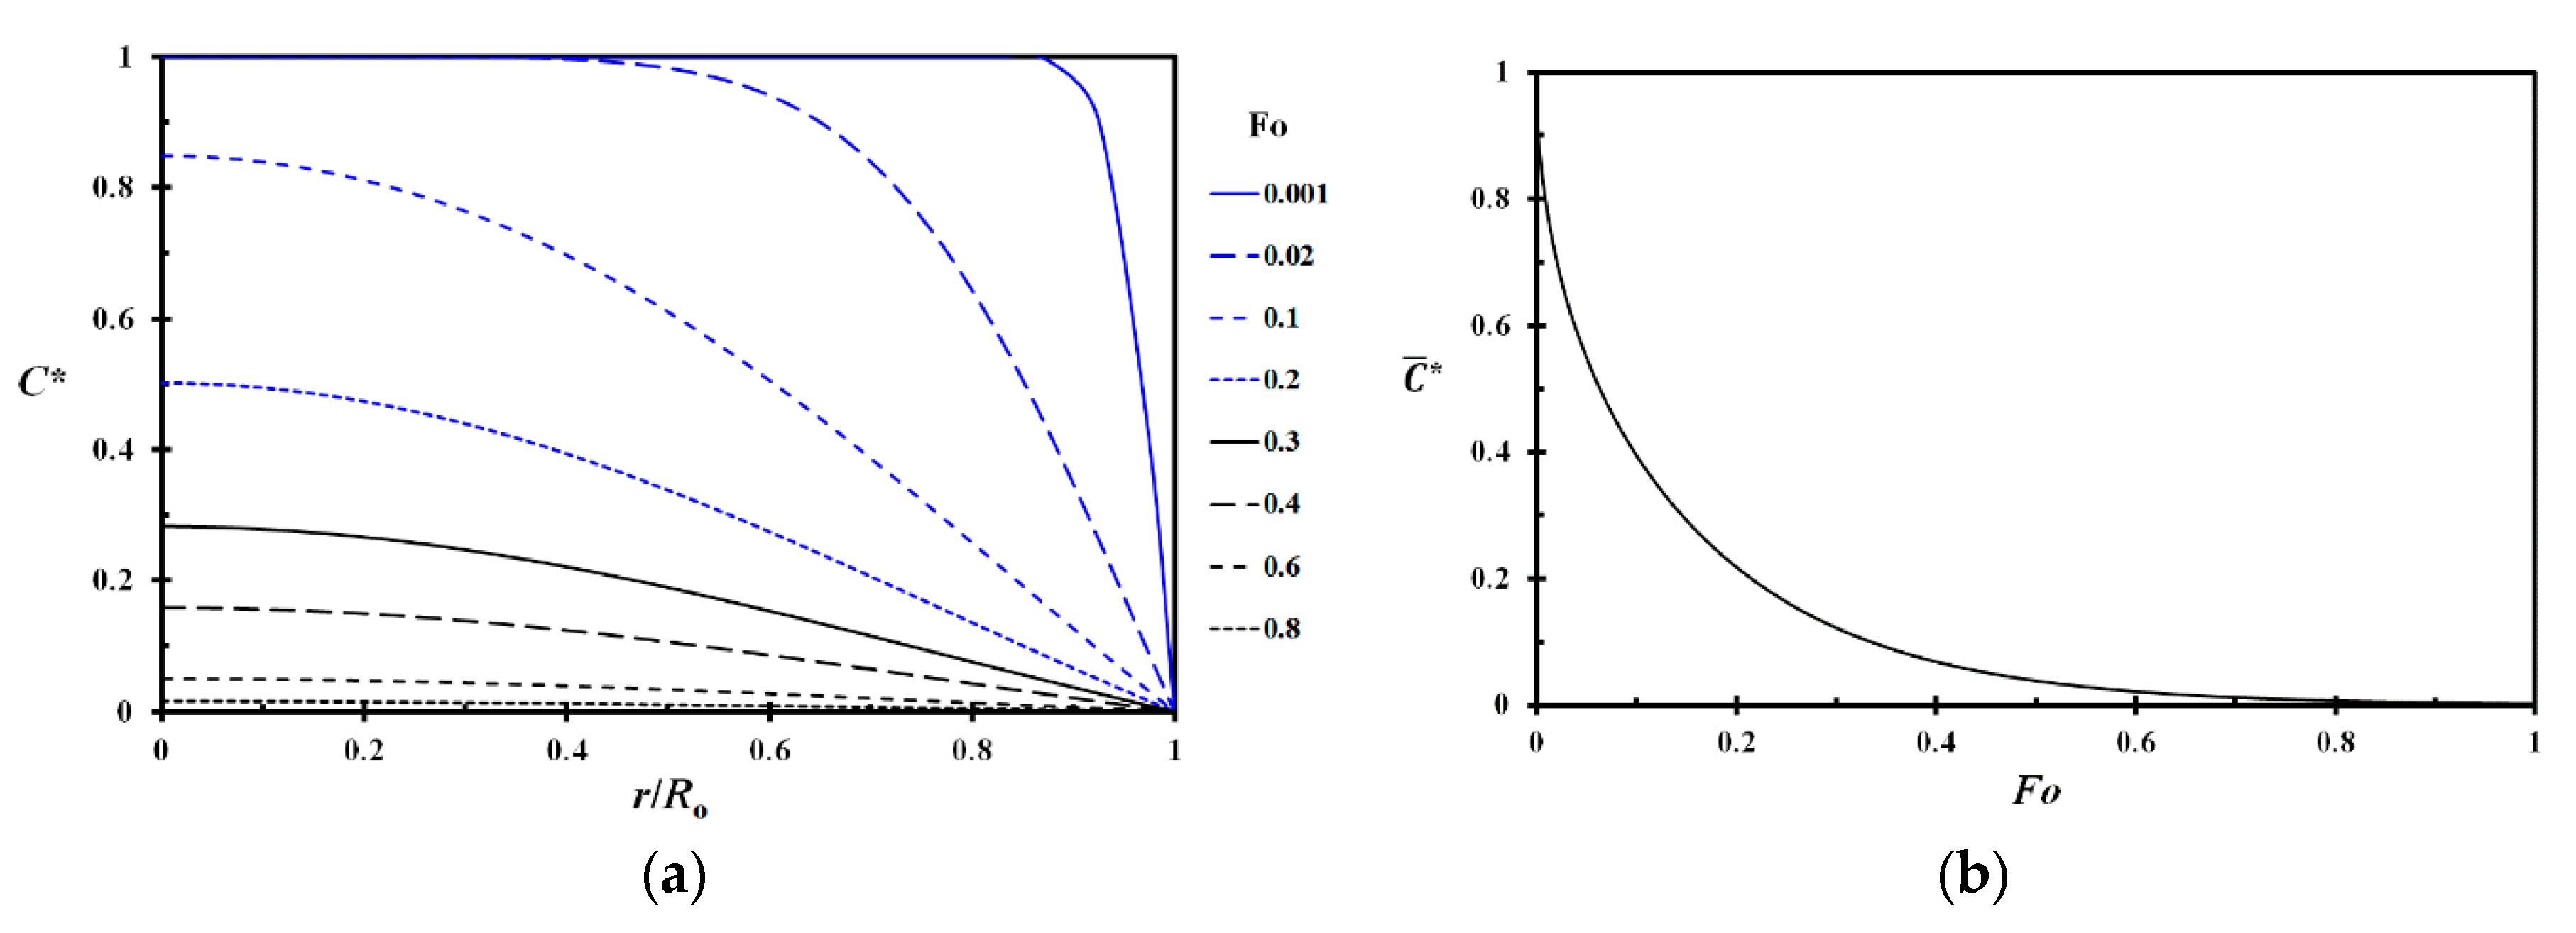
The dimensionless concentration given by Equation (A10) as a function of dimensionless radius is shown in Figure A3a for selected Fourier numbers. The average (integrated) dimensionless concentration as a function of Fourier number is shown in Figure A3b.
Figure A3.
Dimensionless concentration (Equation (A10)) as a function of the relative radius and Fourier number (a) and dimensionless average concentration as a function of the Fourier number (b).
Figure A3.
Dimensionless concentration (Equation (A10)) as a function of the relative radius and Fourier number (a) and dimensionless average concentration as a function of the Fourier number (b).

The time needed to achieve a certain level of average dryness, i.e., a relative mass loss as shown in Figure A3b, may then be calculated from Equation (A11) by:
As an example, at = 0.0630, the average humidity, as shown in Figure A3b, has reached half the way towards the new EMC value. In a drying test, the heat required for the evaporation of water from the drying twig will, however, reduce the test specimen temperature. This results in a reduced water vapor concentration driving force to the bulk air in the vicinity of the drying stem or branch, i.e., a reduced drying rate. The temperature depletion is most conspicuous during the early phase of the drying process, i.e., when the drying rate is highest. However, during the last part of the drying phase, the test specimen temperature depletion is significantly reduced due to the low drying rate. This part of an experimentally obtained drying curve may then be used for estimating the water diffusion coefficient, e.g., by:
where the subscript refers to situations where a certain fraction of the mass loss towards the new equilibrium concentration is achieved. Taking the time and Fourier numbers from half the mass loss ( = 0.0630) to three quarters of the mass loss ( = 0.1763), the diffusion coefficient may simply be calculated by:
where (s) and (s) are the time recorded to half and three quarters of the infinite time mass loss, respectively. As long as is on the order of hours, the temperature depletion below ambient conditions will not be significant from that time and onwards. This assumption may be verified numerically.
To make this technique work properly, the experimental boundary conditions need to be kept strictly constant. This is best achieved by performing drying tests in a carefully controlled atmosphere, e.g., a climate chamber, where both the temperature and relative humidity is kept constant through the complete drying period. Ideally, the test specimen should also be a perfect cylinder with no axial humidity transfer.
Appendix A.4. Numerical Model for the Drying Process
When a cylindrical test specimen is exposed to dry air, the heat consumption required for the water vaporization will decrease the test specimen temperature. Other objects in the vicinity will then radiate heat to the colder test specimen, and even in stagnant air, the temperature differences will trigger buoyant flow and thermal convection. The heat radiation may be expressed by:
where is the resultant emissivity of the surface and the surroundings, (K) is the ambient temperature and (K) is the surface temperature. Sun radiation may also add to the received thermal radiation. In a dense Calluna stand, the objects surrounding a stem or a branch may to a large extent be other stems and branches at similar temperature as the one of interest. Unless exposed to sunlight, it may therefore be assumed that the heat radiation is of minor importance. In a climate chamber, it can, however, not be ignored since each drying test specimen is dried individually.
The convective heat transfer to the test specimen is given by:
where the convective heat transfer coefficient (W/m2∙K) may be estimated through engineering expressions for the Nusselt number:
where (W/m∙K) is the ambient air thermal conductivity and (m) is the diameter. Considering free convection, the Nusselt number may be calculated by nondimensional expressions of the Grashof number and the Prandtl number. The Grashof number is an expression for the ratio between the buoyant force and the resisting viscous drag:
where (m/s2) is the acceleration of gravity, (m2/s) is the kinematic viscosity of air and = 1/ (K−1). The Prandtl number describes the relationship between the between momentum diffusivity and thermal diffusivity (m2/s):
The product of the Grashof number and the Prandtl number is often expressed as the Rayleigh number:
For < 1012, the following expression has been shown to be generally valid for average Nusselt numbers for cylinders [65]:
In wood, the thermal diffusivity is in the range of 10−7 m2/s while the water mass diffusion coefficient is 3–4 orders of magnitude lower. The transport properties involved are therefore not limited by thermal diffusion. Whether the heat flow to, and into, the test specimen is limited by convection or internal conduction may be evaluated by considering the Biot number:
where (W/mK) is the thermal conductivity of the test specimen and (m) is the test specimen radius. For dense wood, the thermal conductivity is typically in the range 0.14–0.17 W/mK. Given ≈ 1 W/m2K (may be verified by Equation (A21) during the modeling), ≈ 0.15 W/m2K and maximum radius of 0.0035 m gives ≈ 0.02. This clearly shows that modeling of internal heat transfer is not necessary, i.e., the heat transfer may be treated as a lumped thermal capacity analysis. This is also supported by the research done by Faggion et al. [53]. This is also in agreement with the results obtained by Mortensen [66] where the boundary layer only became a limiting parameter when studying humidity transfer from thin layers of paper to indoor air. It was also confirmed by testing for larger and smaller diffusion boundary layers within reasonable limits in the present study.
The mass transfer from the surface to the surroundings may then be expressed by:
where is the ambient air relative humidity, is the relative humidity at the surface, is the ambient air water saturation concentration, is the water saturation concentration corresponding to the surface temperature of the cylinder, (m) is the length of the cylinder, (kgm−3) represents the difference in water concentration of the ambient air and the air in intimate contact with the solid surface and (m) is the boundary layer thickness.
The parameter (m/s) corresponds to the convective heat transfer coefficient, , in heat transfer. In free convection, the hydrodynamic and thermal boundary layers are inseparable as the flow is created by buoyancy induced by the temperature boundary layer and the ambient air. Based on the thermal conductivity of air, i.e., 0.026 Wm−1K−1, the boundary layer thickness may be calculated.
In order to model the transport of moisture within the cylinder, the cylinder is sliced in N hollow cylinders of thickness (m). For the surface layer, i.e., n = 1, Equation (A9) may be discretized as:
For the internal layers, the heat equation may be discretized as:
For simplicity, a fictitious layer number N + 1 was introduced as a reflection plane, i.e., mirroring the concentration of layer N. This eliminated the need for a separate working equation for layer N.
Since the temperature would change as a result of the water evaporation process, and thereby the vapor equilibrium concentration at the cylinder surface, the heat required for water evaporation was taken into consideration by:
where (2.444 MJ/kg) is the heat of vaporization of water.
During drying, the corresponding temperature depletions sets up a buoyant flow, whereas the corresponding and can be calculated for each time interval , and the convective heat transfer coefficient determined through the calculated . The heat flux to the cylinder surface can then be calculated by:
where (5.67 × 10⁻⁸ Wm−2K−4) is the Stefan–Boltzmann constant and is the resultant emissivity given by:
where is the emissivity of the surfaces surrounding the cylinder and is the emissivity of the cylinder surface.
For each time interval, , the new test specimen temperature was calculated by:
It should be noted that the integration time interval, , must comply with a Fourier number less than 0.5 to ensure numerical stability, where the Fourier number for the numerical calculations is given by:
References
- Mowery, M.; Read, M.; Johnston, K.; Wafaie, T. Planning the Wildland-Urban Interface; Report 594, Planning Advisory Service; American Planning Association: Washington, DC, USA, 2019; ISBN 978-1-61190-202-0. [Google Scholar]
- Bento-Gonçalves, A.; Vieira, A. Wildfires in the wildland-urban interface: Key concepts and evaluation methodologies. Sci. Total Environ. 2019, 707, 135529. [Google Scholar] [CrossRef]
- Badia, A.; Pallares-Barbera, M.; Valldeperas, N.; Gisbert, M. Wildfires in the wildland-urban interface in Catalonia: Vulnerability analysis based on land use and land cover change. Sci. Total Environ. 2019, 673, 184–196. [Google Scholar] [CrossRef]
- Rego, F.M.C.C.; Rodríguez, J.M.M.; Calzada, V.R.V.; Xanthopoulos, G. Forest Fires—Sparking Firesmart Policies in the EU; Publications Office of the European Union: Luxembourg, 2018; p. 53. ISBN 978-92-79-77493-5. [Google Scholar] [CrossRef]
- DSB. Brannene i Lærdal, Flatanger og på Frøya Vinteren 2014; Norwegian Directorate for Civil Protection: Tønsberg, Norway, 2014; p. 55. ISBN 978-82-7768-342-3. (In Norwegian) [Google Scholar]
- Steen-Hansen, A.; Bøe, G.A.; Hox, K.; Mikalsen, R.F.; Stensaas, J.P.; Storesund, K. Evaluation of Fire Spread in the Large Lærdal Fire, January 2014. In Proceedings of the 14th International Fire and Materials Conference and Exhibition, San Francisco, CA, USA, 2–4 February 2015; pp. 1014–1024. [Google Scholar]
- Log, T.; Thuestad, G.; Velle, L.G.; Khattri, S.K.; Kleppe, G. Unmanaged heathland—A fire risk in subzero temperatures? Fire Saf. J. 2017, 90, 62–71. [Google Scholar] [CrossRef]
- Webb, N.R. The traditional management of European heathlands. J. Appl. Ecol. 1998, 35, 987–990. [Google Scholar] [CrossRef]
- Gimingham, C.H. Ecology of Heathlands; Chapman and Hall: London, UK, 1972; ISBN 10: 0412104601. [Google Scholar]
- Gimingham, C.H. Biological flora of the British isles: Calluna vulgaris (L) hull. J. Ecol. 1960, 48, 455–483. [Google Scholar] [CrossRef]
- Kaland, P.E. The origin and management of Norwegian coastal heaths as reflected by pollen analysis. In Anthropogenic Indicators in Pollen Diagrams; Behre, K.E., Ed.; Balkema: Rotterdam, The Netherlands, 1986; pp. 19–36. [Google Scholar] [CrossRef]
- Velle, L.G.; Nilsen, L.S.; Vandvik, V. The age of Calluna stands moderates post-fire regeneration rate and trends in northern Calluna heathlands. Appl. Veg. Sci. 2012, 15, 119–128. [Google Scholar] [CrossRef]
- Velle, L.G.; Vandvik, V. Succession after prescribed burning in coastal Calluna heathlands along a 340-km latitudinal gradient. J. Veg. Sci. 2014, 25, 546–558. [Google Scholar] [CrossRef]
- Gimingham, C.H. The Lowland Heathland Management Handbook; English Nature: Peterborough, UK, 1992; ISBN 1-85716-077-0. [Google Scholar]
- Allen, K.A.; Denelle, P.; Sánchez Ruiz, F.M.; Santana, V.M.; Marrs, R.H. Prescribed moorland burning meets good practice guidelines: A monitoring case study using aerial photography in the Peak District, UK. Ecol. Indic. 2016, 62, 76–85. [Google Scholar] [CrossRef] [Green Version]
- Vandvik, V.; Töpper, J.P.; Cook, Z.; Daws, M.I.; Heegaard, E.; Måren, I.E.; Velle, L.G. Management-driven evolution in a domesticated ecosystem. Biol. Lett. 2014, 10, 20131082. [Google Scholar] [CrossRef]
- Lindgaard, A.; Henriksen, S. Norsk Rødliste for Naturtyper 2011; Artsdatabanken: Trondheim, Norway, 2011; ISBN-13: 978-82-92838-29-7. [Google Scholar]
- Prøsch-Danielsen, L.; Simonsen, A. Palaeoecological investigations towards the reconstruction of the history of forest clearances and coastal heathlands in southwestern Norway. Veg. Hist. Archaeobotany 2000, 9, 189–204. [Google Scholar] [CrossRef]
- Thompson, D.B.A.; MacDonald, A.J.; Marsden, J.H.; Galbraith, C.A. Upland heather moorland in Great Britain: A review of international importance, vegetation change and some objectives for nature conservation. Biol. Conserv. 1995, 71, 163–178. [Google Scholar] [CrossRef]
- Calvo, L.; Baeza, J.; Marcos, E.; Santana, V.; Papanastasis, V.P. Post-fire management of shrublands. In Post-Fire Management and Restoration of Southern European Forests; Moreira, F., Ed.; Springer: Dordrecht, The Netherlands, 2012; pp. 293–319. [Google Scholar] [CrossRef]
- Borghesio, L. Can fire avoid massive and rapid habitat change in Italian heathlands? J. Nat. Conserv. 2014, 22, 68–74. [Google Scholar] [CrossRef]
- Davies, G.M.; Legg, J.J.; O’hara, R.; MacDonals, A.J.; Smith, A.A. Winter desiccation and rapid changes in the live fuel moisture content of Calluna vulgaris. Plant Ecol. Divers. 2010, 3, 289–299. [Google Scholar] [CrossRef]
- Nilsen, L.S.; Johansen, L.; Velle, L.G. Early stages of Calluna vulgaris regeneration after burning of coastal heath in central Norway. Appl. Veg. Sci. 2005, 8, 57–64. [Google Scholar] [CrossRef]
- Diotte, M.; Bergeron, Y. Fire and the distribution of Juniperus communis L. in the Boreal Forest of Quebec, Canada. J. Biogeogr. 1989, 16, 91–96. [Google Scholar] [CrossRef]
- Norwegian Bioeconomy Institute (NIBIO). Gammelnorsk Sau (Old Norwegian Sheep). Available online: www.nibio.no/tema/mat/husdyrgenetiske-ressurser/bevaringsverdige-husdyrraser/sau/gammelnorsk-sau (accessed on 13 June 2020).
- Harstad, B.; Harestad, A.; Fludal, A. Beitetrykk i Lynghei;—Produksjon av Kjøtt—Produksjon av Landskap (Grazing Pressure in Heathlands;—Production of Meat—Production of Landscape); Norsk landbruksrådgiving Rogaland: Haugesund, Norway, 2014; p. 35. [Google Scholar]
- Værlandet. Meet the Old Norse Sheep. Hurtigruten, Inc.: Seattle, WA, USA. Available online: www.hurtigruten.co.uk/excursions/norway/varlandet-meet-the-old-norse-sheep/ (accessed on 23 March 2020).
- Forskrift om Vern av Villsau frå Norskekysten/Villsau fra Norskekysten som Geografisk Nemning (Regulation on the Protection of Villsau from the Norwegian Coast/Villsau from the Norwegian Coast as a Geographical Naming); The Norwegian Ministry of Agriculture and Food: Oslo, Norway, 2010. Available online: https://lovdata.no/dokument/SF/forskrift/2010-11-04-1402 (accessed on 13 June 2020).
- Hauglin, M.; Ørka, H.O. Discriminating between Native Norway Spruce and Invasive Sitka Spruce—A Comparison of Multitemporal Landsat 8 Imagery, Aerial Images and Airborne Laser Scanner Data. Remote Sens. 2016, 8, 363. [Google Scholar] [CrossRef] [Green Version]
- Nygaard, P.H.; Øyen, B.-H. Spread of the Introduced Sitka Spruce (Picea sitchensis) in Coastal Norway. Forests 2017, 8, 24. [Google Scholar] [CrossRef] [Green Version]
- Jurdao, S.; Chuvieco, E.; Arevalillo, J.M. Modelling Fire Ignition Probability from Satellite Estimates of Live Fuel Moisture Content. Fire Ecol. 2012, 8, 77–97. [Google Scholar] [CrossRef]
- Yebra, M.; Dennison, P.E.; Chuvieco, E.; Riaño, D.; Zylstra, P.; Hunt, E.R.; Danson, F.M.; Qi, Y.; Jurdao, S. A global review of remote sensing of live fuel moisture content for fire danger assessment: Moving towards operational products. Remote Sens. Environ. 2013, 136, 455–468. [Google Scholar] [CrossRef]
- Anderson, S.A.J.; Anderson, W.R. Predicting the elevated dead fine fuel moisture content in gorse (Ulex europaeus L.) shrub fuels. Can. J. For. Res. 2009, 39, 2355–2368. [Google Scholar] [CrossRef]
- Davies, G.M.; Legg, C.J.; Smith, A.A.; MacDonald, A.J. Rate of spread of fires in Calluna vulgaris-dominated moorlands. J. Appl. Ecol. 2009, 46, 1054–1063. [Google Scholar] [CrossRef]
- Baeza, M.J.; De Luís, M.; Raventós, J.; Escarré, A. Factors influencing fire behavior in shrublands of different stand ages and the implications for using prescribed burning to reduce wildfire risk. J. Environ. Manag. 2002, 65, 199–208. [Google Scholar] [CrossRef] [PubMed]
- Sharma, S.; Ochsner, T.E.; Twidwell, D.; Carlson, J.D.; Krueger, E.S.; Engle, D.M.; Fuhlendorf, S.D. Nondestructive Estimation of Standing Crop and Fuel Moisture Content in Tallgrass Prairie. Rangeland Ecol. Manag. 2018, 71, 356–362. [Google Scholar] [CrossRef]
- Santana, V.M.; Marrs, R.H. Flammability properties of British heathland and moorland vegetation: Models for predicting fire ignition. J. Environ. Manag. 2014, 139, 88–96. [Google Scholar] [CrossRef] [Green Version]
- Morvan, D.; Dupuy, J.L. Modeling the propagation of a wildfire through a Mediterranean shrub using a multiphase formulation. Combust. Flame 2004, 138, 199–210. [Google Scholar] [CrossRef]
- Davies, G.M.; Domènech, R.; Gray, A.; Johnson, P.C.D. Vegetation structure and fire weather influence variation in burn severity and fuel consumption during peatland wildfires. Biogeosciences 2016, 13, 389–398. [Google Scholar] [CrossRef] [Green Version]
- Davies, G.M.; Legg, C.J. Fuel moisture thresholds in flammability of Calluna vulgaris. Fire Technol. 2011, 47, 421–436. [Google Scholar] [CrossRef]
- Log, T. Cold Climate Fire Risk; A Case Study of the Lærdalsøyri Fire, January 2014. Fire Technol. 2016, 52, 1825–1843. [Google Scholar] [CrossRef] [Green Version]
- Yang, S.; Fan, Z.; Liu, X.; Ezell, A.W.; Spetich, M.A.; Saucier, S.K.; Gray, S.; Hereford, S.G. Effects of Prescribed Fire, Site Factors, and Seed Sources on the Spread of Invasive Triadica sebifera in a Fire-Managed Coastal Landscape in Southeastern Mississippi, USA. Forests 2019, 10, 175. [Google Scholar] [CrossRef] [Green Version]
- Dey, D.C.; Schweitzer, C.J. A Review on the Dynamics of Prescribed Fire, Tree Mortality, and Injury in Managing Oak Natural Communities to Minimize Economic Loss in North America. Forests 2018, 9, 461. [Google Scholar] [CrossRef] [Green Version]
- Simpson, W.T. Equilibrium Moisture Content of Wood in Outdoor Locations in the United States and Worldwide; Research Note FPL-RN-0268; US Department of Agriculture: Washington, DC, USA, 1998; p. 14.
- Sun, S.; Mathiasc, J.-D.; Toussainta, E.; Grédiaca, M. Hygromechanical characterization of sunflower stems. Ind. Crops Prod. 2013, 46, 50–59. [Google Scholar] [CrossRef] [Green Version]
- Gigler, J.K.; Van Loon, W.K.P.; Meerdink, G.; Coumans, W.J. Drying Characteristics of Willow Chips and Stems. J. Agric. Eng. Res. 2000, 77, 391–400. [Google Scholar] [CrossRef]
- Baronas, R.; Ivanauskasa, F.; Juodeikienėc, I.; Kajalavičiusc, A. Modelling of Moisture Movement in Wood during Outdoor Storage. Nonlinear Anal. Model. Control 2001, 6, 3–14. [Google Scholar] [CrossRef]
- Adrover, A.; Brasiello, A. 3-D Modeling of Dehydration Kinetics and Shrinkage of Ellipsoidal Fermented Amazonian Cocoa Beans. Processes 2020, 8, 150. [Google Scholar] [CrossRef] [Green Version]
- Domínguez-Pérez, L.A.; Concepción-Brindis, I.; Lagunes-Gálvez, L.M.; Barajas-Fernández, J.; Márquez-Rocha, F.J.; García-Alamilla, P. Kinetic Studies and Moisture Diffusivity During Cocoa Bean Roasting. Processes 2019, 7, 770. [Google Scholar] [CrossRef] [Green Version]
- Nguyen, T.V.L.; Nguyen, M.D.; Nguyen, D.C.; Bach, L.G.; Lam, T.D. Model for Thin Layer Drying of Lemongrass (Cymbopogon citratus) by Hot Air. Processes 2019, 7, 21. [Google Scholar] [CrossRef] [Green Version]
- Schmalko, M.E.; Alzamora, S.M. Modelling the drying of a twig of “yerba maté” considering as a composite material: Part I: Shrinkage, apparent density and equilibrium moisture content. J. Food Eng. 2005, 66, 455–461. [Google Scholar] [CrossRef]
- Schmalko, M.E.; Alzamora, S.M. Modelling the drying of a twig of “yerba maté” considering as a composite material: Part II: Mathematical model. J. Food Eng. 2005, 67, 267–272. [Google Scholar] [CrossRef]
- Faggion, H.; Tussolini, L.; Freire, F.B.; Freire, J.T.; Zanoelo, E.F. Mechanisms of heat and mass transfer during drying of mate (Ilex paraguariensis) twigs. Dry. Technol. 2016, 34, 474–482. [Google Scholar] [CrossRef]
- Betie, A.; Meghnefi, F.; Fofana, I.; Yeo, Z. Modeling the Insulation Paper Drying Process from Thermogravimetric Analyses. Energies 2018, 11, 517. [Google Scholar] [CrossRef] [Green Version]
- Hancock, M.H. An exceptional Calluna vulgaris winter die-back event, Abernethy Forest, Scottish Highlands. Plant Ecol. Divers. 2008, 1, 89–103. [Google Scholar] [CrossRef]
- Matthews, S. Effect of drying temperature on fuel moisture content measurements. Int. J. Wildland Fire 2010, 19, 800–802. [Google Scholar] [CrossRef]
- Pérez, J.; Maldonado, S.; López-Ospina, H. A fleet management model for the Santiago Fire Department. Fire Saf. J. 2016, 82, 1–11. [Google Scholar] [CrossRef]
- Log, T.; Vandvik, V.; Velle, L.G.; Metallinou, M.-M. Reducing Wooden Structure and Wildland-Urban Interface Fire Disaster Risk through Dynamic Risk Assessment and Management. Appl. Syst. Innov. 2020, 3, 16. [Google Scholar] [CrossRef] [Green Version]
- Farrar, A.; Kendal, D.; Williams, K.J.H.; Zeeman, B.J. Social and Ecological Dimensions of Urban Conservation Grasslands and Their Management through Prescribed Burning and Woody Vegetation Removal. Sustainability 2020, 12, 3461. [Google Scholar] [CrossRef] [Green Version]
- Tetens, O. Uber einige meteorologische Begriffe. Z. Geophys. 1930, 6, 297. [Google Scholar]
- Salin, J.G. Inclusion of the Sorption Hysteresis Phenomenon in Future Drying Models. Some Basic Considerations. Maderas. Cienc. Tecnol. 2011, 13, 173–182. [Google Scholar] [CrossRef]
- Funk, M. Hysteretic moisture properties of porous materials: Part I: Thermodynamics. J. Build. Phys. 2014, 38, 6–49. [Google Scholar] [CrossRef]
- Log, T. Modeling Indoor Relative Humidity and Wood Moisture Content as a Proxy for Wooden Home Fire Risk. Sensors 2019, 19, 5050. [Google Scholar] [CrossRef] [Green Version]
- Carslaw, H.L.; Jaeger, J.C. Conduction of Heat in Solids, 2nd ed.; Oxford Science Publications: Oxford, UK, 1959; ISBN 0-19-853368-3. [Google Scholar]
- Jaluria, Y. Natural Convection. Heat and Mass Transfer; Pergamon Press: Oxford, UK, 1980; p. 326. ISBN 9780080254326. [Google Scholar]
- Mortensen, L.H. Hygrothermal Microclimate on Interior Surfaces of the Building Envelope. Ph.D. Thesis, Technical University of Denmark, Kongens Lyngby, Denmark, 2007; p. 166. [Google Scholar]
Figure 1.
Sample holder and test specimen ready for climate chamber drying.

Figure 2.
Recorded mass as a function of time for a 6.01 mm (±0.11 mm) diameter Calluna test specimen. The final mass after 164 h, the mass after oven drying at 80 °C and the mass at a 30% fuel moisture content (FMC) threshold value for sustainable fire in Calluna stands [34] are also marked on the figure.

Figure 3.
Dimensionless (normalized) mass as a function of time for a 6.01 mm (±0.11 mm) diameter Calluna twig. The time to reach
and , i.e., 5.83 h and 11.85 h, are also marked on the figure.
Figure 3.
Dimensionless (normalized) mass as a function of time for a 6.01 mm (±0.11 mm) diameter Calluna twig. The time to reach
and , i.e., 5.83 h and 11.85 h, are also marked on the figure.

Figure 4.
Dimensionless mass as a function of time normalized by the radius squared for selected low, medium and high diffusion coefficient test Calluna test specimens. The curves are labeled by their respective diffusion coefficients (in units 10−11 m2/s).
Figure 4.
Dimensionless mass as a function of time normalized by the radius squared for selected low, medium and high diffusion coefficient test Calluna test specimens. The curves are labeled by their respective diffusion coefficients (in units 10−11 m2/s).

Figure 5.
Recorded and modeled mass as a function of time for a 6.01 mm (±0.11 mm) diameter Calluna test specimen.
Figure 5.
Recorded and modeled mass as a function of time for a 6.01 mm (±0.11 mm) diameter Calluna test specimen.


Table 1.
Growth place, diameter, length and resulting moisture diffusion coefficient of the degenerated Calluna test specimens.
Table 1.
Growth place, diameter, length and resulting moisture diffusion coefficient of the degenerated Calluna test specimens.
| Test Specimen | Location | (mm) | (mm) | (m2/s) |
|---|---|---|---|---|
| 1 | Haugesund 1 | 6.01 ± 0.66 | 129 | 4.73 × 10⁻¹¹ |
| 2 | Haugesund 1 | 5.47 ± 0.50 | 157 | 4.35 × 10⁻¹¹ |
| 3 | Haugesund 1 | 6.90 ± 0.46 | 160 | 8.96 × 10⁻¹¹ |
| 4 | Haugesund 2 | 5.00 ± 0.54 | 160 | 2.32 × 10⁻¹¹ |
| 5 | Haugesund 2 | 5.32 ± 0.59 | 132 | 1.78 × 10⁻¹¹ |
| 6 | Haugesund 2 | 6.07 ± 0.60 | 130 | 10.4 × 10⁻¹¹ |
| 7 | Nerlandsøy 1 | 5.48 ± 0.35 | 150 | 2.33 × 10⁻¹¹ |
| 8 | Nerlandsøy 1 | 5.21 ± 0.63 | 135 | 1.88 × 10⁻¹¹ |
| 9 | Nerlandsøy 1 | 4.76 ± 0.24 | 130 | 1.66 × 10⁻¹¹ |
| 10 | Nerlandsøy 2 | 6.45 ± 0.68 | 129 | 4.04 × 10⁻¹¹ |
| 11 | Nerlandsøy 2 | 3.54 ± 0.66 | 130 | 3.56 × 10⁻¹¹ |
| 12 | Nerlandsøy 2 | 6.43 ± 0.60 | 110 | 3.96 × 10⁻¹¹ |
| Average | - | - | 4.16 ± 2.69 × 10⁻¹¹ |
© 2020 by the author. Licensee MDPI, Basel, Switzerland. This article is an open access article distributed under the terms and conditions of the Creative Commons Attribution (CC BY) license (http://creativecommons.org/licenses/by/4.0/).
Share and Cite
MDPI and ACS Style
Log, T. Modeling Drying of Degenerated Calluna vulgaris for Wildfire and Prescribed Burning Risk Assessment. Forests 2020, 11, 759. https://doi.org/10.3390/f11070759
AMA Style
Log T. Modeling Drying of Degenerated Calluna vulgaris for Wildfire and Prescribed Burning Risk Assessment. Forests. 2020; 11(7):759. https://doi.org/10.3390/f11070759
Chicago/Turabian StyleLog, Torgrim. 2020. "Modeling Drying of Degenerated Calluna vulgaris for Wildfire and Prescribed Burning Risk Assessment" Forests 11, no. 7: 759. https://doi.org/10.3390/f11070759
Note that from the first issue of 2016, this journal uses article numbers instead of page numbers. See further details here.