Article

Interspecific Variability of Water Storage Capacity and Absorbability of Deadwood

1
Department of Forest Utilization, Engineering and Forest Technology, Faculty of Forestry, University of Agriculture, Al. 29 Listopada 46, 31-425 Krakow, Poland
2
Department of Ecology and Silviculture, Faculty of Forestry, University of Agriculture, Al. 29 Listopada 46, 31-425 Kraków, Poland
*
Author to whom correspondence should be addressed.
Forests 2020, 11(5), 575; https://doi.org/10.3390/f11050575
Submission received: 10 April 2020 / Revised: 14 May 2020 / Accepted: 18 May 2020 / Published: 21 May 2020
(This article belongs to the Section Forest Ecophysiology and Biology)

Abstract

:
The aim of the study was to determine the water storage capacity and absorbability of deadwood of different tree species with varying degrees of decomposition. Coniferous (Silver fir—Abies alba Mill.) and deciduous (Common hornbeam—Carpinus betulus L., Common ash—Fraxinus excelsior L., Common alder—Alnus glutinosa Gaertn., and Common aspen—Populus tremula L.) species were selected for the research. The study focuses on the wood of dead trees at an advanced stage of decomposition. Deadwood samples were collected at the Czarna Rózga Nature Reserve in central Poland. Changes over time of the water absorbability and water storage capacity of deadwood were determined under laboratory conditions. The research confirmed the significance of the wood species and the degree of wood decomposition in shaping the water storage capacity and absorbability of deadwood in forest ecosystems. Fir wood was characterized by having the highest water storage capacity and water absorbability. Among deciduous species under analysis, aspen wood was characterized by having the highest water storage capacity and absorbability. Our research has confirmed that deadwood may be a significant reservoir of water in forests.

1. Introduction

The wood of dead trees is an important element of the forest ecosystem. It includes the dead, woody parts of plants, or the entire woody and shrubby plants at various stages of decomposition [1,2]. In forest ecosystems, the wood of dead trees, both standing and lying, has many ecological functions. Among others, it creates diverse micro-habitats for numerous fungi, lichens, bacteria, and mosses [3,4]. Deadwood is an integral element of the forest [5,6], one that affects nutrient circulation, carbon sequestration, and the amount of water retention [7,8,9]. In addition, deadwood supports multiple functions of the ecosystem including regeneration after disturbances [10], as well as carbon, nutrient, and hydrological cycles [11,12]. Deadwood can have a real impact on the microclimate [13,14].
The amount of deadwood depends on the forest management system. Management intensification significantly reduces the stock and diversity of deadwood [15], causing losses of saproxylic species [16,17]. For saprophytic organisms, not only the quantity but also the diversity of deadwood is of great importance [18,19]. It is now estimated that 20%–40% of organisms in forested ecosystems depend, during some part of their life cycle, on wounded or decaying woody material from living, weakened, or dead trees. A certain amount of deadwood remains in the forest as a result of natural stand dynamics [20,21]. The basic difference between natural forests and forests utilized for the purposes of economy is the amount of deadwood. In the natural forests of the Białowieża Forest (Poland), the average amount of deadwood is about 120 m3/ha [22]. Throughout Europe, the current volumes of dead wood in managed forests are normally less than 10% of natural levels [9]. In natural forests, deadwood is associated with several relict, rare, and protected animal species [23]. The average volume of deadwood in Polish forests is about 5.7 m3h−1 [24]. The effects of forest management may be exemplified by Swedish forest reserves, which had been used for economic purposes before going under protection. The average stock of dead trees in those reserves is only 24 m3h−1, which is significantly below the expected values described in natural forests, i.e., 80–120 m3h−1 [25].
In forests, deadwood is an important water storage container [26]. A single lying deadwood log has the ability to store up to several hundred liters of water, while slowing down surface runoff and, consequently, preventing local soil erosion [27,28]. Along with the decomposition of wood, its structure also changes, which can translate into water retention and absorption [29]. Paletto and Tosi [30] note a marked increase in the moisture content and a decrease in the density of wood in successive degrees of decomposition in the Mediterranean climate. The physical feature of wettability is closely related to water storage capacity and absorbability. To date, no studies have been conducted on deadwood wettability in relation to species and degree of decomposition. There are numerous papers on the hydrological features of living trees, e.g., their bark [31,32]. The water storage capacity of tree crowns [33] and soil [34] is analyzed as a reservoir of water available in both forest and urbanized ecosystems. There is no research on the retention possibilities of deadwood in forest ecosystems. In a changing climate, increasing the retention capacity of the forest ecosystem should be a priority.
The main aim of this study is to show changes in hydrological properties, i.e., water storage capacity and absorbability of deadwood of different tree species with varying degrees of decomposition. The research focused on different species of wood in various degrees of decomposition. It was hypothesized that (1) the absorbability and water storage capacity, changeable over time, depending on the species of deadwood; (2) heavily decomposed wood, characterized by low density and high porosity, retains more water.

2. Materials and Methods

2.1. General Methodological Assumptions

Samples for testing were obtained from the area of the Czarna Rózga Forest Reserve in central Poland (50°59′37″ N; 20°1′5″ E). The reserve was created in 1996 on the area of 185.6 hectares. The tree stands within the area of the reserve are of natural origin, and the dominant species are the alder and fir. The research area is characterized by the following climatic conditions: average annual rainfall of 650 mm, average annual temperature of 7.5 °C, and the growing season of 190–200 days. Research plots were located in the area with a predominance of fluvioglacial sand and loam with Gleysols, Cambisols, and Podzols (WRB 2014) [35]. Coniferous and deciduous species naturally occurring in the temperate climate were selected for the study. The research focused on deadwood of both coniferous and deciduous species: Silver fir (Abies alba), Common hornbeam (Carpinus betulus), Common ash (Fraxinus excelsior), Common alder (Alnus glutinosa), Common aspen (Populus tremula). The analyses presented in this study include data for 5 species with different decomposition levels, i.e., decomposition classes III, IV, and V. The degree of deadwood decomposition was determined according to the classification presented by Maser et al. [36]. Logs of each species with a diameter of 25 to 30 cm in their central point were selected for the study. The length of the logs ranged between 10–15 m. A wood sample of 7 × 7 × 7 cm was collected from each log. Each sample was obtained from the central point of the log. In total, 75 wood samples were collected for testing (5 species × 3 degrees of decomposition × 5 replicates). The study was carried out in May 2017. The methods used for physical properties determination in the present study were described in detail elsewhere [26].

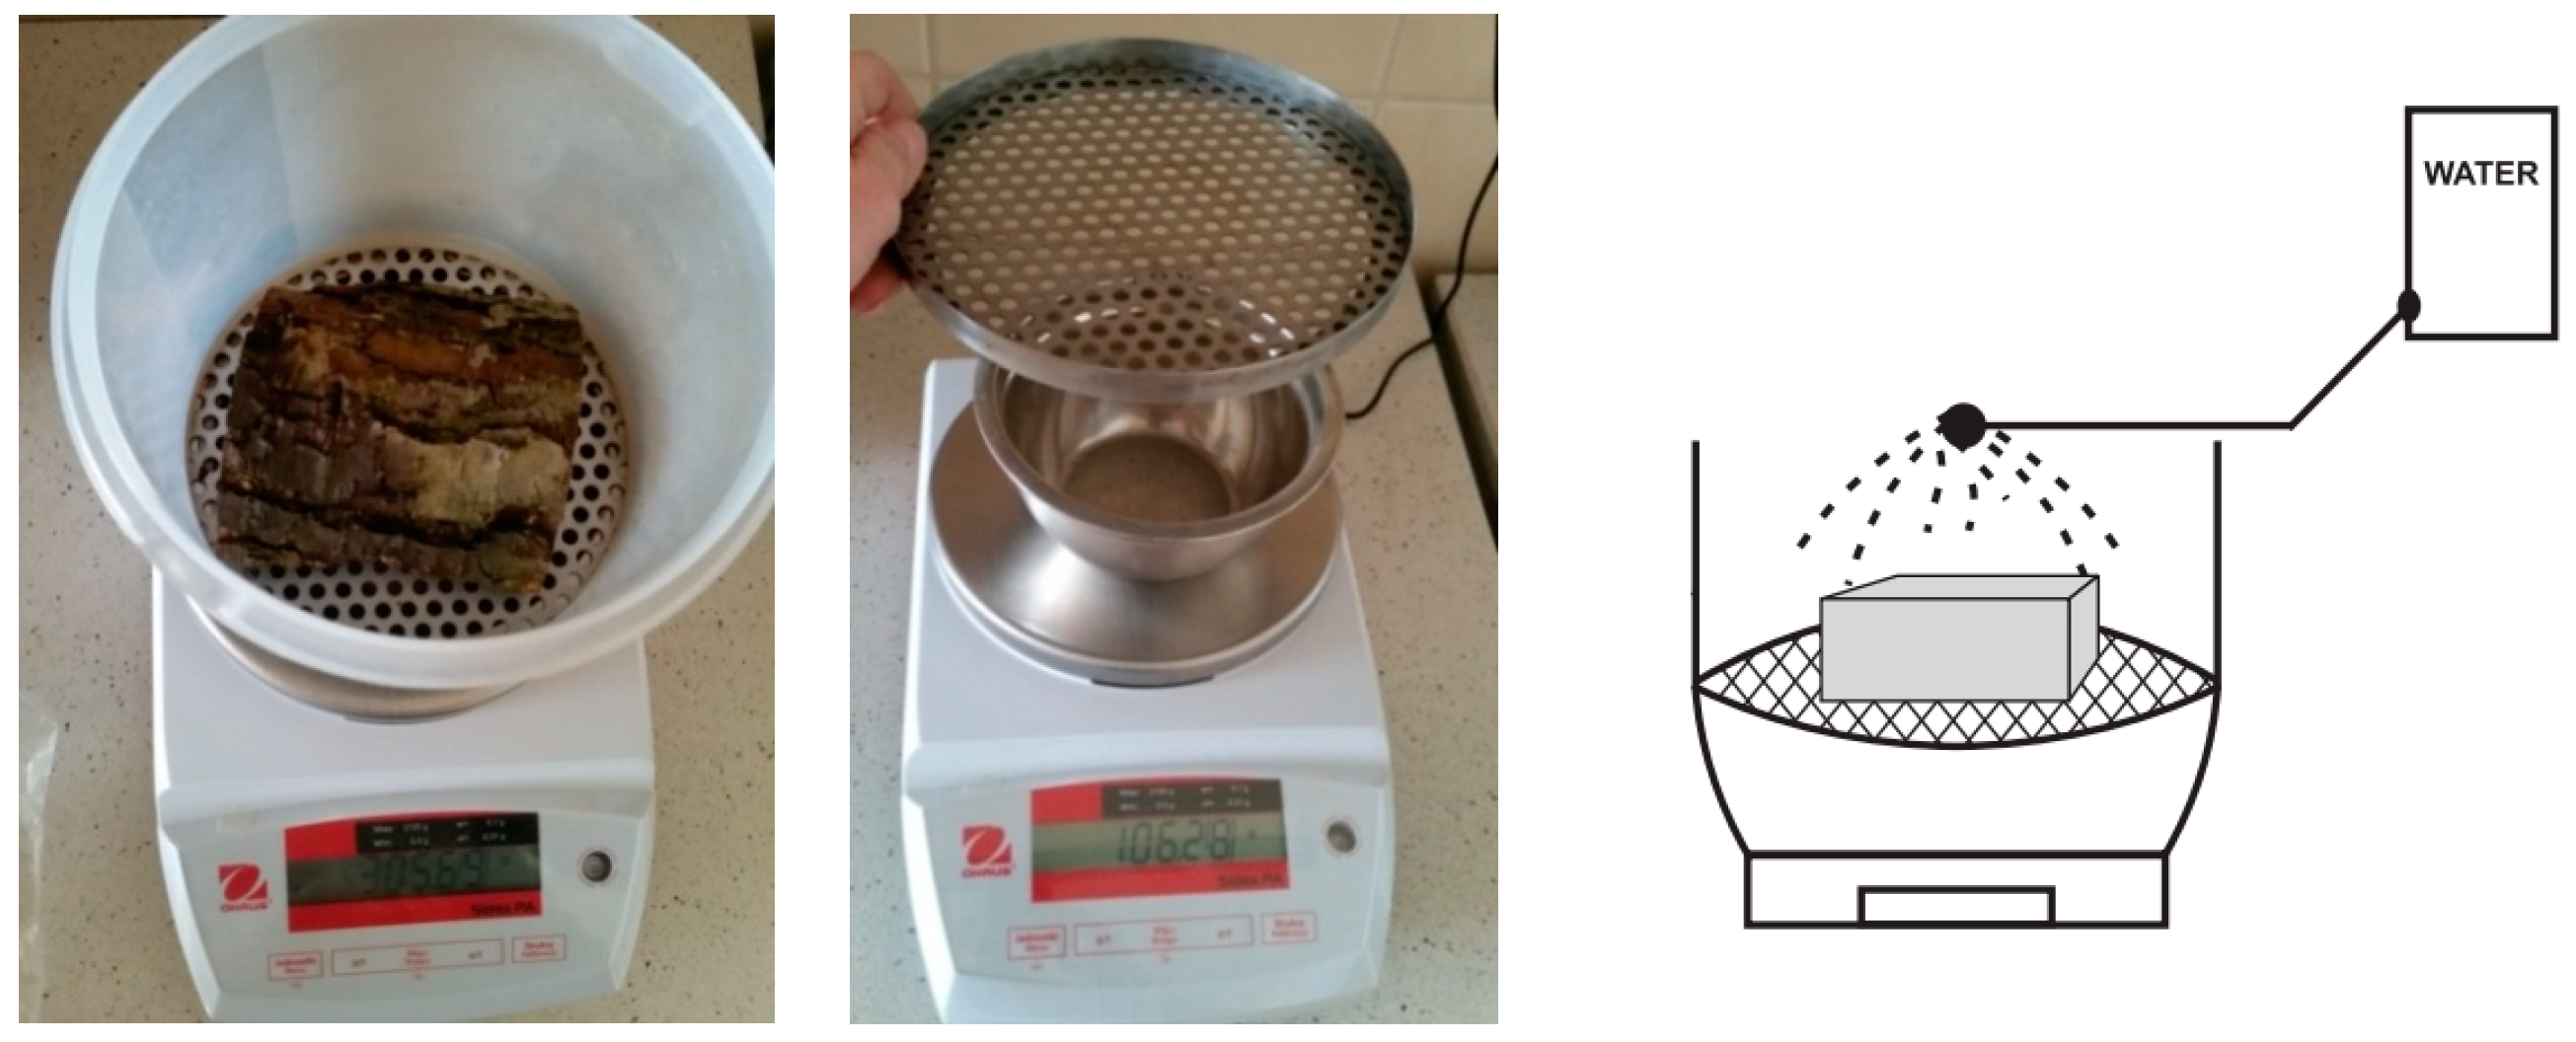
2.2. Measurement of Water Storage Capacity

Water storage capacity (S) during simulated precipitation was measured by conducting a series of measurements at our unique measurement station (Figure 1). The measurement consisted of calculating the difference between the amount of water used to simulate precipitation (P) and the amount of water that remained on the wood sample. In order to show the dynamics of the water storage capacity of wood, readings of the amount of water retained by the sample were performed after spraying with subsequent doses of water (P1, P2, P3…) from a graduated container. The volume of a single dose was 20 mL. The delivery time for one dose of water was 30 s, so a total of five minutes of precipitation was obtained. The amount of water supplied to the wood sample was related to its surface, which was 0.0049 m2, resulting from the dimensions of the sample used for the analyses. The water layer unit per square meter [L/m2] was obtained in this way. The next doses of precipitation were a multiple of 4.08 mm of water (0.02 L/0.0049 m2). Distilled water with a temperature of 21 °C ± 1 °C was used to simulate precipitation. In the laboratory in which the experiment was conducted, the temperature was maintained at 21 °C–22 °C. An unchanging temperature was necessary due to the change of water density depending on the temperature [37]. The surface of the container above which the measurement was taken amounted to 200.96 cm2. The sprinkling of the sample with the total dose of water equal to 20 mL lasted for five minutes, which made it possible to simulate precipitation with a constant intensity of 12 mm/h. The analyzed wood sample was lying on a perforated pad, and the balance was tared so that the readings only indicated increments of the water that did not stop on the sample (ΔS).
Δ S = M i 1 M i
where: ΔS—increase in the water storage capacity of a sample after each subsequent water dose (g; M i 1 —weight of a sample after the application of a subsequent dose of water (g) and M i —weight of a sample before the next sprinkling (g).
Each subsequent S values were the sum of the previous value and the increment of S. Based on these values, it was possible to develop curves of water storage capacity changes over time for each wood species. The last value indicates the maximum water storage capacity (Smax) under certain conditions.
The dynamic water storage capacity analysis was repeated for wood samples in three moisture variants: (1) wood in the state of natural moisture (immediately after transport from the site—Sn; weight moisture 45%–70% depending on wood species and decay class); (2) dried wood (after drying for 48 h at 105 °C Sd); (3) moist wood (after an analysis of water absorbability Sw). In each variant of wood moisture content and for each wood species the experiments were performed in 3 replications. The technique of measuring water storage capacity used in our experiment is based on methods known from the literature [38,39,40].

2.3. Measurement of Water Absorbability

Analyses performed under laboratory conditions determined changes in the water absorbability (N) of deadwood over time. By absorbability we mean the ability to absorb water. Samples of the wood of different species, with varying degrees of decomposition, were dried at 105 °C for 24 h [41]. After drying, they were weighed (Md) and then immersed in distilled water. Soaked wood samples (Mw) were weighed at intervals of 1 h, 6 h, 12 h, 24 h, 36 h, 42 h, 54 h, 66 h. The difference in weight between a sample saturated with water and a dry one was related in each case to the weight of the sample in the dry state (Formula (1)). In this way, subsequent values of water absorbability (N) were obtained after successive times of immersion in water (N1, N2,…).
N = Mw Md Md 100 %   [ % ]
where: N—water absorbability; Mw—weight of a sample after a subsequent soaking stage (g); Md—weight of a dry sample (g).

2.4. Statistical Analyses

The variability of water storage capacity and water absorption was analyzed depending on the type of deadwood but also for all species together, taking into account the degree of wood decomposition. ANOVA tests and Fisher’s LSD post hoc test were applied. The effects of wood species and decay classes on water storage capacity was analyzed by a generalized linear model (GLM). The statistical significance of the results was verified at the α = 0.05 significance level. All analyses were performed using the Statistica 12 software (StatSoft 2012)

3. Results

3.1. Variability of Water Storage Capacity Depending on the Type of Deadwood and the Degree of Decomposition

A comparison of the results of the water storage capacity of the deadwood of different tree species, considering their different moisture levels, reveals the importance of the wood species. In the case of wood samples in the natural moisture state in the first stage of sprinkling of the sample, statistically significant differences were noted in water storage capacity between the different species. The water storage capacity of fir wood was statistically significantly higher as compared to the water storage capacity of the other species analyzed (Table 1). In the remaining experimental runs (S2n, S3n, S4n…), statistical analyses confirmed a higher water storage capacity of fir wood in relation to deciduous species (Table 1). In the dry variant, there were no statistically significant differences in the water storage capacity of wood of the studied species (Table 1). In the wet variant, in subsequent stages of the experiment (S1w, S2w, S3w…), the wood of different species varied in its water storage capacity (Table 1). Statistically, the highest water storage capacity was recorded for fir wood. Aspen wood was characterized by high water storage capacity regardless of the experiment variant (Table 1).
Additionally, the present paper analyzes the impact of the degree of wood decomposition on water storage capacity. Regardless of the variant of wood moisture (dry, natural, and moist), differences in water storage capacity were noted in the various degrees of wood decomposition. Statistically significantly higher water storage capacity was recorded in samples of the most decomposed wood, i.e., in the 5th degree of decomposition (Table 2). There were no significant differences in water storage capacity between wood in the 3rd and 4th degree of decomposition. Hornbeam and ash wood were characterized by having the highest density of wood regardless of the decomposition rate (Table S1). Aspen and fir wood were characterized by the lowest density of wood regardless of decomposition rate. Wood in III DC was characterized by higher density compared to wood in V DC. The highest porosity was characteristic for fir wood in V DC (92.6%), and the lowest for hornbeam wood in the third degree of decomposition (63.1%) (Table S1). The values of the maximum S in the natural state, obtained as the total increment of retained water, in the 3rd degree of decomposition, were as follows: for fir it was 80.22% of the total rainfall, for aspen 77.42%, for alder 35.84%; the value was definitely lower for ash: 14.06% and the lowest for hornbeam: 11.54%. In the 5th degree of decomposition, in the natural state, the maximum S for fir amounted to 85% of the entire precipitation (P) while for the other species it was much higher than in the 3rd degree of decomposition, and did not drop below 54.32% for aspen. The percentages were calculated in relation to the entire precipitation (P).
Our results confirmed the role of wood species and decay classes on water storage capacity of deadwood. Based on the GLM analysis, a strong dependence of the deadwood decomposition rate and wood species on the water storage capacity of deadwood was observed (Table 3).
Figure S1 presents a comparison of changes in water storage capacity (S) in all analyzed wood decomposition stages, for three moisture variants, taking into account the species characteristics. A line depicting the increments in successive water doses, i.e., precipitation (P), has also been added. Figure S1 confirms the significance of the species and the degree of wood decomposition in shaping the water storage capacity of wood. The amounts of water (S) in the wood of the analyzed species, in the three degrees of decomposition in the variant of natural moisture and in the moist variant, are comparable. No large differences are evident in the case of dry wood samples regardless of the type and degree of wood decomposition. The highest water storage capacity was recorded for fir wood regardless of the degree of its decomposition and the experiment variant (Figure S1).

3.2. Variability of Water Absorbability Depending on the Species of Deadwood and Degree of Decomposition

Differences in deadwood absorbability were noted depending on the tree species and the degree of decomposition (Table 4 and Table 5). At subsequent time intervals, the water absorbability (N) of all wood samples increased. In the first step of the experiment, i.e., N1 and N6, very large increments of water absorption were noted in wood samples irrespective of the species (Table 4). After 42 h of the experiment, fir, hornbeam, and aspen ceased to absorb water. In the case of alder and ash, water absorbability was minimal. In addition, water absorbability varies depending on the degree of wood decomposition (Table 5). Considering all species together, the average for N1 in the 3rd degree of decomposition was 47.24% in relation to the original weight of the samples, while in the 5th decomposition degree it was as much as 260%.
Moreover, Figure S2 shows that the species and the degrees of wood decomposition differ in their dynamics and the course of absorbability curves. After each subsequent immersion time, the absorbability increment decreases. Interspecific differences are revealed in the amount of water absorbability. It is also visible that, over time, water absorbability increases but the dynamics of water intake decreases. In degrees of decomposition III and IV, the prominent species is fir, characterized by having the highest water absorbability in the initial stage of soaking. In the fifth degree of wood decomposition, differences in water absorbability increments basically disappear after 12 h.

4. Discussion

The research confirmed the correctness of the hypotheses. The water storage capacity and water absorbability of deadwood depends on the species and the degree of wood decomposition. The study covered both deciduous and coniferous species. Fir wood was characterized by having the highest water storage capacity and water absorbability. There are quantitative differences in the chemical composition between the wood of individual tree species [42]. The differences between fir and the analyzed deciduous species, found in our study, result from differences in the chemical composition, lignin content, and nutrient content of the wood [43,44]. At the same time, deciduous and coniferous species differ in the quality of hemicellulose, degradation of lignin, and the presence or absence of resins. The ability to retain water is associated with the share of late wood: along with an increase in the share of late wood it will decrease, primarily in deciduous species [41]. The differences that exist between early and late wood, and differences in the structure of vessels and tubule affecting their diameters affect the colonization possibilities of organisms involved in the decomposition of wood. In the case of fir wood, the increase of water storage capacity and water absorbability is caused by a greater number of openings in late wood than in earlywood.
The species included in the study differ in the density of wood in its natural state. In the case of species characterized by having the hardest wood with the highest density in the fresh state (hornbeam and ash), in subsequent stages of decomposition, the wood is also characterized by the relatively highest density as compared to other species [29]. The highest absorbability after the first hour was observed for fir wood, and the lowest for hornbeam wood. Hornbeam wood has a much higher density (1000 kg/m3) than the wood of species such as fir, poplar or alder (about 400–450 kg/m3). The degree of wood decomposition is related to the physical characteristics of wood and its structure. The present study confirmed the importance of the degree of deadwood decomposition for water storage capacity and water absorbability. The highest water storage capacity characterized the most decomposed wood, i.e., wood in the fifth degree of decomposition. The progress of deadwood decomposition is associated with changes in the physical properties of wood. Błońska et al. [29] noted a change in wood density, moisture, and porosity, and recorded weight loss in subsequent stages of wood decomposition. Throughout the decomposition process, the density of deadwood changes. Wood in the third decomposition class (DC) exhibited the highest density, ranging from 0.36 to 0.57 g/cm3. Among the examined species, the highest density was found for hornbeam in the third DC (0.57 g/cm3), whereas fir and aspen exhibited the lowest density in the V DC (0.11 and 0.17 g/cm3, respectively) [26]. Cornelissen et al. [45] noted that wood density does not affect the rate of wood decomposition although it may have an indirect impact by affecting the moisture content in the wood of dead trees. Along with the degree of decomposition, wood porosity changes, and in samples with higher porosity, there is more potential space into which water can penetrate. Water drop penetration time (WDPT) and surface free energy (SFE) had been tested on samples of deadwood [26]. The research showed that wood in the highest degree of decomposition absorbs water very well (this is indicated by very short water absorption times). A high SFE value confirms that the surface of wood in the highest degree of decomposition absorbs water best and is hydrophilic. Higher water storage capacity and absorbability were recorded in wood samples with statistically significantly higher porosity. Fir wood was characterized by the highest water storage capacity and water absorbability and at the same time the highest porosity i.e., 92.6%. In conclusion, it can be stated that water storage capacity and absorbability is inversely proportional to wood density and proportional to wood porosity. Water storage capacity and absorbability increase in order of species: hornbeam < ash < alder < aspen < fir.
The water storage capacity and the absorbability of deadwood samples depend on the wood species, the degree of its decomposition, and the degree of drying of the samples. During the first 2 min of spraying, the rate of water absorption increment is slower, especially for samples of dry wood, which show higher resistance to water. In the case of dry wood samples, a significant slowdown can be observed in the rate of water soaking into their inside. The interactions of wood, water, and heat during drying are complex [46]. The high temperature causes chemical and morphological changes of wood, acid hydrolysis, decarboxylation reaction of hemicelluloses, and condensation reactions of lignin [47,48]. Heat treatment of wood might partially block the access of water to wood cell walls because the pits, which play a crucial role in connecting the wood cell walls were closed [49]. The variant with dry wood can be considered as not occurring naturally in forest ecosystems, but it allowed us to obtain information about the response of dry wood, about its hydrophobicity. In dense stands, where moisture is higher on the forest floor, and in addition, the wood is in contact with the soil, such drying of deadwood is unlikely. The obtained results can be related to soils characterized by the phenomenon of “critical drying,” above which samples do not absorb water [50]. An increase in soil water repellency may also be observed on fire-affected soils [51]. Both water storage capacity and water absorbability are dynamic processes, and they largely depend on the time during which samples are exposed to water. In terms of absorbability, the first 12 h of the experiment proved to be crucial for the analyzed deadwood samples. A significant quantity of absorbed water was noted in the wood of all types in the 1st and 6th hour of duration of the experiment. After 42 h of the experiment, the increment of N was close to zero.
The changes and dynamics of water storage capacity are a very important element of water balance in the environment. Our research has confirmed the importance of deadwood in water retention in forest ecosystems. Our results are in line with previous studies [52]. The water storage capacity of deadwood is particularly important in regions with a negative water balance [53], where even the amount of water captured by the tree crown has a greater hydrological significance. Additionally, the wood of dead trees is the place of growth of lichens, which can retain up to 3000 times more water than their own weight [54,55]. The presence of deadwood on the forest floor can be an important element protecting the soil against drying, which in the face of decreasing rainfall and rising temperatures in a moderate climate may be an important issue. Laboratory research with the use of simulated rainfall [38,56] is needed to better understand the physical and hydrological properties of deadwood.

5. Conclusions

The present study confirms the significance of the wood species and the degree of its decomposition for shaping the water storage capacity and water absorbability of deadwood in forest ecosystems. The water storage capacity and absorbability are inversely proportional to wood density and proportional to wood porosity. In our research, fir wood was characterized by having the highest water storage capacity and water absorbability. Deciduous species were characterized by a much lower water storage capacity and water absorbability. Among the deciduous species under analysis, aspen wood was characterized by a high water storage capacity and absorbability compared to other species. The most decomposed wood, i.e., wood in the fifth degree of decomposition, regardless of the wood species has a great potential for water retention which may be important in forest ecosystems. The amount of water retained is affected by the degree of saturation of the samples. Dried wood samples showed the lowest water storage capacity and water absorbability. The diversity of hydrological and physical properties, found in our research, constitutes important information on the dynamics of water availability in deadwood and confirms the significance of the amount of deadwood in forest ecosystems. The results obtained can be used in forest management to shape the water balance of the forest ecosystem. By regulating the quantity and species composition of deadwood, we can actively influence the water supply in the forest. Deadwood can be used to create micro-habitats characterized by a specific microclimate with stronger moisture. This is a particularly important function in ecosystems or periods characterized by water scarcity.

Supplementary Materials

The following are available online at https://www.mdpi.com/1999-4907/11/5/575/s1, Figure S1: Change of the course of S as a time function for all species, in degrees of decomposition: III, IV and V (T[s]—duration of simulated precipitation. Water storage capacity reading was taken every 5 min; P—the course of increment of simulated precipitation amount; S [mm]—water storage capacity), Figure S2: Changes in N increments during immersion in water (N [%]—increment of absorbability of deadwood samples; T [h]—successive times of water immersion of samples; III, IV, V—degrees of deadwood decomposition, Table S1: Selected physical properties of the wood (modified from Błońska et al. [26]).

Author Contributions

The following statements should be used Conceptualization, A.K.-I., E.B. and J.L.; methodology, A.K.-I.; formal analysis, A.K.-I., E.B.; writing—original draft preparation, A.K.-I., E.B., J.L.; writing—review and editing, A.K.-I., E.B., J.L.; funding acquisition, E.B. All authors have read and agreed to the published version of the manuscript.

Funding

The project was financed by the National Science Centre, Poland: decision no. DEC-2016/21/D/NZ9/01333.

Conflicts of Interest

The authors declare no conflict of interest.

References

  1. Bobiec, A. Living stands and deadwood in the Bialowieza Forest: Suggestions for restoration management. For. Ecol. Manag. 2002, 165, 125–140. [Google Scholar] [CrossRef]
  2. Molinas-González, C.R.; Castro, J.; Leverkus, A.B. Deadwood Decay in a Burnt Mediterranean Pine Reforestation. Forests 2017, 8, 158. [Google Scholar] [CrossRef] [Green Version]
  3. Hyseni, C.; Garrick, R.C. Ecological Drivers of Species Distributions and Niche Overlap for Three Subterranean Termite Species in the Southern Appalachian Mountains, USA. Insects 2019, 10, 33. [Google Scholar] [CrossRef] [PubMed] [Green Version]
  4. Błońska, E.; Kacprzyk, M.; Spólnik, A. Effect of deadwood of different tree species in various stages of decomposition on biochemical soil properties and carbon storage. Ecol. Res. 2017, 32, 193–203. [Google Scholar] [CrossRef] [Green Version]
  5. Gerhard, M.; Reich, M. Restoration of streams with large wood: Effects of accumulated and built-in wood on channel morphology, habitat diversity and aquatic fauna. Int. Rev. Hydrobiol. 2000, 85, 123–137. [Google Scholar] [CrossRef]
  6. Gomi, T.; Sidle, R.C.; Bryant, M.D.; Woodsmith, R.D. The characteristics of woody debris and sediment distribution in head water streams, southeastern Alaska. Can. J. For. Res. 2001, 31, 1386–1399. [Google Scholar] [CrossRef]
  7. Kennedy, P.G.; Quinn, T. Understory plant establishment on old-growthstumps and the forest floor in western Washington. For. Ecol. Manag 2001, 154, 193–200. [Google Scholar] [CrossRef]
  8. Stokland, J.N.; Siitonen, J.; Jonsson, B.G. Biodiversity in Dead Wood; Cambridge University Press: Cambridge, UK, 2012. [Google Scholar]
  9. Ulyshen, M.D. Saproxylic Insects: Diversity, Ecology and Con-Servation; USDA Forest Service: Athens, Greece, 2018.
  10. Macek, M.; Wild, J.; Kopecky, M.; Cervenka, J.; Svoboda, M.; Zenahlikova, J.; Fischer, A. Life and death of Picea abies after bark-beetle outbreak: Ecological processes driving seedling recruitment. Ecol. Appl. 2017, 27, 156–167. [Google Scholar] [CrossRef] [Green Version]
  11. Gurnell, A.M.; Gregory, K.J.; Petts, G.E. The role of coarse woody debris in forest aquatic habitats: Implications for management. Aquat. Conserv. 1995, 5, 143–166. [Google Scholar] [CrossRef]
  12. Watkinson, S.; Bebber, D.; Darrah, P.; Fricker, M.; Tlalka, M.; Boddy, L. The role of wood decay fungi in the carbon and nitrogen dynamics of the forest floor. In Fungi in Biogeochemical Cycles; Gadd, G.M., Ed.; Cambridge University Press: Cambridge, UK, 2006; pp. 151–181. [Google Scholar]
  13. Hou, P.; Pan, C. Coarse woody debris and its function in forest ecosystem. Chin. J. Appl. Ecol. 2001, 12, 309–314. [Google Scholar]
  14. Wei, L.; Fenton, N.J.; Lafleur, B.; Bergeron, Y. The Combined Role of Retention Pattern and Post-Harvest Site Preparation in Regulating Plant Functional Diversity: A Case Study in Boreal Forest Ecosystems. Forests 2019, 10, 1006. [Google Scholar] [CrossRef] [Green Version]
  15. Maser, C.; Anderson, R.G.; Cromak, K.; Williams, J.T.; Martin, R.E. Dead and down woody material. In Wildlife Habitats in Managed Forests: The Blue Mountains of Oregon and Washington; Thomas, J.W., Ed.; Government Printing Office: Washington, DC, USA, 1979; Volume 553, pp. 78–95. [Google Scholar]
  16. Grove, S.J. Saproxylic insect ecology and the sustainable management of forests. Annu Rev. Ecol. Evol. Syst. 2002, 33, 1–23. [Google Scholar] [CrossRef]
  17. Seibold, S.; Bässler, C.; Brandl, R.; Gossner, M.M.; Thorn, S.; Ulyshen, M.D.; Müller, J. Experimental studies of dead-wood biodiversity—A review identifying global gaps in knowledge. Biol. Conserv. 2015, 191, 139–149. [Google Scholar] [CrossRef]
  18. Sollins, P. Input and decay of coarse woody debris in coniferous stands in western Oregon and Washington. Can. J. For. Res. 1982, 12, 18–28. [Google Scholar] [CrossRef]
  19. Siitonen, J. Forest management, coarse woody debris and saproxylic organisms: Fennoscandian boreal forests as an example. Ecol. Bull. 2001, 49, 11–41. [Google Scholar]
  20. Mattson, K.G.; Swank, W.T.; Waide, J.B. Decomposition of woodydebris in a regenerating, clear-cutforest in the Southern Appalachians. Can. J. For. Res. 1987, 17, 712–721. [Google Scholar] [CrossRef] [Green Version]
  21. Junninen, K.; Similä, M.; Kouki, J.; Kotiranta, H. Assemblages of wood-inhabiting fungi along the gradients of succession and naturalness in boreal pine-dominated forests in Fennoscandia. Ecography 2006, 29, 75–83. [Google Scholar] [CrossRef]
  22. Gutowski, J.M.; Bobiec, A.; Pawlaczyk, P.; Zub, K. Drugie Życie Drzewa; WWF Polska: Warszawa/Hajnówka, Poland, 2004; pp. 1–245. [Google Scholar]
  23. Radu, S. The Ecological Role of Deadwood in Natural Forests. In Nature Conservation. Environmental Science and Engineering (Environmental Science); Gafta, D., Akeroyd, J., Eds.; Springer: Berlin/Heidelberg, Germany, 2006. [Google Scholar]
  24. Czerepko, J.; Hilszczański, J.; Jabłoński, M. Deadwood—A living problem. Studia i Mater. CEPL w Rogowie 2014, 41, 36–45. [Google Scholar]
  25. Ranius, T.; Kruys, N.; Jonsson, B.G. Estimation of woody debris quantity in European natural boreal forests—A modeling approach. Can. J. For. Res. 2004, 34, 1025–1034. [Google Scholar] [CrossRef]
  26. Błońska, E.; Klamerus-Iwan, A.; Łagan, S.; Lasota, J. Changes of the water repellency and physical properties with decomposition rate of deadwood of different species in temperate climate. Ecohydrology 2018, 11, 2023. [Google Scholar] [CrossRef]
  27. Keesstra, S.; Mol, G.; De Leeuw, J.; Okx, J.; Molenaar, C.; De Cleen, M.; Visser, S. Soil-Related Sustainable Development Goals: Four Concepts to Make Land Degradation Neutrality and Restoration Work. Land 2018, 7, 133. [Google Scholar] [CrossRef] [Green Version]
  28. Bayat, F.; Monfared, A.B.; Jahansooz, M.R.; Esparza, E.T.; Keshavarzi, A.; Morera, A.G.; Cerdà, A. Analyzing long-term soil erosion in a ridge-shaped persimmon plantation in eastern Spain by means of ISUM measurements. Catena 2019, 183, 104176. [Google Scholar] [CrossRef]
  29. Błońska, E.; Lasota, J.; Piaszczyk, W. Dissolved organic carbon and total nitrogen release from deadwood of different tree species in various stages of decomposition. J. Sci. Plant. Nutr. 2018, 65, 100–107. [Google Scholar] [CrossRef] [Green Version]
  30. Paletto, A.; Tosi, V. Deadwood density variation with decay class in seven tree species of the Italian Alps. Scand. J. For. Res. 2010, 25, 164–173. [Google Scholar] [CrossRef]
  31. Levia, D.F.; Herwitz, S.R. Interspecific variation of bark water storage capacity of three deciduous tree species in relation to stemflow yield and solute flux to forest soils. Catena 2005, 64, 117–137. [Google Scholar] [CrossRef]
  32. Ilek, A.; Kucza, J. Hydrological properties of bark of selected forest tree species. Part I: The coefficient of development of the interception surface of bark. Trees 2014, 28, 831–839. [Google Scholar] [CrossRef] [Green Version]
  33. Klamerus-Iwan, A.; Link, T.E.; Keim, R.F.; Van Stan, J.T., II. Storage and Routing of Precipitation through Canopies. In Precipitation Partitioning by Vegetation: A Global Synthesis; Van Stan, J., II, Gutmann, E., Friesen, J., Eds.; Springer Nature: Berlin, Germany, 2020; pp. 17–34. [Google Scholar]
  34. Ballabio, C.; Panagos, P.; Monatanarella, L. Mapping top soil physical properties at European scale using the LUCA Sdatabase. Geoderma 2016, 261, 110123. [Google Scholar] [CrossRef]
  35. FAO. WRB (World Reference Base for Soil Resource); FAO, ISRIC and ISSS: Rome, Italy, 2014. [Google Scholar]
  36. Bradford, J.B.; Jensen, N.R.; Domke, G.M.; D’Amato, A.W. Potential Increases in Natural Disturbance Rates Could Offset Forest Management Impacts on Ecosystem Carbon Stocks. For. Ecol. Manag. 2013, 308, 178–187. [Google Scholar] [CrossRef]
  37. Klamerus-Iwan, A.; Błońska, E. Canopy storage capacity and wettability of leaves and needles: The effect of water temperature changes. J. Hydrol. 2018, 559, 534–540. [Google Scholar] [CrossRef]
  38. Garcia-Estringana, P.; Alonso-Blázquez, N.; Alegre, J. Water storage capacity, stemflow and water funneling in Mediterranean shrubs. J. Hydrol. 2010, 389, 363–372. [Google Scholar] [CrossRef]
  39. Xiao, Q.; McPherson, E. Surface water storage capacity of twenty tree species in Davis, California. J. Environ. Qual. 2016, 45, 188–198. [Google Scholar] [CrossRef] [PubMed]
  40. Klamerus-Iwan, A.; Witek, W. Variability in the Wettability and Water Storage Capacity of Common Oak Leaves (Quercus robur L.). Water 2018, 10, 695. [Google Scholar] [CrossRef] [Green Version]
  41. Krzysik, F. Nauka O Drewnie; PWN: Warszawa, Poland, 1974; pp. 1–653. [Google Scholar]
  42. Piaszczyk, W.; Błońska, E.; Lasota, J. Soil biochemical properties and stabilization soil organic matter in relation to deadwood of different species. FEMS Microbiol. Ecol. 2019, 95. [Google Scholar] [CrossRef] [Green Version]
  43. Wong, D.W.S. Structure and action mechanism of ligninolytic enzymes. Appl. Biochem. Biotechnol. 2009, 157, 174–209. [Google Scholar] [CrossRef]
  44. Kögel-Knabner, I. The macromolecular organic composition of plant and microbial residues as inputs to soil organic matter. Soil Biol. Biochem. 2002, 34, 139–162. [Google Scholar] [CrossRef]
  45. Cornelissen, J.H.C.; Sass-Klaassen, U.; Poorter, L.; Geffen, K.; Logtestijn, R.P.; Hal, J.; Hefting, M. Controls on coarse wood decay in tempera te tree species: Birth of the LOGLIFE experiment. Ambio 2012, 41, 231–245. [Google Scholar] [CrossRef] [Green Version]
  46. Konopka, A.; Barański, J.; Huráková, T.; Klement, J. The influence of high temperature wood dryling conditions Rusing air-steam mixture on its properties. Ann. WULS-SGGW For. Wood Technol. 2015, 90, 107–114. [Google Scholar]
  47. Nuopponen, M.; Vuorinen, T.; Jämsä, S.; Viitaniemi, P. Thermal Modifications in Softwood Studied by FT-IR and UV Resonance Raman Spectroscopies. J. Wood Chem. Technol. 2005, 24, 13–26. [Google Scholar] [CrossRef]
  48. Altgen, M.; Hofmann, T.; Militz, H. Wood moisture content during the thermal modification process affects the improvement in hygroscopicity of Scots pine sapwood. Wood Sci. Technol. 2016, 50, 1–15. [Google Scholar] [CrossRef]
  49. Gao, Y.; Xu, K.; Peng, H.; Jiang, J.; Zhao, R.; Lu, J. Effect of Heat Treatment on Water Absorption of Chinese fir Using TD-NMR. Appl. Sci. 2019, 9, 78. [Google Scholar] [CrossRef] [Green Version]
  50. Dekker, L.W.; Ritsema, C.J.; Oostindie, K.; Boersma, O.H. Effect of drying temperature on the severity of soil water repellency. Soil Sci. 1998, 163, 780–796. [Google Scholar] [CrossRef]
  51. Doerr, S.H.; Shakesby, R.A.; Walsh, R.P.D. Soil water repellency: Its causes, characteristics and hydro-geomorphological significance. Earth-Sci. Rev. 2000, 51, 33–65. [Google Scholar] [CrossRef]
  52. Hämäläinen, A.; Kouki, J.; Lõhmus, P. The value of retained Scots pines and their dead wood legacies for lichen diversity in clear-cut forests: The effects of retention level and prescribed burning. For. Ecol. Manag. 2014, 324, 89–100. [Google Scholar] [CrossRef]
  53. Sadeghi, S.M.M.; Attarod, P.; Van Stan, T.G.; Pypker, T.G. The importance of considering rainfall partitioning in afforestation initiatives in semiarid climates: A comparison of common planted tree species in Tehran, Iran. Sci. Total Environ. 2016, 568, 845–855. [Google Scholar] [CrossRef]
  54. Porada, P.; Kleidon, A. Significant contribution of non-vascular vegetation to global rainfall interception. Nat. Geosci. 2018, 11, 563. [Google Scholar] [CrossRef]
  55. Klamerus-Iwan, A.; Kozłowski, R.; Przybylska, J.; Solarz, W.; Sikora, W. Variability of water storage capacity in three lichen species. Biologia 2020, 1–8. [Google Scholar] [CrossRef] [Green Version]
  56. Dunkerley, D.L. Stemflow on the woody parts of plants: Dependence on rainfall intensity and event profile from laboratory simulations. Hydrol. Process. 2014, 28, 5469–5482. [Google Scholar] [CrossRef]
Figure 1. The water storage capacity measurement station and the analysis diagram.
Forests 11 00575 g001
Table 1. Comparison of water storage capacity for the deadwood of each species at each stage of simulated precipitation.
AlderAshAspenHorn Be AmFir
mSDmSDmSDmSDmSD
S1n0.45 b0.380.34 b0.150.43 ab0.220.53 ab0.390.95 a0.40
S2n1.44 ab1.340.95 b0.451.49 ab0.541.26 ab0.942.59 a0.84
S3n2.80 b2.711.91 b0.912.94 ab0.922.35 b1.955.73 a1.75
S4n3.89 b3.662.87 b1.394.86 ab0.842.94 b2.567.16 a0.76
S5n7.08 ab5.985.02 b2.648.82 ab1.385.38 b4.8413.62 a1.51
S6n9.72 b7.407.31 b4.2614.08 ab1.727.59 b7.1119.39 a1.46
S7n12.87 b7.569.96 b6.4918.25 ab2.699.80 b9.3423.72 a1.35
S8n16.67 b7.3211.62 b7.3322.90 ab2.8811.44 b11.0127.46 a1.25
S9n19.56 ab7.5712.45 b7.3725.95 ab3.2913.15 b12.830.93 a1.39
S10n21.75 ab8.4013.84 b8.1928.85 ab3.6514.52 b14.334.47 a1.48
S1d0.28 a0.230.24 a0.150.23 a0.180.18 a0.100.30 a0.13
S2d0.85 a0.680.76 a0.400.75 a0.440.58 a0.250.91 a0.41
S3d1.78 a1.561.46 a0.931.55 a0.911.23 a0.651.83 a1.02
S4d2.85 a2.652.41 a1.842.78 a1.792.14 a1.262.95 a1.55
S5d4.04 a3.953.59 a3.204.07 a2.593.31 a2.324.44 a2.51
S6d5.11 a5.114.59 a4.205.68 a3.664.34 a3.195.82 a3.54
S7d6.12 a6.195.40 a4.927.08 a4.705.15 a3.827.30 a4.74
S8d7.00 a7.086.19 a5.668.16 a5.415.88 a4.368.44 a5.57
S9d7.88 a7.976.98 a6.379.19 a6.16.63 a4.939.55 a6.34
S10d8.76 a8.867.76 a7.0810.22 a6.787.38 a5.4810.62 a7.05
S1w0.58 ab0.560.40 b0.350.49 ab0.260.37 b0.280.94 a0.36
S2w1.34 ab1.241.06 b0.921.28 ab0.590.99 b0.762.66 a1.17
S3w2.40 ab2.081.87 b1.722.36 ab1.091.83 b1.564.99 a1.89
S4w3.08 ab2.712.23 b1.953.27 ab1.572.34 b1.766.94 a2.72
S5w5.15 ab4.663.67 b3.126.13 ab2.824.07 b2.9512.08 a4.20
S6w6.58 b6.224.81 b4.278.46 ab4.115.32 b3.5215.64 a5.00
S7w8.15 b7.885.83 b5.0510.33 ab4.976.60 b4.0319.31 a6.27
S8w9.92 b9.727.06 b5.8812.54 ab6.047.78 b4.5522.9 a6.90
S9w11.59 b11.338.40 b6.9414.99 ab7.728.89 b5.1226.22 a7.42
S10w12.97 b12.679.43 b7.7416.77 ab8.659.97 b5.7029.37 a8.22
m—mean, SD—standard deviation; S1, S2, S3,—water storage capacity after another dose of simulated precipitation [mm]; n—sample in natural state; w—sample in wet state; d—sample in dry state; different uppercase alphabets in the upper index mean significant differences between deadwood species.
Table 2. Comparison of water storage capacity for each degree of deadwood decomposition at each stage of simulated precipitation.
IIIIVV
mSDmSDmSD
S1n0.32 b0.130.38 b0.30.91 a0.34
S2n1.01 b0.521.03 b0.722.60 a0.80
S3n2.08 b1.262.45 b2.504.90 a1.41
S4n3.18 b2.163.21 b2.386.65 a1.56
S5n5.74 b4.146.18 b4.5512.03 a2.69
S6n8.88 b6.979.18 b6.4316.80 a2.77
S7n11.08 b8.1312.02 b7.7621.66 a2.07
S8n13.96 b10.0814.99 b8.6625.10 a2.49
S9n16.08 b11.3417.45 b9.4827.70 a5.10
S10n17.88 b12.6019.35 b10.6130.84 a5.70
S1d0.17 b0.120.14 b0.040.42 a0.14
S2d0.62 b0.330.44 b0.101.25 a0.37
S3d1.20 b0.870.87 b0.282.64 a0.80
S4d1.71 b1.321.49 b0.624.68 a1.20
S5d2.15 b1.642.15 b1.177.36 a1.54
S6d2.59 b1.972.92 b1.989.81 a1.81
S7d3.03 b2.313.55 b2.5412.05 a2.27
S8d3.46 b2.634.10 b2.9813.86 a2.65
S9d3.89 b2.964.61 b3.3615.64 a3.01
S10d4.33 b3.295.13 b3.7317.38 a3.35
S1w0.32 b0.310.45 b0.270.89 a0.43
S2w0.99 b0.961.13 b0.632.28 a1.22
S3w1.88 b1.822.07 ab1.234.10 a2.15
S4w2.79 b2.952.70 b1.765.24 a2.67
S5w5.01 a5.114.67 a3.238.98 a4.32
S6w6.64 b6.506.15 b4.6111.69 a5.46
S7w8.16 b7.847.58 b5.6414.39 a6.98
S8w9.62 b8.979.22 b7.0717.28 a8.09
S9w10.99 b10.1111.1 ab8.7319.96 a9.14
S10w12.32 b11.2212.46 ab9.7922.34 a10.26
m—mean, SD—standard deviation; S1, S2, S3,—water storage capacity after another dose of simulated precipitation; n—sample in natural state; w—sample in wet state; d—sample in dry state; different uppercase alphabets in the upper index mean significant differences between decomposition classes.
Table 3. Summary of generalized linear model (GLM) analysis of the effect of the wood species and decay classes on the water storage capacity.
SnSdSw
Fp ValueFp ValueFp Value
species22.60.00001.60.03662.40.0005
DC29.90.000011.80.00003.30.0005
Species * DC10.20.00002.30.00001.50.0158
DC—degree of deadwood decomposition; Sn—water storage capacity of wood samples in natural state; Sw—water storage capacity of wood samples in wet state; Sd—water storage capacity of wood samples in dry state.
Table 4. Comparison of water absorbability for each species of deadwood.
AlderAshAspenHorn Be AmFir
mSDmSDmSDmSDmSD
N1121.67 ab174.6290.37 b137.92161.07 ab219.4286.93 b79.45221.76 a97.79
N619.92 a7.6530.84 a19.0019.10 a11.7229.69 a23.5216.57 a9.16
N122.35 a3.442.32 a3.238.5 a10.920.8 a1.153.24 a6.33
N248.96 a9.548.68 a4.817.94 a5.1311.37 a9.075.52 a7.17
N361.74 a2.830.9 a1.740.8 a2.370.32 a0.581.29 a3.02
N420.030.080.010.020.000.000.000.000.000.00
N540.000.000.000.000.000.000.000.000.000.00
N660.000.000.000.000.000.000.000.000.000.00
m—mean; SD—standard deviation; N1, N2…—water absorbability in a time interval (1 h, 6 h. 12 h, 24 h, 36 h, 42 h, 54 h and 66 h); different uppercase alphabets in the upper index mean significant differences between deadwood species.
Table 5. Comparison of water absorbability for each degree of deadwood decomposition after subsequent hours of immersion in water.
IIIIVV
mSDmSDmSD
N147.24 b43.9101.16 b109.05260.68 a181.13
N622.92 ab12.9130.21 a16.6416.54 b15.78
N121.43 a2.845.53 a9.483.38 a4.48
N249.62 a6.4410.89 a7.864.97 a6.62
N360.45 a1.151.81 a3.030.77 a2.02
N420.000.010.010.020.020.06
N540.000.000.000.000.000.01
N660.000.000.000.000.000.00
m—mean; SD—standard deviation; N1, N2…—water absorbability in a time interval (1 h, 6 h. 12 h, 24 h, 36 h, 42 h, 54 h, and 66 h); different uppercase alphabets in the upper index mean significant differences between decomposition classes.

