Variation in Deadwood Microsites in Areas Designated under the Habitats Directive (Natura 2000)

Abstract
:1. Introduction
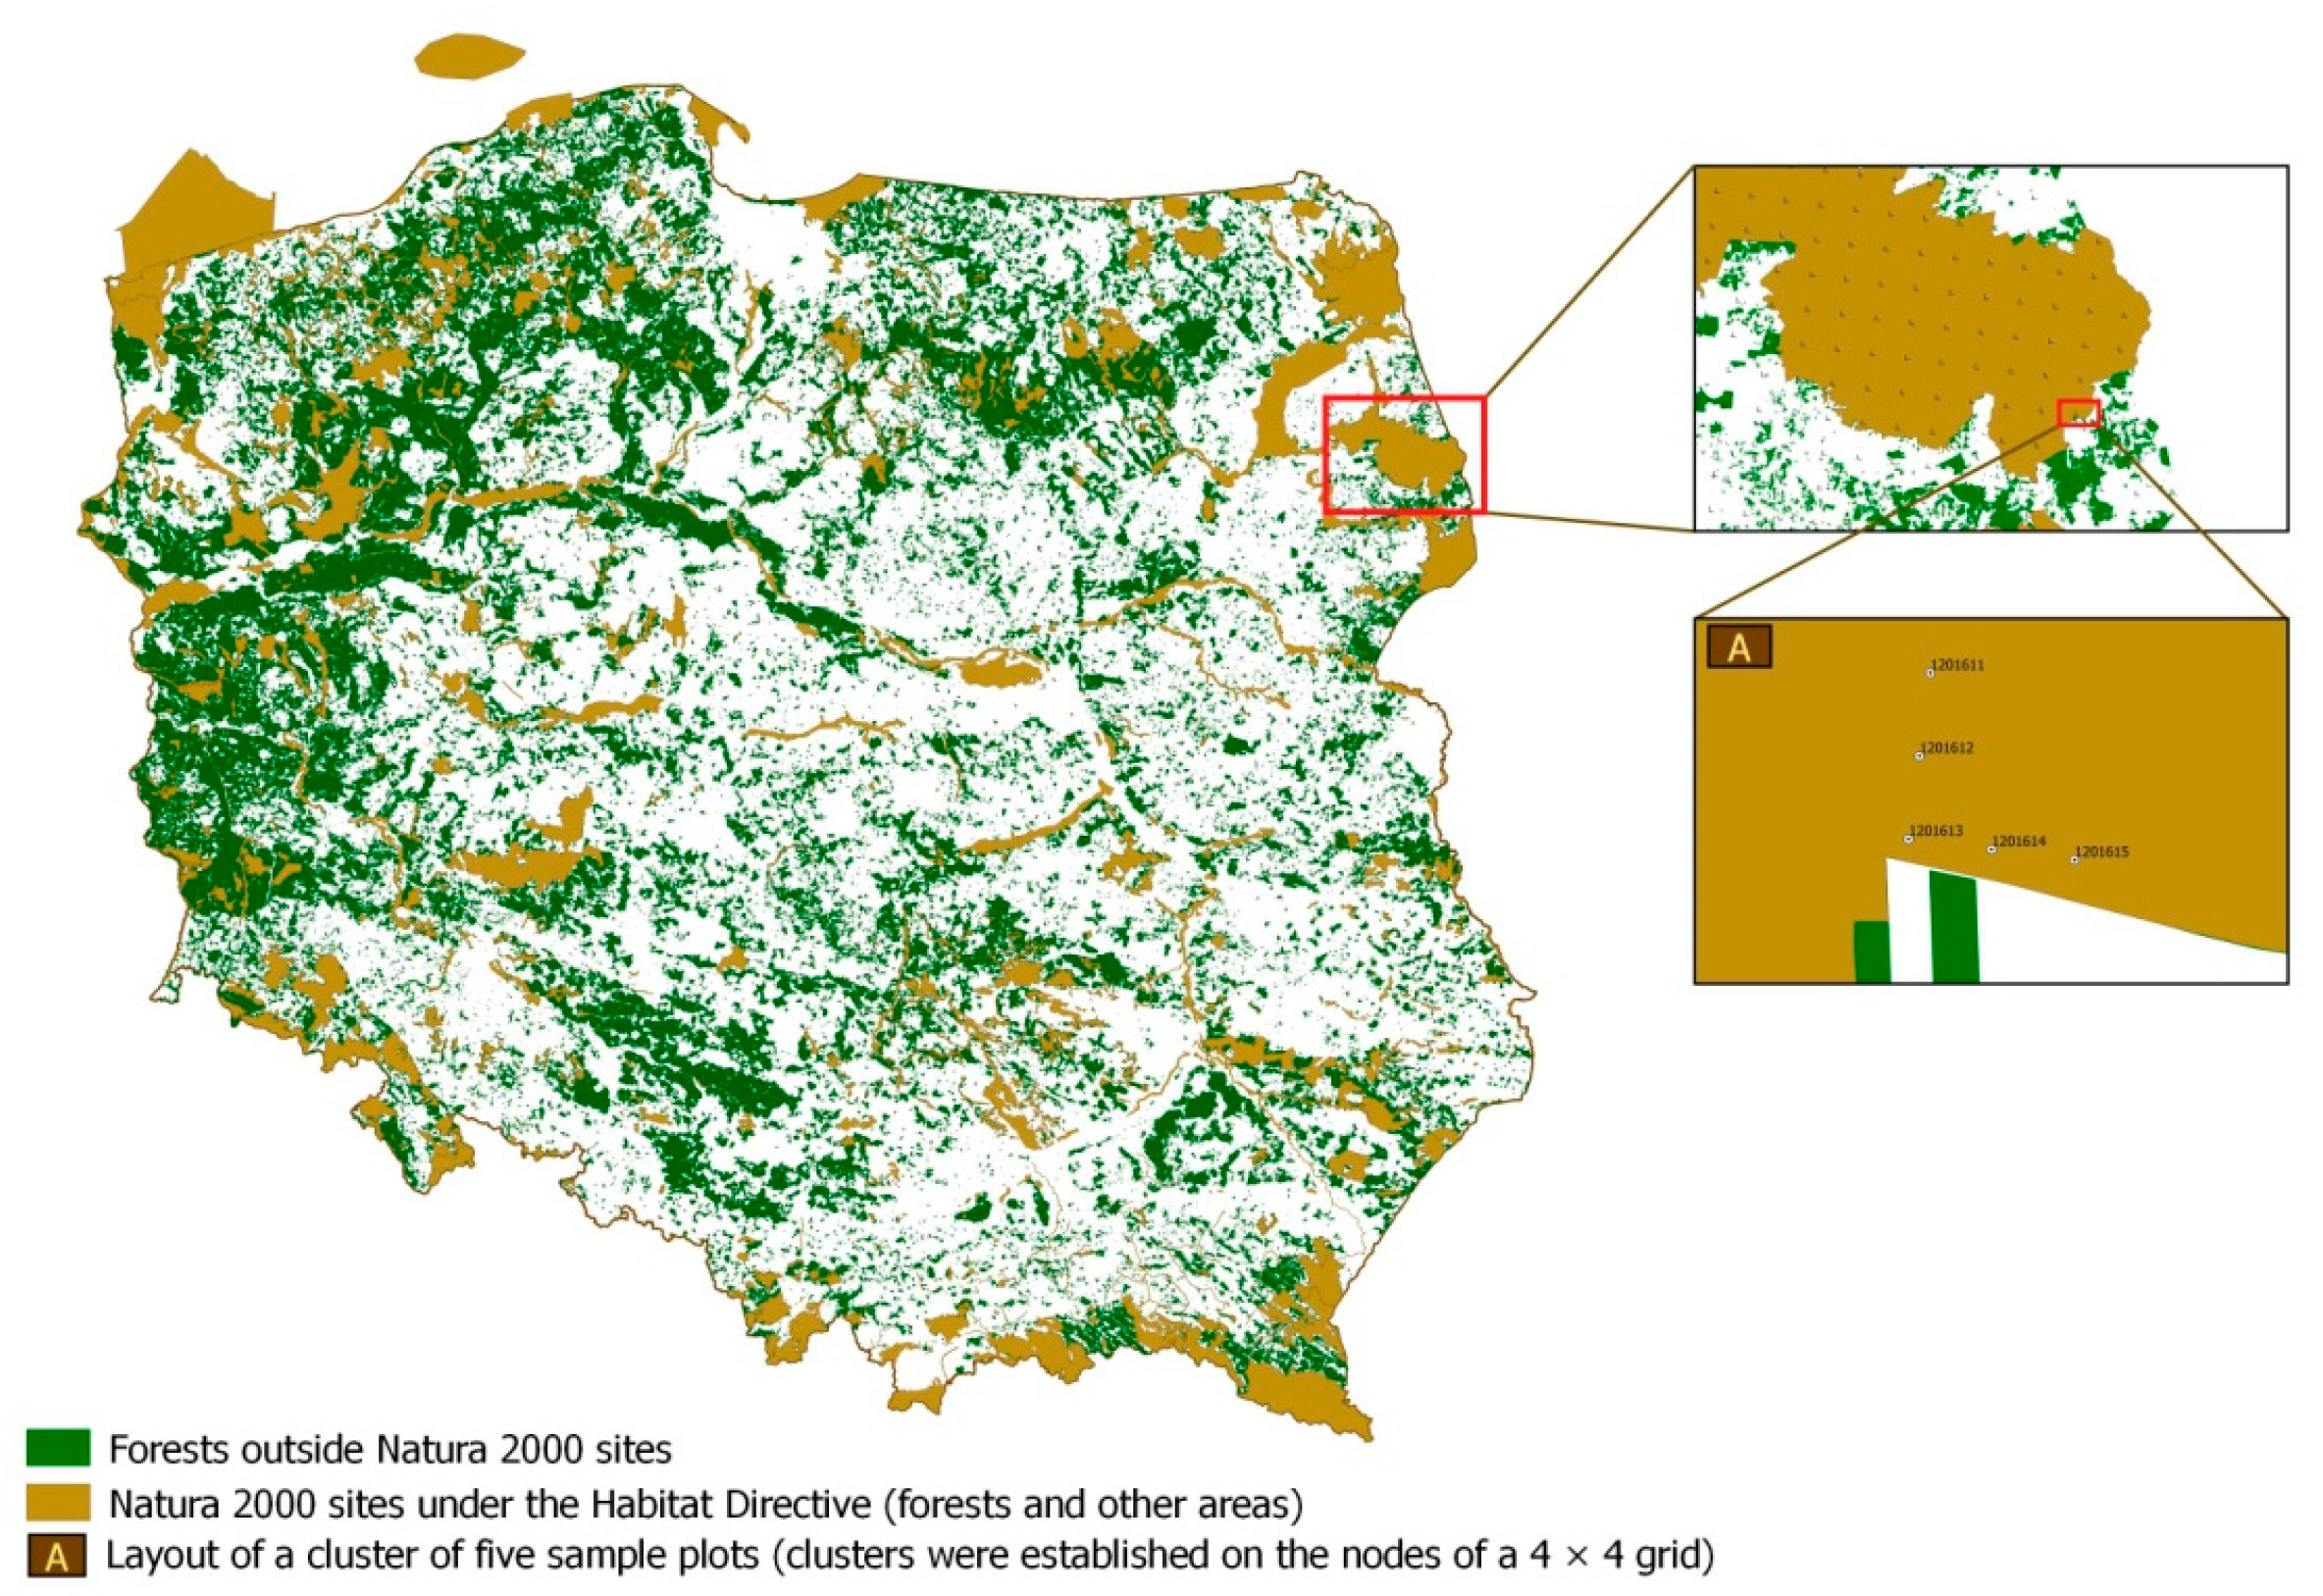
2. Materials and Methods
2.1. Data Collection
2.2. Data Analysis
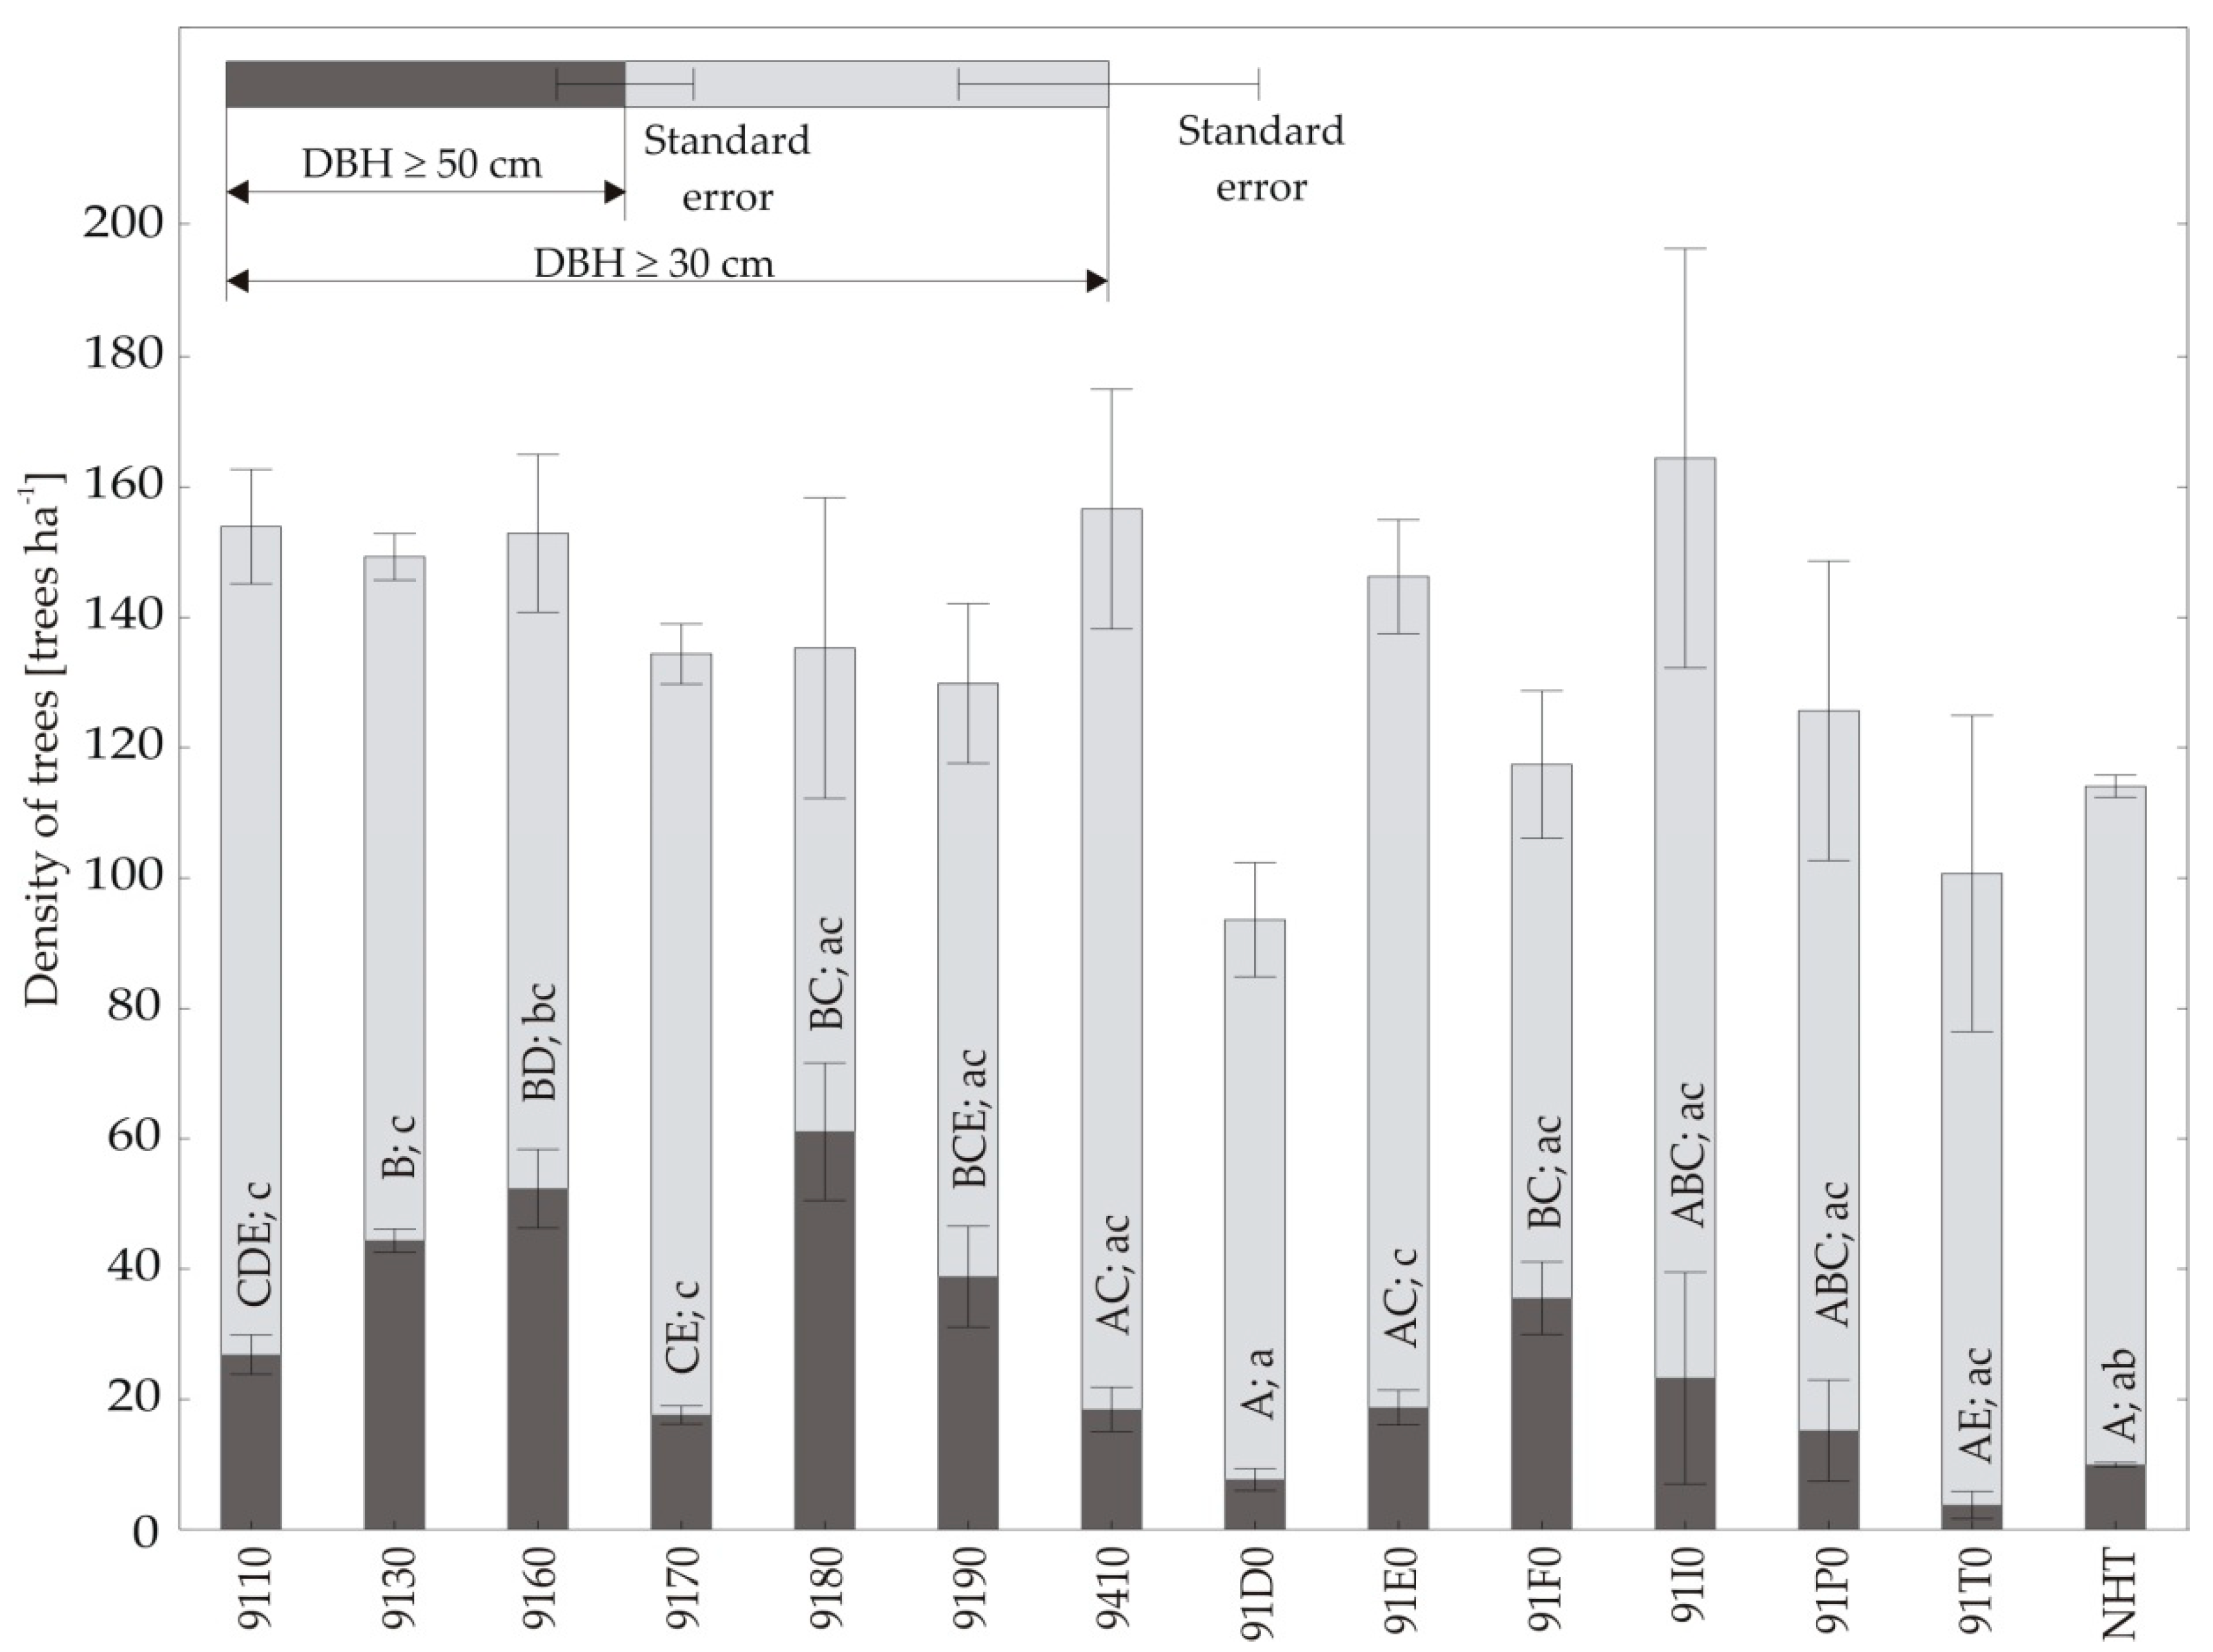
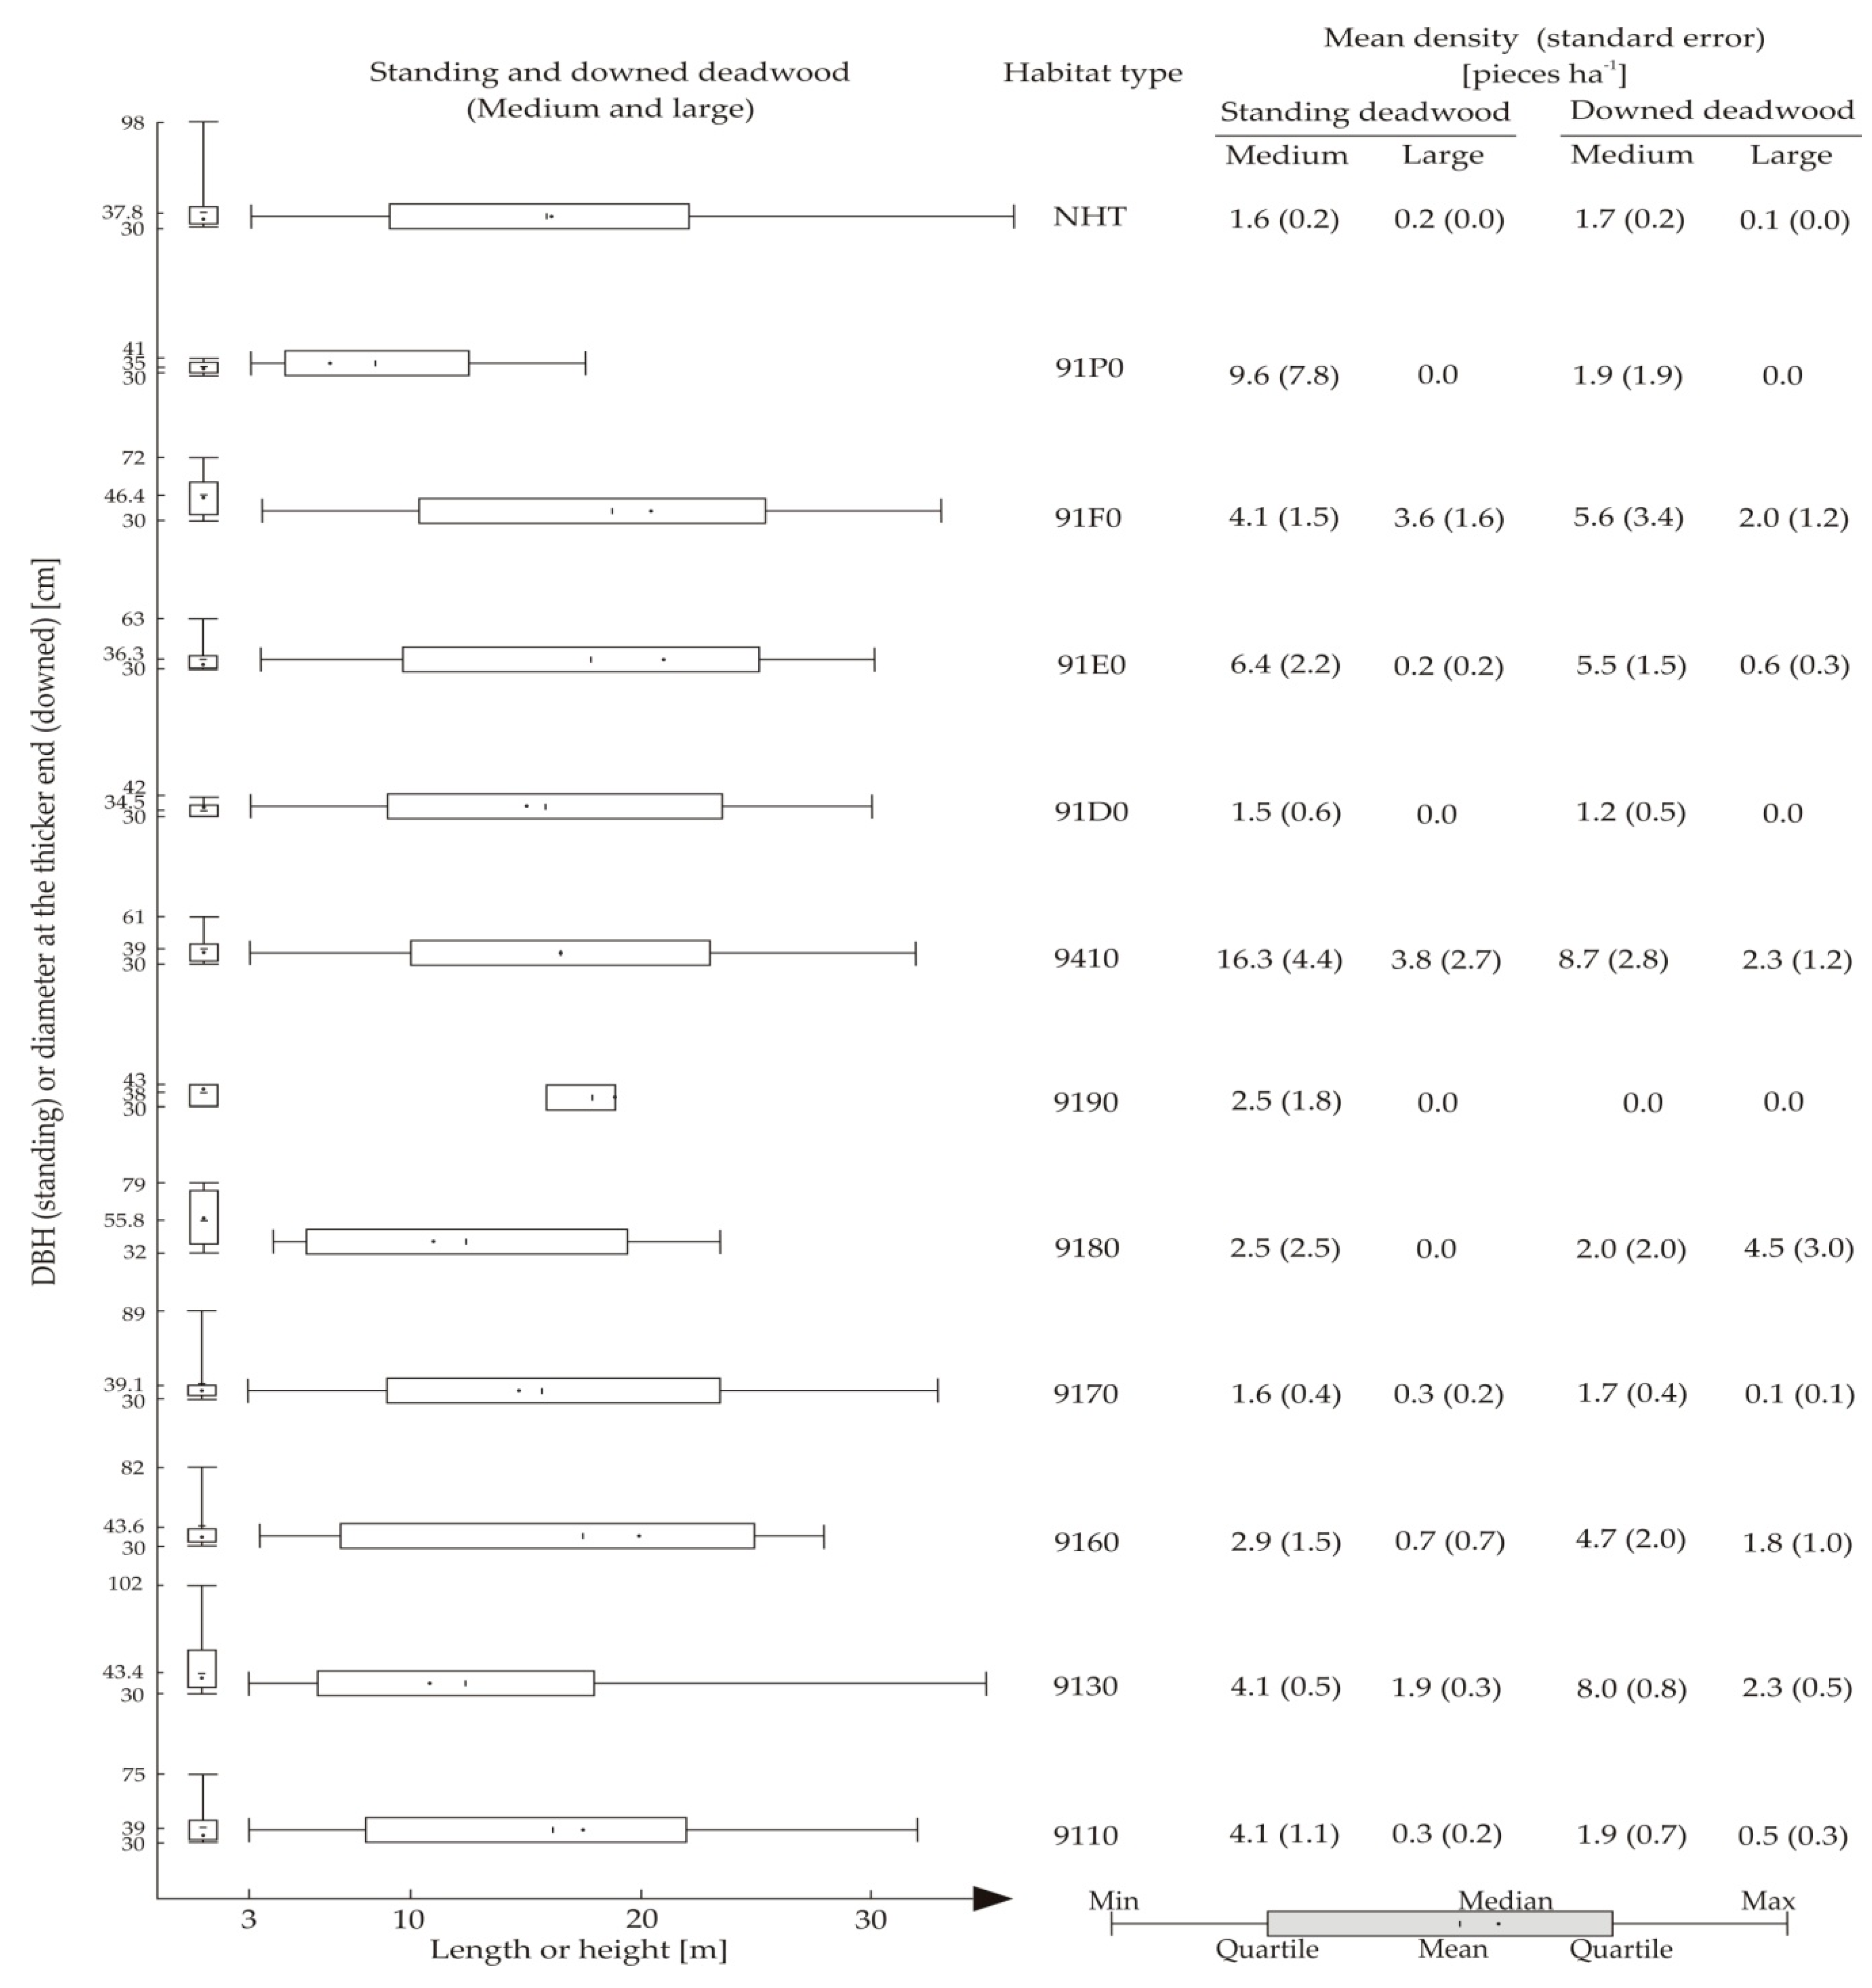
3. Results
4. Discussion and Conclusions
Author Contributions
Funding
Acknowledgments
Conflicts of Interest
References
- Pellegrino, D.; Schirpke, U.; Marino, D. How to support the effective management of Natura 2000 sites? J. Environ. Plan. Manag. 2017, 60, 383–398. [Google Scholar] [CrossRef]
- Rouillard, J.; Lago, M.; Abhold, K.; Röschel, L.; Kafyeke, T.; Mattheiß, V.; Klimmek, H. Protecting aquatic biodiversity in Europe: How much do EU environmental policies support ecosystem-based management? Ambio 2018, 47, 15–24. [Google Scholar] [CrossRef] [Green Version]
- Van der Sluis, T.; Bloemmen, M.; Bouwma, I.M. European Corridors: Strategies for Corridor Development for Target Species; ECNC: Tilburg, The Netherlands; Alterra: Wageningen, The Netherlands, 2004. [Google Scholar]
- Mézard, N.; Sundseth, K.; Wegefelt, S. Natura 2000 Protecting Europe’s Biodiversity; European Commission: Oxford, UK, 2008. [Google Scholar]
- Van der Sluis, T.; Foppen, R.; Gillings, S.; Groen, T.; Henkens, R.; Hennekens, S.; Huskens, K.; Noble, D.; Ottburg, F.; Santini, L.; et al. How much biodiversity is in Natura 2000? In The “Umbrella Effect” of the European Natura 2000 Protected Area Network; Alterra Report 2730B; European Union Wageningen, Alterra Wageningen UR: Wageningen, The Netherlands, 2016. [Google Scholar]
- The Birds Directive. Council Directive 79/409/EEC on the Conservation of Wild Birds (SPAs); The Birds Directive: Brussels, Belgium, 1979. [Google Scholar]
- The Habitats Directive. The Habitats Directive Establishing Natura 2000 and Requiring Member States to Designate Special Areas of Conservation (SACs); The Habitats Directive: Brussels, Belgium, 1992. [Google Scholar]
- Winkel, G.; Blondet, M.; Borrass, L.; Frei, T.; Geitzenauer, M.; Gruppe, A.; Jump, A.; De Koning, J.; Sotirov, M.; Weiss, G.; et al. The implementation of Natura 2000 in forests: A trans- and interdisciplinary assessment of challenges and choices. Environ. Sci. Policy 2015, 52, 23–32. [Google Scholar] [CrossRef]
- Wilk, T.; Jujka, M.; Krogulec, J.; Chylarecki, P. Important Bird Areas of International Importance in Poland; Ogólnopolskie Towarzystwo Ochrony Ptaków: Marki, Poland, 2010. [Google Scholar]
- Mróz, W. (Ed.) Monitoring Siedlisk Przyrodniczych: Przewodnik Metodyczny, Part IV; GIOŚ: Warsaw, Poland, 2015. [Google Scholar]
- Stokland, J.N.; Siitonen, J.; Jonsson, B.G. Biodiversity in Dead Wood; Cambridge University Press: Cambridge, UK, 2012. [Google Scholar]
- Lindenmayer, D.B.; Laurance, W.F. The ecology, distribution, conservation and management of large old trees. Biol. Rev. 2017, 92, 1434–1458. [Google Scholar] [CrossRef] [PubMed]
- Bütler, R.; Lachat, T.; Larrieu, L.; Paillet, Y. Habitat trees: Key elements for forest biodiversity. In Integrative Approaches as an Opportunity for the Conservation of Forest Biodiversity; European Forest Institute: Joensuu, Finland, 2013; p. 84. [Google Scholar]
- Horák, J.; Kout, J.; Vodka, Š.; Donato, D.C. Dead wood dependent organisms in one of the oldest protected forests of Europe: Investigating the contrasting effects of within-stand variation in a highly diversified environment. For. Ecol. Manag. 2016, 363, 229–236. [Google Scholar] [CrossRef]
- Biedermann, P.H.; Vega, F.E. Ecology and evolution of insect–fungus mutualisms. Annu. Rev. Entomol. 2020, 65. [Google Scholar] [CrossRef] [PubMed] [Green Version]
- Komonen, A.; Müller, J. Dispersal ecology of deadwood organisms and connectivity conservation. Conserv. Biol. 2018, 32, 535–545. [Google Scholar] [CrossRef] [PubMed]
- Müller, J.; Bütler, R.A. Review of habitat thresholds for dead wood: A baseline for management recommendations in European forests. Eur. J. Res. 2010, 129, 981–992. [Google Scholar] [CrossRef]
- Winter, S.; Borrass, L.; Geitzenauer, M.; Blondet, M.; Breibeck, R.; Weiss, G.; Winkel, G. The impact of Natura 2000 on forest management: A socio-ecological analysis in the continental region of the European Union. Biodivers. Conserv. 2014, 23, 3451–3482. [Google Scholar] [CrossRef]
- Alberdi, I.; Nunes, L.; Kovac, M.; Bonheme, I.; Cañellas, I.; Rego, F.C.; Dias, S.; Duarte, I.; Notarangelo, M.; Rizzo, M.; et al. The conservation status assessment of Natura 2000 forest habitats in Europe: Capabilities, potentials and challenges of national forest inventories data. Ann. Sci. 2019, 76, 34. [Google Scholar] [CrossRef] [Green Version]
- European Commission. The interpretation manual of European Union habitats. In Nature and Biodiversity; European Commission DG Environment: Brussels, Belgium, 2013. [Google Scholar]
- Talarczyk, A. National forest inventory in Poland. Balt. For. 2014, 20, 333–341. [Google Scholar]
- Ministry of the Environment. Instrukcja Wykonywania Wielkoobszarowej Inwentaryzacji Stanu Lasu; Ministry of the Environment: Warsaw, Poland, 2010. [Google Scholar]
- NFI. Wielkoobszarowa inwentaryzacja stanu lasu. In Wyniki za Okres 2009–2013; Biuro Urządzania Lasu i Geodezji Leśnej: Sekocin Stary, Poland, 2014. [Google Scholar]
- Central Register of Forms of Nature Conservation. Available online: http://crfop.gdos.gov.pl/CRFOP/ (accessed on 15 March 2020).
- Forest Data Bank. Available online: https://www.bdl.lasy.gov.pl/portal/ (accessed on 15 March 2020).
- Pawlaczyk, P.; Herbich, J.; Holeksa, J.; Szwagrzyk, J.; Świerkosz, K. Rozpoznawanie Siedlisk Przyrodniczych na Podstawie Danych Opisu Taksacyjnego Lasu. Manuscript. 2003. Available online: https://www.kp.org.pl/pdf/algorytmy_lesne_n2k.pdf (accessed on 15 March 2020).
- Mróz, W. (Ed.) Monitoring Siedlisk Przyrodniczych: Przewodnik Metodyczny, Part I; GIOŚ: Warsaw, Poland, 2010. [Google Scholar]
- Larose, D.T. Data Mining Methods and Models; Wydawnictwo Naukowe PWN: Warsaw, Poland, 2008. [Google Scholar]
- Mróz, W. (Ed.) Monitoring Siedlisk Przyrodniczych: Przewodnik Metodyczny, Part II; GIOŚ: Warsaw, Poland, 2012. [Google Scholar]
- Mróz, W. (Ed.) Monitoring Siedlisk Przyrodniczych: Przewodnik Metodyczny, Part III; GIOŚ: Warsaw, Poland, 2012. [Google Scholar]
- Stanisz, A. Przystępny Kurs Statystyki; StatSoft: Krakow, Poland, 2007. [Google Scholar]
- Menard, S. Applied Logistic Regression Analysis; Sage University Paper Series on Quantitative Applications in the Social Sciences 106; SAGE: Thousand Oaks, CA, USA, 2001. [Google Scholar]
- Campagnaro, T.; Trentanovi, G.; Sitzia, T. Identifying habitat type conservation priorities under the habitats directive: Application to two Italian biogeographical regions. Sustainability 2018, 10, 1189. [Google Scholar] [CrossRef] [Green Version]
- Rubio-Salcedo, M.; Martínez, I.; Carreno, F.; Escudero, A. Poor effectiveness of the Natura 2000 network protecting Mediterranean lichen species. J. Nat. Conserv. 2013, 21, 1–9. [Google Scholar] [CrossRef]
- EEA. European Forest Ecosystems. State and Trends, Report 5; European Environment Agency: Luxembourg, 2016. [Google Scholar]
- Haase, V.; Topp, W.; Zach, P. Eichen-Totholz im Wirtschaftswald als Lebensraum für xylobionte Insekten. Zeitschrift für Ökologie und Naturschutz 1998, 7, 137–153. [Google Scholar]
- Kraus, D.; Krumm, F. (Eds.) Integrative Approaches as an Opportunity for the Conservation of Forest Biodiversity; European Forest Institute: Joensuu, Finland, 2013; p. 284. [Google Scholar]
- Andringa, J.I.; Zuo, J.; Berg, M.P.; Klein, R.; van Veer, J.; de Geus, R.; Beaumont, M.; Goudzwaard, G.; Hal, J.; Broekman, R.; et al. Combining tree species and decay stages to increase invertebrate diversity in dead wood. For. Ecol. Manag. 2019, 441, 80–88. [Google Scholar] [CrossRef]
- Venier, L.A.; Hébert, C.; De Grandpré, L.; Arsenault, A.; Walton, R.; Morris, D.M. Modelling deadwood supply for biodiversity conservation: Considerations, challenges and recommendations. For. Chron. 2015, 91, 407–416. [Google Scholar] [CrossRef]
- Keren, S.; Diaci, J. Comparing the quantity and structure of deadwood in selection managed and old-growth forests in South-East Europe. Forests 2018, 9, 76. [Google Scholar] [CrossRef] [Green Version]
- Vlad, R.; Sidor, C.G.; Dinca, L.; Constandache, C.; Grigoroaea, D.; Ispravnic, A.; Pei, G. Dead wood diversity in a Norway spruce forest from the Calimani National Park (Eastern Carpathians). Balt For. 2019, 25, 238–248. [Google Scholar]
- Kara, F.; Lhotka, J.M. Comparison of unmanaged and managed Trojan Fir-Scots pine forests for structural complexity. Turk. J. Agric. 2020, 44, 62–70. [Google Scholar] [CrossRef]
- Burger, J.A. Management effects on growth, production and sustainability of managed forest ecosystems: Past trends and future directions. For. Ecol. Manag. 2009, 258, 2335–2346. [Google Scholar] [CrossRef]
- Paletto, A.; De Meo, I.; Cantiani, P.; Ferretti, F. Effects of forest management on the amount of deadwood in Mediterranean oak ecosystems. Ann. Sci. 2014, 71, 791–800. [Google Scholar] [CrossRef]
- Joelsson, K.; Hjältén, J.; Gibb, H. Forest management strategy affects saproxylic beetle assemblages: A comparison of even and uneven-aged silviculture using direct and indirect sampling. PLoS ONE 2018, 13, e0194905. [Google Scholar] [CrossRef] [Green Version]
- Koivula, M.; Vanha-Majamaa, I. Experimental evidence on biodiversity impacts of variable retention forestry, prescribed burning, and deadwood manipulation in Fennoscandia. Ecol. Process. 2020, 9, 11. [Google Scholar] [CrossRef] [Green Version]
- Babiak, T.; Bajerowski, W.; Cieśla, A.; Kolada, A.; Gawryś, R.; Korzeniak, J.; Kowalczyk, T.; Lewczuk, M.; Małecki, B.; Parkoła, R.; et al. Typy siedlisk przyrodniczych. In Monitoring Siedlisk Przyrodniczych Oraz Gatunkow Roślin i Zwierząt w Latach 2017–2018. Biuletyn Monitoringu Przyrody; Cieśla, A., Mionskowski, M., Kornatowska, B., Müller, I., Zajączkowska, M., Eds.; Biblioteka Monitoringu Środowiska GIOŚ: Warsaw, Poland, 2018; Volume 19, pp. 1–187. [Google Scholar]
- Perzanowska, J.; Korzeniak, J.; Chmura, D. Alien species as a potential threat for Natura 2000 habitats: A national survey. Biodivers. Conserv. 2019, 11, e8032. [Google Scholar] [CrossRef] [Green Version]
- Kocel, J.; Kwiecień, R.; Młynarski, W.; Mionskowski, M. Wskaźnik stopnia trudności gospodarowania leśnictw Lasów Państwowych. Sylwan 2012, 156, 403–413. [Google Scholar]
- Angelstam, P.; Mikusiński, G.; Fridman, J. Natural forest remnants and transport infrastructure: Does history matter for biodiversity conservation planning? Ecol. Bull. 2004, 51, 149–162. [Google Scholar]
- Sefidi, K.; Darabad, F.E.; Azaryan, M. Effect of topography on tree species composition and volume of coarse woody debris in an Oriental beech (Fagus orientalis Lipsky) old growth forests, northern Iran. iFor. Biogeosci. For. 2016, 9, 658. [Google Scholar] [CrossRef]
- Kapusta, P.; Kurek, P.; Piechnik, Ł.; Szarek-Łukaszewska, G.; Zielonka, T.; Żywiec, M.; Holeksa, J. Natural and human-related determinants of dead wood quantity and quality in a managed European lowland temperate forest. For. Ecol. Manag. 2020, 459, 117845. [Google Scholar] [CrossRef]
- Holtmeier, F.K.; Broll, G. Subalpine forest and treeline ecotone under the influence of disturbances: A review. J. Environ. Prot. 2018, 9, 815. [Google Scholar] [CrossRef] [Green Version]
- Thom, D.; Seidl, R. Natural disturbance impacts on ecosystem services and biodiversity in temperate and boreal forests. Biol. Rev. 2016, 91, 760–781. [Google Scholar] [CrossRef]
- Bujoczek, M.; Rybicka, J.; Bujoczek, L. Effects of disturbances in a subalpine forest on its structural indicators and bird diversity. Ecol. Ind. 2020, 112, 106126. [Google Scholar] [CrossRef]
- Kowalski, T. Chalara fraxinea sp. nov. associated with dieback of ash (Fraxinus excelsior) in Poland. For. Pathol. 2006, 36, 264–270. [Google Scholar] [CrossRef]
- Błońska, E.; Lasota, J.; Piaszczyk, W. Carbon and nitrogen stock in deadwood biomass in natural temperate forest along a soil moisture gradient. Plant Biosyst. Int. J. Deal. Asp. Plant Biol. 2019, 154, 213–221. [Google Scholar] [CrossRef]
- Piaszczyk, W.; Błońska, E.; Lasota, J. Soil biochemical properties and stabilisation of soil organic matter in relation to deadwood of different species. FEMS Microbiol. Ecol. 2019, 95, fiz011. [Google Scholar]
- Přívětivý, T.; Janík, D.; Unar, P.; Adam, D.; Král, K.; Vrška, T. How do environmental conditions affect the deadwood decomposition of European beech (Fagus sylvatica L.)? For. Ecol. Manag. 2016, 381, 177–187. [Google Scholar] [CrossRef]
- Seibold, S.; Bässler, C.; Baldrian, P.; Reinhard, L.; Thorn, S.; Ulyshen, M.D.; Weiß, I.; Müller, J. Dead-wood addition promotes nonsaproxylic epigeal arthropods but effects are mediated by canopy openness. Biol. Conserv. 2016, 204, 181–188. [Google Scholar] [CrossRef]
- Seibold, S.; Bässler, C.; Brandl, R.; Büche, B.; Szallies, A.; Thorn, S.; Ulyshen, M.D.; Müller, J. Microclimate and habitat heterogeneity as the major drivers of beetle diversity in dead wood. J. Appl. Ecol. 2016, 53, 934–943. [Google Scholar] [CrossRef] [Green Version]


| Annex I Code | Habitat Type | Number of Sample Plots |
|---|---|---|
| 9110 | Luzulo-Fagetum beech forests | 133 |
| 9130 | Asperulo-Fagetum beech forests | 566 |
| 9140 1 | Medio-European subalpine beech woods with Acer and Rumex arifolius | 4 |
| 9160 | Sub-Atlantic and medio-European oak or oak-hornbeam forests of the Carpinion betuli | 52 |
| 9170 | Galio-Carpinetum oak-hornbeam forests | 399 |
| 9180 * | Tilio-Acerion forests of slopes, screes and ravines | 10 |
| 9190 | Old acidophilous oak woods with Quercus robur on sandy plains | 31 |
| 9410 | Acidophilous Picea forests of the montane to alpine levels (Vaccinio-Piceetea) | 58 |
| 9420 | Alpine Larix decidua and/or Pinus cembra forests | 0 |
| 91D0 * | Bog woodland | 143 |
| 91E0 * | Alluvial forests with Alnus glutinosa and Fraxinus excelsior (Alno-Padion, Alnion incanae, Salicion albae) | 132 |
| 91F0 | Riparian mixed forests of Quercus robur, Ulmus laevis and Ulmus minor, Fraxinus excelsior or Fraxinus angustifolia, along the great rivers (Ulmenion minoris) | 49 |
| 91I0 * | Euro-Siberian steppic woods with Quercus spp. | 7 |
| 91P0 | Holy Cross fir forest (Abietetum polonicum) | 13 |
| 91T0 | Central European lichen Scots pine forests | 23 |
| Habitat Types | Parameter/Indicator | |||||
|---|---|---|---|---|---|---|
| Deadwood (Overall Volume) | Standing or Downed Deadwood ≥3 m Long and ≥50 cm in Diameter 1 | |||||
| Conservation Status of the Habitat | ||||||
| Favorable FV | Unfavorable–Inadequate U1 | Unfavorable–Bad U2 | Favorable FV | Unfavorable–Inadequate U1 | Unfavorable–Bad U2 | |
| (m3 ha–1) | (pieces ha–1) | |||||
| 9110 | >20 | 10–20 | <10 | >5 | 3–5 | <3 |
| 9130 | >20 | 10–20 | <10 | >5 | 3–5 | <3 |
| 9140 | d.n.a.5 | d.n.a. | d.n.a. | d.n.a. | d.n.a. | d.n.a. |
| 9160 | >20 | 10–20 | <10 | >5 | 3–5 | <3 |
| 9170 | >20 | 10–20 | <10 | >5 | 3–5 | <3 |
| 9180 | d.n.a. | d.n.a. | d.n.a. | d.n.a. | d.n.a. | d.n.a. |
| 9190 | >20 | 10–20 | <10 | >5 | 3–5 | <3 |
| 9410 | >20 | 10–20 | <10 | >5 | 3–5 | <3 |
| 91D0 | d.n.a. | d.n.a. | d.n.a. | >3 2 | 1–3 2 | <1 2 |
| 91E0 | >20 | 10–20 | <10 | >5 1 | 3–5 1 | <3 1 |
| 91F0 | >20 | 10–20 | <10 | >5 | 3–5 | <3 |
| 91I0 | <5% 3 | 5–20% 3 | > 50% 3 | d.n.a. | d.n.a. | d.n.a. |
| 91P0 | >10% 4 | 3–10% 4 | <3% 4 | d.n.a. | d.n.a. | d.n.a. |
| 91T0 | None | A small amount due to natural processes | Large amount, e.g., heaps of branches | d.n.a. | d.n.a. | d.n.a. |
| Habitat Type | Deadwood Volume (Standard Error) (m3 ha−1) * | Living Trees Volume (Standard Error) (m3 ha−1) * | Deadwood Volume to Living Trees Volume Ratio (%) |
|---|---|---|---|
| 9110 | 13.9 (2.9) bc | 373 (18.8) BD | 3.7 |
| 9130 | 28.4 (2.3) a | 434 (10.4) B | 6.5 |
| 9160 | 21.5 (9.3) c | 478 (38.2) BE | 4.5 |
| 9170 | 9.3 (1.5) c | 327 (9.2) D | 2.8 |
| 9180 | 25.2 (12.0) ac | 439 (79.8) ABD | 5.8 |
| 9190 | 4.4 (2.1) c | 407 (45.9) BCD | 1.1 |
| 9410 | 55.4 (13.4) a | 326 (32.6) ADE | 17.0 |
| 91D0 | 8.6 (1.5) bc | 238 (14.9) A | 3.6 |
| 91E0 | 25.1 (3.7) ab | 335 (16.3) CDE | 7.5 |
| 91F0 | 43.1 (12.5) ac | 378 (36.0) BCD | 11.4 |
| 91I0 | 7.9 (6.7) ac | 335 (63.9) ABD | 2.4 |
| 91P0 | 15.4 (9.9) ac | 306 (50.8) ABD | 5.0 |
| 91T0 | 2.5 (1.2) c | 282 (26.7) ABD | 0.9 |
| NHT | 9.4 (0.5) c | 279 (2.9) AC | 3.4 |
| Independent Variable 1 | β (Standard Error) | Wald’s Chi-Square | Odds Ratio (95% Confidence Interval) | p * |
|---|---|---|---|---|
| Elevation (m a.s.l.) | 0.003 (0.000) | 328.052 | 1.003 (1.003−1.004) | <0.001 |
| Age (year) | 0.008 (0.001) | 33.569 | 1.008 (1.006−1.011) | <0.001 |
| Living trees volume (m3 ha−1) | 0.001 (0.000) | 7.108 | 1.001 (1.000−1.001) | 0.008 |
| Protection (management) type | 73.002 | <0.001 | ||
| Managed forests | Reference | |||
| Active protection | 0.860 (0.111) | 60.058 | 2.363 (1.901–2.937) | <0.001 |
| Strict protection | 0.865 (0.185) | 21.948 | 2.376 (1.654−3.413) | <0.001 |
| Fertility | 46.342 | <0.001 | ||
| DYSTROPHIC | Reference | |||
| OLIGOTROPHIC | 0.623 (0.224) | 7.721 | 1.864 (1.201−2.893) | 0.005 |
| MESOTROPHIC | 0.924 (0.212) | 18.902 | 2.519 (1.661−3.820) | <0.001 |
| EUTROPHIC | 1.261 (0.212) | 35.368 | 3.528 (2.328−5.345) | <0.001 |
| Moisture | 65.228 | <0.001 | ||
| MESIC | Reference | |||
| MOIST | 0.657 (0.132) | 24.649 | 1.929 (1.488−2.501) | <0.001 |
| BOGGY | 1.320 (0.178) | 55.167 | 3.742 (2.641−5.300) | <0.001 |
| Habitat type | 27.431 | 0.011 | ||
| 91T0 | Reference | |||
| 9110 | −0.760 (1.084) | 0.492 | 0.467 (0.056−3.911) | 0.483 |
| 9130 | −0.526 (1.061) | 0.246 | 0.591 (0.074−4.728) | 0.620 |
| 9160 | 0.187 (1.126) | 0.028 | 1.206 (0.133−10.962) | 0.868 |
| 9170 | −0.077 (1.065) | 0.005 | 0.926 (0.115−7.463) | 0.943 |
| 9180 | 0.232 (1.277) | 0.033 | 1.261 (0.103−15.416) | 0.856 |
| 9190 | −1.817 (1.468) | 1.533 | 0.163 (0.009−2.885) | 0.216 |
| 9410 | −0.308 (1.095) | 0.079 | 0.735 (0.086−6.292) | 0.779 |
| 91D0 | −0.237 (1.088) | 0.047 | 0.789 (0.094−6.661) | 0.828 |
| 91E0 | 0.381 (1.077) | 0.125 | 1.464 (0.177−12.089) | 0.723 |
| 91F0 | 0.325 (1.111) | 0.086 | 1.385 (0.157−12.223) | 0.770 |
| 91I0 | −1.025 (1.552) | 0.436 | 0.359 (0.017−7.514) | 0.509 |
| 91P0 | −0.568 (1.338) | 0.180 | 0.567 (0.041−7.802) | 0.671 |
| NHT | −0.066 (1.053) | 0.004 | 0.936 (0.119−7.366) | 0.950 |
| Constant term | −4.721 (1.041) | 20.574 | 0.009 (0.001−0.069) | <0.001 |
© 2020 by the authors. Licensee MDPI, Basel, Switzerland. This article is an open access article distributed under the terms and conditions of the Creative Commons Attribution (CC BY) license (http://creativecommons.org/licenses/by/4.0/).
Share and Cite
Bujoczek, L.; Zięba, S.; Bujoczek, M. Variation in Deadwood Microsites in Areas Designated under the Habitats Directive (Natura 2000). Forests 2020, 11, 486. https://doi.org/10.3390/f11050486
Bujoczek L, Zięba S, Bujoczek M. Variation in Deadwood Microsites in Areas Designated under the Habitats Directive (Natura 2000). Forests. 2020; 11(5):486. https://doi.org/10.3390/f11050486
Chicago/Turabian StyleBujoczek, Leszek, Stanisław Zięba, and Małgorzata Bujoczek. 2020. "Variation in Deadwood Microsites in Areas Designated under the Habitats Directive (Natura 2000)" Forests 11, no. 5: 486. https://doi.org/10.3390/f11050486