Horizontal and Vertical Distributions of Heartwood for Teak Plantation


Abstract
:1. Introduction
2. Materials and Methods
2.1. Experimental Site
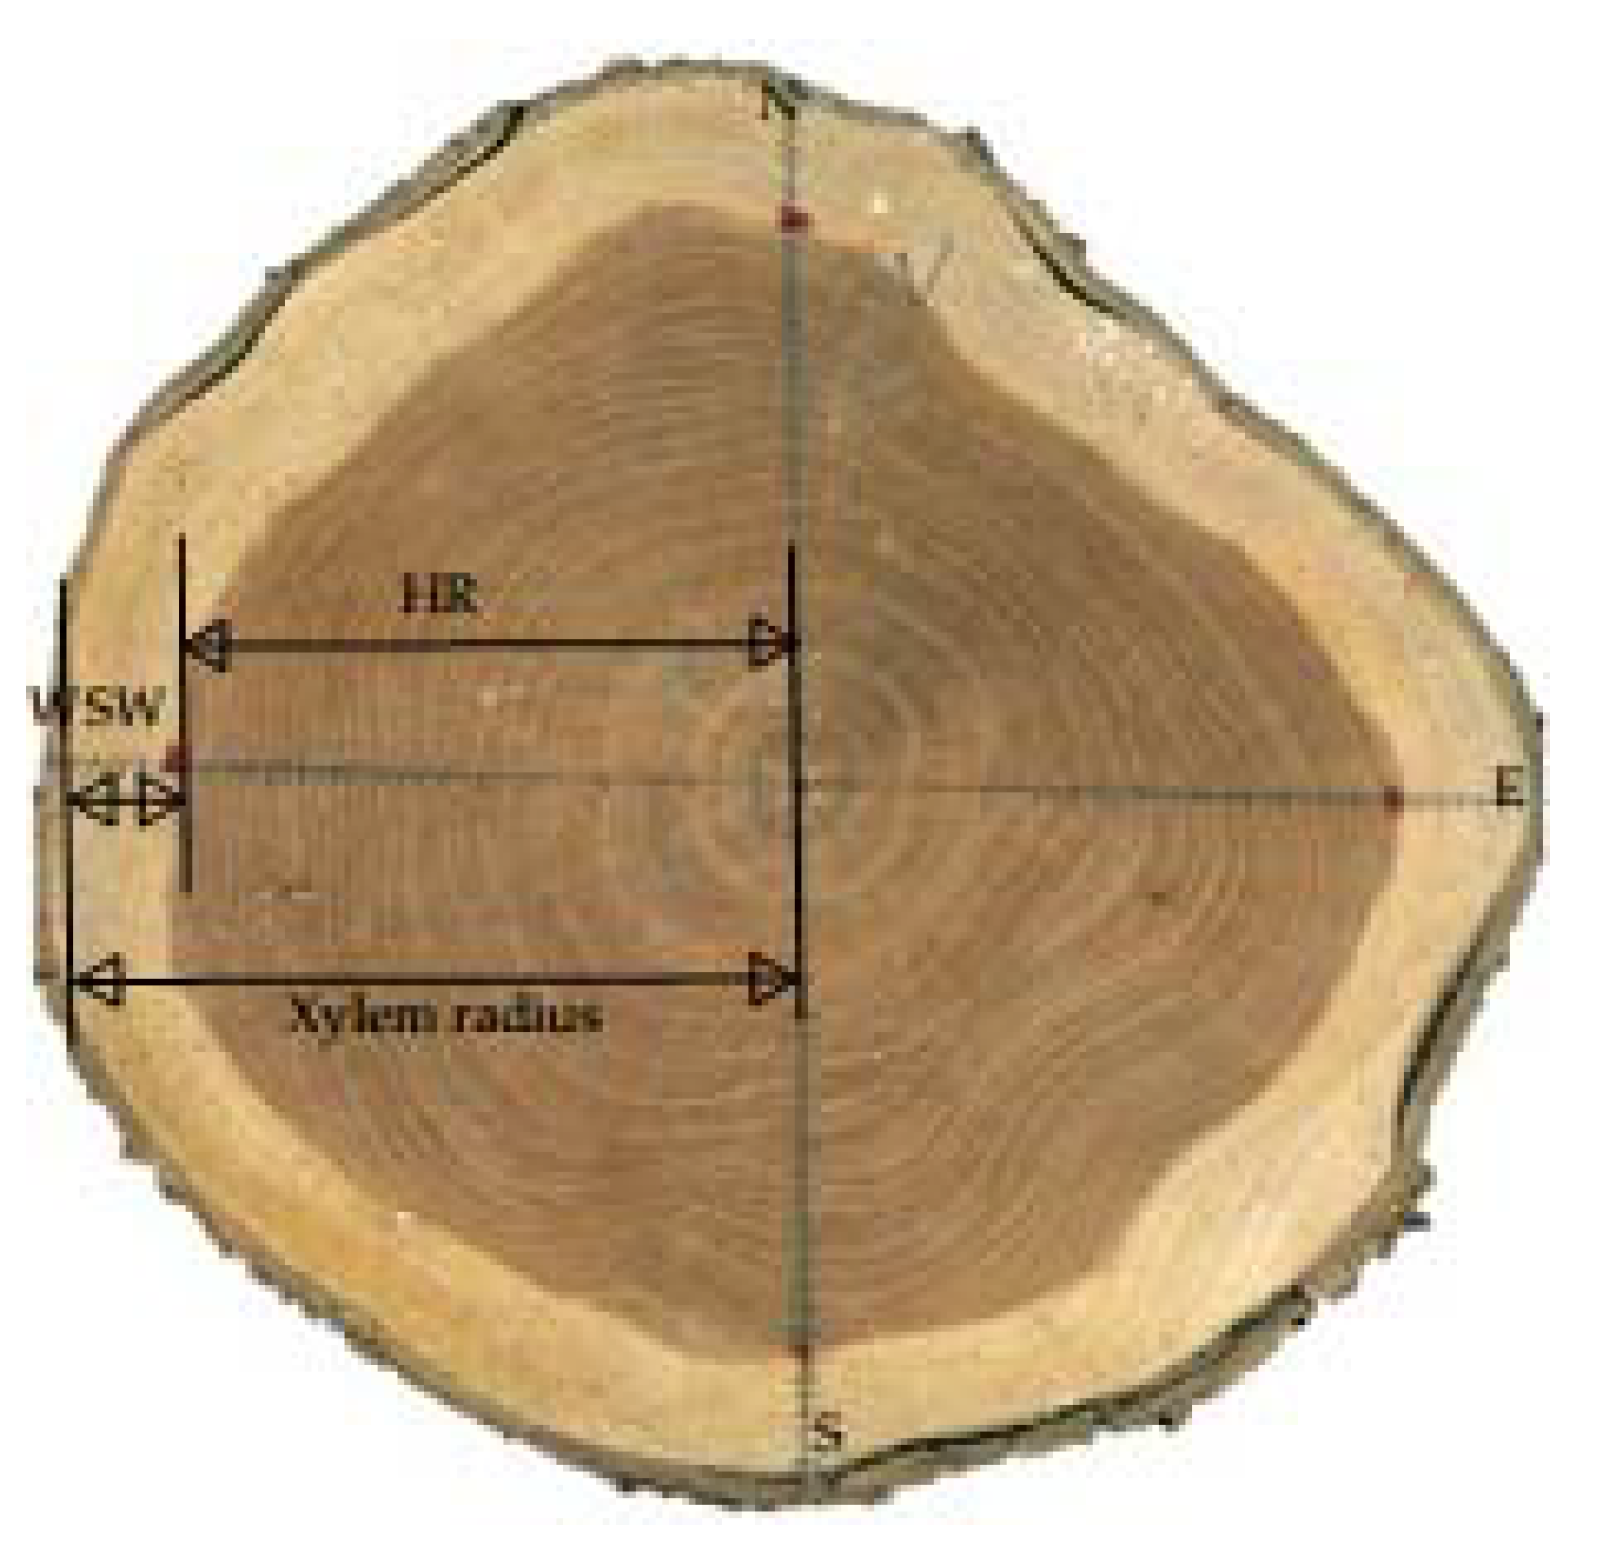
2.2. Sampling and Measurement
2.3. Stem Analysis
2.4. Data Analysis
3. Results
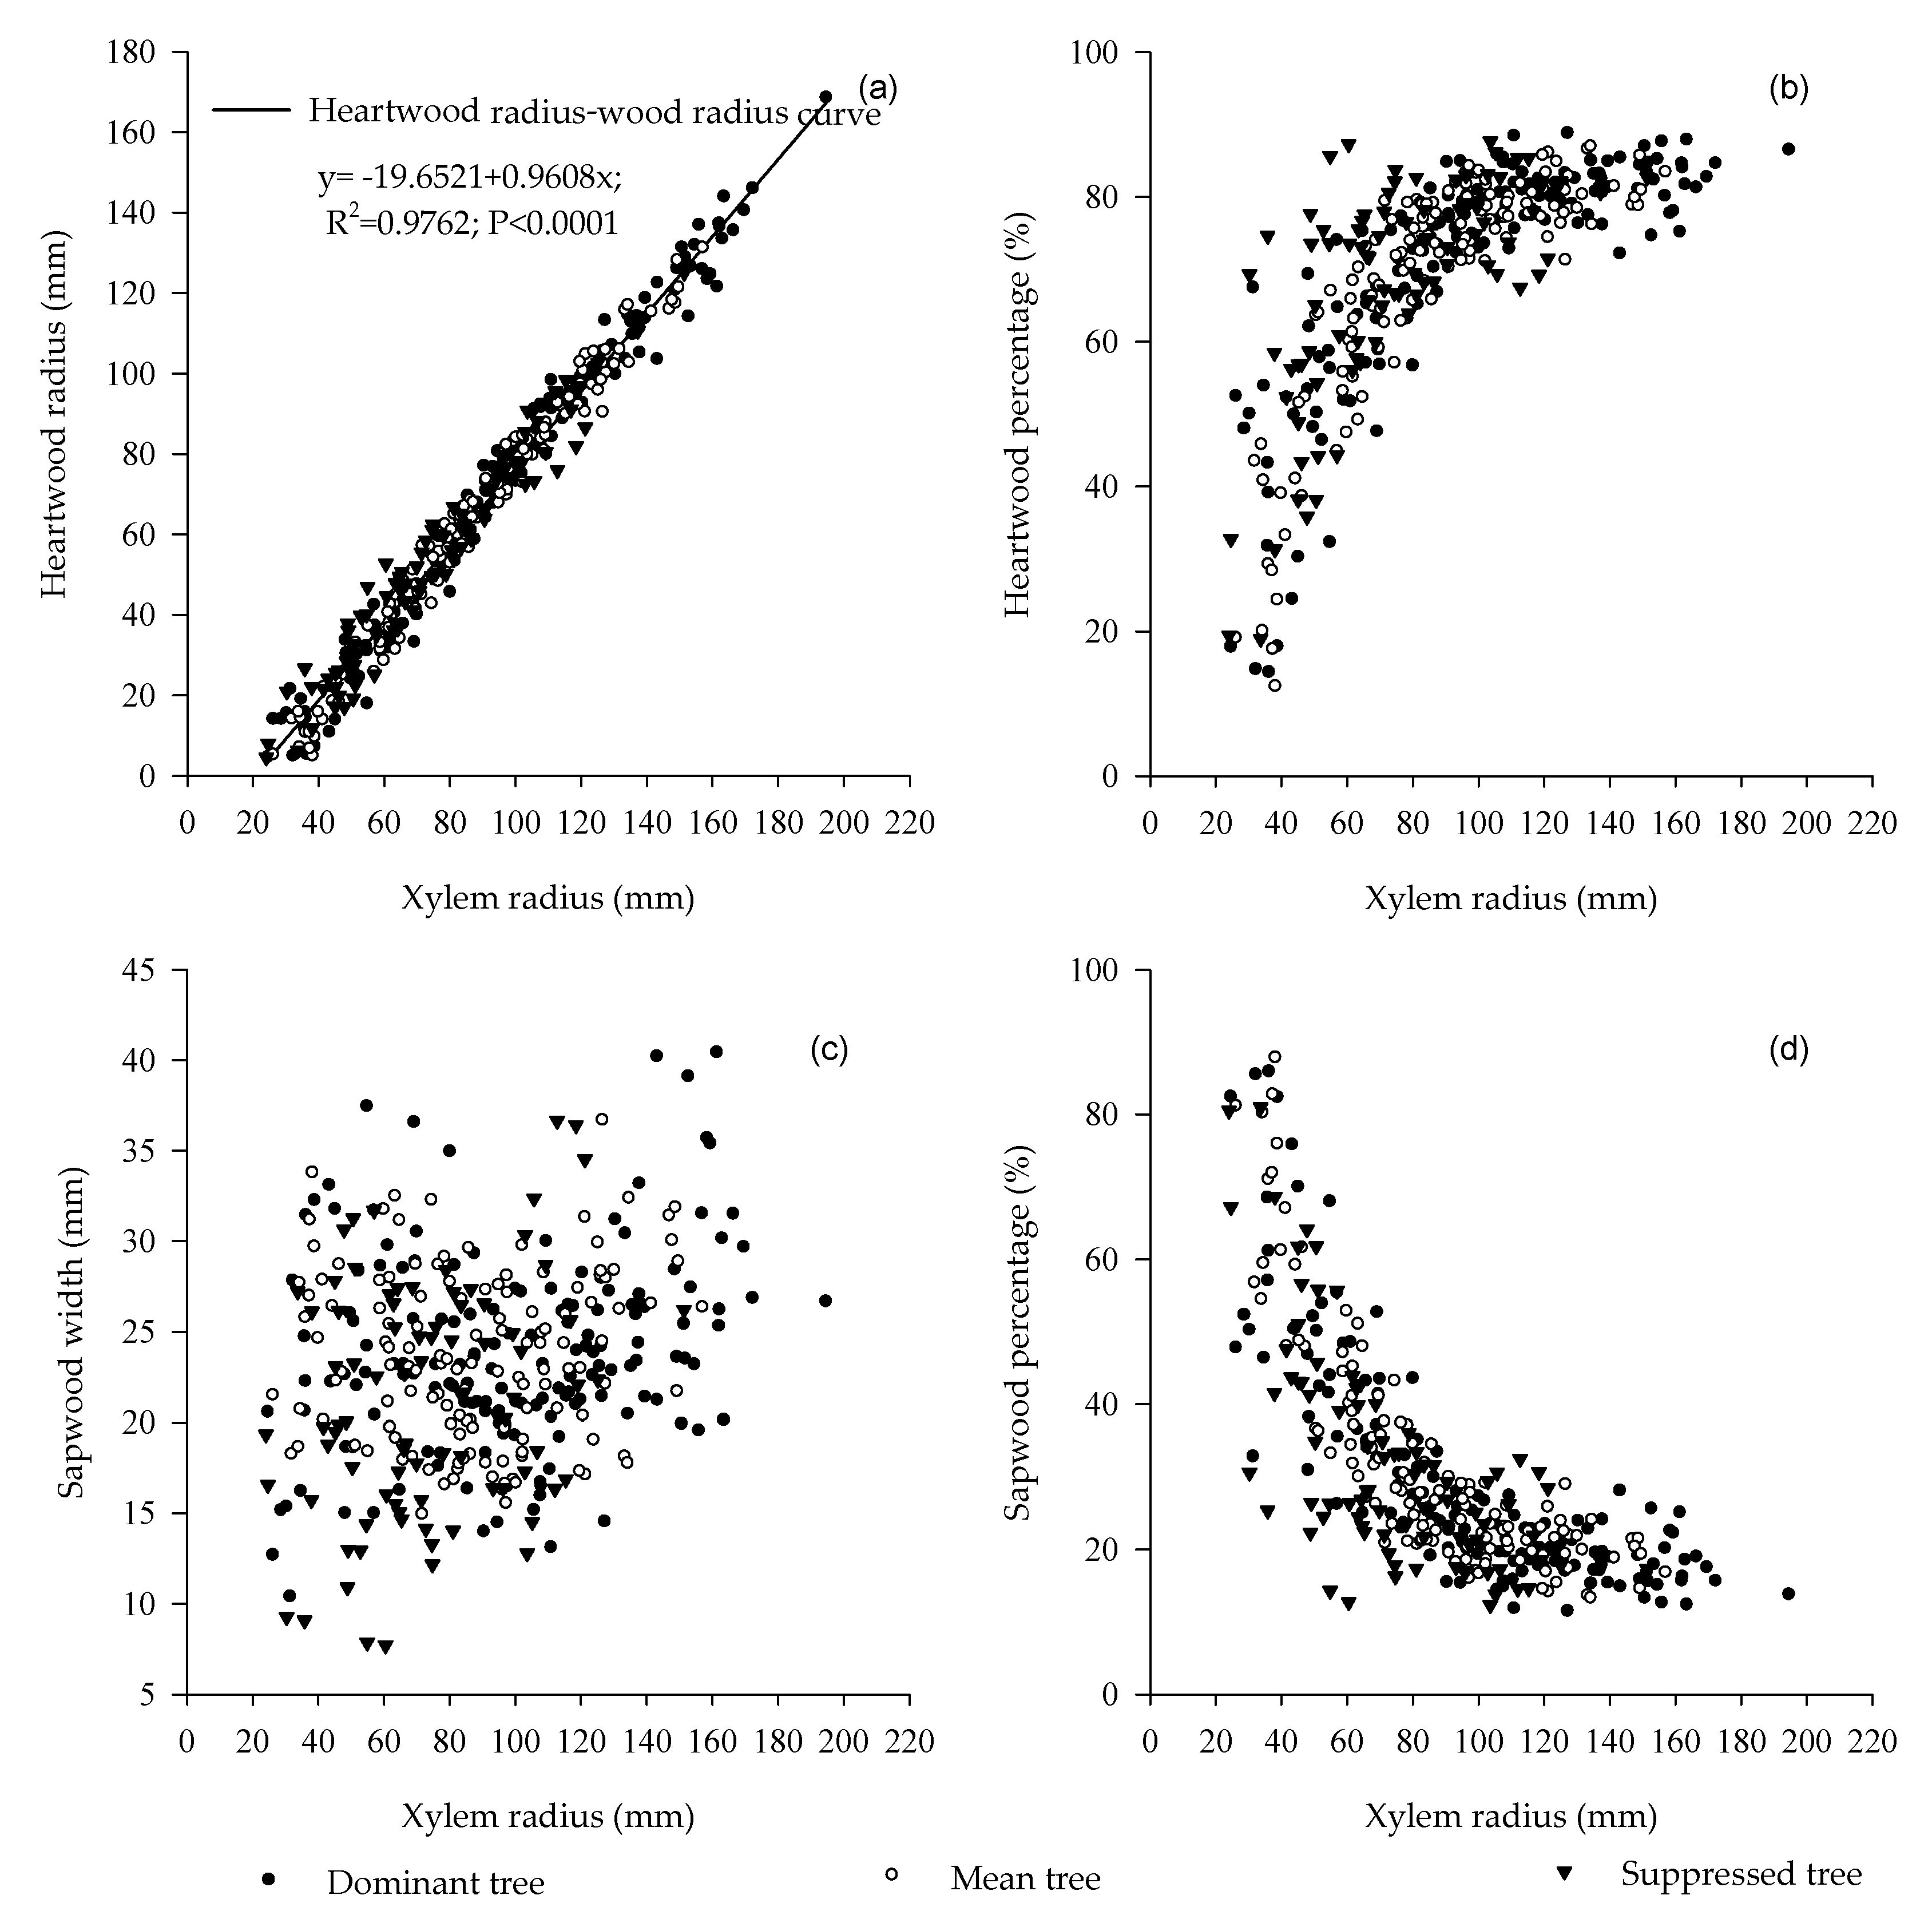
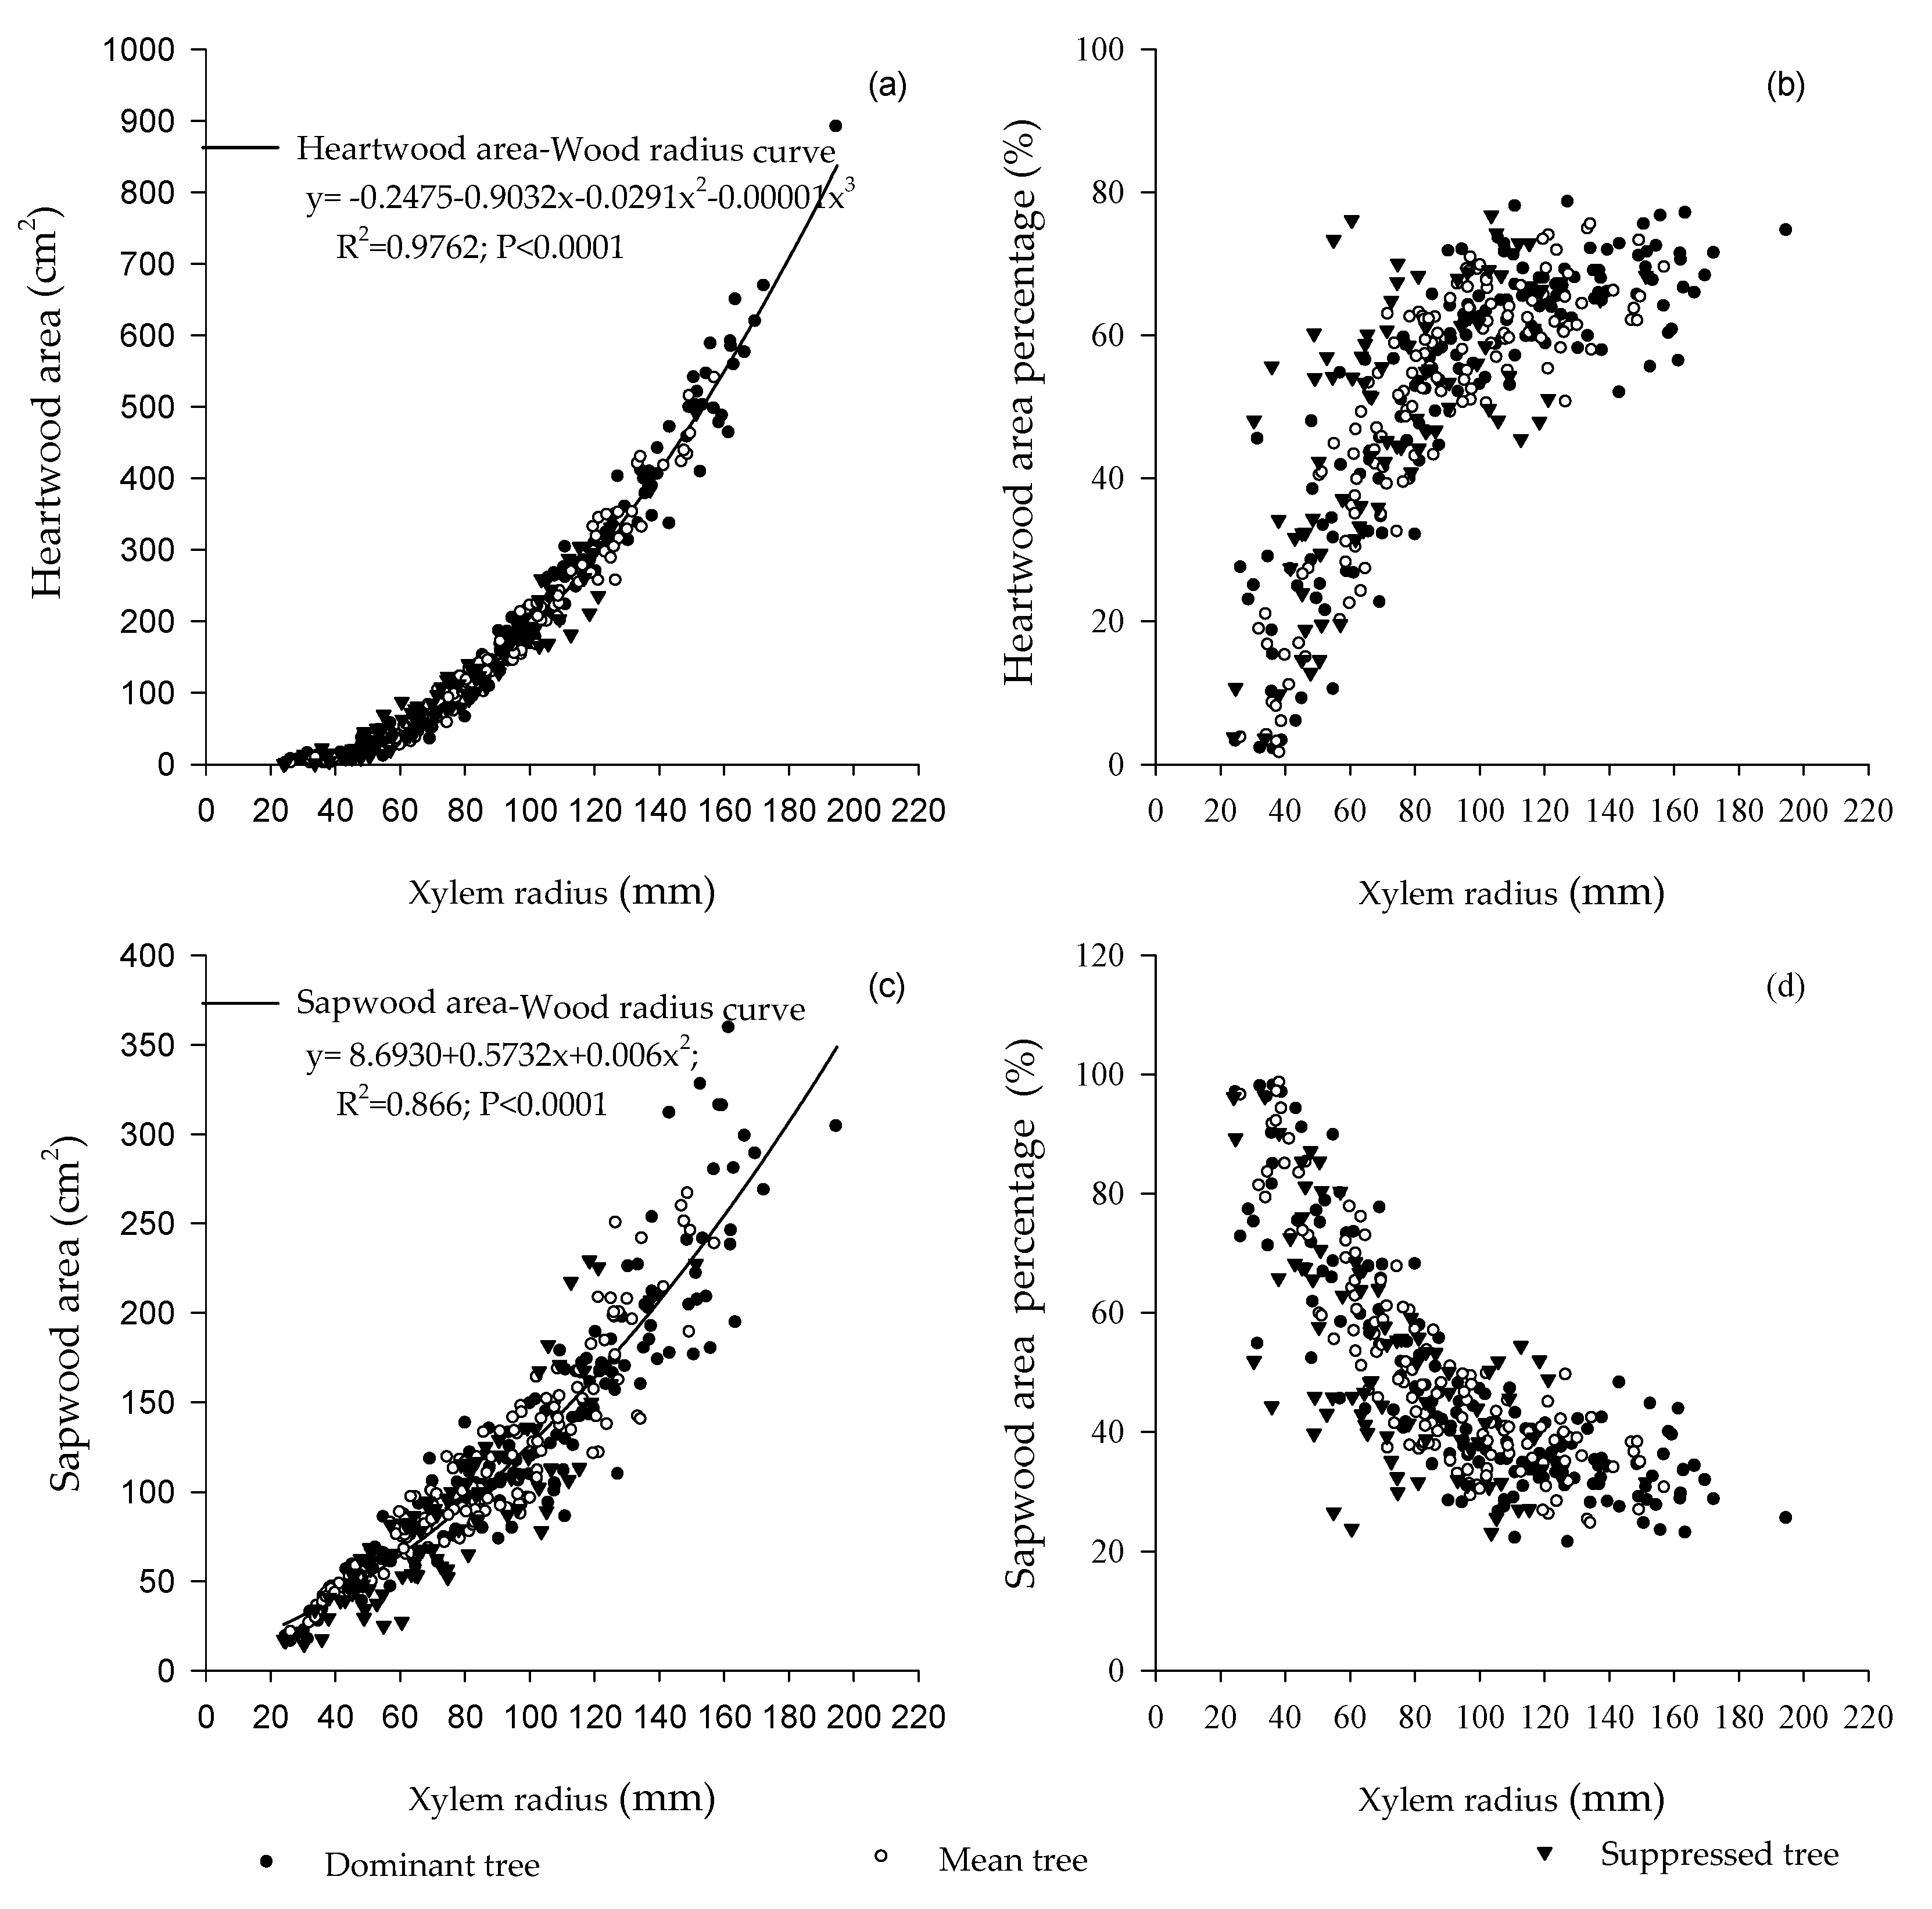
3.1. Horizontal Variation
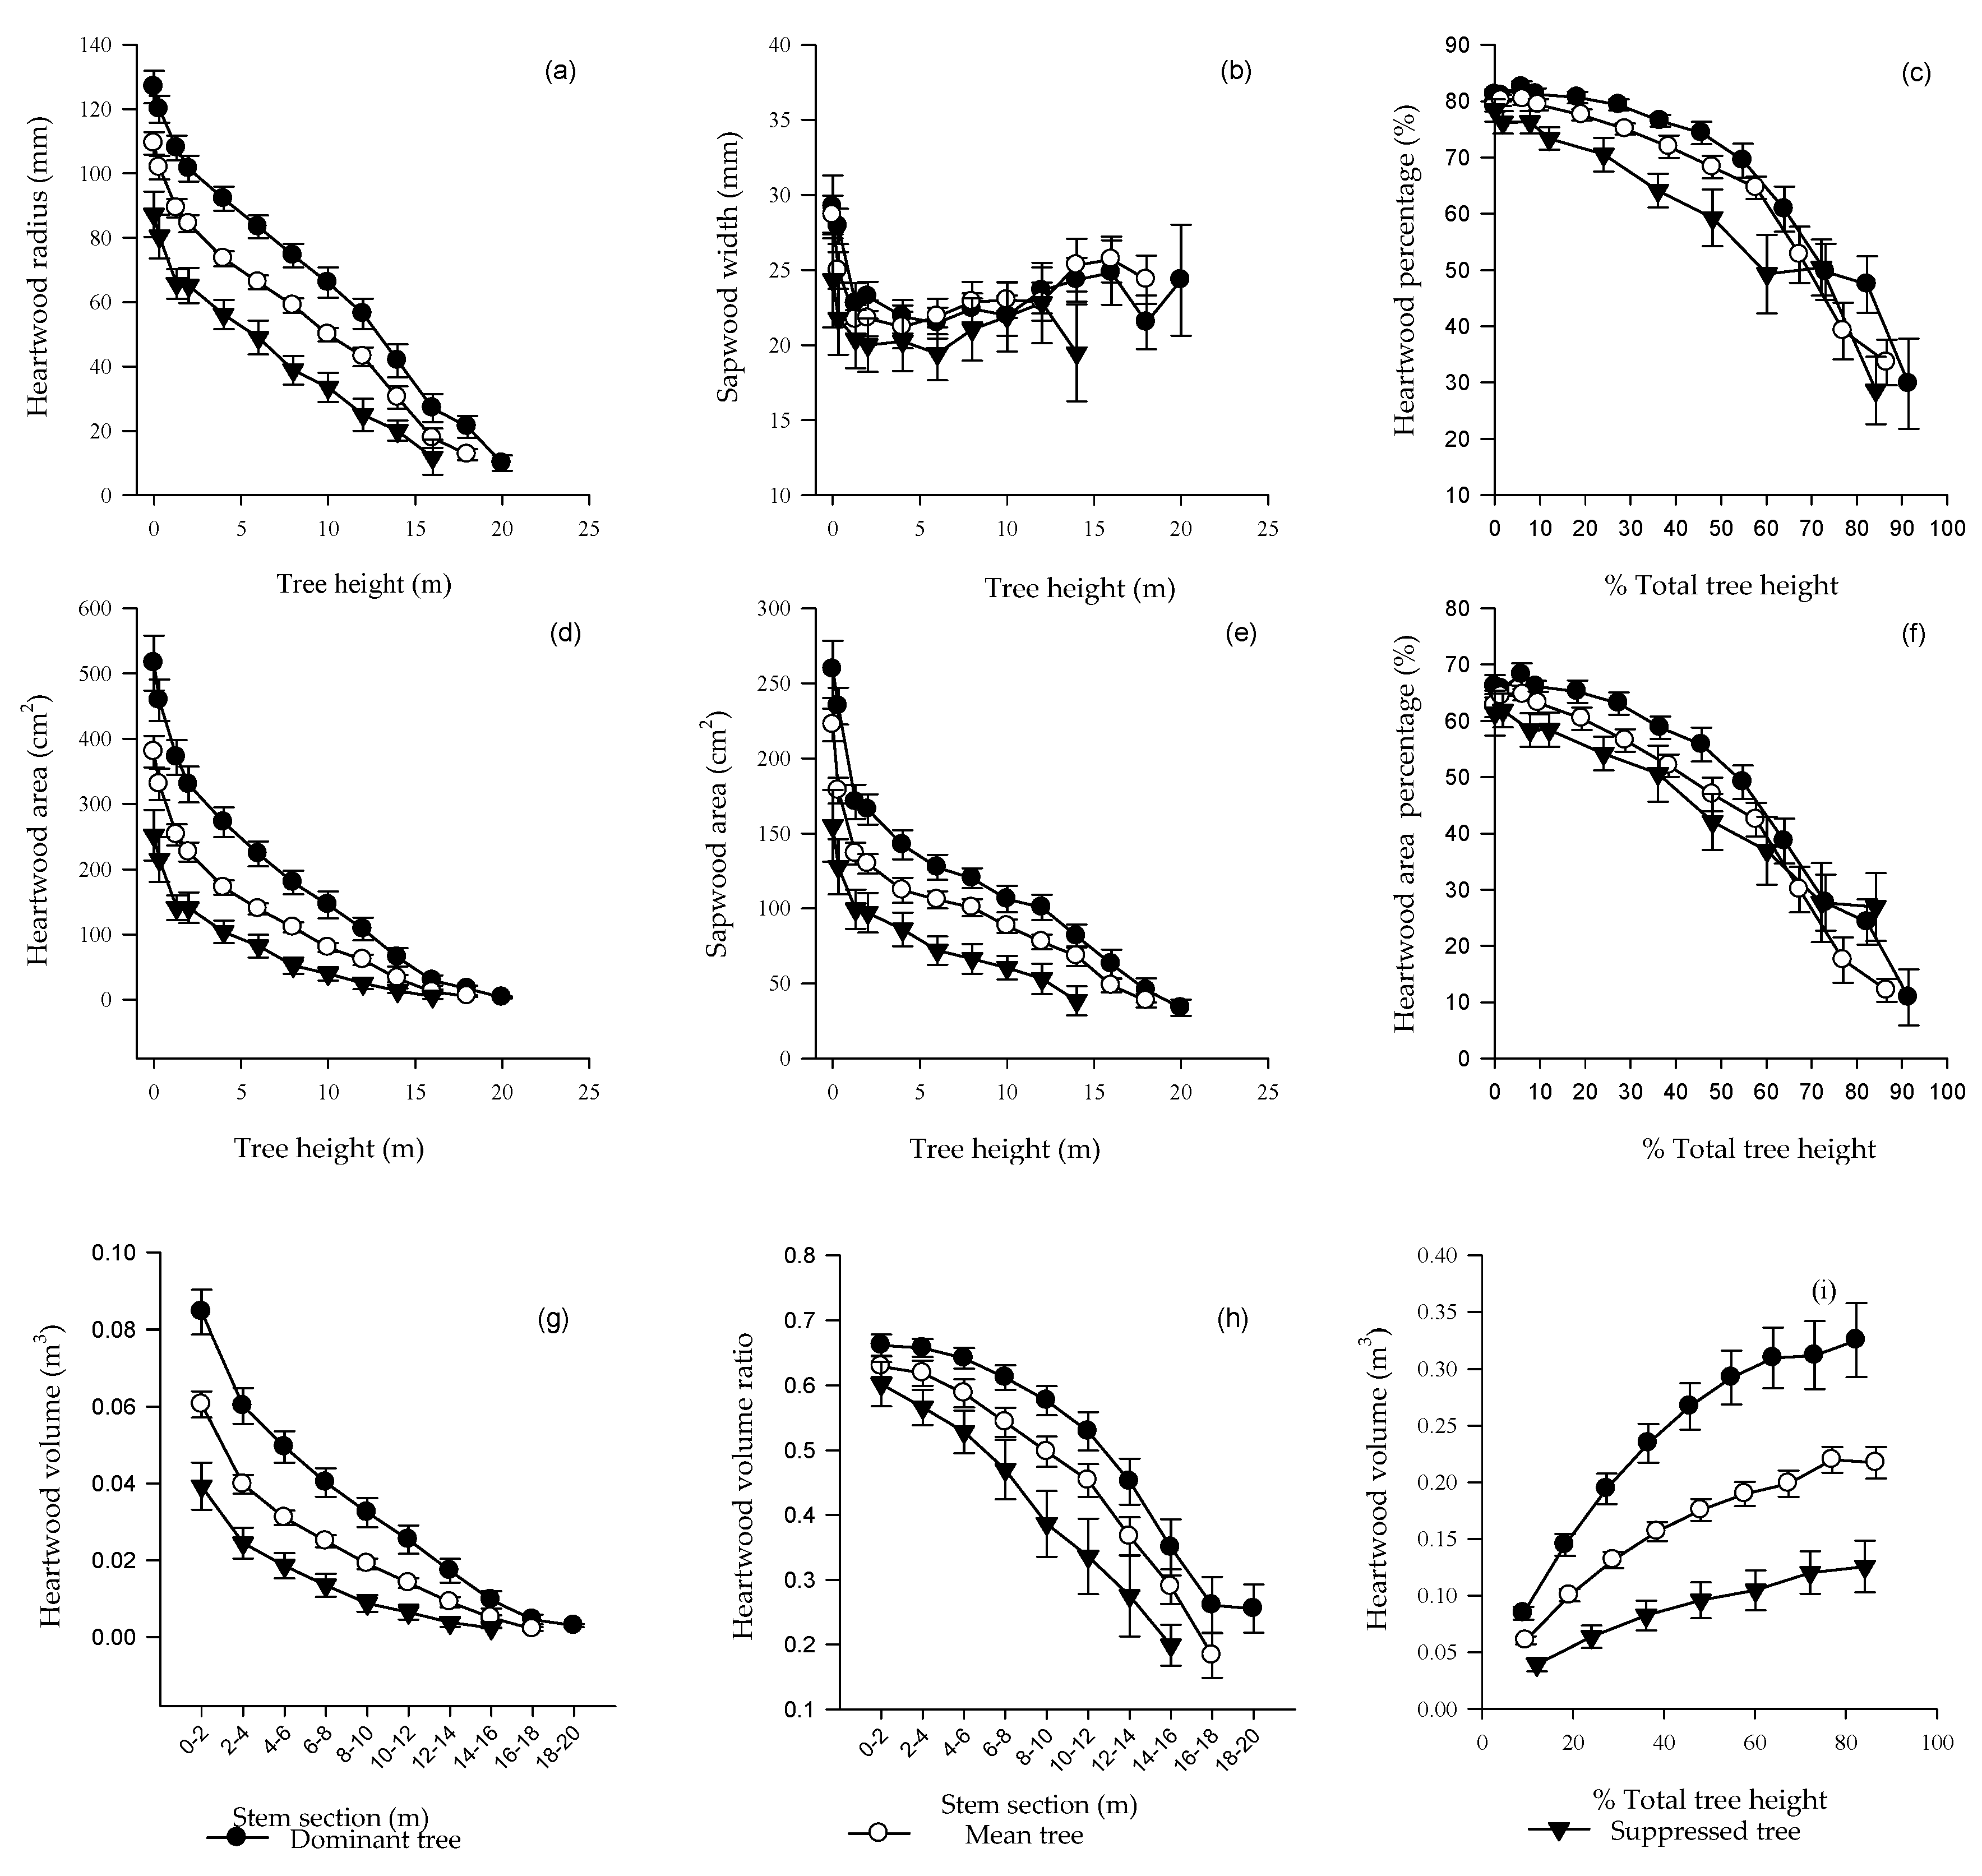
3.2. Vertical Variation
3.2.1. Heartwood Radius and Sapwood Width
3.2.2. Heartwood and Sapwood Areas
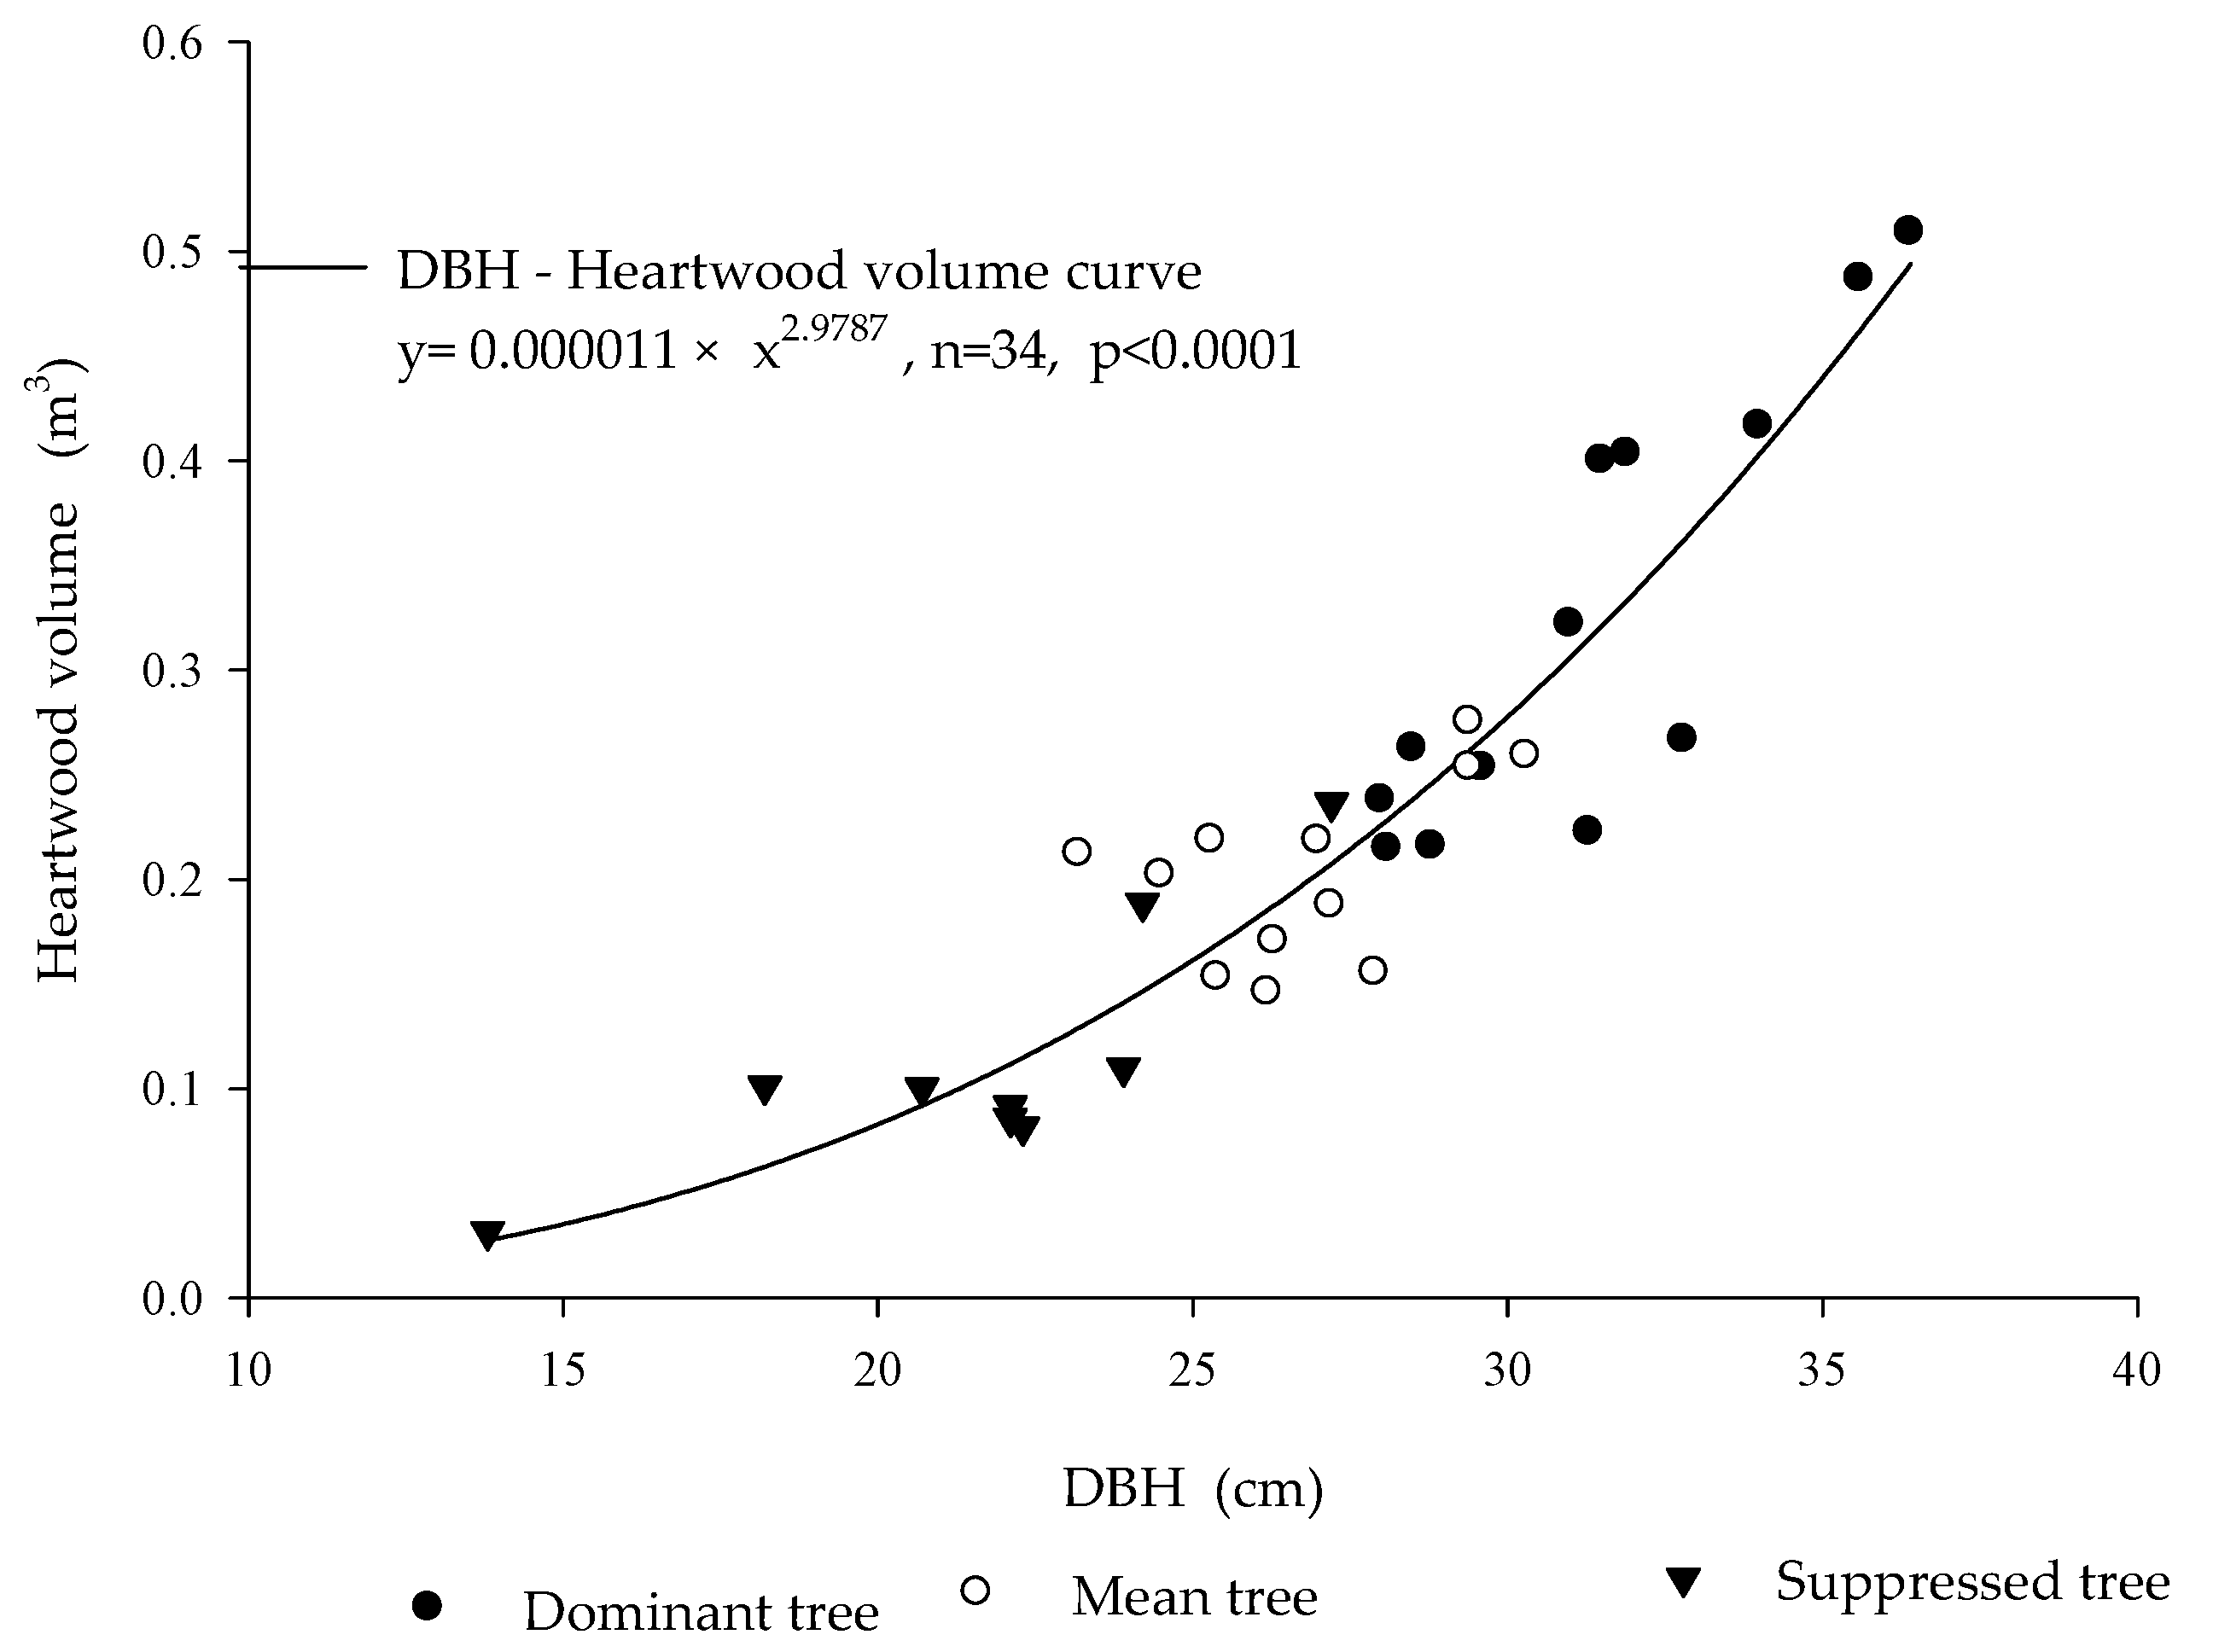
3.2.3. Heartwood Volume
3.3. Relationship between Tree Growth and Heartwood and Sapwood Attributes
4. Discussions
4.1. Horizontal Variation
4.2. Relationship between Tree Growth and Heartwood and Sapwood Attributes
5. Conclusions
Author Contributions
Funding
Acknowledgments
Conflicts of Interest
References
- Tewari, V.P.; Mariswamy, K.M. Heartwood, sapwood and bark content of teak trees grown in Karna-taka, India. J. For. Res. 2013, 24, 721–725. [Google Scholar] [CrossRef]
- Lourenco, A.; Neiva, D.; Gominho, J.; Marques, A.V.; Pereira, H. Characterization of lignin in heartwood, sapwood and bark from Tectona grandis using Py–GC–MS/FID. Wood Sci. Technol. 2015, 49, 159–175. [Google Scholar] [CrossRef]
- Ma, H.M.; Liang, K.N.; Zhou, Z.Z. Research and development of teak in China. For. Res. 2003, 16, 768–773. [Google Scholar]
- Minn, Y.; Prinz, K.; Finkeldey, R. Genetic variation of teak (Tectona grandis Linn. f.) in Myanmar revealed by microsatellites. Tree Genet. Genomes 2014, 10, 1435–1449. [Google Scholar] [CrossRef]
- Keogh, R.M. The Future of Teak and The High-Grade Tropical Hardwood Sector; Planted Forests & Trees Working Papers; FAO: Rome, Italy, 2009. [Google Scholar]
- Koskela, J.; Vinceti, B.; Dvorak, W.; Bush, D.; Dawson, I.K.; Loo, J.; Kjaere, E.D.; Navarrof, C.; Padolinag, C.; Bordácsh, S.; et al. Utilization and transfer of forest genetic resources: A global review. For. Ecol. Manag. 2014, 333, 22–34. [Google Scholar] [CrossRef] [Green Version]
- Kollert, W.; Cherubini, L. Teak Resources and Market Assessment 2010; Cfa Newsletter; FAO: Rome, Italy, 2012. [Google Scholar]
- Huang, G.H.; Liang, K.N.; Zhou, Z.Z.; Zhou, S.P.; Yang, G.; Wang, X.Y. Genetic variation and selective effect of growth traits of teak clones. J. South China Agric. Univ. 2019, 40, 101–106. [Google Scholar]
- Bjorklund, L. Identifying heartwood-rich stands or stems of Pinus sylvestris by using inventory data. Silva Fenn. 1999, 33, 119–129. [Google Scholar] [CrossRef] [Green Version]
- Meinzer, F.C.; Goldstein, G.; Andrade, J.L. Regulation of water flux through tropical forest canopy trees: Do universal rules apply? Tree Physiol. 2001, 21, 19–26. [Google Scholar] [CrossRef] [PubMed]
- Pérez, D.; Kanninen, M. Effect of thinning on stem form and wood characteristics of teak (Tectona grandis) in a humid tropical site in Costa Rica. Silva Fenn. 2005, 39, 217–225. [Google Scholar] [CrossRef] [Green Version]
- Fernández-Sólis, D.; Berrocal, A.; Moya, R. Heartwood formation and prediction of heartwood parameters in Tectona grandis L.f. trees growing in forest plantations in Costa Rica. Bois Forêts Tropiques 2018, 335, 25–37. [Google Scholar] [CrossRef] [Green Version]
- Oliver, C.D.; Larson, B.C. Forest Stand Dynamics; John Wiley and Sons: New York, NY, USA, 1996. [Google Scholar]
- Martinezvilalta, J.; Vanderklein, D.W.; Mencuccini, M. Tree height and age-related decline in growth in Scots pine (Pinus sylvestris L.). Oecologia 2006, 150, 529–544. [Google Scholar] [CrossRef]
- Sellin, A. Sapwood–heartwood proportion related to tree diameter, age, and growth rate in Picea abies. Can. J. For. Res. 1994, 24, 1022–1028. [Google Scholar] [CrossRef]
- Liu, J.L.; Wang, C.K.; Zhang, Q.Z. Spatial variations in stem heartwood and sapwood for Larix gmelinii trees with various differentiation classes. Sci. Silvae Sin. 2014, 50, 114–121. [Google Scholar]
- Kokutse, A.D.; Stokes, A.; Kokutse, N.K.; Kokou, K. Which factors most influence heartwood distribution and radial growth in plantation teak. Ann. For. Sci. 2010, 67, 407. [Google Scholar] [CrossRef]
- Pandey, D.; Brown, C. Teak: a global overview. Unasylva 2000, 51, 3–13. [Google Scholar]
- Bhat, K.M.; Priya, P.B.; Rugmini, P. Characterisation of juvenile wood in teak. Wood Sci. Technol. 2001, 34, 517–532. [Google Scholar] [CrossRef]
- Nicholas, N.S.; Gregoire, T.G.; Zedaker, S.M. The reliability of tree crown position classification. Can. J. For. Res. 1991, 21, 698–701. [Google Scholar] [CrossRef]
- Stokes, A.; Berthier, S. Irregular heartwood formation in Pinus pinaster Ait. is related to eccentric, radial, stem growth. For. Ecol. Manag. 2000, 135, 115–121. [Google Scholar] [CrossRef]
- Berthier, S.; Kokutse, A.D.; Stokes, A.; Fourcaud, T. Irregular Heartwood Formation in Maritime Pine (Pinus pinaster Ait.): Consequences for Biomechanical and Hydraulic Tree Functioning. Ann. Bot. 2001, 87, 19–25. [Google Scholar] [CrossRef] [Green Version]
- Okuyama, T.; Yamamoto, H.; Wahyudi, I.; Hadi, Y.S.; Bhat, K.M. Growth stresses and some wood quality attributed in planted teak. In Proceedings of the IUFRO Congress, Kuala Lumpur, Malaysia, 7–12 August 2000. [Google Scholar]
- Knapic, S.; Tavares, F.; Pereira, H. Heartwood and sapwood variation in Acacia melanoxylon R. Br. trees in Portugal. Forestry 2006, 79, 371–380. [Google Scholar] [CrossRef] [Green Version]
- Climent, J.; Chambel, M.R.; Gil, L.; Pardos, J.A. Vertical heartwood variation patterns and prediction of heartwood volume in Pinus canariensis Sm. For. Ecol. Manag. 2003, 174, 203–211. [Google Scholar] [CrossRef]
- Pinto, I.; Pereira, H.; Usenius, A. Heartwood and sapwood development within maritime pine (Pinus pinaster Ait.) stems. Trees 2004, 18, 284–294. [Google Scholar] [CrossRef]
- Knapic, S.; Pereira, H. Within-tree variation of heartwood and ring width in maritime pine (Pinus pinaster Ait.). For. Ecol. Manag. 2005, 210, 81–89. [Google Scholar] [CrossRef]
- Shinozaki, K.; Yoda, K.; Hozumi, K.; Kira, T. A quantitative analysis of plant form—The pipe model theory. I. Basic analyses. Jpn. J. Ecol. 1964, 14, 97–105. [Google Scholar]
- Morataya, R.; Galloway, G.; Berninger, F.; Kanninen, M. Foliage biomass—Sapwood (area and volume) relationships of Tectona grandis L.F. and Gmelina arborea Roxb.: Silvicultural implications. For. Ecol. Manag. 1999, 113, 231–239. [Google Scholar] [CrossRef]
- Wang, X.C.; Wang, C.K.; Zhang, Q.Z.; Li, S.Y.; Li, G.J. Growth characteristics of heartwood and sapwood of the major tree species in northeastern China. Sci. Silvae Sin. 2008, 44, 102–108. [Google Scholar]
- Pérez Cordero, L.D.; Kanninen, M. Heartwood, sapwood and bark content, and wood dry density of young and mature teak (Tectona grandis) trees grown in Costa Rica. Silva Fenn. 2003, 37, 565–571. [Google Scholar] [CrossRef] [Green Version]
- Mcdowell, N.; Barnard, H.; Bond, B.J.; Hinckley, T.; Hubbard, R.; Ishii, H.; Köstner, B.; Magnani, F.; Marshall, J.; Meinzer, F.; et al. The relationship between tree height and leaf area: Sapwood area ratio. Oecologia 2002, 132, 12–20. [Google Scholar] [CrossRef]
- Wang, X.; Wang, C.; Zhang, Q.; Quan, X. Heartwood and sapwood allometry of seven chinese temperate tree species. Ann. For. Sci. 2010, 67, 410. [Google Scholar] [CrossRef] [Green Version]


| Plot | Altit-Ude (m) | Grad-Ient (°) | Slope Position | Slope Aspect | Planting Year | Stand Density (Stems⋅ha−1) | DBH 1 (cm) | Height (m) | HCB 2 (m) | CW 3 (m) |
|---|---|---|---|---|---|---|---|---|---|---|
| BY1 | 232 | 30 | Down-slope | South-east | 1981 | 367 | 27.05 (3.80) | 19.9 (2.33)4 | 7.25 (2.57) | 5.27 (1.37) |
| BY2 | 230 | 35 | Down-slope | South-east | 1981 | 333 | 25.91 (5.35) | 16.93 (4.58) | 6.61 (2.93) | 5.46 (2.14) |
| BY3 | 350 | 40 | Down-slope | North-west | 1981 | 333 | 28.48 (2.51) | 18.77 (2.23) | 9.33 (4.21) | 4.93 (2.31) |
| BY4 | 349 | 40 | Down-slope | North-west | 1981 | 383 | 27.57 (4.85) | 18.42 (2.97) | 8.24 (3.18) | 5.13 (0.99) |
| QS1 | 199 | 0 | Down-slope | North-west | 1982 | 350 | 23.71 (4.10) | 16.94 (2.36) | 9.45 (2.84) | 6.78 (1.09) |
| QS2 | 185 | 5 | Down-slope | North | 1982 | 350 | 26.07 (3.82) | 19.4 (3.02) | 10.79 (2.75) | 7.80 (3.03) |
| QS3 | 153 | 16 | Down-slope | North | 1982 | 383 | 25.46 (4.33) | 19.97 (2.95) | 9.49 (1.90) | 7.12 (2.69) |
| QS4 | 164 | 18 | Down-slope | North | 1982 | 400 | 25.17 (2.89) | 22.23 (1.89) | 12.75 (2.83) | 5.19 (1.16) |
| QS5 | 146 | 25 | Down-slope | North | 1982 | 367 | 23.46 (3.65) | 17.71 (2.48) | 9.22 (2.16) | 6.40 (1.58) |
| SPXS1 | 199 | 11 | Down-slope | East | 1982 | 400 | 22.13 (7.56) | 15.78 (3.68) | 8.13 (2.94) | 5.01 (1.45) |
| Social Status | Sample No. | DBH 1 (cm) | Height (m) | HCB 2 (m) | CW 3 (m) |
|---|---|---|---|---|---|
| Dominant tree | 13 | 27.55 (2.72) 4 | 21.88 (1.14) | 12.58 (2.47) | 6.53 (1.04) |
| Mean tree | 12 | 23.41 (1.78) | 20.78 (1.32) | 11.53 (2.63) | 6.27 (2.50) |
| Suppressed tree | 9 | 18.16 (3.21) | 16.63 (1.91) | 9.59 (2.88) | 4.94 (1.61) |
| Parameters | Dominant Tree | Mean Tree | Suppressed Tree |
|---|---|---|---|
| HR 3 (mm) 1 | 107.97 (3.47) a 2 | 89.23 (3.62) b | 65.77 (4.17) c |
| SW 4 (mm) | 22.77 (1.30) a | 21.7 (1.36) a | 20.39 (1.57) a |
| HA 5 (cm2) | 371.73 (20.69) a | 252.95 (21.53) b | 141.22 (24.87) c |
| SA 6 (cm2) | 171.08 (9.94) a | 136.53 (10.35) b | 99.56 (11.95) c |
| HRP 7 | 0.83 (0.01) a | 0.80 (0.01) a | 0.76 (0.01) b |
| HAP 8 | 0.68 (0.02) a | 0.65 (0.02) a | 0.58 (0.02) b |
| HV 9 (m3) | 0.32 (0.02) a | 0.20 (0.02) b | 0.11 (0.03) c |
| V 10 (m3) | 0.54 (0.03) a | 0.37 (0.03) b | 0.22 (0.04) c |
| HVP 11 | 0.60 (0.02) a | 0.55 (0.02) ab | 0.51 (0.02) b |
| Growth Characteristics | Heartwood Radius | Sapwood Width | Heartwood Area | Sapwood Area | Individual Heartwood Volume |
|---|---|---|---|---|---|
| DBH 1 | 0.920 ** 2 | 0.345 * 3 | 0.888 ** | 0.776 ** | 0.889 ** |
| Tree height | 0.531 ** | 0.306 | 0.486 ** | 0.514 ** | 0.539 ** |
| Height to crown base | 0.343 * | −0.010 | 0.370 * | 0.192 | 0.438 ** |
| Crown width | 0.434 * | 0.121 | 0.378 * | 0.304 | 0.304 |
| B 1 | AB 2 | MSE 3 | R2 4 | Model | |
|---|---|---|---|---|---|
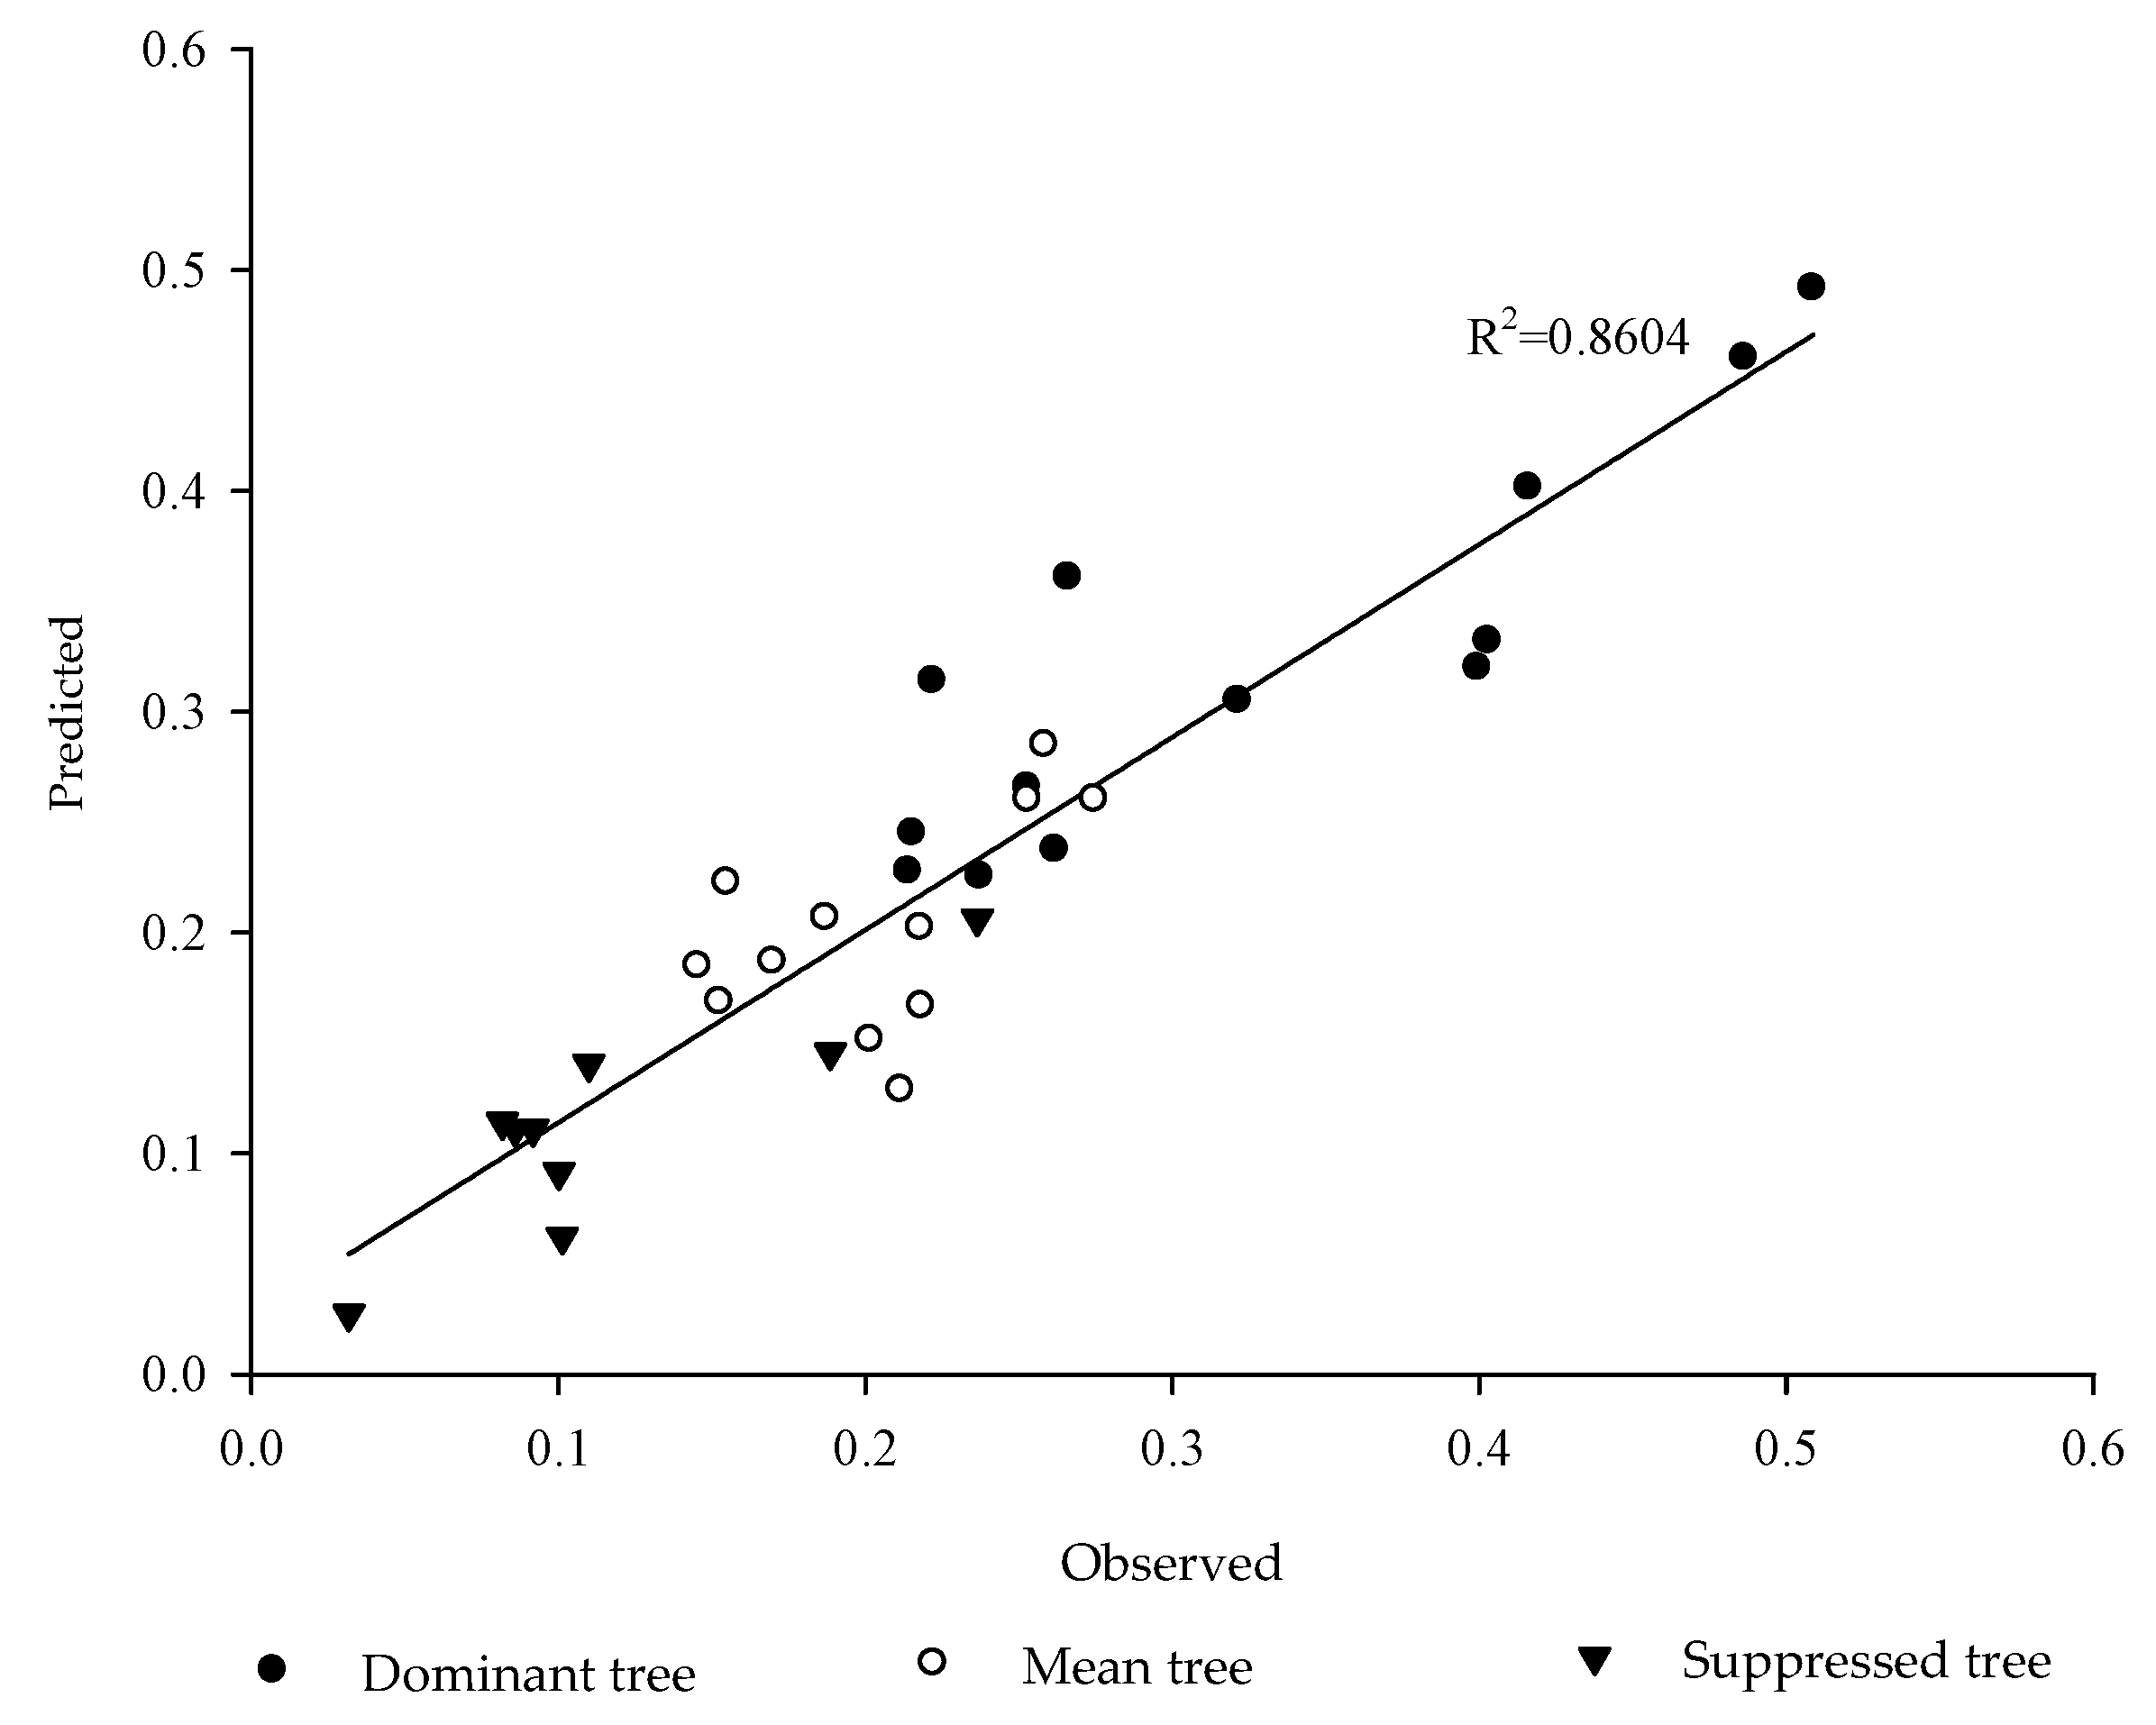
| Heartwood volume | 0.0021 | 0.0337 | 0.0019 | 0.8601 | HV 5 = 0.000011 * DBH2.9787 |
| Paired Samples | Mean | Standard Deviation | Standard Error | t | Significance Level (p) |
|---|---|---|---|---|---|
| Observed-Predicted | 0.0021 | 0.0426 | 0.0073 | 0.287 | 0.776 |
© 2020 by the authors. Licensee MDPI, Basel, Switzerland. This article is an open access article distributed under the terms and conditions of the Creative Commons Attribution (CC BY) license (http://creativecommons.org/licenses/by/4.0/).
Share and Cite
Yang, B.; Jia, H.; Zhao, Z.; Pang, S.; Cai, D. Horizontal and Vertical Distributions of Heartwood for Teak Plantation. Forests 2020, 11, 225. https://doi.org/10.3390/f11020225
Yang B, Jia H, Zhao Z, Pang S, Cai D. Horizontal and Vertical Distributions of Heartwood for Teak Plantation. Forests. 2020; 11(2):225. https://doi.org/10.3390/f11020225
Chicago/Turabian StyleYang, Baoguo, Hongyan Jia, Zhigang Zhao, Shengjiang Pang, and Daoxiong Cai. 2020. "Horizontal and Vertical Distributions of Heartwood for Teak Plantation" Forests 11, no. 2: 225. https://doi.org/10.3390/f11020225