Article

Selection and Validation of Appropriate Reference Genes for Real-Time Quantitative PCR Analysis in Needles of Larix olgensis under Abiotic Stresses

State Key Laboratory of Tree Genetics and Breeding, Northeast Forestry University, Harbin 150040, Heilongjiang, China
*
Author to whom correspondence should be addressed.
These authors contributed equally to this work.
Forests 2020, 11(2), 193; https://doi.org/10.3390/f11020193
Submission received: 15 January 2020 / Revised: 4 February 2020 / Accepted: 5 February 2020 / Published: 10 February 2020
(This article belongs to the Special Issue Forest Genetics and Tree Improvement)

Abstract

:
Larix olgensis Henry is an important afforestation species in northeastern China because of its fast juvenile growth, high-quality timber, and significant economic and ecological values. The selection of appropriate reference genes is necessary for the normalization of gene expression determination during quantitative real-time polymerase chain reaction (qRT-PCR) experiments. In this study, qRT-PCR was used to study gene expression. Three software packages geNorm, NormFinder, BestKeeper were used, and a comprehensive ranking of candidate reference genes was produced based on their output to evaluate the expression stability of 16 candidate reference genes from L. olgensis under drought, salt, cold, and heat stress. PP2A-1 and GAPDH ranked as the most stable reference genes under drought and cold stress, PP2A-1 and UBQ10 were most stable under salt stress, and TIP41 and ACT2 were most stable under heat stress. The least stable gene was ADP, which ranked the last under all treatments. Expression profile analysis of the antioxidant gene CAT using the two most stable and the single least stable reference genes under each stress further verified that the selected reference genes were suitable for gene expression normalization. This study provides an important foundation for the selection of suitable reference genes for the normalization and quantification of L. olgensis gene expression under abiotic stress conditions.

1. Introduction

Gene expression analysis is an important tool for identifying key genes and understanding complex biological processes such as metabolic pathways, signal transduction, and plant development. Quantitative real-time polymerase chain reaction (qRT-PCR) is the most effective, simple, specific, inexpensive, and sensitive method for quantifying the expression of target genes [1,2]. Nevertheless, various factors such as RNA integrity, reverse transcription efficiency, cDNA quality, primer specificity, amplification efficiency, and the selection of reference genes (RGs) may significantly influence the reliability of qRT-PCR results [3,4]. Selection of inappropriate RGs will introduce inaccuracies into the experimental data, and screening for one or more suitable RGs is therefore important for the normalization of gene expression data.
Previous literature has described the selection of RGs for various species under different biotic and abiotic stresses and in different development stages and tissues. These species include Arabidopsis thaliana [5], Oryza sativa [6], Solanum lycopersicum [7], Malus domestica [8], and Populus euramericana cv [9]. RGs are often housekeeping genes that are associated with basic cellular processes and therefore expressed at a constant level under different experimental conditions [10]. Glyceraldehyde 3-phosphate (GAPDH), actin (ACT), ubiquitin (UBQ), ubiquitin conjugating enzyme (UBC), 18SrRNA, elongation factor 1 alpha (EF-1α), eukaryotic translation initiation factor 4α (eIF-4α), tubulin beta (TUB), and alpha-tubulin (TUA) genes have frequently been used as RGs to standardize the expression of target genes [11]. In Lactuca sativa, LsPP2A-1 (protein phosphatase 2A-1), LsPP2AA3 (protein phosphatase 2A regulator subunit A3), and LsTIP41 (TAP42-interacting protein of 41 kDa) genes were found to be the most suitable RGs in both diurnal and developmental time course experiments [12]. In Petroselinum crispum, the most stable genes under abiotic stress were EF-1α and TUB, whereas the most stable genes under hormone stimulus treatments were EF-1α, GAPDH, and TUB [13]. ACT2, UBC9, PP2A-1, and PTBP1 were the most stable RGs under a variety of experimental treatments, and ACT and TUB have been used as RGs for qRT-PCR normalization in Salix matsudana under salt and copper stress [14]. In addition, recent studies have indicated that stably expressed RGs in one species may not be suitable for other species and may not be universally suitable under all treatment conditions [15,16]. Although some genes have been selected as good references, the expression of these housekeeping genes in different organs, developmental stages, physiological states, and stress conditions is unknown [17,18]. For example, TUB and TUA ranked as optimal RGs in P. crispum at different development stages [13]; however, in Cucumis sativus, TUA showed the lowest stability under long-term heavy metal and drought stress [19]. Therefore, the selection of suitable RGs for a specific experimental design or species is very important. However, previous research has focused primarily on herbaceous plants and broadleaf trees; whether universal RGs exist for Larix olgensis remains unclear.
L. olgensis Henry is an important timber species that is widely distributed in northeastern China, eastern Russia, and North Korea [20]. It is an important afforestation species because of its fast juvenile growth, high-quality timber, and ability to tolerate severe environmental stresses like drought and extreme temperatures [21,22]. L. olgensis produces wood for lumber, paper, pulp, and biofuel and has significant ecological and economic values [21,23]. In recent years, genetic engineering has been applied to coniferous forest species. Genomic and transcriptomic resources for L. olgensis have been developed, and several genes related to biotic stress response have been identified [24]. An analysis of the transcriptomes of two hybrid larch (Larix kaempferi × L. olgensis) clones showed that genes related to stress response may play an important role in adventitious root development [25]. Four L. olgensis MYB transcription factors have been identified and shown to have a potential role in xylem development [26]. Expression characteristics of several stress-related L. olgensis genes have been the subject of preliminary study. For instance, LoMYB29 was expressed when induced by MeJA, ABA, NaCl, drought, wounding, and high light [27]. Ectopic expression of LoERF017 from L. olgensis in A. thaliana enhanced its salt and osmotic-stress tolerance [28]. In other timber species like Cunninghamia lanceolata, Chen et al. selected RGs in roots as material under water, phosphorus, and nitrogen stresses [29]. As we know, nitrogen (N) starvation/toxicity involves important protecting molecules, such as polyamines which influence yield and productivity of timber species [30]. Nevertheless, as these studies show, the traditional housekeeping gene TUA is the only RG that has been used to validate L. olgensis gene expression. Therefore, more appropriate RGs are required for the normalization of L. olgensis gene expression, particularly under different stress conditions.
Recently, the available transcriptome data from L. olgensis has increased, providing a foundation from which to identify sets of optimal RGs. In this study, we selected 16 candidate RGs from L. olgensis transcriptome sequencing data and evaluated their expression in response to drought, salt, heat, and cold stress. The software packages geNorm, NormFinder, BestKeeper and comprehensive analysis were used to analyze the expression stability of candidate RGs. We then selected a target gene, CAT, which was used to evaluate the reliability of candidate RGs under stress treatments [31]. This study will provide useful information for the selection of suitable RGs for normalization of L. olgensis gene expression under abiotic stress.

2. Materials and Methods

2.1. Plant Materials and Treatments

Mature seeds of L. olgensis Henry were collected from the Qingshan Forestry Bureau Seed Orchard in Heilongjiang Province and sown in plastic pots (11 × 11 cm) containing a vermiculite/soil mixture (1:1) and cultured in a growth chamber with 70% relative humidity under a 16-h/8-h light/dark photoperiod with a light intensity of 150 μmol m-2 s−1 [27]. Three-month-old seedlings with consistent growth were selected for abiotic treatments. For salt and drought experiments, pots were irrigated with 0.2 M NaCl or 20% PEG 6000 solutions for 0, 2, 6, 12, and 24 h. Plants were irrigated every 12 h during the experiment. For heat and cold stress treatments, three-month-old seedlings were transferred into light incubators and exposed to 40 or 4 °C for 0, 2, 6, 12, and 24 h [32]. All the treatments were performed with three biological replicates. Needles were carefully harvested from treated and untreated plants, frozen immediately in liquid nitrogen, and stored at −80 °C for RNA extraction.

2.2. RNA Extraction and cDNA Preparation

Total RNA was isolated using the CTAB (cetyltrimethylammonium bromide) method [33]. The concentration of extracted RNA was quantified using a P300 ultramicro spectrophotometer (IMPLEN, Munich, Germany) and evaluated by 0.8% agarose gel electrophoresis. Next, cDNA synthesis was performed using RNA samples with A260/A280 ratios between 1.8 and 2.0 and A260/A230 ratios higher than 2.0. Approximately 1000 ng of total RNA was used to be reversely transcribed into cDNA with the TransScript® II One-Step RT-PCR SuperMix (TransGen Biotech, Beijing, China). The cDNA was serially diluted (10−1, 10−2, 10−3, 10−4, 10−5, and 10−6) for determination of the correlation coefficient (R2), R2 and slope values were obtained from the standard curves, and the amplification efficiency (E) calculated according to the formula: E% = (10−1/slope−1) ×100%; it was diluted 10-fold for qPCR analysis and stored at −20 °C until further use.

2.3. Selection of Candidate Reference Genes and Primer Design

This study took advantage of the unpublished L. olgensis genome information generated by our team: we had previously analyzed transcriptome for this species with and without watering (unpublished). We screened candidate reference genes according to the following criteria: the fragments per kilobase of exon model per million mapped reads (FPKM values) were appropriating in all samples, and the coefficient of variation (CV) of FPKM value was cut off less than 0.5. Based on previous studies the criteria, 16 commonly used reference genes including glyceraldehyde 3-phosphate dehydrogenase (GAPDH), 18S ribosomal RNA (18S), actin 2 (ACT2), tubulin beta-6 (TUB), eukaryotic translation initiation factor 4α-1 (eIF-4α), Ef 1alpha (EF-1α), tubulin alpha-2 (TUA), ubiquitin-conjugating enzyme 9 (UBC9), TIP41-like protein (TIP41), protein phosphatase 2A-1 (PP2A-1), polyubiquitin 10 (UBQ10), polypyrimidine tract binding protein (PTBP1), ADP-ribosylation factor (ADP, or ARF), histone (HIS), ubiquitin-like protein RUB2 (UBQ7), and actin protein coding 12 (ACT12) genes were used as candidate genes to identify the most stable RGs under different treatments. Detailed information on each gene is presented in Table 1. The coding sequences (CDs) of the 16 Arabidopsis genes were downloaded from the TAIR database (http://www.arabidopsis.org) to identify their homologs in the L. olgensis transcriptome. The Bioedit Sequence Alignment Editor was used to perform a local BLAST to conduct the blastn search of the L. olgensis transcriptome using the Arabidopsis query sequences. We identified 16 candidate RGs and one target gene, CAT (Table 2). The CDs sequences from the L. olgensis transcriptome were submitted to GenBank. Primer5 was used to design specific primers for each gene using the following criteria: GC content 44%–60%, optimal Tm 58–60 °C, primer length 20–22 bp, and amplicon length 80–220 bp (Table 2). The specificity of all primer pairs was checked by standard PCR using cDNA as a template with KOD FX (Toyobo, Osaka, Japan), and amplified products were verified with 2% agarose gel and sequenced to confirm their identity.

2.4. Reverse Transcription Quantitative PCR (qRT-PCR) Analysis

Quantitative RT-PCR reactions were conducted in 96-well plates with a qTOWER 3G Cycler and qPCR software (Analytik Jena, Jena Germany) using the TransStart Top Green qPCR SuperMix (TransGen Biotech, Beijing, China). The 20 μL reaction mix contained 10 μL TransStart Top Green qPCR SuperMix, 7 μL nuclease-free water, 1 μL diluted cDNA, and 1 μL of each specific primer (final concentration 10 μM). PCR conditions were 94 °C for 30 s, followed by 45 cycles of 95 °C for 5 s, 59 °C for 15 s, and 72 °C for 10 s. Three technical replicates were performed for each sample to ensure the accuracy of the results. All primers used in the study are listed in Table 2.

2.5. Gene Expression Stability Analysis

Three different Microsoft Excel-based software programs, geNorm [3], NormFinder [15], and BestKeeper [13,34], were used to analyze the expression stability of the candidate RGs under different experimental conditions. The Cq (PCR cycle threshold) data were used directly in the BestKeeper program, but for geNorm and NormFinder, Cq values were converted into relative values and imported into geNorm and NormFinder program analyzed as described previously [13]. The output of each software program permitted us to rank the expression stability of RGs in different treatment groups. A comprehensive ranking of RGs was also generated as described previously [35,36].

2.6. Validation of RGs by qRT-PCR

QRT-PCR was also performed to analyze the expression levels of the target gene CAT under different experimental conditions. The top two best RGs and worst ranked RG for each experimental condition were selected normalization of CAT expression in L. olgensis. The quantitative variation between replicates was calculated with the relative quantification method (2−ΔΔCT) [37]. Graphs were generated using Excel and GraphPad Prism7. The primer for CAT is listed in Table 2.

3. Results

3.1. Selection of Candidate Reference Genes

Based on sequence homology with Arabidopsis genes, 16 candidate RGs were identified from the L. olgensis transcriptome (unpublished) (Table 1). Subsequently, primer specificity was confirmed based on agarose gel electrophoresis. Amplicons of a single band with the expected size indicate good primer specificity (Figure S1). In qRT-PCR reactions, melting curve analysis of every candidate RG showed a single peak. Amplification efficiency (E) and correlation coefficient values (R2) of the RG standard curves varied from 96.85 to 108.72% and from 0.9918 to 0.9997, respectively (Table 2 and Figure S2).

3.2. Expression Profiles of Candidate RGs

The distribution of raw Cq values for the 16 candidate RGs in 20 L. olgensis samples (five samples from each stress condition) is shown in Figure 1. The RGs exhibited a relatively wide range of Cq values, from 13.07 (ADP) to 31.75 (18S). The mean Cq values of the RGs varied from 21.63 to 28.85, their SDs varied from 0.64 to 1.4, and their coefficients of variation (CVs) varied from 2.47% to 6.12%. As Cq values are negatively related to gene expression levels, the highest maximum expression level was detected in ADP, whereas the lowest minimum level was detected in 18S (Figure 2). ADP exhibited the highest variation in expression, and PTBP1 exhibited the lowest variation, with Cq values ranging from 24.20 to 27.62. eIF-4α showed relatively moderate variation, with Cq values ranging from 22.27 to 26.72. A small CV of the Cq values indicates that a given gene is more stably expressed. The lowest and highest CV values under the four treatments were GAPHH (0.79%) and ADP (15.3%) under drought stress, PP2A-1 (0.65%) and ADP (14.06%) under salt stress, PP2A-1 (1.51%) and ADP (14.77%) under cold stress, and UBQ7 (1.22%) and ADP (15.22%) under heat stress. The ranking of gene stability by average CV values across all treatments was PP2A-1 > ACT2 > PTBP1 > TIP41 > 18S > UBQ7 > ACT12 > eIF-4α > TUB > UBQ10 > HIS > UBC9 > TUA > GADPH > ADP > EF-1α (Table 2).

3.3. Analysis of Gene Expression Stability

The software programs geNorm, NormFinder, and BestKeeper were used to analyze the expression stability of the 16 candidate RGs in L. olgensis plants that had been subjected to four experimental treatments. Data from each treatment were analyzed separately and in combination.
geNorm analysis: for geNorm analysis, the M-value of candidate RGs was calculated and used to rank RG stability. A gene with an M-value below 1.5 is considered to be stably expressed, and the smaller the M-value, the more stable the gene [3]. In our study, the M-values of all candidate RGs were lower than 1.5 in individual treatments and when the treatments were combined, with the exception of ADP under heat stress. The most suitable RG differed among treatments. As shown in Table 3 and Figure S3, GAPDH and 18S under drought stress, UBQ10 and PP2A-1 under salt stress, PP2A-1 and GAPDH under cold stress, and TIP41 and ACT2 under heat stress were ranked as the most stable genes with the lowest M-values. PP2A-1 and ACT2 had the most stable expression when data from all samples were combined, whereas, ADP was the least stable gene in all treatment conditions.
For qRT-PCR, the selection of a greater number of RGs can permit more accurate quantification of target gene expression. geNorm was used to calculate the pairwise variation (Vn/n+1), which permits the determination of an optimal number of RGs for each treatment group using a threshold value of 0.15. There is no need for additional RGs if the variation value is below 0.15 [3]. As shown in Figure 3, the pairwise variation values V2/V3 for drought, salt, and cold stress samples were all less than 0.15, indicating that two suitable RGs were adequate for the normalization of data from these treatments. For the heat stress samples, V4/5 was 0.1498, indicating that four RGs (TIP41, ACT2, PTBP1, and eIF-4α) were required. When all samples were combined, V3/4 was 0.1315, indicating that three RGs (ACT2, PP2A-1, and TIP41) were required.
NormFinder analysis: the NormFinder approach provides a stability value for each gene based on inter- and intra-group variation in expression [15]. As shown in Table 4, the stability ranks calculated in NormFinder were consistent with those calculated in geNorm under cold stress (GAPDH). The top three most stable genes were GAPDH, 18S, and PP2A-1 under drought stress; ACT2, 18S, UBC9, PPA2-1, and UBQ10 under salt stress; and 18S, PTBP1, and ACT2 under heat stress. These rankings were broadly similar to those of geNorm, although there were some differences. For instance, in the stability rankings for the combined samples, NormFinder suggested that 18S and UBC9 were the two most suitable two RGs, a result that differed from that of geNorm. Similar to geNorm, NormFinder indicated that ADP was the least stable gene in all treatments. Although there were some differences in rankings between geNorm and NormFinder, the top five most stable genes were relatively consistent between them.
BestKeeper analysis: another method for detection of suitable RGs is BestKeeper. Unlike the other two programs, BestKeeper ranks RGs based on the standard deviation (SD) and coefficient of variation (CV) of the Cq values from the qRT-PCR assay. The smaller the CV, the better the stability of the gene was [13,34]. The results of BestKeeper analysis are also listed in Table 5. PPA2-1 was ranked first under salt stress and cold stress, with CV ± SD values of 0.17 ± 0.65 and 0.40 ± 1.51, respectively. GAPDH was ranked first under drought stress, with a CV ± SD of 0.17 ± 0.79 and UBQ7 was ranked first under heat stress, with a CV ± SD of 0.29 ± 1.22. BestKeeper suggested that ACT2 was the most suitable RG when data from all samples were combined. Few genes had an SD greater than 1.0, indicating that most of the candidate RGs were relatively stable. Similar to the results of geNorm and NormFinder, ADP was the least stable RG for all sample sets, with the exception of the combined samples, in which EF-1α was the least stable.

3.4. Comprehensive Analysis

To reduce the effect of any limitations and biases associated with individual algorithms, a comprehensive stability analysis was performed by taking the geometric mean of the geNorm, NormFinder, and BestKeeper rankings in order to identify the best RGs [38]. For comprehensive analysis, two RGs were selected for further normalization. As shown in Table 6 and Figure 4, PP2A-1 was ranked among of the top two most stable RGs under drought, salt, and cold stress, and GAPDH under cold stress, UBQ10 under salt stress were also the most stable RGs, respectively. TIP41 and ACT2 were the most stable RGs under heat stress, and ACT2 and PP2A-1 were the most stable RGs when all samples were combined. The comprehensive RG rankings for single treatments (drought, salt, and cold) and for combined samples were consistent with the results obtained by geNorm and BestKeeper. ADP was the least stable RG under all experimental conditions (Table S1).

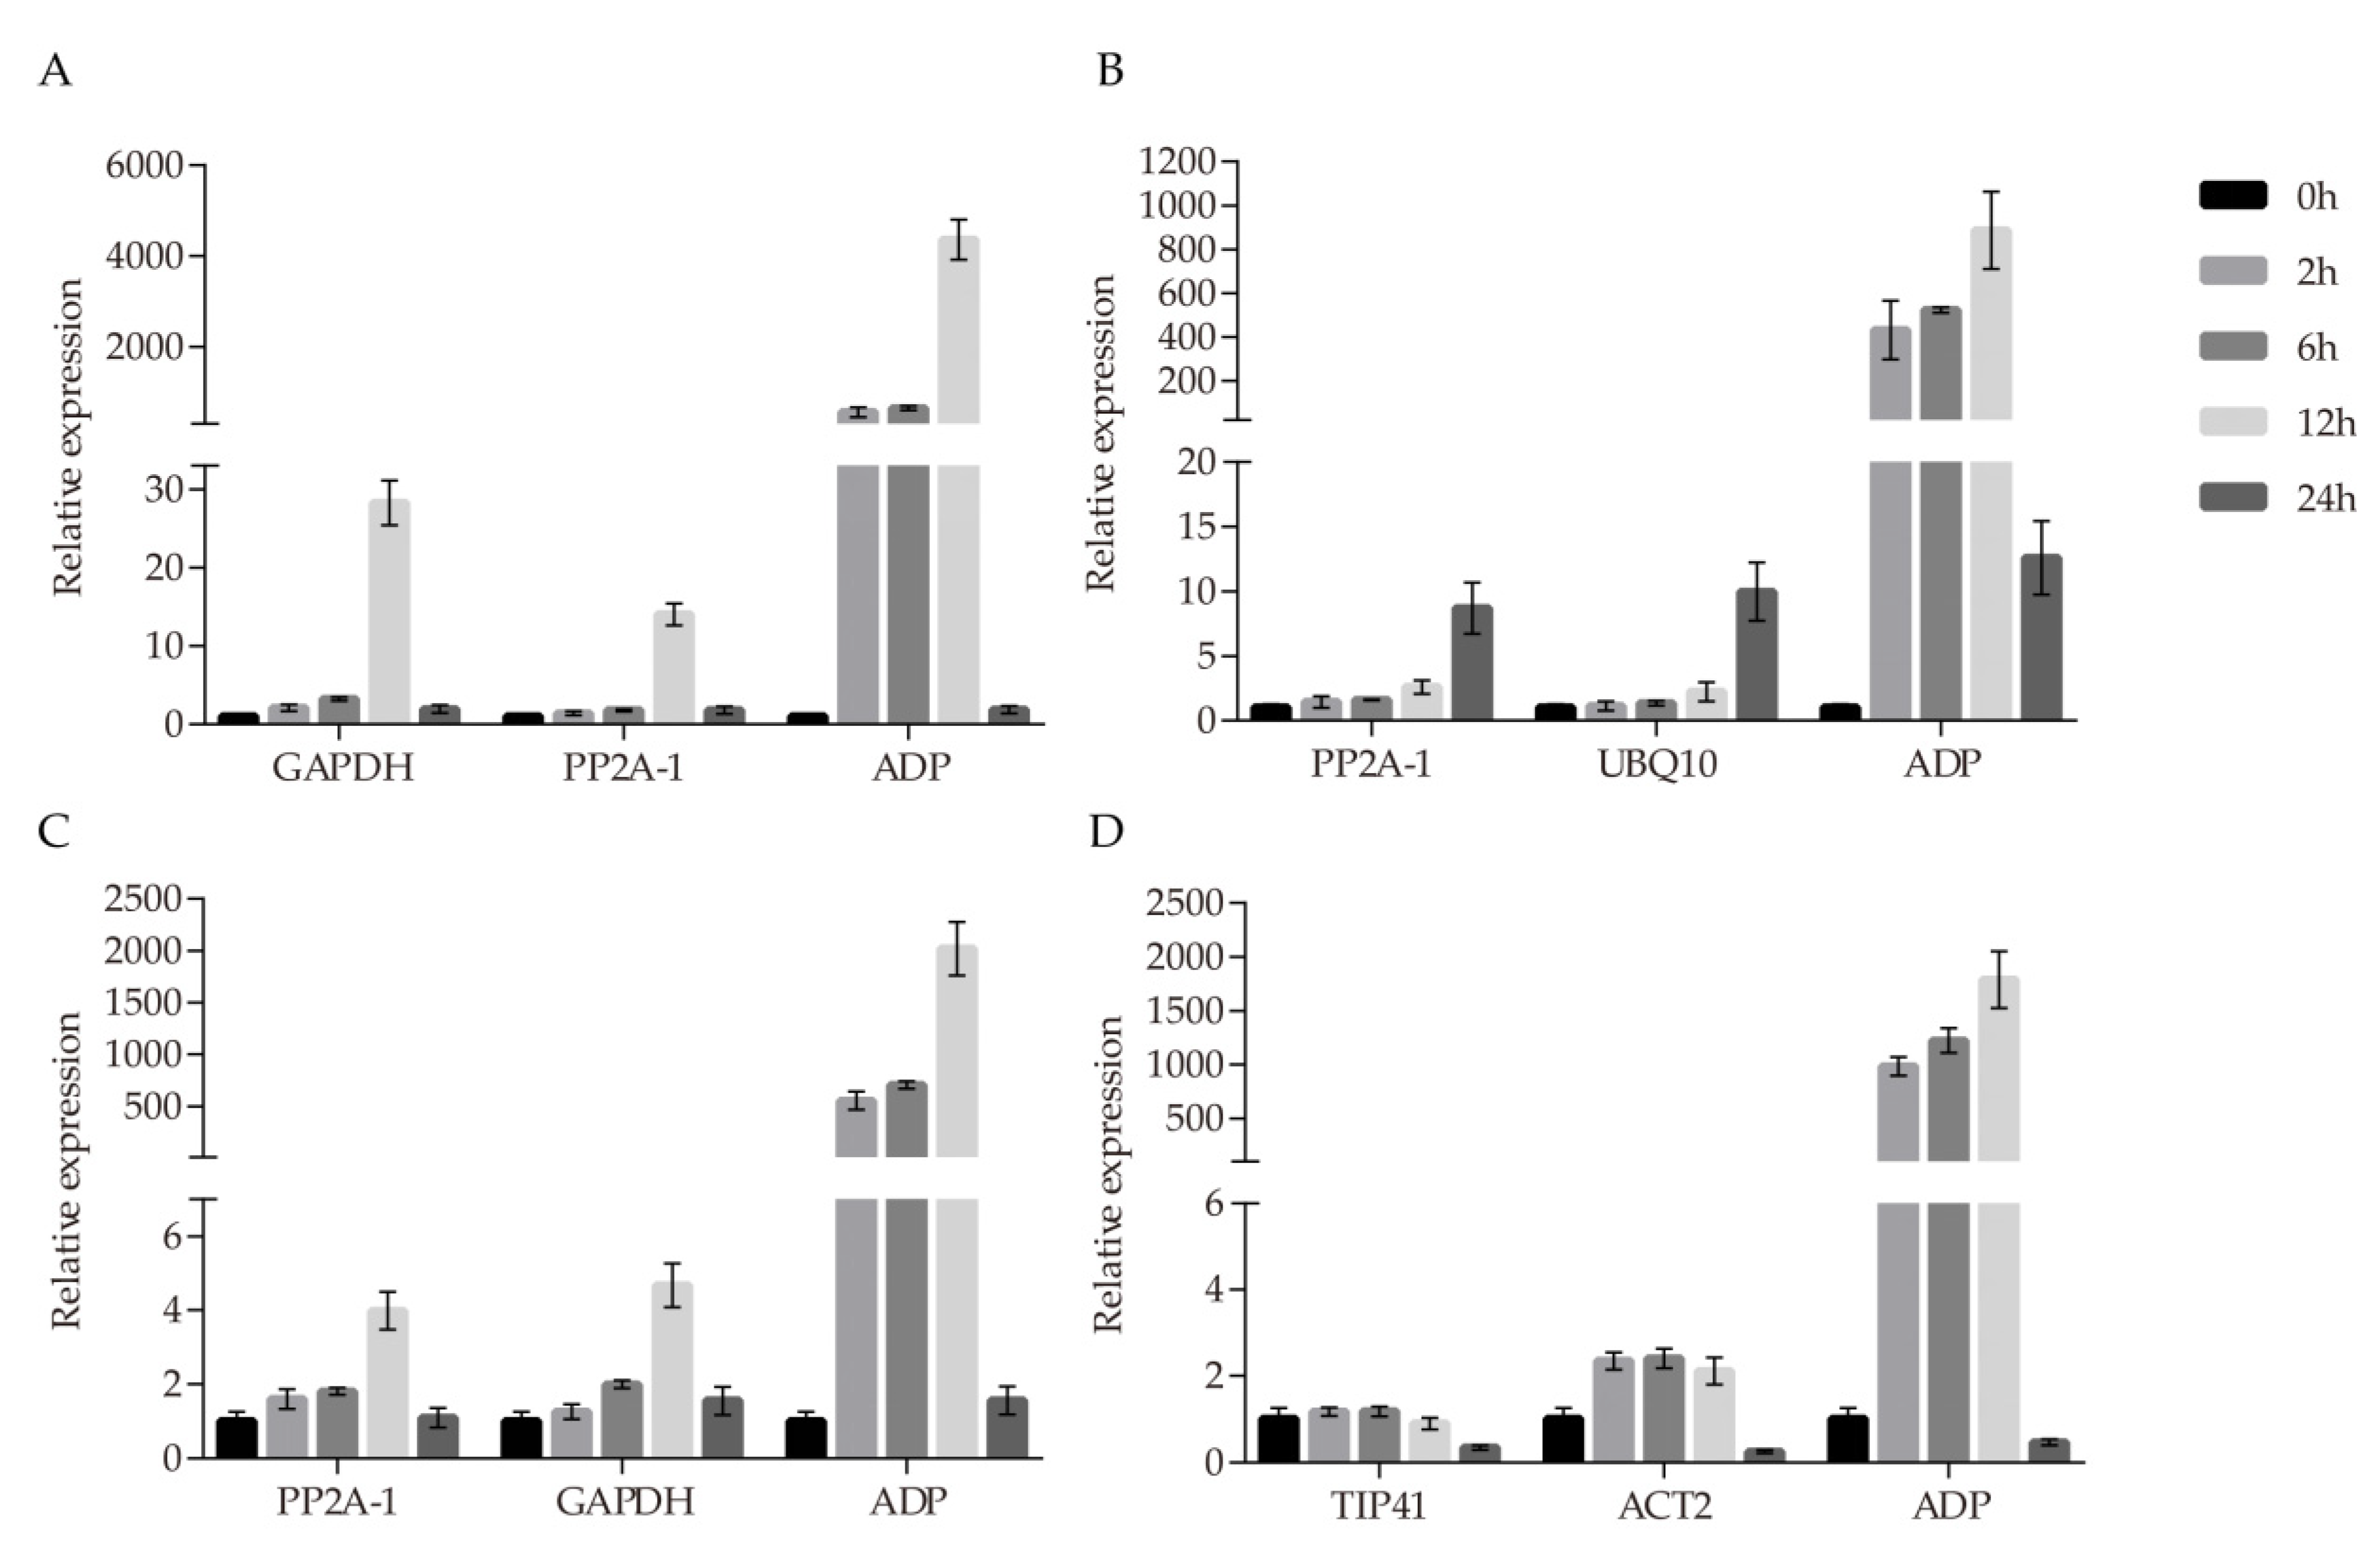
3.5. Validation of CAT Reference Gene

To verify the reliability of the selected reference genes, CAT was selected as a target gene. The expression of the antioxidant CAT gene is induced by many abiotic stresses, including chilling, drought, osmotic stress, and salt stress [39,40,41]. The CAT sequence was obtained from L. olgensis transcriptome data and showed 48.75% nucleotide identity with CAT from Arabidopsis. We used the comprehensive ranking results to select the top two stable RGs for normalization of CAT expression in L. olgensis needles. The selected RGs were PP2A-1 and GAPDH for drought and cold stress, PP2A-1 and UBQ10 for salt stress, and TIP41 and ACT2 for heat stress. As shown in Figure 5, the expression patterns of CAT showed few differences when different stable RGs were used. Similar expression patterns were obtained under drought and cold stress when GAPDH and PP2A-1 were used for normalization. CAT expression reached a peak at 12 h for both drought stress (<29-fold) and cold stress (<5-fold). When using the most stable RGs for salt stress PP2A-1 and UBQ10, CAT expression patterns were consistent, and the highest expression was observed at 24 h (no more than 10-fold). Under heat stress, CAT expression levels reached a similar peak at 6 h when normalized with TIP41 and ACT2. However, large differences in expression patterns were detected when the least stable RG, ADP, was used for normalization under the same stresses. Specifically, the expression levels of CAT were overestimated.

4. Discussion

Quantitative RT-PCR is an important technology that permits rapid and reliable quantification of gene expression [41]. Due to its high sensitivity, many experimental variables can easily affect the reliability of qRT-PCR gene expression results [4]. Therefore, to obtain more reliable results, an appropriate normalization strategy is very important. Among several methods [1,2], selection of one or more RGs as normalization factor(s) is the most common approach for different experimental conditions such as abiotic stress [38,42,43]. However, no research on RGs for L. olgensis under abiotic stress has been reported. In this study, we identified appropriate L. olgensis RGs under different abiotic stress conditions using qRT-PCR and parallel calculations in geNorm, Normfinder, Bestkeeper, and comprehensive analysis.
Sixteen potential RGs were identified from L. olgensis transcriptome data generated in our laboratory. Three statistical algorithms, geNorm, NormFinder, and BestKeeper, were used to assess the expression stability of candidate RGs for accurate normalization in gene expression studies [20]. In the geNorm analysis, M-values of the RGs under different experimental conditions were all less than 1.5 (except ADP in heat stress), indicating their potential expression stability [44]. The candidate RGs exhibited differential stability and relative rankings in response to different stresses. In two treatments, the most stable genes calculated by geNorm and Bestkeeper were consistent, namely GAPDH in drought and PP2A-1 in cold (Table 3 and Table 5). In salt and heat stress, the most stable genes calculated by the three algorithms differed. For heat stress, TIP41 and ACT2 were ranked as the most stable RGs according to the M-values calculated in geNorm. NormFinder regarded 18S as the most stable RG, and BestKeeper identified UBQ7 as the most stable RG; however, UBQ7 was ranked lower by geNorm and Normfinder (Table 3 and Table 4). The differences in ranking were mainly caused by variations in the algorithms of the three programs. Previous work has also shown that the three programs generate different results under abiotic stress in Vitis vinifera [45]. A comprehensive analysis is therefore necessary to provide ultimate stability rankings for RGs under different treatments, as reported previously [46,47].
Our comprehensive ranking results showed that PP2A-1 and GAPDH were the top two most stable RGs under drought and cold stress. PP2A-1 also ranked first under salt stress in the comprehensive analysis. Our findings confirm several previous studies in which PP2A-1 was also shown to be the most stable RG. These include studies of Pennisetum glaucum under different abiotic stresses and hormonal stimuli [48], Agrostis stolonifera under different abiotic stresses [49], P. euphratica under drought stress [50], and M. charantia under salt stress [51]. GAPDH also ranked as a highly suitable RG under drought and cold stress in this study. This result is in agreement with previous research on Caragana korshinskii under heat stress [46] and Coffea arabica leaves under drought stress and GA, SA, and MeJA treatments [52]. However, GAPDH was ranked as the least stable RG in various tissues and under abiotic stresses in Sorghum bicolor and in various tissues and under PEG6000 and MeJA treatments in Peucedanum praeruptorum [53,54]. These results demonstrate that there is no universal RG that is stably expressed in all treatments and tissues.
UBQ10 was also the most stable RG pair with PP2A-1 under salt stress. UBQ10 was also the most constitutively expressed polyubiquitin gene in A. thaliana across all development processes [44], in Prunus persica fruit at multiple developmental stages [55] and in Platycladus orientalis under NaCl and ABA treatments [56]. However, in O. sativa, UBQ10 was the least stable RG in different tissues, cell types, and developmental stages, a result similar to that observed in Glycine max [57]. In the present study, TIP41 and ACT2 showed highly stable expression under heat stress. In a previous work, TIP41 was a stable RG in M. charantia under UV and CuSO4 treatments [51] and in P. praeruptorum under NaCl stress [54]. No previous research has shown that TIP41 is the most stable RG under heat stress. ACT2 is a traditional housekeeping gene widely used in many species, such as Betula platyphylla under salt stress and Panicum virgatum L. leaves and roots [58,59]. In this study, ACT2 was an appropriate RG under heat stress, consistent with results from P. praeruptorum under heat stress [54]. Nonetheless, geNorm, NormFinder, and Bestkeeper all showed that ADP was the least stable RG under different experimental conditions. Previous studies have shown that ADP is the most stably RG in many species, such as Triticeae [60], Triticum aestivum L [61], and Swingle citrumelo [62]. However, ADP was recognized as the least stable gene by three algorithms for all samples in this study. Several papers have reported similar results. For example, GAPDH ranked the worst in T. aestivum but showed the most stability in V. vinifera cv. Cabernet Sauvignon [63,64]; UBI and ACT showed instability in S. lycopersicum [7], but performed suitably in T. aestivum [63]. These results indicate that the expression stabilities of RGs vary in different tissues and under environmental stresses.
Plant growth and development are generally affected by abiotic stresses (cold, heat, drought, and high salinity), and previous research has shown that CAT is the predominant enzyme controlling H2O2 levels. CAT has often been used as an abiotic-stress-inducible gene, upregulated by drought [40], cold [65], and salt [66] treatments. CAT1 exhibited increased expression in response to exogenous ABA and osmotic stress in maize [39], and its expression was activated by drought, ABA and salt stress in A. thaliana [67]. In this study, CAT expression was upregulated gradually and reached a maximum value at 24 h (≈10-fold upregulated) under salt stress when using the two most stable RGs, PP2A-1 and UBQ10, for normalization. The CAT expression pattern was consistent with previously reported responses of PgCAT1 to salt stress, which showed the highest PgCAT1 expression at 24 h [66] and the highest transcript levels as 10-fold [14]. However, the expression level of CAT was overestimated when the least stable RG, ADP, was used for normalization (Figure 5). Like salt stress, large differences were detected in CAT expression pattern when the least RG rather than the two most stable RGs was used for normalization under drought, cold, and heat stress (Figure 5). These results demonstrate that it is necessary to select a suitable stable RG for normalization of target gene expression under different conditions.
In this study, needles were used as the single material to test RGs in L. olgensis. The identified RGs may not apply to a broad range of developmental tissue samples of L. olgensis. For further studies, we will focus on exploring appropriate reference genes among different tissues and different developmental stages for accurate determination of gene expression in L. olgensis in further related research.

5. Conclusions

We selected 16 candidate RGs to validate suitable RGs using three statistical algorithms (geNorm, NormFinder, BestKeeper, and comprehensive analysis) for gene expression normalization in L. olgensis under drought, salt, cold, and heat stress. The results were compared and ranked using a comprehensive analysis. Based on the comprehensive analysis of gene stability, we identified PP2A-1 and GAPDH as the most stable RGs under drought and cold stresses and PP2A-1 and UBQ10 as the two most stable RGs under salt stress. TIP41 and ACT2 were the most stable RGs under heat stress, and ADP was the least stable RG under all stresses. Furthermore, the expression profiles of CAT confirmed the importance of using two suitable RGs rather than one unstable RG under different stresses. Selection of suitable RGs provides a foundation for functional genomic studies in L. olgensis and other woody plants under abiotic stress conditions.

Supplementary Materials

The following are available online at https://www.mdpi.com/1999-4907/11/2/193/s1, Figure S1: Agarose gel electrophoresis of PCR products for each of the 16 RGs and the one target genes in Larix olgensis., Figure S2: Melting curve for 16 RGs and one target gene CAT in L. olgensis, Figure S3: Average expression stability values (M-values) of the 16 RGs in L. olgensis calculated by geNorm. Table S1: Expression stability ranking of the 16 candidate reference genes under different abiotic stresses in L. olgensis.

Author Contributions

Conceptualization, D.L. and C.L.; experimental design: C.L.; material collection and performing the experiments: D.L., X.L., S.Y., M.Z., and J.Y.; data analysis: D.L. and S.Y.; software, D.L.; writing—original draft: D.L.; writing—review and editing: D.L. and C.L.; All authors approved the final draft. All authors have read and agreed to the published version of the manuscript.

Funding

This work was supported by the Fundamental Research Funds for the Central Universities of China (Grant No. 2572017AA04), the 111 Project (Grant No. B16010), the Genetically Modified Organisms Breeding Major Projects of China (Grant No. 2018ZX08020003), and Heilongjiang Touyan Innovation Team Program (Tree Genetics and Breeding Innovation Team).

Acknowledgments

We thank TopEdit (www.topeditsci.com) for the linguistic assistance during the preparation of this manuscript.

Conflicts of Interest

The authors declare that they have no competing interests.

References

  1. Miao, L.; Qin, X.; Gao, L.; Li, Q.; Li, S.; He, C.; Li, Y.; Yu, X. Selection of reference genes for quantitative real-time PCR analysis in cucumber (Cucumis sativus L.), pumpkin (Cucurbita moschata Duch.) and cucumber-pumpkin grafted plants. PeerJ 2019, 7, e6536. [Google Scholar] [CrossRef] [PubMed] [Green Version]
  2. Wong, M.L.; Medrano, J.F. Real-time PCR for mRNA quantitation. Biotechniques 2005, 39, 75–85. [Google Scholar] [CrossRef] [PubMed]
  3. Vandesompele, J.; De Preter, K.; Pattyn, F.; Poppe, B.; Van Roy, N.; De Paepe, A.; Speleman, F. Accurate normalization of real-time quantitative RT-PCR data by geometric averaging of multiple internal control genes. Genome Biol. 2002, 3, 532–538. [Google Scholar] [CrossRef] [PubMed] [Green Version]
  4. Dheda, K.; Huggett, J.F.; Bustin, S.A.; Johnson, M.A.; Rook, G.; Zumla, A. Validation of housekeeping genes for normalizing RNA expression in real-time PCR. Biotechniques 2004, 37, 112–119. [Google Scholar] [CrossRef] [PubMed] [Green Version]
  5. Chan, Z. Expression profiling of ABA pathway transcripts indicates crosstalk between abiotic and biotic stress responses in Arabidopsis. Genomics 2012, 100, 110–115. [Google Scholar] [CrossRef] [Green Version]
  6. Jain, M.; Nijhawan, A.; Tyagi, A.K.; Khurana, J.P. Validation of housekeeping genes as internal control for studying gene expression in rice by quantitative real-time PCR. Biochem. Biophys. Res. Commun. 2006, 345, 646–651. [Google Scholar] [CrossRef]
  7. Mascia, T.; Santovito, E.; Gallitelli, D.; Cillo, F. Evaluation of reference genes for quantitative reverse-transcription polymerase chain reaction normalization in infected tomato plants. Mol. Plant Pathol. 2010, 11, 805–816. [Google Scholar] [CrossRef]
  8. Zhou, Z.; Cong, P.; Tian, Y.; Zhu, Y. Using RNA-seq data to select reference genes for normalizing gene expression in apple roots. PLoS ONE 2017, 12, e185288. [Google Scholar] [CrossRef]
  9. Xu, M.; Zhang, B.; Su, X.; Zhang, S.; Huang, M. Reference gene selection for quantitative real-time polymerase chain reaction in Populus. Anal. Biochem. 2011, 408, 337–339. [Google Scholar] [CrossRef]
  10. Guenin, S.; Mauriat, M.; Pelloux, J.; Van Wuytswinkel, O.; Bellini, C.; Gutierrez, L. Normalization of qRT-PCR data: the necessity of adopting a systematic, experimental conditions-specific, validation of references. J. Exp. Bot. 2009, 60, 487–493. [Google Scholar] [CrossRef] [Green Version]
  11. Joseph, J.T.; Poolakkalody, N.J.; Shah, J.M. Plant reference genes for development and stress response studies. J. Biosci. 2018, 43, 173–187. [Google Scholar] [CrossRef] [PubMed]
  12. Sgamma, T.; Pape, J.; Massiah, A.; Jackson, S. Selection of reference genes for diurnal and developmental time-course real-time PCR expression analyses in lettuce. Plant Methods 2016, 12, 21. [Google Scholar] [CrossRef] [PubMed] [Green Version]
  13. Li, M.Y.; Song, X.; Wang, F.; Xiong, A.S. Suitable reference genes for accurate gene expression analysis in parsley (Petroselinum crispum) for abiotic stresses and hormone stimuli. Front. Plant Sci. 2016, 7, 1481. [Google Scholar] [CrossRef] [PubMed] [Green Version]
  14. Zhang, Y.; Han, X.; Chen, S.; Zheng, L.; He, X.; Liu, M.; Qiao, G.; Wang, Y.; Zhuo, R. Selection of suitable reference genes for quantitative real-time PCR gene expression analysis in Salix matsudana under different abiotic stresses. Sci. Rep. 2017, 7, 40290. [Google Scholar] [CrossRef] [Green Version]
  15. Andersen, C.L.; Jensen, J.L.; Orntoft, T.F. Normalization of real-time quantitative reverse transcription-PCR data: a model-based variance estimation approach to identify genes suited for normalization, applied to bladder and colon cancer data sets. Cancer Res. 2004, 64, 5245–5250. [Google Scholar] [CrossRef] [Green Version]
  16. Feng, K.; Liu, J.X.; Xing, G.M.; Sun, S.; Li, S.; Duan, A.Q.; Wang, F.; Li, M.Y.; Xu, Z.S.; Xiong, A.S. Selection of appropriate reference genes for RT-qPCR analysis under abiotic stress and hormone treatment in celery. PeerJ 2019, 7, e7925. [Google Scholar] [CrossRef]
  17. Ma, S.; Niu, H.; Liu, C.; Zhang, J.; Hou, C.; Wang, D. Expression stabilities of candidate reference genes for RT-qPCR under different stress conditions in soybean. PLoS ONE 2013, 8, e0075271. [Google Scholar] [CrossRef] [Green Version]
  18. Wan, Q.; Chen, S.; Shan, Z.; Yang, Z.; Chen, L.; Zhang, C.; Yuan, S.; Hao, Q.; Zhang, X.; Qiu, D.; et al. Stability evaluation of reference genes for gene expression analysis by RT-qPCR in soybean under different conditions. PLoS ONE 2017, 12, e0189405. [Google Scholar] [CrossRef] [Green Version]
  19. Migocka, M.; Papierniak, A. Identification of suitable reference genes for studying gene expression in cucumber plants subjected to abiotic stress and growth regulators. Mol. Breed. 2011, 28, 343–357. [Google Scholar] [CrossRef]
  20. Vasyutkina, E.A.; Reunova, G.D.; Tupikin, A.E.; Zhuravlev, Y.N. Mitochondrial DNA variation in Olga Bay larch (Larix olgensis A. Henry) from Primorsky Krai of Russia. Genetika 2014, 50, 291–298. [Google Scholar] [CrossRef]
  21. Zhu, J.; Yang, K.; Yan, Q.; Liu, Z.; Yu, L.; Wang, H. Feasibility of implementing thinning in even-aged Larix olgensis plantations to develop uneven-aged larch-broadleaved mixed forests. J. For. Res. 2010, 15, 71–80. [Google Scholar] [CrossRef]
  22. Shen, C.; Wang, L.; Li, M. The altitudinal variability and temporal instability of the climate-tree-ring growth relationships for Changbai larch (Larix olgensis Henry) in the Changbai mountains area, Jilin, Northeastern China. Trees 2016, 30, 901–912. [Google Scholar] [CrossRef] [Green Version]
  23. Guan, C.; Zhang, H.; Zhang, L.; Li, X.; Deng, J.; Jiang, T. Construction of genetic linkage maps of larch (Larix kaempferi × Larix gmelini) by rapd markers and mapping of QTLs for larch. Biotechnol. Biotechnol. Equip. 2011, 25, 2197–2202. [Google Scholar] [CrossRef] [Green Version]
  24. Hu, X.; Yang, J.; Li, C. Transcriptomic response to nitric oxide treatment in Larix olgensis Henry. Int. J. Mol. Sci. 2015, 16, 28582–28597. [Google Scholar] [CrossRef] [PubMed] [Green Version]
  25. Han, H.; Sun, X.; Xie, Y.; Feng, J.; Zhang, S. Transcriptome and proteome profiling of adventitious root development in hybrid larch (Lari kaempferi × Lari olgensis). BMC Plant Biol. 2014, 14, 305. [Google Scholar] [CrossRef] [PubMed] [Green Version]
  26. Zhao, J.; Xiong, H.; Wang, J.; Zhang, H.; Zhang, L. Mining Myb transcription factors related to wood development in Larix olgensis. J. For. Res. 2019. [Google Scholar] [CrossRef]
  27. Li, D.; Hu, X.; Li, C. Overexpression of the LoMYB29 gene of Larix olgensis contributes to the regulation of proanthocyanidin biosynthesis in Arabidopsis thaliana. J. For. Res. 2019, 30, 1793–1804. [Google Scholar] [CrossRef]
  28. Hu, X.; Xu, X.; Li, C. Ectopic expression of the LoERF017 transcription factor from Larix olgensis Henry enhances salt and osmotic-stress tolerance in Arabidopsis thaliana. Plant Biotechnol. Rep. 2018, 12, 93–104. [Google Scholar] [CrossRef]
  29. Chen, R.; Chen, W.; Tigabu, M.; Zhong, W.; Li, Y.; Ma, X.; Li, M. Screening and evaluation of stable reference genes for quantitative real-time polymerase chain reaction (qRT-PCR) analysis in Chinese fir roots under water, phosphorus, and nitrogen stresses. Forests 2019, 10, 1087. [Google Scholar] [CrossRef] [Green Version]
  30. Paschalidis, K.; Tsaniklidis, G.; Wang, B.; Delis, C.; Trantas, E.; Loulakakis, K.; Makky, M.; Sarris, P.F.; Ververidis, F.; Liu, J. The interplay among polyamines and nitrogen in plant stress responses. Plants 2019, 8, 315. [Google Scholar] [CrossRef] [Green Version]
  31. Nie, Q.; Gao, G.L.; Fan, Q.J.; Qiao, G.; Wen, X.P.; Liu, T.; Peng, Z.J.; Cai, Y.Q. Isolation and characterization of a catalase gene “HuCAT3” from pitaya (Hylocereus undatus) and its expression under abiotic stress. Gene 2015, 563, 63–71. [Google Scholar] [CrossRef] [PubMed]
  32. Tian, C.; Jiang, Q.; Wang, F.; Wang, G.L.; Xu, Z.S.; Xiong, A.S. Selection of suitable reference genes for qPCR normalization under abiotic stresses and hormone stimuli in carrot leaves. PLoS ONE 2015, 10, e117569. [Google Scholar] [CrossRef] [PubMed] [Green Version]
  33. Jaakola, L.; Pirttila, A.M.; Halonen, M.; Hohtola, A. Isolation of high quality RNA from bilberry (Vaccinium myrtillus L.) fruit. Mol. Biotechnol. 2001, 19, 201–203. [Google Scholar] [CrossRef]
  34. Pfaffl, M.W.; Tichopad, A.; Prgomet, C.; Neuvians, T.P. Determination of stable housekeeping genes, differentially regulated target genes and sample integrity: BestKeeper-Excel-based tool using pair-wise correlations. Biotechnol. Lett. 2004, 26, 509–515. [Google Scholar] [CrossRef]
  35. Li, M.Y.; Wang, F.; Jiang, Q.; Wang, G.L.; Tian, C.; Xiong, A.S. Validation and comparison of reference genes for qPCR normalization of celery (Apium graveolens) at different development stages. Front. Plant Sci. 2016, 7, 313. [Google Scholar] [CrossRef] [Green Version]
  36. Niu, X.; Qi, J.; Chen, M.; Zhang, G.; Tao, A.; Fang, P.; Xu, J.; Onyedinma, S.A.; Su, J. Reference genes selection for transcript normalization in kenaf (Hibiscus cannabinus L.) under salinity and drought stress. PeerJ 2015, 3, e1347. [Google Scholar] [CrossRef] [Green Version]
  37. VanGuilder, H.D.; Vrana, K.E.; Freeman, W.M. Twenty-five years of quantitative PCR for gene expression analysis. Biotechniques 2008, 44, 619–626. [Google Scholar] [CrossRef] [Green Version]
  38. Niu, X.; Qi, J.; Zhang, G.; Xu, J.; Tao, A.; Fang, P.; Su, J. Selection of reliable reference genes for quantitative real-time PCR gene expression analysis in Jute (Corchorus capsularis) under stress treatments. Front. Plant Sci. 2015, 6, 848. [Google Scholar] [CrossRef] [Green Version]
  39. Guan, L.M.; Zhao, J.; Scandalios, J.G. Cis-elements and trans-factors that regulate expression of the maize Cat1 antioxidant gene in response to ABA and osmotic stress: H2O2 is the likely intermediary signaling molecule for the response. Plant J. 2000, 22, 87–95. [Google Scholar] [CrossRef]
  40. Luna, C.M.; Pastori, G.M.; Driscoll, S.; Groten, K.; Bernard, S.; Foyer, C.H. Drought controls on H2O2 accumulation, catalase (CAT) activity and CAT gene expression in wheat. J. Exp. Bot. 2005, 56, 417–423. [Google Scholar] [CrossRef] [Green Version]
  41. Du, Y.Y.; Wang, P.C.; Chen, J.; Song, C.P. Comprehensive functional analysis of the catalase gene family in Arabidopsis thaliana. J. Integr. Plant Biol. 2008, 50, 1318–1326. [Google Scholar] [CrossRef] [PubMed]
  42. Bogdanovic, M.D.; Dragicevic, M.B.; Tanic, N.T.; Todorovic, S.I.; Misic, D.M.; Zivkovic, S.T.; Tissier, A.; Simonovic, A.D. Reverse transcription of 18S rRNA with poly (dT) (18) and other homopolymers. Plant Mol. Biol. Rep. 2013, 31, 55–63. [Google Scholar] [CrossRef]
  43. Zhu, P.; Ma, Y.; Zhu, L.; Chen, Y.; Li, R.; Ji, K. Selection of suitable reference genes in Pinus massoniana Lamb. under different abiotic stresses for qPCR normalization. Forests 2019, 10, 632. [Google Scholar] [CrossRef] [Green Version]
  44. Czechowski, T.; Stitt, M.; Altmann, T.; Udvardi, M.K.; Scheible, W.R. Genome-wide identification and testing of superior reference genes for transcript normalization in Arabidopsis. Plant Physiol. 2005, 139, 5–17. [Google Scholar] [CrossRef] [Green Version]
  45. Luo, M.; Gao, Z.; Li, H.; Li, Q.; Zhang, C.; Xu, W.; Song, S.; Ma, C.; Wang, S. Selection of reference genes for miRNA qRT-PCR under abiotic stress in grapevine. Sci. Rep. 2018, 8, 4444. [Google Scholar] [CrossRef] [PubMed]
  46. Yang, Q.; Yin, J.; Li, G.; Qi, L.; Yang, F.; Wang, R.; Li, G. Reference gene selection for qRT-PCR in Caragana korshinskii Kom. under different stress conditions. Mol. Biol. Rep. 2014, 41, 2325–2334. [Google Scholar] [CrossRef] [PubMed]
  47. Niu, X.; Chen, M.; Huang, X.; Chen, H.; Tao, A.; Xu, J.; Qi, J. Reference gene selection for qRT-PCR normalization analysis in kenaf (Hibiscus cannabinus L.) under abiotic stress and hormonal stimuli. Front. Plant Sci. 2017, 8, 771. [Google Scholar] [CrossRef] [Green Version]
  48. Saha, P.; Blumwald, E. Assessing reference genes for accurate transcript normalization using quantitative real-time PCR in pearl millet [Pennisetum glaucum (L.) R. Br.]. PLoS ONE 2014, 9, e0106308. [Google Scholar] [CrossRef] [Green Version]
  49. Chen, Y.; Hu, B.; Tan, Z.; Liu, J.; Yang, Z.; Li, Z.; Huang, B. Selection of reference genes for quantitative real-time PCR normalization in creeping bentgrass involved in four abiotic stresses. Plant Cell Rep. 2015, 34, 1825–1834. [Google Scholar] [CrossRef]
  50. Wang, H.L.; Chen, J.; Tian, Q.; Wang, S.; Xia, X.; Yin, W. Identification and validation of reference genes for Populus euphratica gene expression analysis during abiotic stresses by quantitative real-time PCR. Physiol. Plant 2014, 152, 529–545. [Google Scholar] [CrossRef]
  51. Wang, Z.; Xu, J.; Liu, Y.; Chen, J.; Lin, H.; Huang, Y.; Bian, X.; Zhao, Y. Selection and validation of appropriate reference genes for real-time quantitative PCR analysis in Momordica charantia. Phytochemistry 2019, 164, 1–11. [Google Scholar] [CrossRef]
  52. Barsalobres-Cavallari, C.F.; Severino, F.E.; Maluf, M.P.; Maia, I.G. Identification of suitable internal control genes for expression studies in Coffea arabica under different experimental conditions. BMC Mol. Biol. 2009, 10, 1. [Google Scholar] [CrossRef] [PubMed] [Green Version]
  53. Sudhakar, R.P.; Srinivas, R.D.; Sivasakthi, K.; Bhatnagar-Mathur, P.; Vadez, V.; Sharma, K.K. Evaluation of sorghum [Sorghum bicolor (L.)] reference genes in various tissues and under abiotic stress conditions for quantitative real-time PCR data normalization. Front. Plant Sci. 2016, 7, 529. [Google Scholar] [CrossRef] [PubMed]
  54. Zhao, Y.; Luo, J.; Xu, S.; Wang, W.; Liu, T.; Han, C.; Chen, Y.; Kong, L. Selection of reference genes for gene expression normalization in Peucedanum praeruptorum Dunn under abiotic stresses, hormone treatments and different tissues. PLoS ONE 2016, 11, e152356. [Google Scholar] [CrossRef] [PubMed] [Green Version]
  55. Tong, Z.; Gao, Z.; Wang, F.; Zhou, J.; Zhang, Z. Selection of reliable reference genes for gene expression studies in peach using real-time PCR. BMC Mol. Biol. 2009, 10. [Google Scholar] [CrossRef] [PubMed] [Green Version]
  56. Chang, E.; Shi, S.; Liu, J.; Cheng, T.; Xue, L.; Yang, X.; Yang, W.; Lan, Q.; Jiang, Z. Selection of reference genes for quantitative gene expression studies in Platycladus orientalis (Cupressaceae) using real-time PCR. PLoS ONE 2012, 7. [Google Scholar] [CrossRef] [PubMed] [Green Version]
  57. Jian, B.; Liu, B.; Bi, Y.; Hou, W.; Wu, C.; Han, T. Validation of internal control for gene expression study in soybean by quantitative real-time PCR. BMC Mol. Biol. 2008, 9, 59. [Google Scholar] [CrossRef] [PubMed] [Green Version]
  58. Li, Z.; Lu, H.; He, Z.; Wang, C.; Wang, Y.; Ji, X. Selection of appropriate reference genes for quantitative real-time reverse transcription PCR in Betula platyphylla under salt and osmotic stress conditions. PLoS ONE 2019, 14, e225926. [Google Scholar] [CrossRef]
  59. Huang, L.; Yan, H.; Jiang, X.; Zhang, X.; Zhang, Y.; Huang, X.; Zhang, Y.; Miao, J.; Xu, B.; Frazier, T.; et al. Evaluation of candidate reference genes for normalization of quantitative RT-PCR in switchgrass under various abiotic stress conditions. BioEnergy Res. 2014, 7, 1201–1211. [Google Scholar] [CrossRef]
  60. Gimenez, M.J.; Piston, F.; Atienza, S.G. Identification of suitable reference genes for normalization of qPCR data in comparative transcriptomics analyses in the Triticeae. Planta 2011, 233, 163–173. [Google Scholar] [CrossRef]
  61. Paolacci, A.R.; Tanzarella, O.A.; Porceddu, E.; Ciaffi, M. Identification and validation of reference genes for quantitative RT-PCR normalization in wheat. BMC Mol. Biol. 2009, 10, 11. [Google Scholar] [CrossRef] [PubMed] [Green Version]
  62. Carvalho, K.; de Campos, M.K.F.; Pereira, L.F.P.; Vieira, L.G.E. Reference gene selection for real-time quantitative polymerase chain reaction normalization in “Swingle” citrumelo under drought stress. Anal. Biochem. 2010, 402, 197–199. [Google Scholar] [CrossRef] [PubMed]
  63. Long, X.Y.; Wang, J.R.; Ouellet, T.; Rocheleau, H.; Wei, Y.M.; Pu, Z.E.; Jiang, Q.T.; Lan, X.J.; Zheng, Y.L. Genome-wide identification and evaluation of novel internal control genes for Q-PCR based transcript normalization in wheat. Plant Mol. Biol. 2010, 74, 307–311. [Google Scholar] [CrossRef] [PubMed]
  64. Reid, K.E.; Olsson, N.; Schlosser, J.; Peng, F.; Lund, S.T. An optimized grapevine RNA isolation procedure and statistical determination of reference genes for real-time RT-PCR during berry development. BMC Plant Biol. 2006, 6, 27. [Google Scholar] [CrossRef] [PubMed] [Green Version]
  65. Fadzillah, N.M.; Gill, V.; Finch, R.P.; Burdon, R.H. Chilling, oxidative stress and antioxidant responses in shoot cultures of rice. Planta 1996, 199, 552–556. [Google Scholar] [CrossRef]
  66. Purev, M.; Kim, Y.; Kim, M.K.; Pulla, R.K.; Yang, D. Isolation of a novel catalase (Cat1) gene from Panax ginseng and analysis of the response of this gene to various stresses. Plant Physiol. Biochem. 2010, 48, 451–460. [Google Scholar] [CrossRef]
  67. Xing, Y.; Jia, W.; Zhang, J. AtMEK1 mediates stress-induced gene expression of CAT1 catalase by triggering H2O2 production in Arabidopsis. J. Exp. Bot. 2007, 58, 2969–2981. [Google Scholar] [CrossRef]
Figure 1. Distribution of raw Cq values for the 16 candidate reference genes (RGs) across all Larix olgensis samples. The lines inside each box represent the medians. The outside box is determined from 25th to 97.5th percentiles. The top and bottom whiskers represent the highest and lowest Cq values, respectively.
Forests 11 00193 g001
Figure 2. Maximum, minimum, mean, and median Cq values of the 16 candidate reference genes across all samples.
Forests 11 00193 g002
Figure 3. Pairwise variation (Vn/Vn+1) values calculated by geNorm for samples from drought, salt, cold, and heat stress, and for the combination of all samples. The threshold value to determine the optimal number of RGs for qRT-PCR normalization is 0.15.
Forests 11 00193 g003
Figure 4. Comprehensive ranking of the 16 RGs in L. olgensis calculated as the geometric mean of three types of ranking (geNorm, NormFinder, and BestKeeper) for each sample group. (A) Drought stress. (B) Salt stress. (C) Cold stress. (D) Heat stress. (E) All samples.
Forests 11 00193 g004
Figure 5. Relative expression of LoCAT gene under abiotic stresses normalized using the top two stable RGs and one unstable RG. (A) Drought stress. (B) Salt stress. (C) Cold stress. (D) Heat stress.
Forests 11 00193 g005
Table 1. Selected candidate reference genes used in quantitative real-time polymerase chain reaction (qRT-PCR) analysis, with information on their Arabidopsis homologs.
GeneAccession NumberDescriptionArabidopsis Homolog LocusE-ValueIdentities
GAPDHMN905721Glyceraldehyde 3-phosphate dehydrogenaseAT1G134404 ×10−8180%
18SMN90572218S ribosomal RNAAT2G474200.00588%
ACT2MN905723Actin 2AT3G187804 ×10-14180%
TIP41MN905724TIP41-like proteinAT4G342704×10-1584%
EF-1aMN905725Elongation factor 1-alphaAT5G603904×10-10181%
TUBMN905726Tubulin beta-6AT5G12250082%
eIF-4αMN905727Eukaryotic translation initiation factor 4α-1AT3G13920081%
PP2A-1MN905728Protein phosphatase 2A-1AT1G598302×10-3182%
UBC9MN905729Ubiquitin-conjugating enzyme 9AT4G27966×10-6081%
UBQ10MN905730polyubiquitin 10AT4G0532010-16480%
PTBP1MN905731Polypyrimidine tractbinding proteinAT3G011507×10-1880%
TUAMN905732Tubulin alpha-2AT1G50010099%
ADPMN905733ADP-ribosylation factorAT1G0243010-10284%
HISMN905734HistoneAT5G109802×10-5281%
UBQ7MN905735Ubiquitin-like protein RUB2AT2G356353×10-3379%
ACT12MN905736Actin protein coding 12AT3G4652010-12480%
Target gene
CATMN905737catalaseAT4G211200.1485%
Table 2. Primers, amplicon characteristics and qRT-PCR parameters for candidate reference genes and target gene.
Gene SymbolPrimer Sequence (5′–3′) Forward/ReverseAmplicon Length
(bp)
R2PCR Efficiency (%)SDCV
GAPDHATTGGAAGACTCGTCGCTCG/ACCGAAAACAGCCACAGGTT2010.9949104.131.105.11
18SCAGCGCCATCAAGGAGGAAT/ACCATGCGAGGATCCAACC2090.9997103.430.923.18
ACT2TGAGCTACGAGTTGCTCCAG/GGCGACATACATTGCAGGTG1300.9982100.530.642.56
TIP41ATGCCCGTCAAGAATGGGAG/TCAACGGGTGGTAAGGCTTC1660.992299.790.833.06
EF-1aTGTGTTGGACTGCCACACTT/TGGGTTTGGAGGGCATCATC1520.9972103.431.406.12
TUBTGGTACCATGGATAGCGTGC/TGCCCCTTAGCCCAATTGTT1050.9924100.071.234.36
eIF-4αGCTCTTTGCAAGCTATGATG/CACATCAAGACCCTTGCAGA1510.995899.931.406.12
PP2A-1GGAGACATCCATGGGCAGTT/ACGACACGGTCTCAACAGG1300.993399.980.662.47
UBC9TCCCTATGCAGGGGGTGTAT/GGATCCGTCAACAAGGAGCA2100.991898.351.154.95
UBQ10GATGGACGTACTCTCGCTGA/AAAATCGCCACCACGAAGAC810.999299.291.044.55
PTBP1CCCGTCGAAGGTTTTGCATC/AGCCTGGTTATGGTTGGCTC1300.9994101.120.712.78
TUAATAAGACAGTTGGCGGTGGG/TGCTCTGGGTGAAAGAGCTG1570.9992105.621.234.98
ADPACCAAGCTCTTTCAGCGTCT/GGTCGTCTTACCAGCAGCAT810.9957108.721.335.94
HISCGAGGCTTACCTTGTAGGGC/CCCTTTCACCGCGAATCCTT1160.997899.51.064.77
UBQ7CTCCTGTGCAACAGAGGCTT/TAATGACCACCACGTAGGGC1240.997899.660.863.54
ACT12CTTGCCGGTCGGGATTTAAC/TTCCAGGGAGGAACTGGTCT1740.996396.850.893.70
Target gene
CATTGCTCACCGTGCTGCATCTA/GCGGCATTGAACACCCCATT1480.9918100.38
Table 3. Expression stability of candidate reference genes calculated by geNorm.
RankDroughtSaltColdHeatTotal
GeneStabilityGeneStabilityGeneStabilityGeneStabilityGeneStability
1GAPDH0.25PP2A-10.14PP2A-10.20TIP410.48PP2A-10.47
218S0.25UBQ100.14GAPDH0.20ACT20.48ACT20.47
3PP2A-10.31UBC90.27TIP410.22PTBP10.51TIP410.53
4UBQ100.3518S0.29PTBP10.24eIF-4α0.66PTBP10.57
5UBC90.39TIP410.3118S0.2618S0.7318S0.61
6TIP410.41eIF-4α0.34ACT20.28HIS0.79eIF-4α0.63
7EF-1α0.42EF-1α0.37UBQ100.29UBC90.86UBC90.67
8eIF-4α0.45TUB0.40ACT120.33UBQ100.92UBQ100.71
9ACT120.48PTBP10.42eIF-4α0.36TUB0.96GAPDH0.73
10ACT20.50ACT20.45UBC90.40PP2A-11.03HIS0.75
11PTBP10.53GAPDH0.47EF-1α0.45UBQ71.07ACT120.77
12TUB0.56UBQ70.50UBQ70.51GAPDH1.12UBQ70.80
13TUA0.61ACT120.53HIS0.55TUA1.17TUA0.84
14HIS0.67TUA0.59TUA0.66ACT121.22EF-1α0.88
15UBQ70.72HIS0.66TUB0.75EF-1α1.28TUB0.93
16ADP1.11ADP1.06ADP1.15ADP1.64ADP1.10
Table 4. Gene expression stability in L. olgensis. under multiple stress treatments, as ranked by the software program NormFinder.
RankDroughtSaltColdHeatTotal
GeneStabilityGeneStabilityGeneStabilityGeneStabilityGeneStability
1PP2A-10.08ACT20.06GAPDH0.0718S0.2018S0.15
218S0.0918S0.0718S0.10PTBP10.24UBC90.27
3GAPDH0.09UBC90.07UBC90.12ACT20.41PTBP10.28
4eIF-4α0.13PP2A-10.07PP2A-10.12UBC90.41TIP410.38
5UBQ100.17UBQ100.14ACT20.18TUB0.45eIF-4α0.39
6UBC90.22eIF-4α0.15UBQ100.23eIF-4α0.48UBQ100.39
7TIP410.25GAPDH0.16TIP410.24TIP410.60ACT20.39
8ACT20.29TIP410.20eIF-4α0.25UBQ100.61PP2A-10.42
9EF-1α0.31EF-1α0.28PTBP10.28HIS0.68GAPDH0.46
10TUA0.41TUB0.31EF-1α0.35TUA0.68HIS0.47
11ACT120.42PTBP10.39ACT120.44GAPDH0.76ACT120.57
12TUB0.43ACT120.48UBQ70.65PP2A-10.79TUA0.59
13PTBP10.44UBQ70.49HIS0.71UBQ70.95UBQ70.61
14UBQ70.72TUA0.55TUA0.73EF-1α1.04EF-1α0.66
15HIS0.79HIS0.87TUB0.74ACT121.05TUB0.71
16ADP2.68ADP2.70ADP2.75ADP2.84ADP1.50
Table 5. Gene expression stability in L. olgensis. under multiple stress treatments, as ranked by the software program BestKeepers.
RankDroughtSaltColdHeatTotal
GeneSDCVGeneSDCVGeneSDCVGeneSDCVGeneSDCV
1GADPH0.170.79PP2A-10.170.65PP2A-10.401.51UBQ70.291.22ACT20.542.17
2PTBP10.632.43UBQ100.190.84ACT120.421.74TIP410.431.60PP2A-10.582.18
3HIS0.662.90PTBP10.230.93PTBP10.441.72ACT20.602.42PTBP10.672.60
4ACT20.692.74TIP410.230.88ACT20.461.84PP2A-10.662.52TIP410.772.84
5ACT120.853.43ACT120.301.24TIP410.471.73PTBP10.813.14UBQ70.793.23
6TUB0.873.12UBC90.351.5418S0.531.88GAPDH0.934.51ACT120.853.54
7PP2A-10.883.2618S0.361.29eIF-4α0.542.23eIF-4α0.994.13GAPDH0.864.02
8UBQ100.903.91UBQ70.361.52UBQ100.562.49ACT121.054.4318S0.903.11
918S1.093.74EF-1α0.421.90GAPDH0.602.89HIS1.064.73eIF-4α0.903.70
10UBQ71.134.46eIF-4α0.421.77UBQ70.763.11TUA1.144.65HIS1.024.59
11EF-1α1.154.96TUB0.521.93HIS0.763.40TUB1.194.14UBQ101.024.48
12eIF-4α1.164.60ACT20.532.14UBC90.944.0918S1.324.59UBC91.154.94
13TIP411.184.24HIS0.572.67EF-1α0.954.24UBC91.556.67TUB1.204.25
14UBC91.205.06GAPDH0.602.84TUA1.074.48UBQ101.737.48TUA1.224.93
15TUA1.395.56TUA0.873.67TUB1.655.86EF-1α2.159.18ADP1.265.62
16ADP3.2815.30ADP2.8714.06ADP3.1014.77ADP3.2515.22EF-1α1.396.07
Table 6. Gene expression stability ranked by the comprehensive ranking method in L. olgensis.
RankDrought Salt Cold Heat Total
GeneStabilityGeneStabilityGeneStabilityGeneStabilityGeneStability
1GAPDH1.44PP2A-12.00PP2A-11.59TIP412.41ACT22.41
2PP2A-12.76UBQ102.15GAPDH2.62ACT22.62PP2A-12.52
318S3.30UBC93.7818S3.91PTBP13.11PTBP13.30
4UBQ105.4318S3.83TIP414.7218S3.9118S3.42
5PTBP16.59ACT24.93PTBP14.76UBQ75.23TIP413.63
6ACT26.84TIP415.43ACT24.93eIF-4α5.52UBC95.52
7eIF-4α7.27PTBP16.67ACT125.60UBC97.14eIF-4α6.46
8UBC97.49eIF-4α7.11UBQ106.95PP2A-17.83UBQ108.08
9ACT127.91EF-1α8.28UBC97.11HIS7.86GAPDH8.28
10TIP418.17ACT129.21eIF-4α7.96TUB7.91ACT128.99
11HIS8.57TUB9.58EF-1α11.27GAPDH9.25UBQ79.21
12EF-1α8.85GAPDH10.25UBQ711.29UBQ109.64HIS10.00
13TUB9.52UBQ710.77HIS12.30TUA10.91TUA12.97
14TUA12.49HIS14.30TUA14.00ACT1211.89TUB14.30
15UBQ712.81TUA14.33TUB15.00EF-1α14.66EF-1α14.64
16ADP16.00ADP16.00ADP16.00ADP16.00ADP15.66

