1. Introduction
Pinus brutia Ten. is abundant throughout the Eastern Mediterranean area as it is a characteristic species of that region [
1,
2,
3]. It is widespread in Cyprus, accounting 90% of the island total forest area, covering 175,000 ha [
4,
5,
6]. The population of
P. brutia in Cyprus is peripheral and is characterized with high genetic diversity, consisted of different sub-populations [
7]. It is a tree of great economic and ecological importance for the country [
5,
6,
8]. In Greece, it is one of the pine species that has been used in reforestations of peri-urban forests [
9,
10,
11].
Pinus brutia is a light demanding, fast growing and site insensitive tree species that can grow in most soil types [
3,
12]. It is a well-adapted species to semi-arid conditions of the Mediterranean area [
13]. The short juvenile phase of the species [
14] justifies the fact that its flowering can begin in the second year and a normal cone development has been observed in 7-year-old trees [
15]. However, Boydak [
12] based in an old bibliography states that a normal cone development has been observed even in 4-year-old trees.
Pinus brutia is an obligate seeder, therefore the regeneration of this species is totally dependent upon seedling recruitment [
16,
17].
In many cases, the occurrence of
P. brutia regeneration is not adequate, mainly due to the harsh environmental conditions of the growing season in Cyprus [
18,
19].
In lower and middle elevations of Cyprus, only in few cases, dense or rather dense young
P. brutia formations established in open areas (in bare ground) are observed (personal observations). Petrou and Milios [
19], in middle elevations of central Cyprus found that in open areas (bare ground) all the newly established seedlings had died by the end of the first growing season. On the other hand, they refer that nurse plants such as
P. brutia trees and low shrubs facilitate the establishment and the survival of
P. brutia seedlings. In that context, they recommend the use of facilitation process in the silvicultural treatments of
P. brutia forests in Cyprus.
According to Thanos [
20],
P. brutia displays a variable attribute in seed germination regarding timing of seedling emergence depending on the altitude and latitude of the provenance. Generally, if the climatic conditions are suitable, the seeds of
P. brutia germinate throughout the rainy season [
16,
21].
Facilitation in plant communities is related to creation of favorable micro-habitats by the benefactor plant(s) and thus a great research interest has emerged regarding determination of the specific facilitative processes [
22,
23,
24,
25]. However, in harsh environments where regeneration of the dominant species is problematic, research regarding practical measures for the preservation of the existent vegetation is necessary. In this effort, facilitation process can be used as a tool in the development of applied techniques that can be used for the amelioration of the harsh conditions that the newly establish plants confront (see [
26]). These techniques can be incorporated in the forestry practice of regions that are or will be under the threat of ecosystem degradation as a result of climate change [
26]. Cyprus is a such case, and particular
P. brutia formations in the middle elevations of central Cyprus.
In various forest species, most studies of seed germination and of the factors that influence it, are conducted in controlled environment in laboratories and in nurseries [
27]. The same has been observed in
P. brutia studies since all the relevant studies were taken place in nurseries and in laboratories (e.g., [
28,
29,
30,
31]).
Based on the results of the aforementioned studies treatments for the best seedling production in nurseries are mainly proposed, while in some cases measures for a successful sowing in the field are recommended. On the contrary, in the present study, the germination of P. brutia seeds in the field was investigated.
The acquired information can be incorporated in the future treatments for the regeneration of harsh sites with P. brutia. The aim of this study was to analyze the germination of P. brutia seeds, in the field, in relation to factors such as period-season of sowing, light environment, and watering in sites of different productivity in the middle elevations in central Cyprus. The acquired knowledge can be the first step upon which silvicultural treatments can be based in order to successfully regenerate P. brutia formations using the facilitation process.
4. Discussion
The germination percentages in the LSP (late sowing period) were very low in all sites (
Table 4). On the contrary, in the ESP (early sowing period) the germination percentages were very high in each of the studied sites (
Table 5). In both G and UC sowing environments of ESP, the percentages of the germinated seedlings were very high. The difference in the density of germinated seeds between the G and the UC sowing environments in site B (30.79 versus 33.50 germinated seeds per plot), from a practical point of view, is not so important.
It is obvious that the season—period of sowing of
P. brutia seeds is very important for seed germination. In ESP a large germination rate was ensured. In that case, the seed germination began at the end of February and lasted up to the end of March. The results of the present study fully agree with what Eron [
50] reported for Turkey. He claimed that the germination of
P. brutia seeds starts in February at middle elevations (350–650 m a.s.l.). Moreover, he reported that the germination occurs in November, at lower elevations (250–300 m a.s.l.) and in April at higher elevations (700–800 m a.s.l). This heterogeneity in seed germination indicates different degrees of dormancy among seeds of the same or different populations [
12]. This attribute can be explained as an adaptation for seedling survival where seed germination is delayed until well into rainy season when water availability is ensured [
20].
In the wider study area of this research, the
P. brutia seeds germinate naturally from late February to March (personal observations). No seeds’ germination has been observed during October–November. Maybe this happens due to the fact that the dry season, in the studied area, starts at May and lasts until the end of October [
33].
Even though
P. brutia exhibits a heterogeneity regarding the season of seed germination [
12,
20], generally the germination in the field takes place successfully during the rain period when the temperatures are also favorable [
16,
21]. In laboratory conditions, the most favorable temperature range for the germination of
P. brutia seeds is between 15–20 °C [
51,
52,
53]. However, the highest germination rates are reached at 20 °C [
28,
52,
54,
55].
Soil temperature was one of the factors that played an important role in seed germination in the present study too. The mean soil temperature in the plots that were established the in gap sowing environment (G) during the seed germination period of the LSP in all sites was over 30 °C (
Table 6). This explains the low seed germination in that sowing environment, since the germination of
P. brutia seeds is dramatically reduced in the temperature of 25 °C [
28,
52].
In all plots, the seeds were sowed in a depth of 0.5 cm. As a result, the moisture of the surface soil in the plots of the gap sowing environment where water supplementation was applied every 15 days (G and W+) evaporated in a short time, due to the relatively high temperatures. This seems to explain why the additional water did not have a positive effect on seed germination, as any adverse effects of high soil temperatures were not mitigated by the watering treatment. Soil moisture is a very important factor that greatly affects the seed germination [
56]. If the soil moisture decreases significantly, then the germination of the seeds is either delayed or stopped completely, depending on the duration of the period when the seeds are undergoing this reduction [
57]. Boydak et al. [
29], who studied the effect of water stress on the germination of seeds of six
P. brutia provenances in Turkey found that decreasing water potential also reduced seed germination, showing that water stress inhibits seed germination. The same results were found in a study by Sevik and Erturk [
31], which studied the effect of water stress on the germination of seeds of 14 provenances of
P. brutia in Turkey.
During the seed germination period of LSP in the plots that were established in the under canopy (UC) sowing environment, the mean soil temperature did not exceed 22 °C in any of the three sites (
Table 6). It has also been shown that the ability to retain soil moisture under shrubs is greater than in bare soil [
58,
59]. Thus, these favorable soil temperatures, in combination with the satisfactory soil surface moisture, both on the surfaces where watering was applied and on those that received only rainwater, led to the germination of a larger number of seeds (
p < 0.05) in UC compared to G sowing environment (
Table 2). On the other hand, shading conditions under tree canopies lead to low germination rates of
P. brutia seeds (see [
20]). Thus, the late germination of seeds from the LSP and the fact that the period of favorable conditions was short, given that soil temperatures from mid-May onwards become a possible deterrent to the germination of seeds even under the crowns of trees, [
19,
33] did not allow a large percentage of seeds to germinate in UC sowing environment (as in the ESP).
The germination percentages of
P. brutia seeds in ESP were very high in both G and UC sowing environments in the three sites (A, B, and C). On the one hand, the early December sowing (ESP) gave substantially longer time with favorable conditions (temperature–
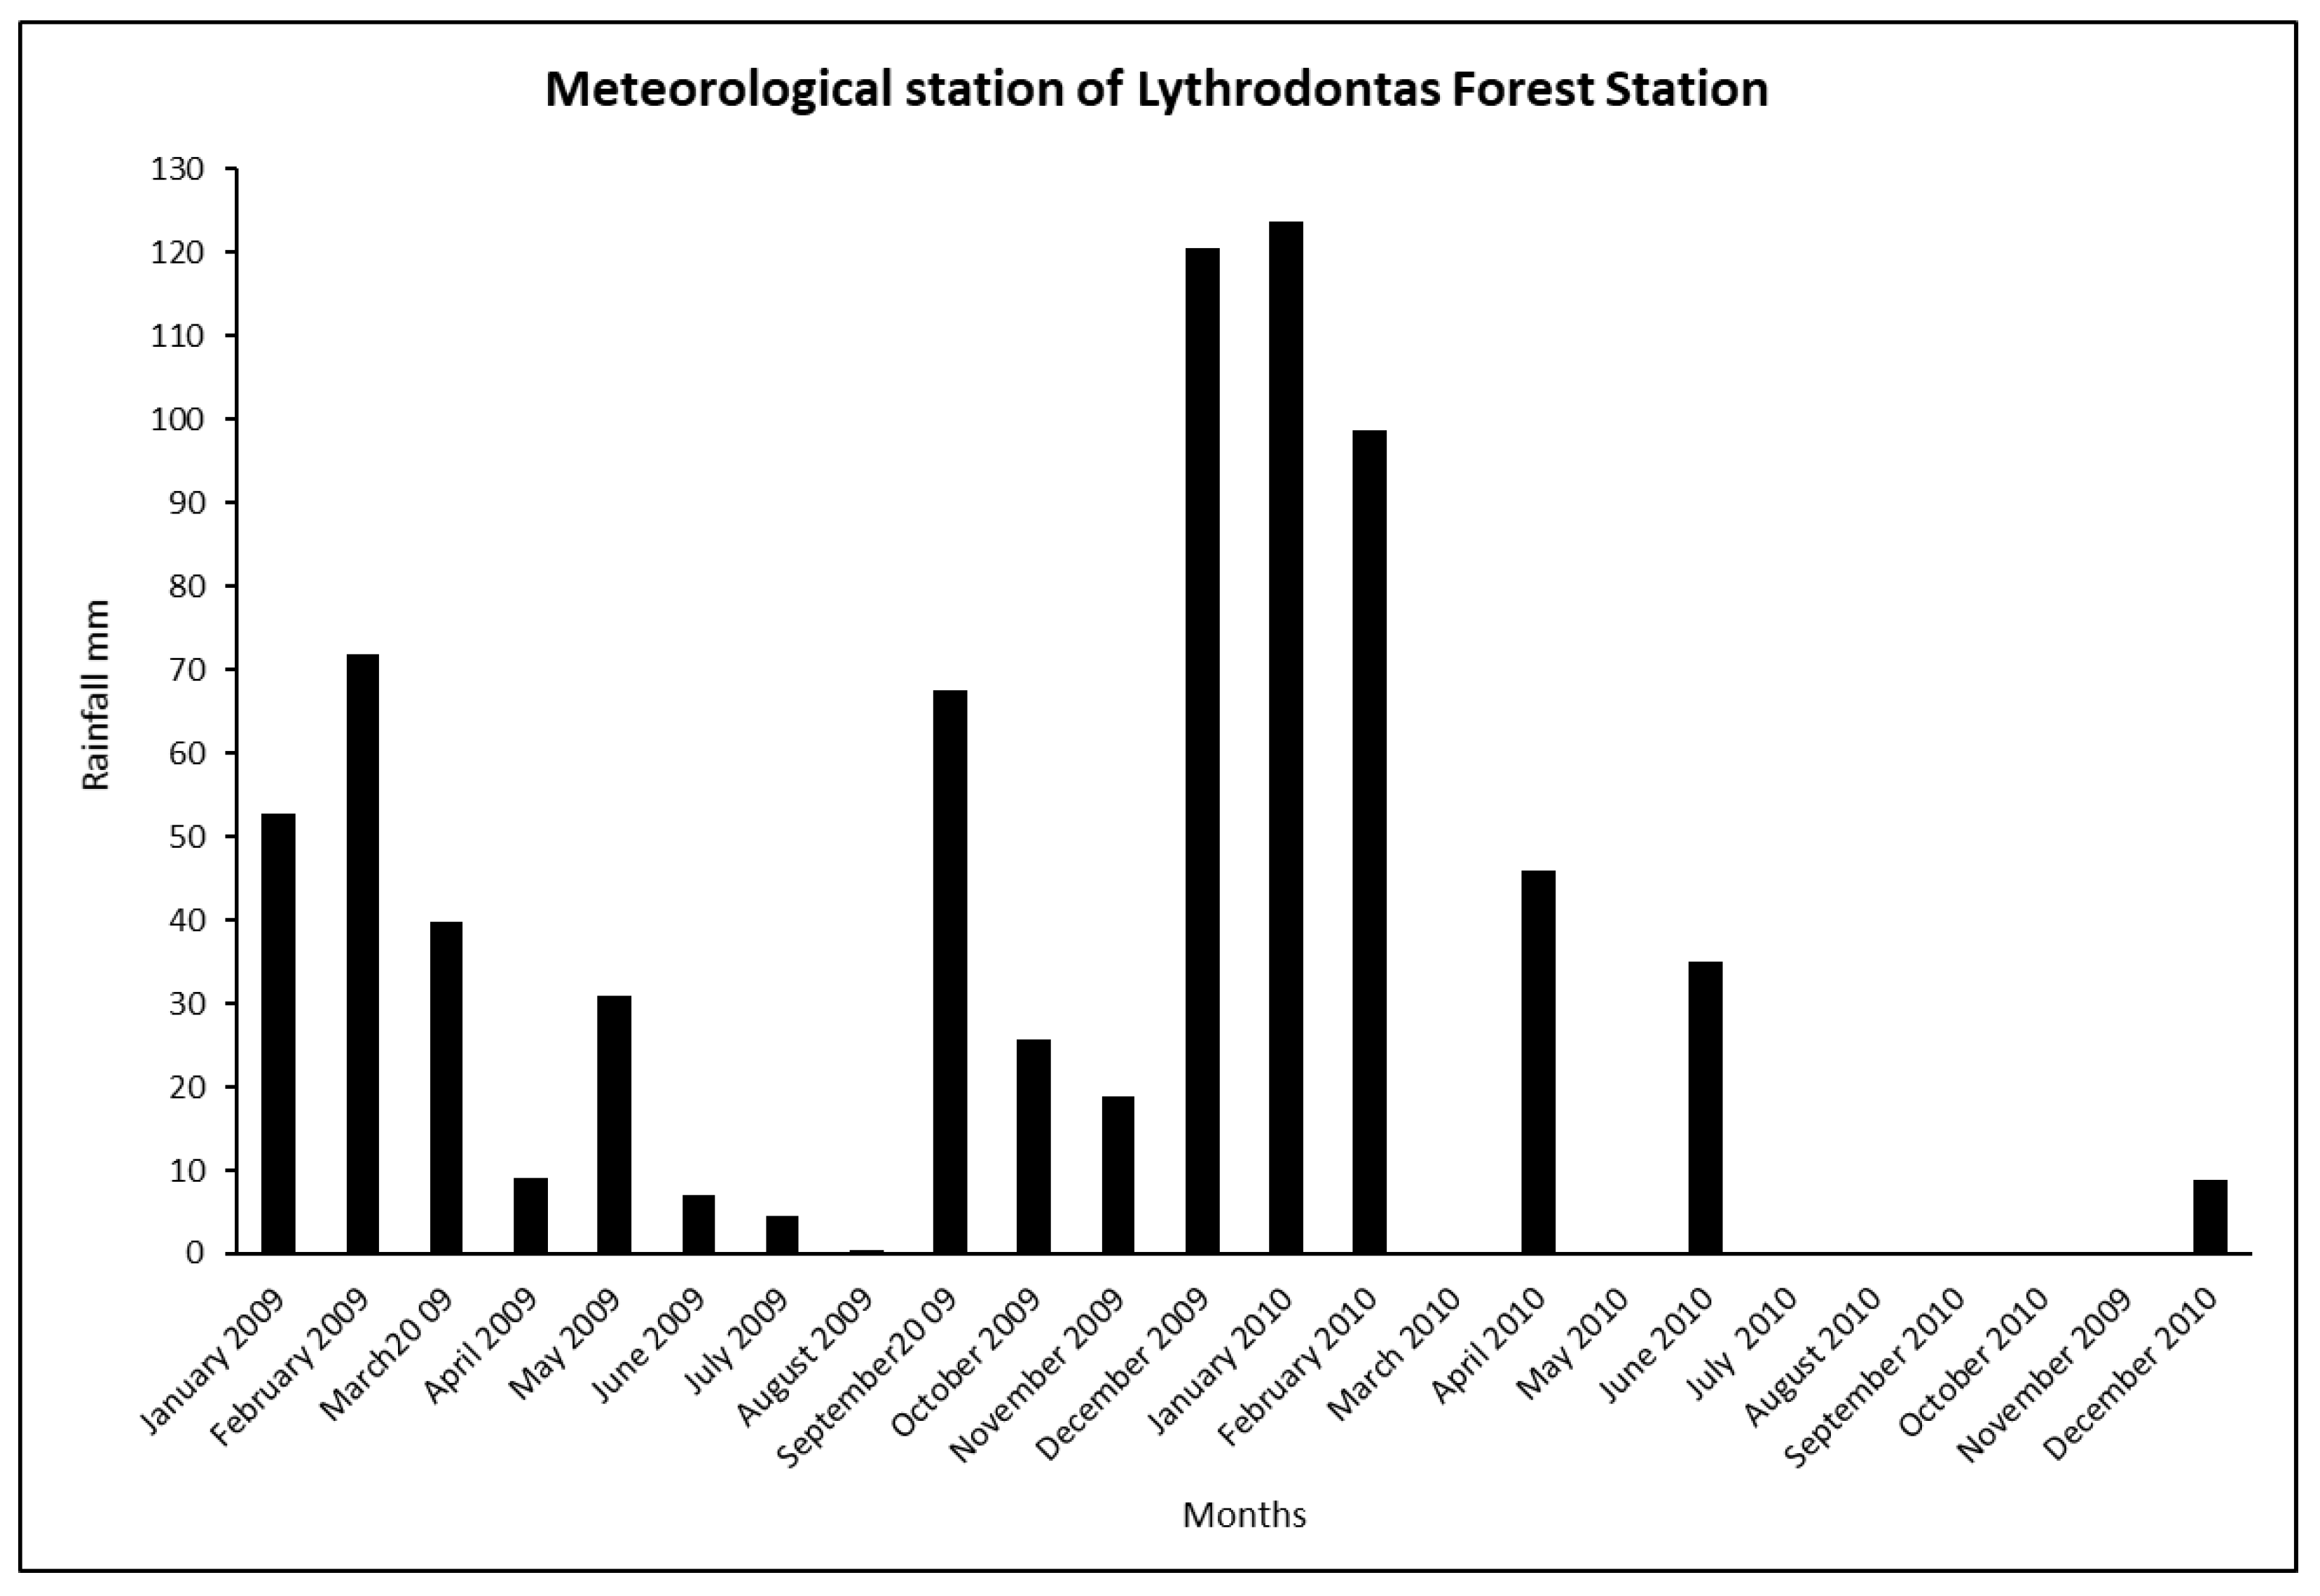
Table 7 and moisture) and thus led to high germination rates in both sowing environments. The water from the rainfall of winter months, especially of February 2010 (
Figure 1) was stored in soil and probably provided the adequate moisture for seed germination, while evaporation probably was low during the ESP. On the other hand, the seeds that were planted in December experienced low winter temperatures, which is a factor that favors the germination of the seeds when the temperatures start to rise again at the end of winter and the beginning of spring. Skordilis and Thanos [
28] report that the seeds of some
P. brutia provenances are dormant (see also [
20]) and thus their germination is favored by the low winter temperatures, which lead to the breakage of dormancy. As soon as the temperatures become favorable (early spring), there is a strong germination of the seeds of
P. brutia. In addition, Escudero et al. [
60], who studied the germination of seeds for seven pine species in Spain, found that low temperatures favored the germination of seeds of four pines species—namely,
P. halepensis,
P. pinaster, and
P. pinea—which are low-altitude pines widely distributed in the Mediterranean Basin and
P. canariensis which is endemic to Canary Islands. Thus, the above researchers hypothesized that the low temperatures prevailing during the rainy period of winter will favor the germination of seeds in the field of most of the above species.
As mentioned above, in ESP, the germination percentages of
P. brutia seeds were high even under shade in UC sowing environment (see Vs values in the UC sowing environment in
Table 1). This contradicts what Thanos and Skordilis [
52] and Thanos [
20] state that in shady conditions created under the canopy of trees, the germination of
P. brutia seeds is greatly inhibited. The above researchers came to this conclusion, after a study in the laboratory under controlled conditions, which simulated the conditions (far-red light) that prevail under the canopy of trees. This, may show a different response to light conditions to seed germination between the different provenances of
P. brutia. Probably, the coexistence of all the other favorable conditions mentioned above during the germination of seeds from the December sowing (ESP) outweighed any negative effects that shading can cause and thus the germination rate of the seeds was high, even in the UC sowing environment. Similar results have been found for
P. pinea, which is also a light demanding species, where the germination of its seeds was not affected by light conditions, since their germination rates were high, even in conditions of intense shading [
61,
62].
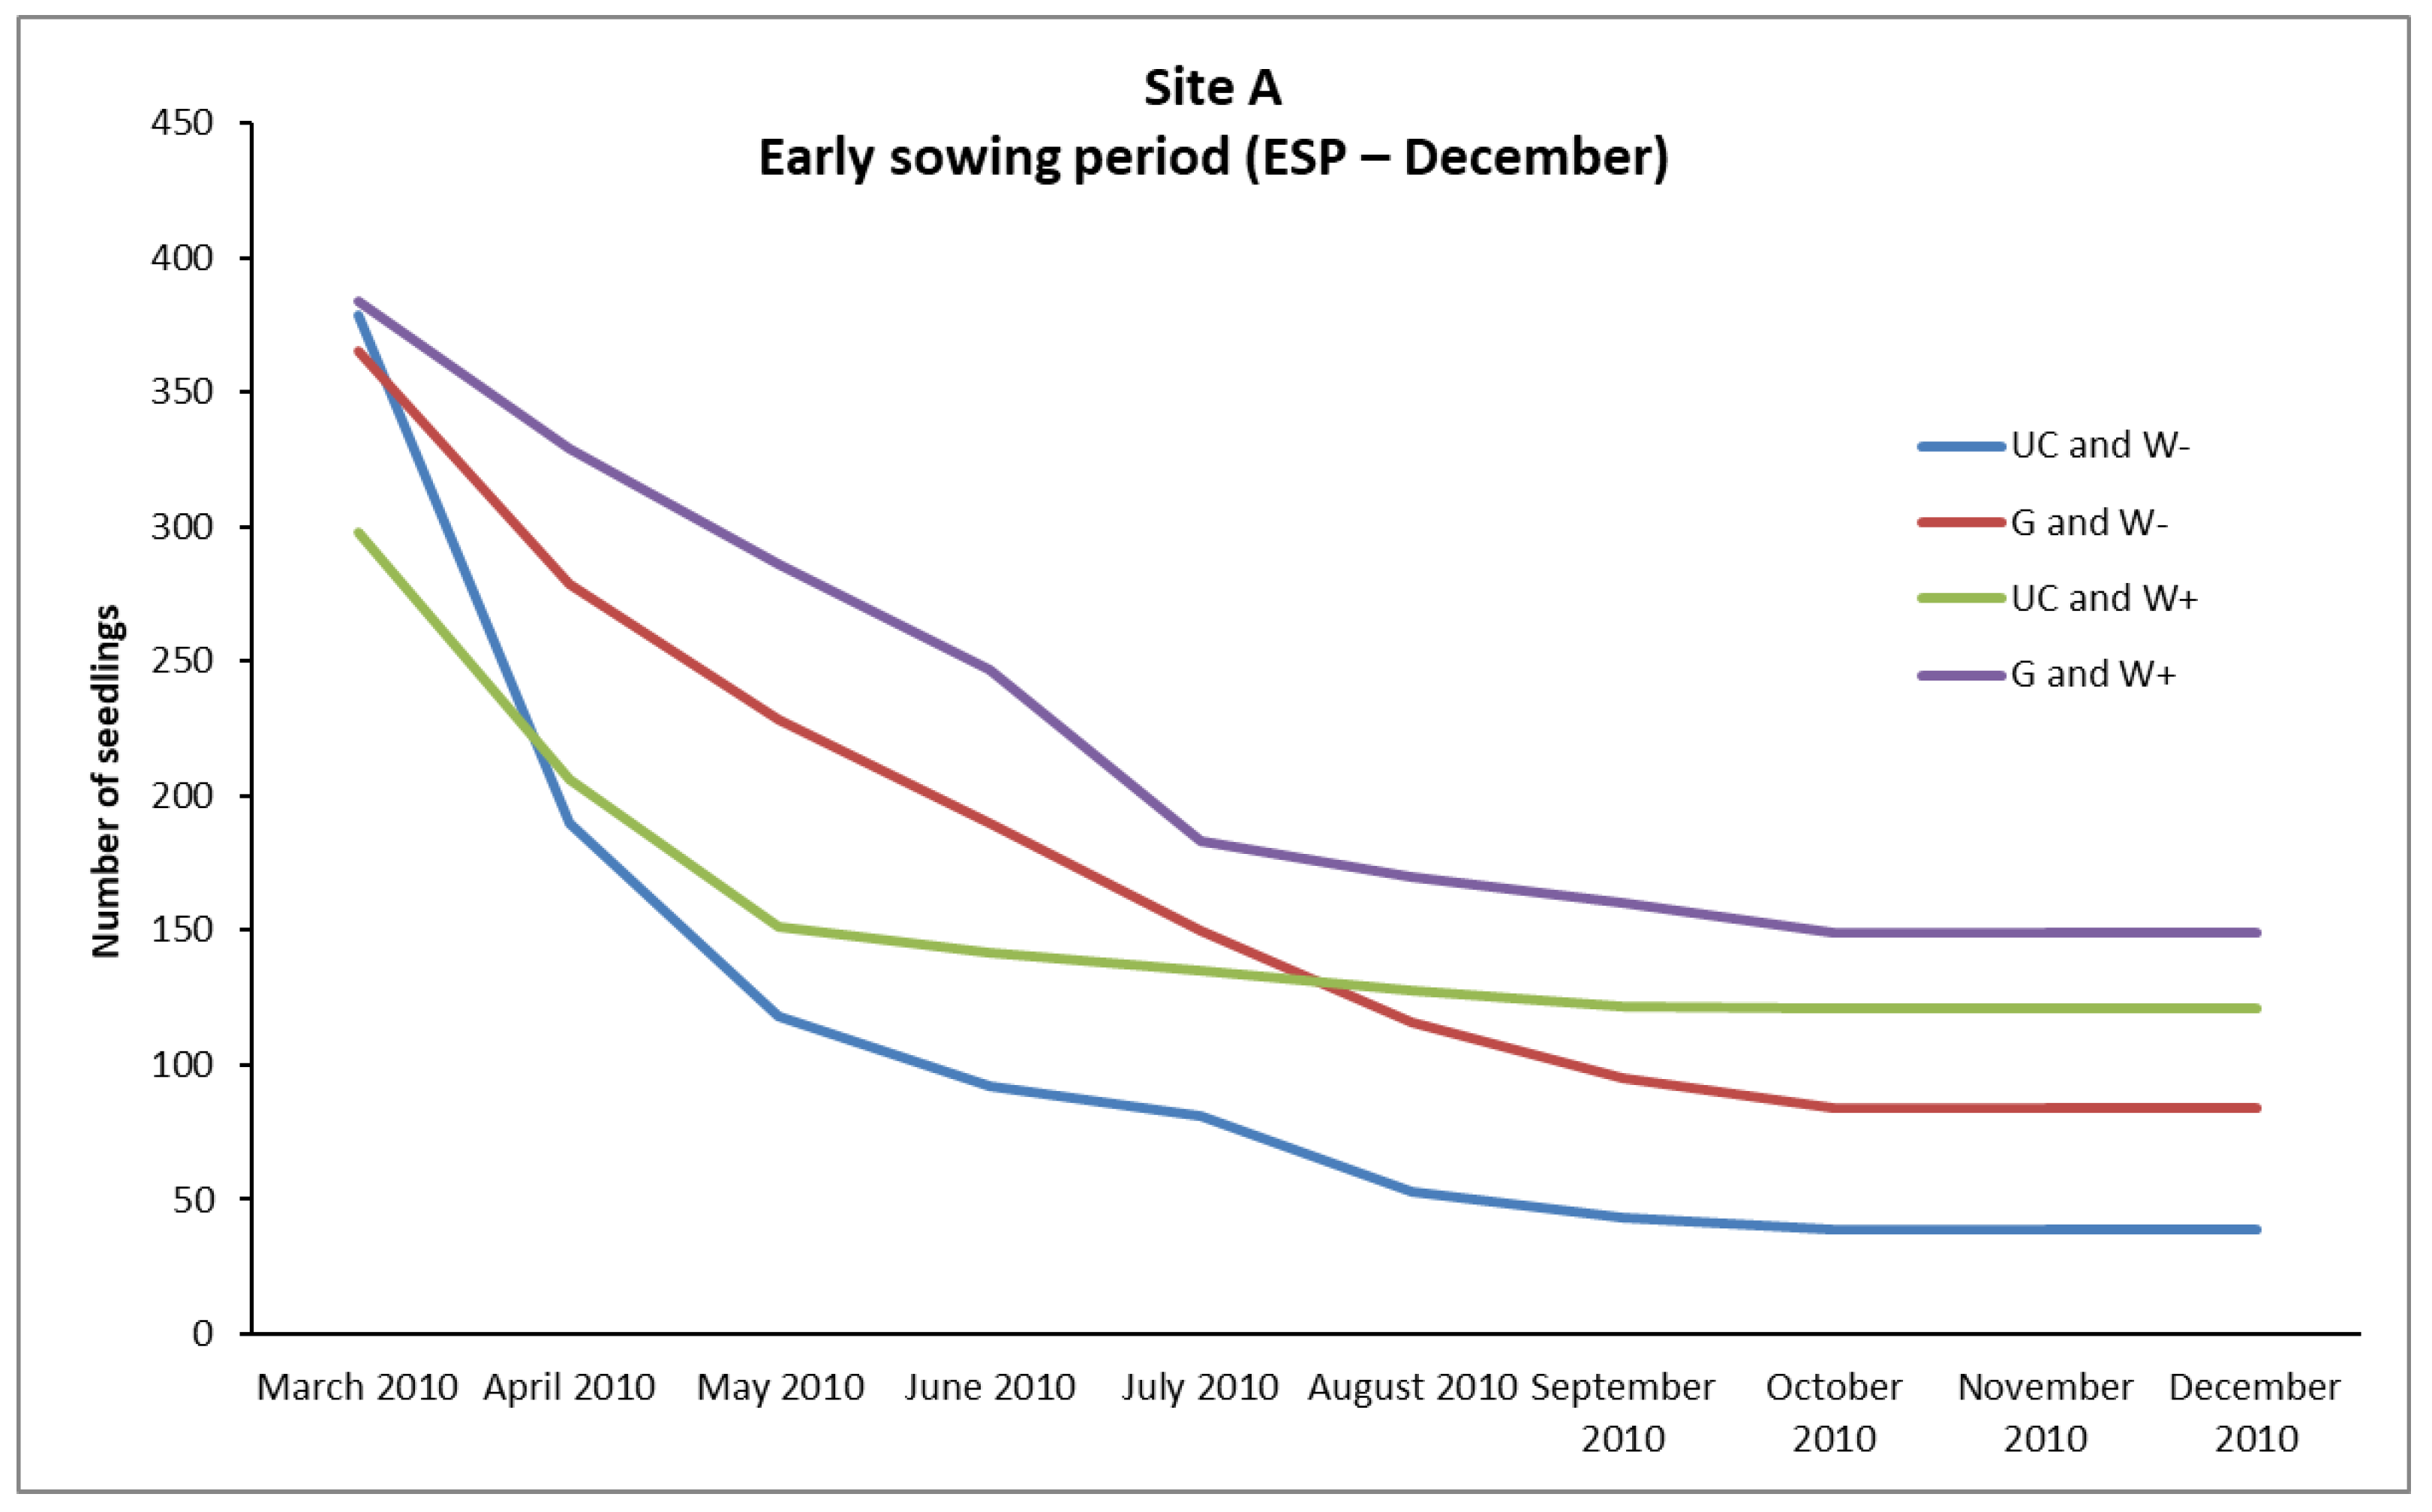
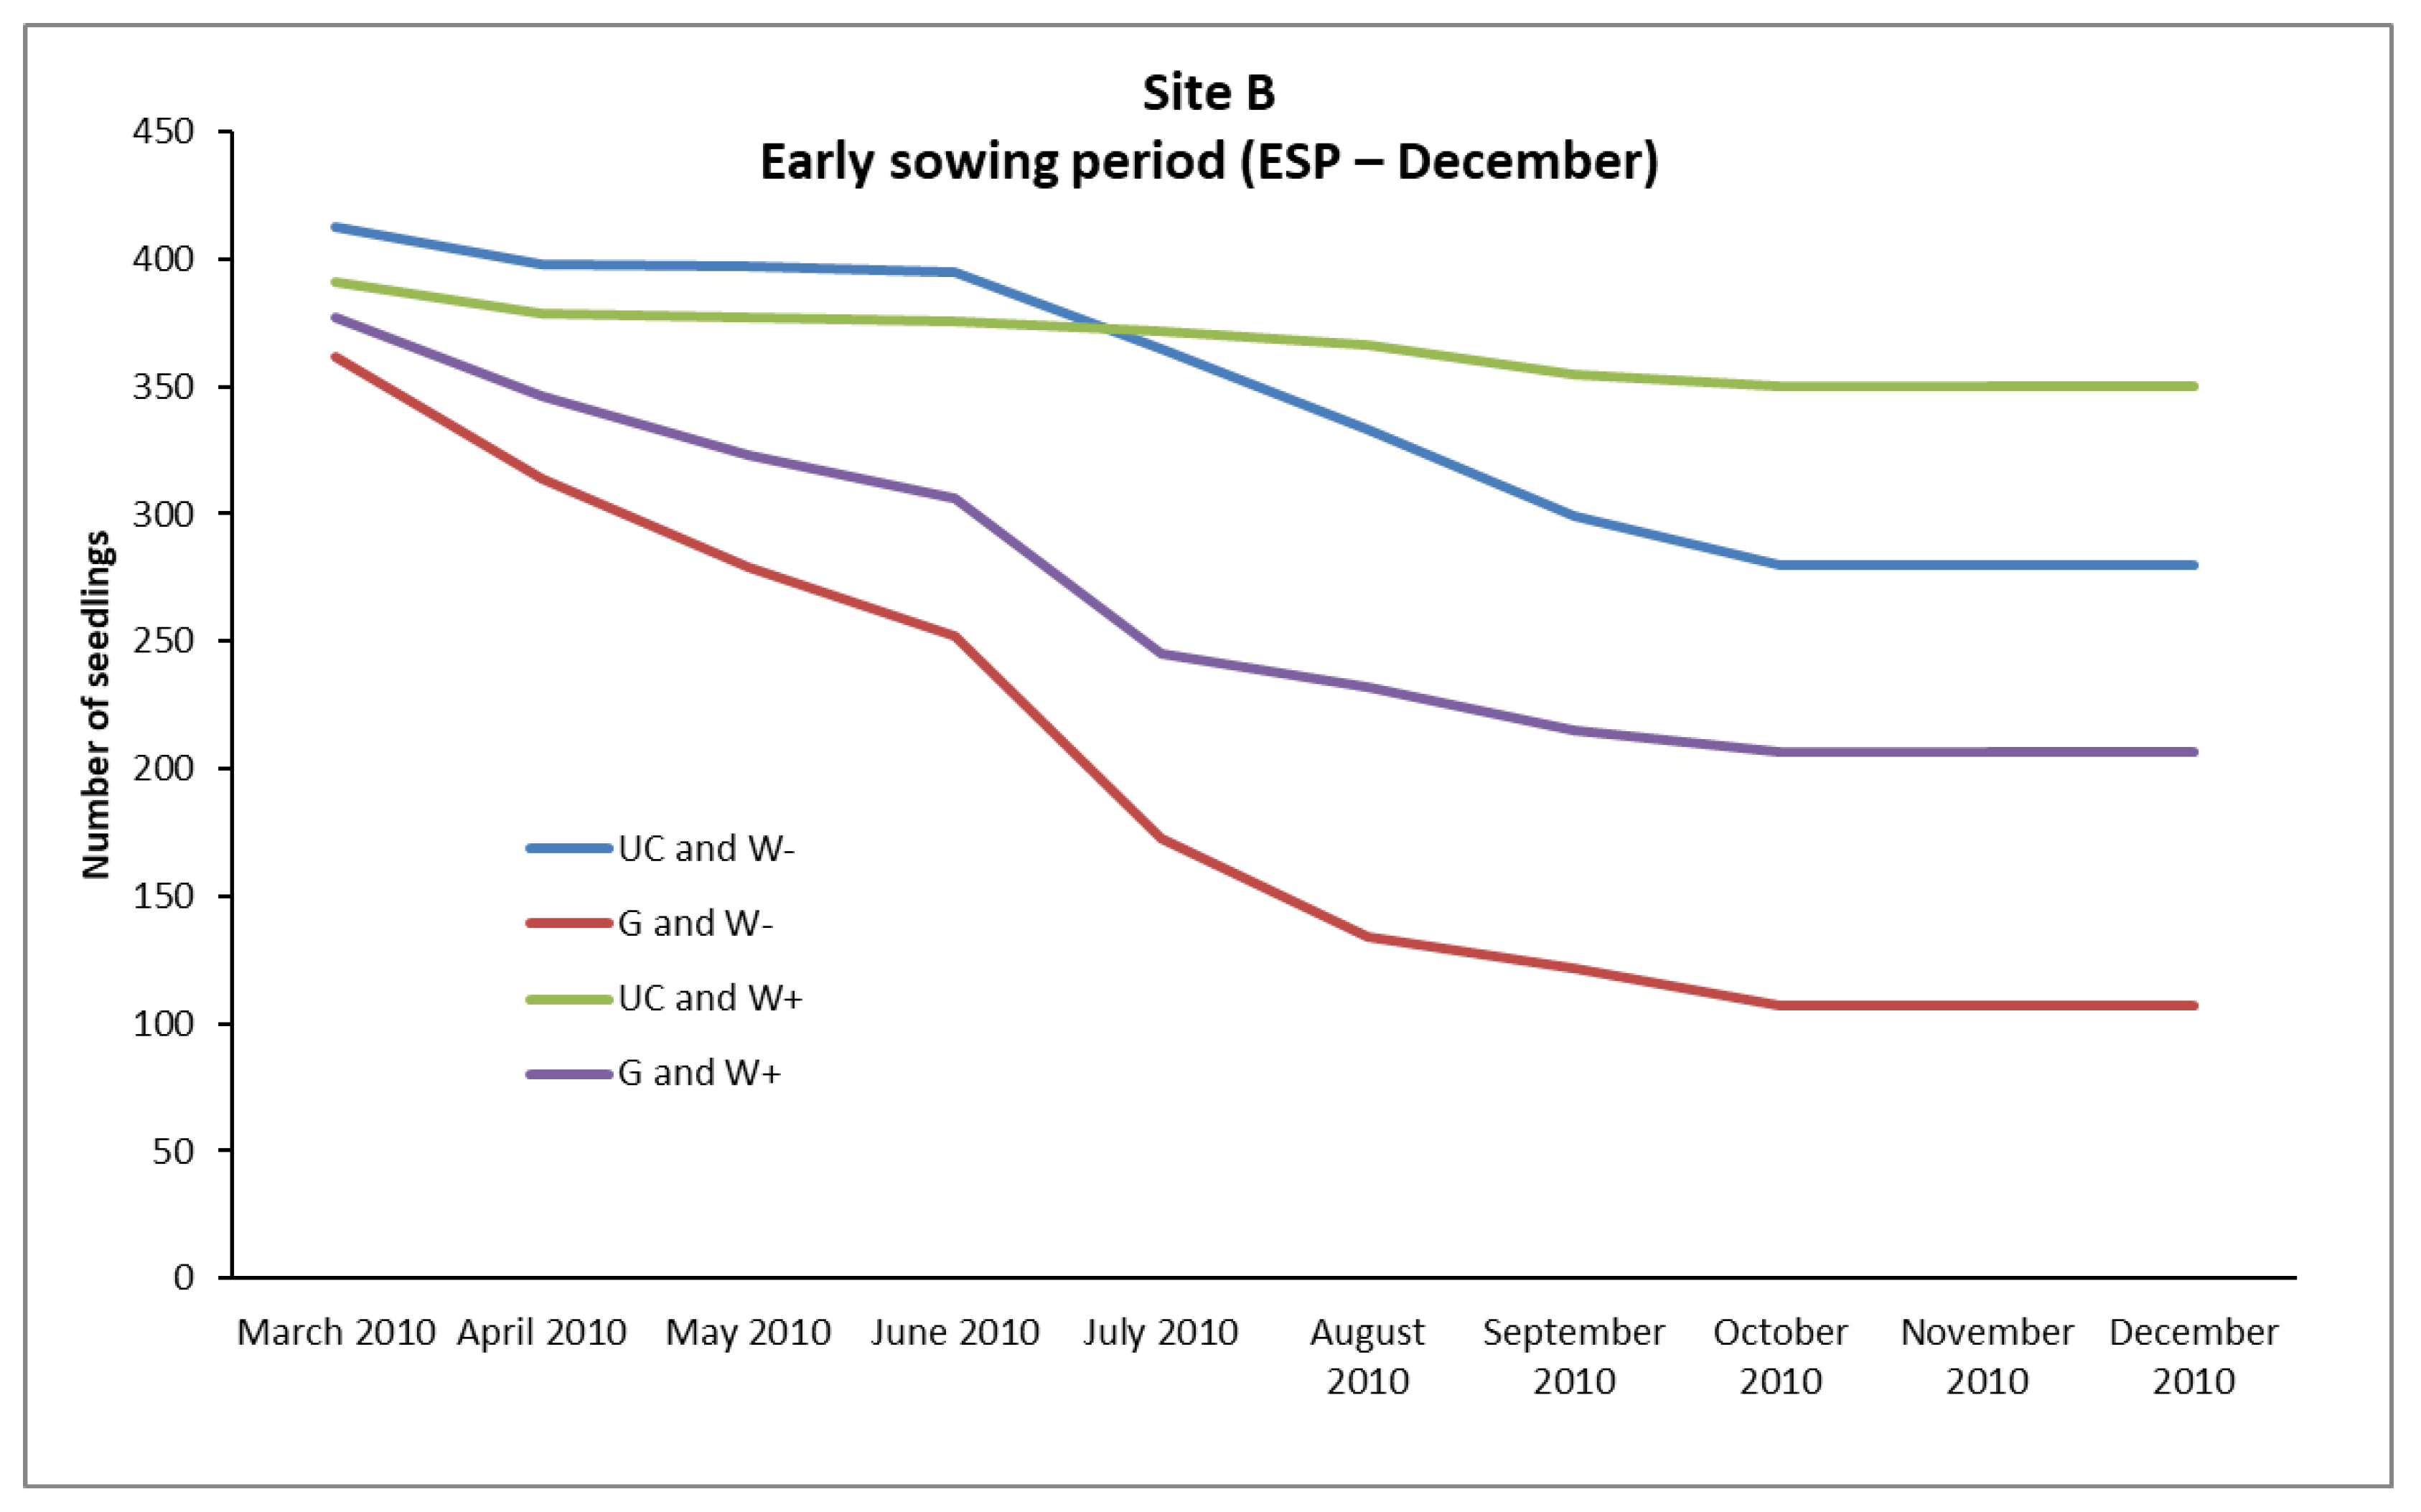
In the case of
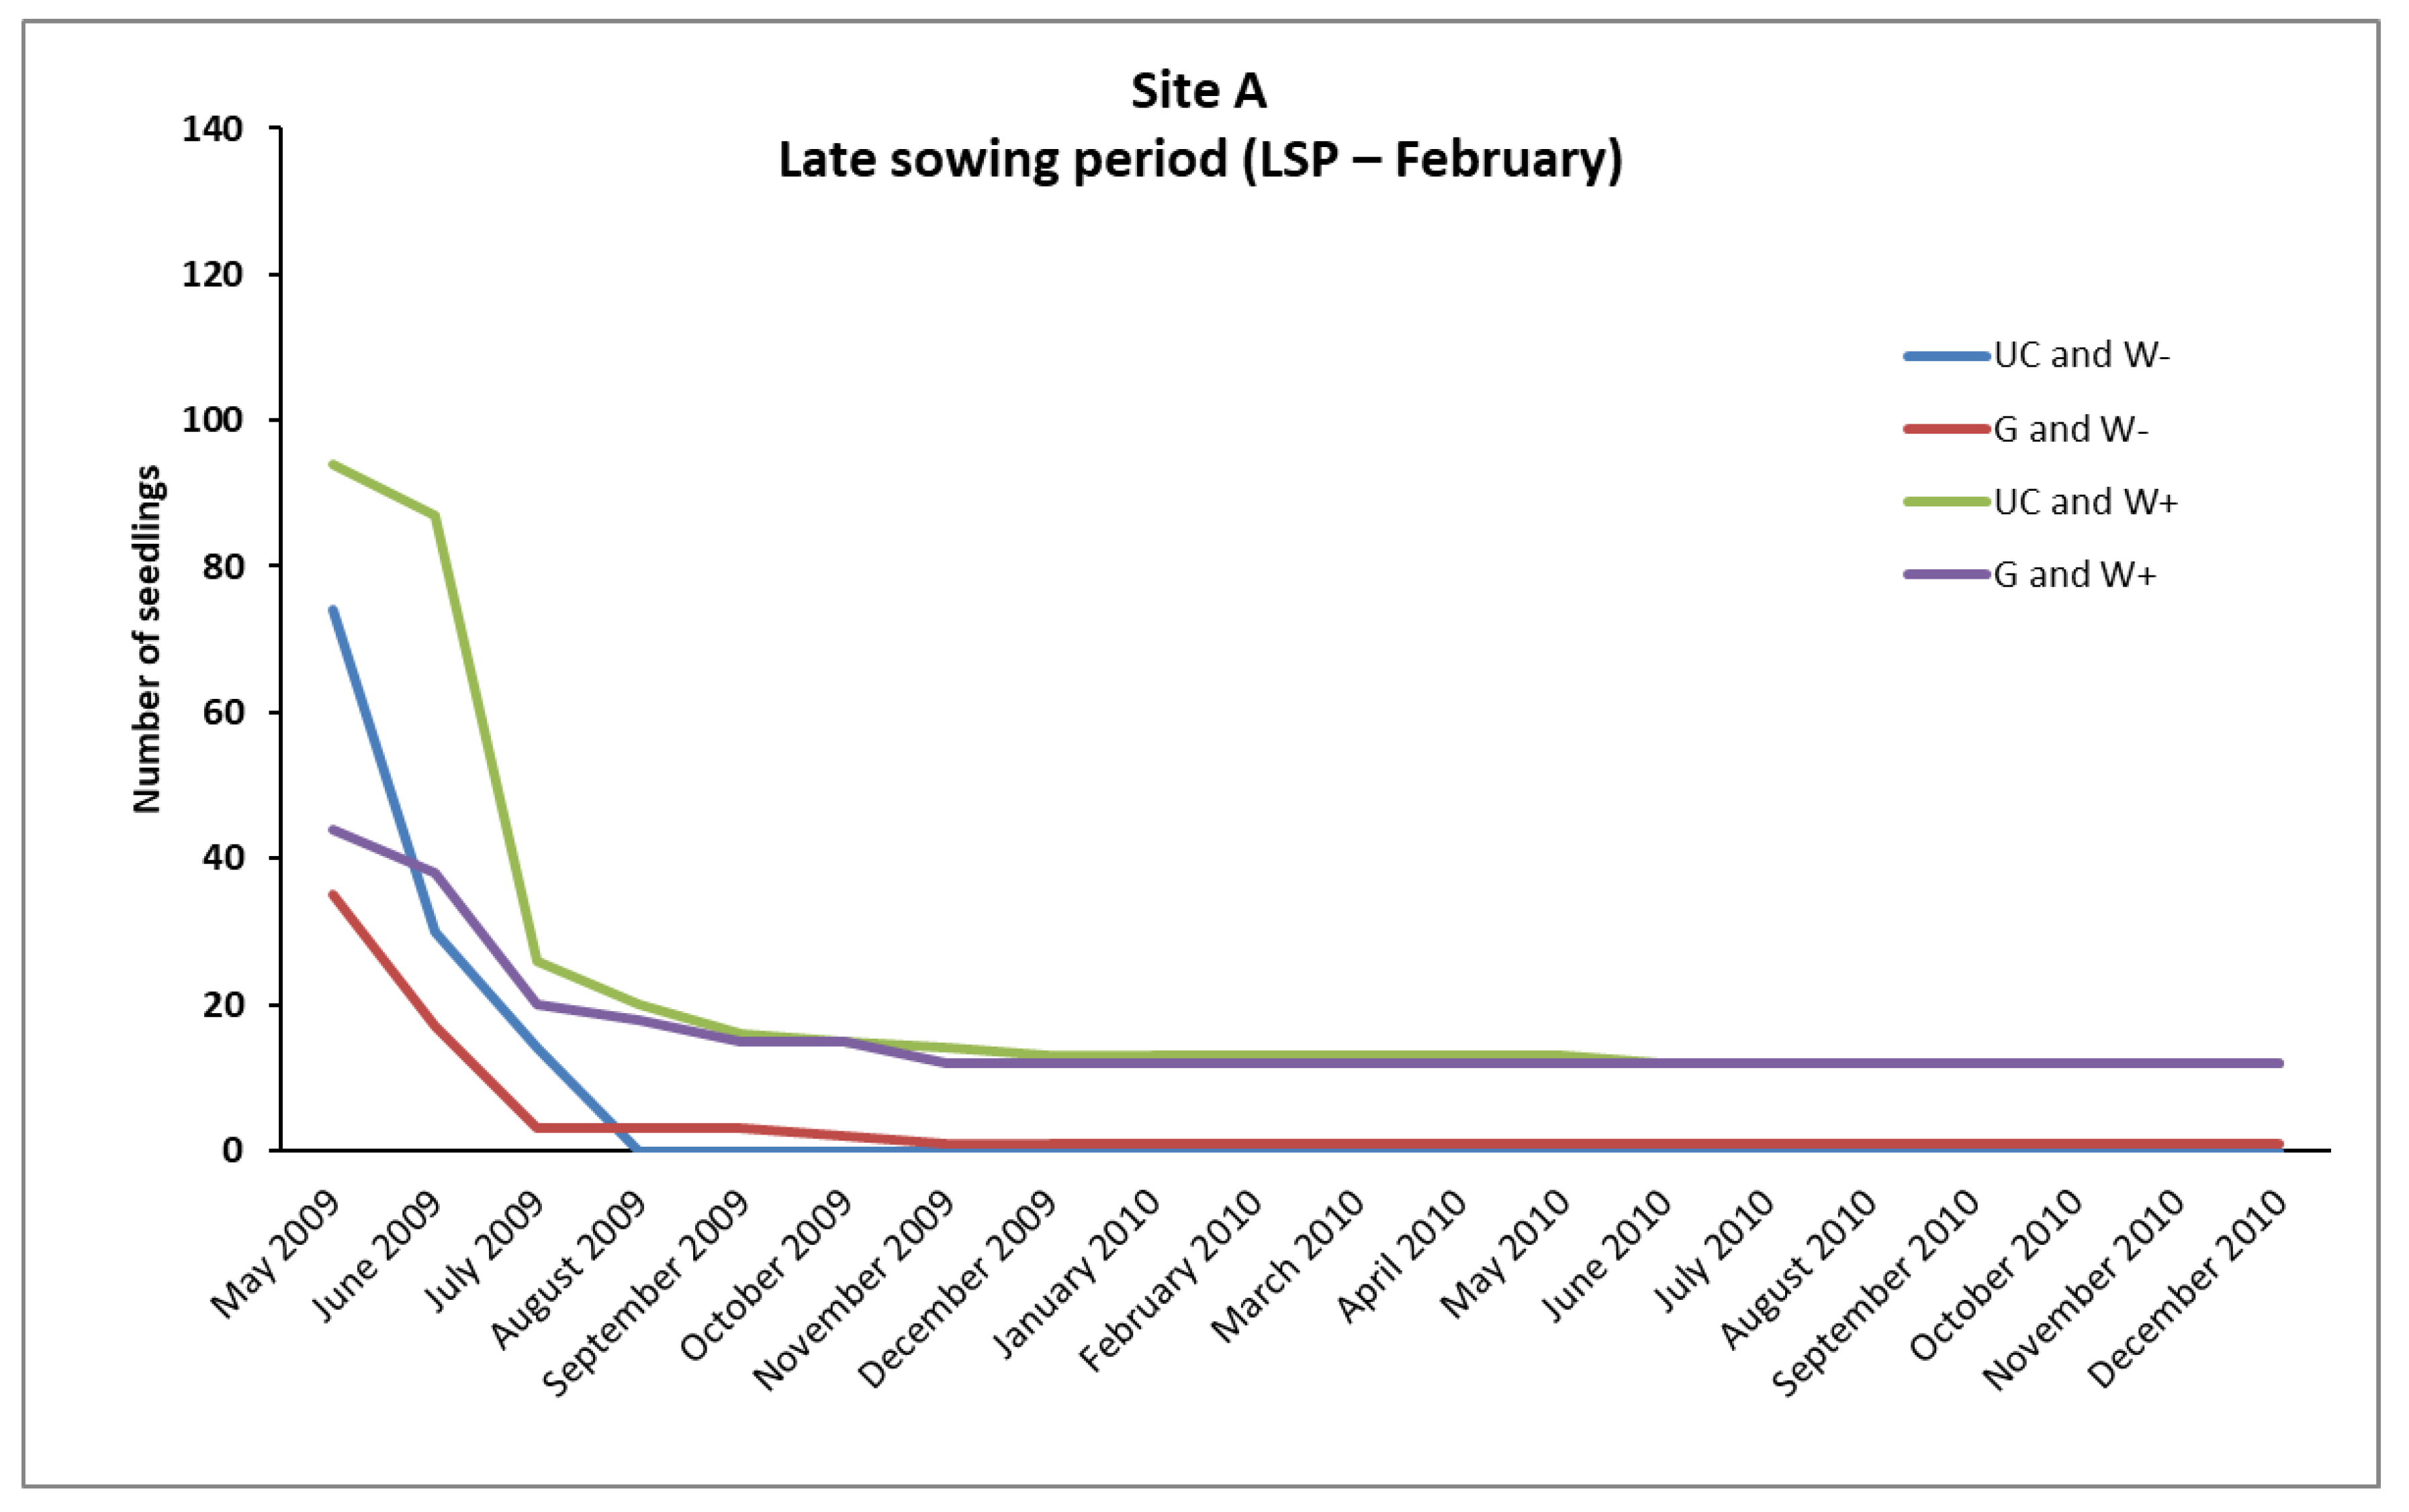
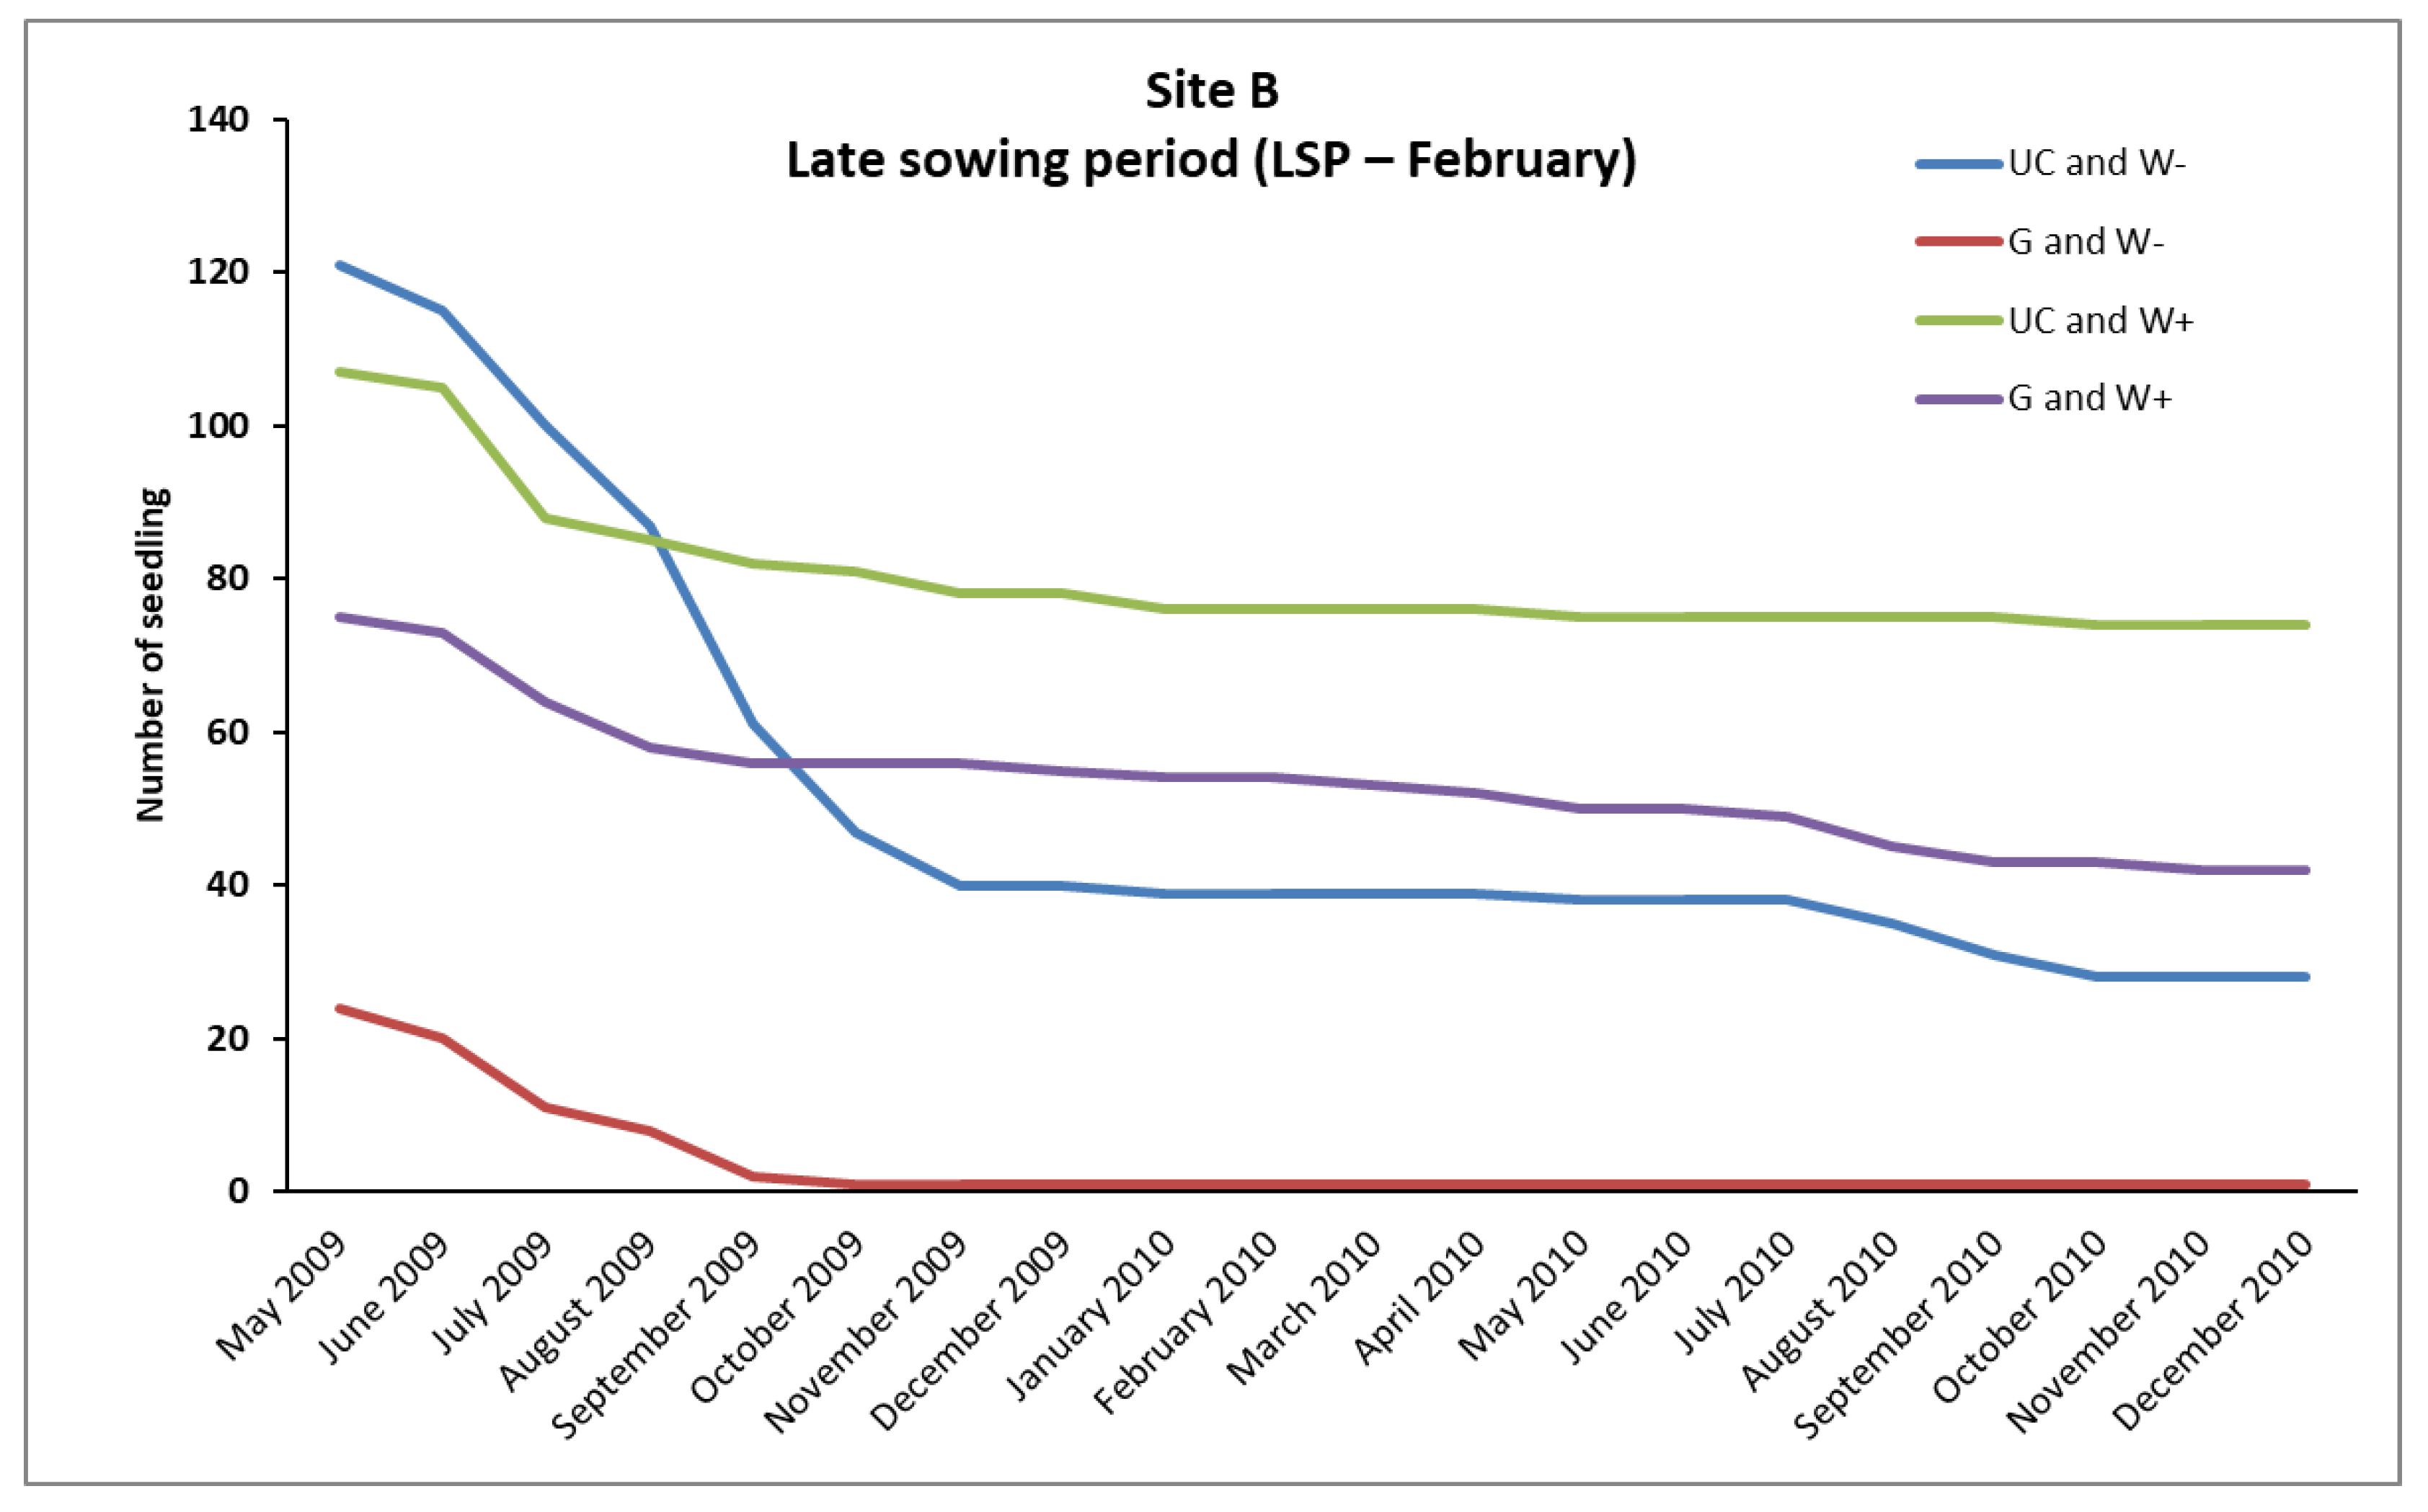
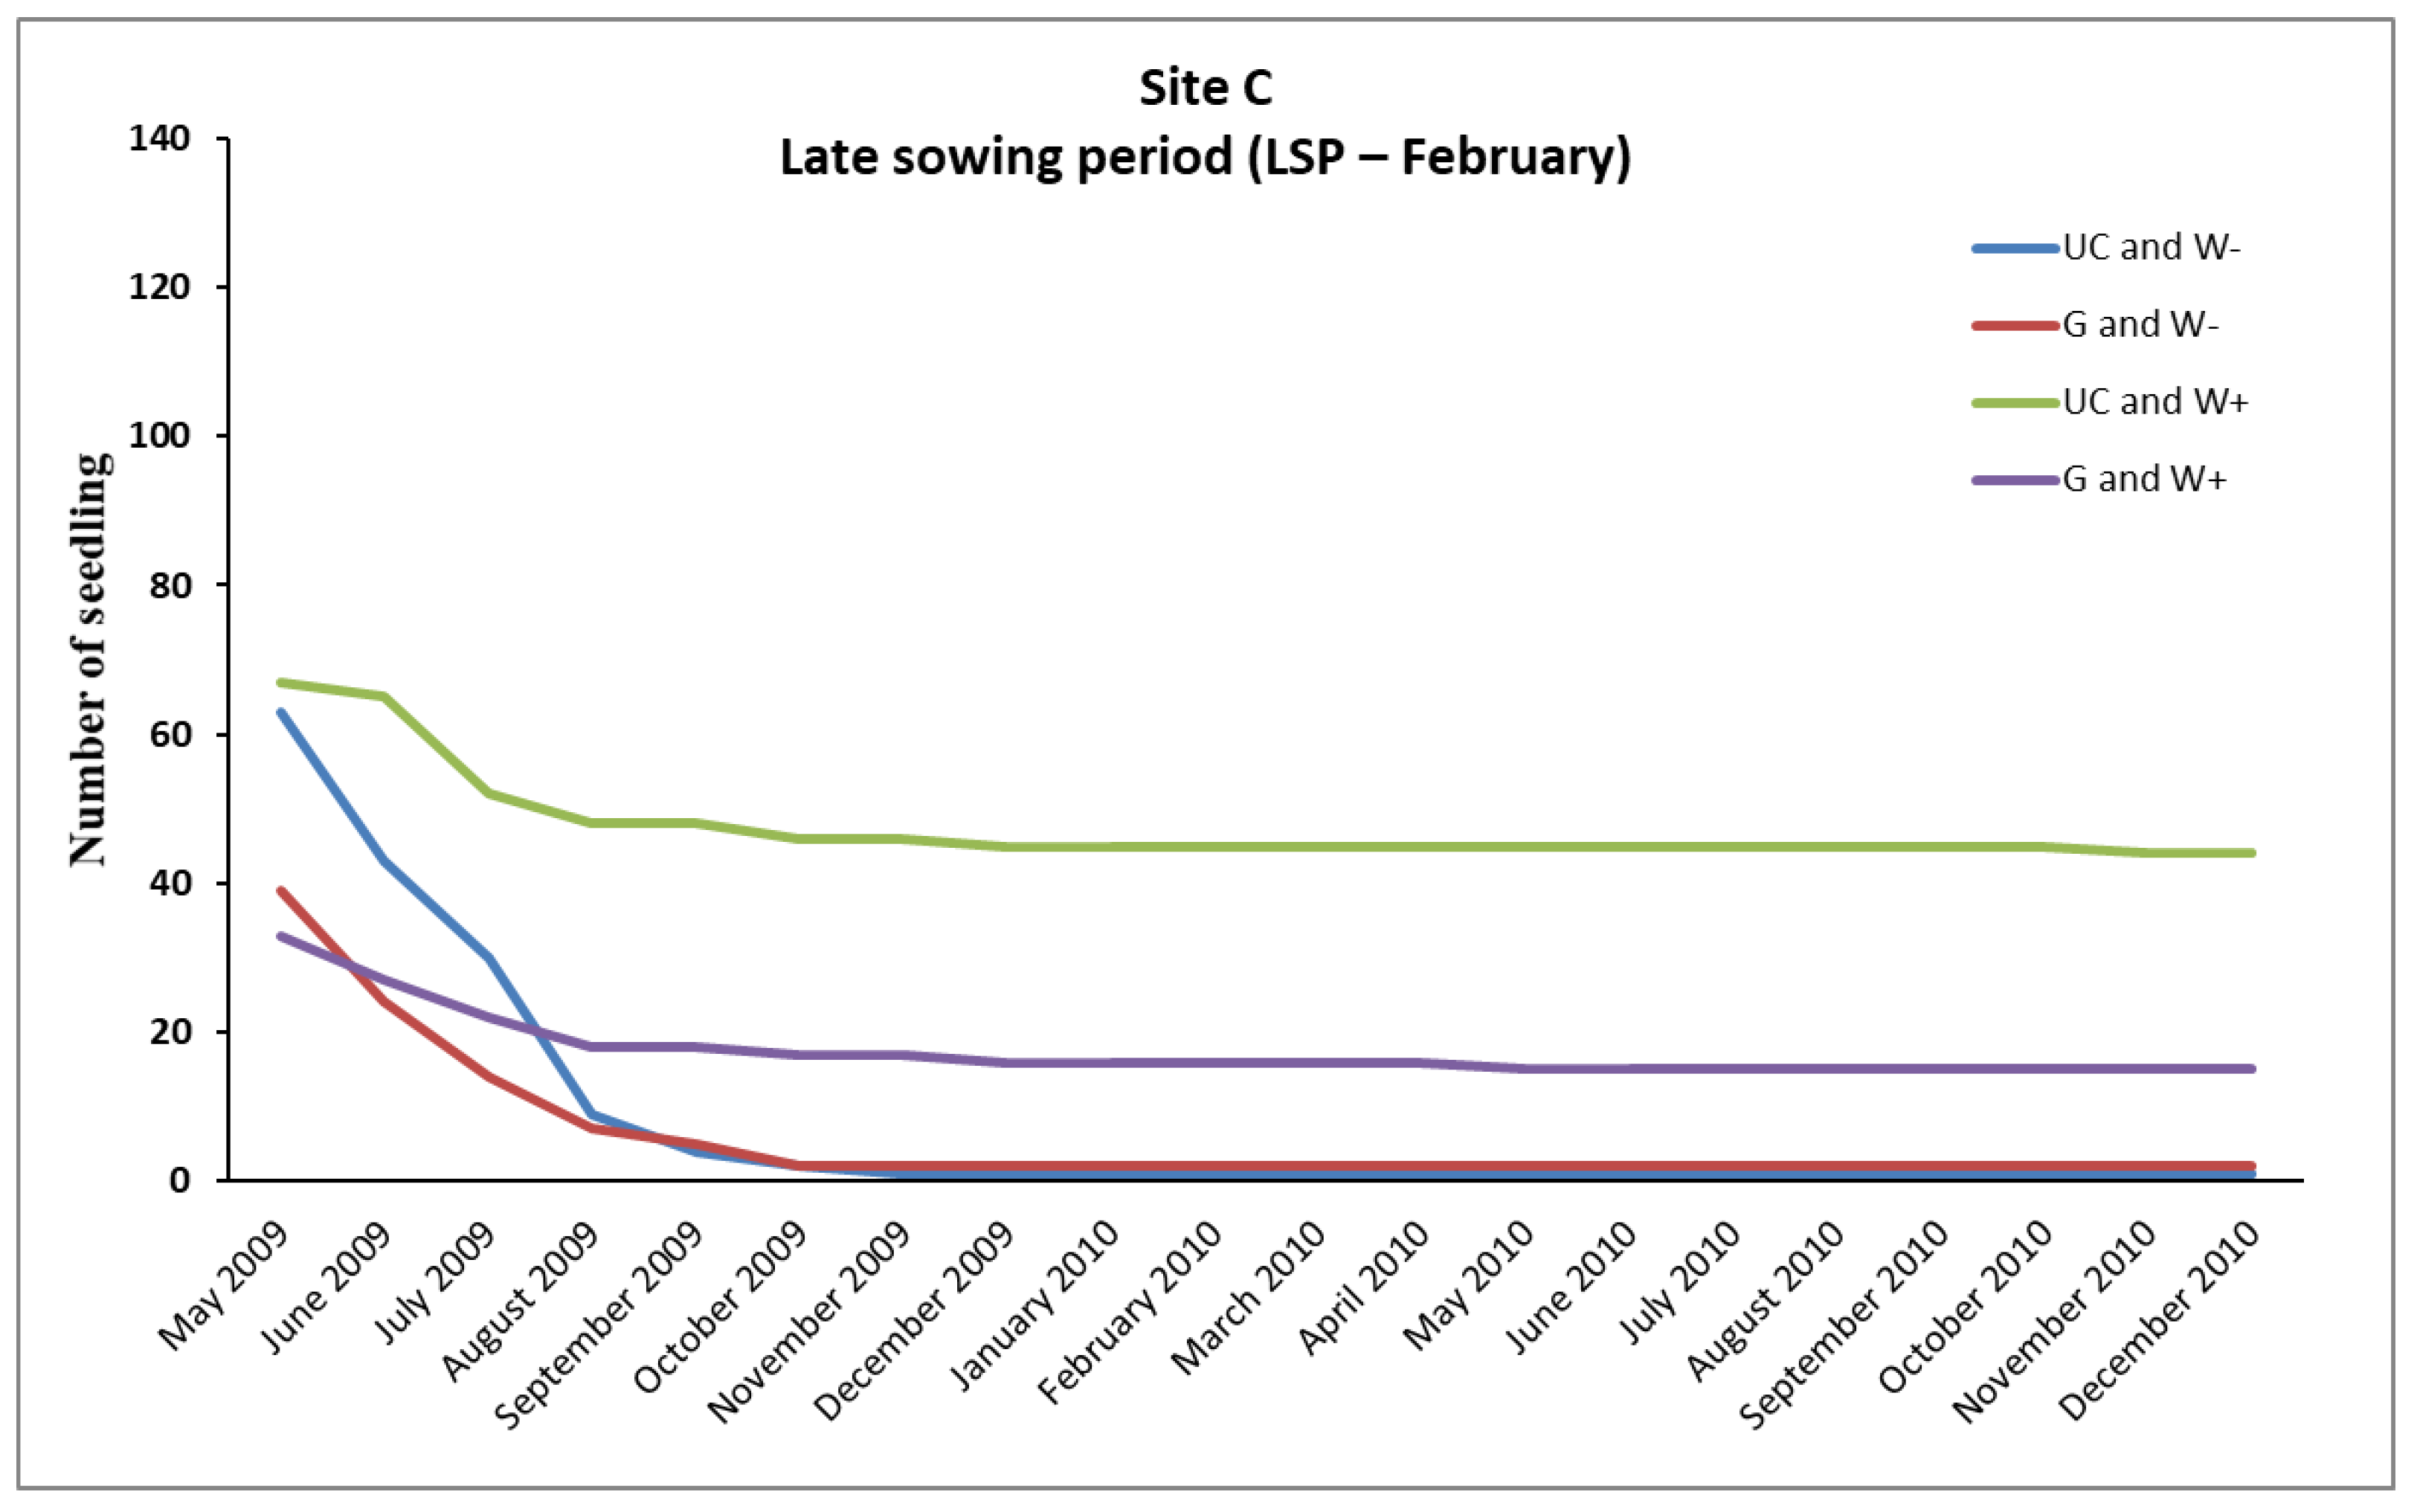
P. brutia, seedlings survival from the February (LSP) and December (ESP) sowing, mortality rates were relatively high in A, B, and C sites, even in “UC and W+” and “G and W+” plots (except from the “UC and W+” site B in ESP), where water supplementation took place. However, the conditions existing in these plots favored the survival of a larger number of seedlings compared to the plots where no water supplementation took place (
Figure 2,
Figure 3,
Figure 4,
Figure 5,
Figure 6 and
Figure 7). From the December sowing, from a practical point of view, the number of survived seedlings, in the plots of each combination of the two factor levels, in the three sites can be considered adequate for the successful regeneration of
P. brutia. In almost all cases, the mean density of the survived seedlings was over one seedling per m
2 (three seedlings per plot) and only in G sowing environment with no water supplementation in site C, the mean density of the survived seedlings was 2.83 per plot, marginally lower than one seedling per m
2 (
Table 10).
However, the majority of seedlings from the February sowing (LSP) that had finally died, died during the first growing season (
Figure 2,
Figure 3 and
Figure 4). In addition, the majority of seedlings from the December sowing (ESP) that finally died, had died during the period of March–October, while in the following months, until the end of December of the same year, no additional plant deaths were observed (
Figure 5,
Figure 6 and
Figure 7). These results are in line with the results of several studies that have studied the survival of seedlings of different species and found that the highest mortality rates are observed during the first growing season [
19,
63,
64].
In Mediterranean ecosystems, the lack of water during the summer period is the most important limiting factor, which leads to a reduction in plant survival during the regeneration establishment [
64,
65,
66].
In the present study, the additional water from the water supplementation treatment was the most important factor that led to the survival of a larger number of seedlings that were established in the December sowing. On the other hand, the lack of water during the dry season was the most important factor that led to the reduction of the survival of seedlings.
The factor “water supplementation” had a statistically significant effect (
p < 0.05) on the density of seedlings that survived from the December sowing in each of the three sites A, B and C, about one year after germination. In each site the mean seedling density in the plots in which additional water supplementation took place was higher (
p < 0.05) compared to that of the plots without additional watering (
Table 9).
Extreme temperatures, severe drought in summer, and light conditions (radiation) are very important factors, which greatly affect both the establishment and the survival of plants in Mediterranean ecosystems [
67]. The above conditions change in space, depending on the environments that exist in an area, thus leading to different relations of competition and facilitation between plants [
68,
69,
70]. The importance of positive effects between plants varies not only in space but also in time, either due to fluctuations in environmental conditions [
71,
72,
73] or due to the stage of development (e.g., seedling, sapling, mature plant, etc.) of a plant [
74,
75,
76].
The “sowing environment” had a very important role in the survival of seedlings from the December sowing (ESP), significantly affecting their density, mainly in the sites B and C. In these sites the UC sowing environment exhibited higher (
p < 0.05) density of seedlings than the G sowing environment (
Table 8). An interesting point is that in both sites (B, C) in the plots that were established under the canopy of pines and did not receive any water supplement (UC and W- plots) survived arithmetically more seedlings than in the plots of the gap that received water supplementation (G, W+ plots) (
Table 10). Seedlings are one of the most vulnerable stages in the life cycle of many plants, as, due to their small size, they cannot cope with many of the adverse environmental conditions [
77,
78]. The relatively low surface soil temperatures that prevail during the growing season in the UC sowing environment in sites B and C [
19,
33] favored the survival of a larger number of seedlings in this environment. On the contrary, in the G sowing environment, during the growing season, extreme surface soil temperatures prevail [
19,
33]. This resulted in the mortality of a larger number of seedlings in the G sowing environment [
19,
34].
In particular, in the summer of 2009, in the three sites (A, B, and C) according to Petrou [
33] in the UC sowing environments the maximum mean soil temperature (in the depth of 0.5 cm) was 40.6 °C. The maximum measured soil temperature was 43.9 °C. For the same period, the maximum mean soil temperature in the G sowing environments, in the three sites, was over 54 °C, while in sites B and C was over 60 °C. The maximum measured soil temperature was 66.4 °C both in sites B and C [
33].
In contrast, in site A, the factor “sowing environment” did not have a significant effect (
p > 0.05) on the density of seedlings that survived from the ESP and thus there is no difference (
p > 0.05) in the density of the survived seedlings between the UC and G sowing environments (
Table 8). However, numerically, the G sowing environment had a higher density of seedlings than the UC sowing environment, in contrast to what was observed in sites B and C. The fact that soil temperatures during the growing season in the UC sowing environment are more favorable than the G sowing environment, also in the site A as in the other sites [
19,
33], did not favor the greater survival of seedlings in the sowing environment UC. The main factor that led to this was obviously the low values of Vs prevailing in the UC sowing environment.
In the UC growing environment of site A the Vs values were up to 0.184, while in the G sowing environment the Vs values ranged from 0.281 to 0.333. It seems that the values of Vs in the UC were not favorable for the survival of P. brutia seedlings.
Holmgren et al. [
79] report that the positive effects of shading on plant survival in drought conditions are more likely to occur in intermediate shading conditions, while in intense shading conditions these positive effects may be lost. They also add that the loss of these positive effects in intense shading and drought conditions under the canopy is more likely to be observed in light demanding species that are drought tolerant than in shade-tolerant species. In experiments in the greenhouse under controlled conditions, it has been shown that in conditions with limited light and water, photosynthesis is directly reduced, thus reducing the carbon dioxide uptake by plants, while negatively affecting their osmotic adjustment, as well as their ability to absorb water [
80]. Awada et al. [
81] found that the rate of photosynthesis of two-year-old seedlings of
P. brutia in shade conditions (25% of full light) was 50% lower than the rate of photosynthesis of seedlings in full light.
In site A (where the Vs values in UC sowing environment were up to 0.184) the UC and W+ plots exhibited arithmetically much higher density of survived seedlings compared to the UC and W- plots. This implies that water supplementation greatly mitigated the competition of mature pines imposed in the established seedlings, thus reducing the negative effects of shading on the survival seedlings in site A.


