Article

Dynamics in Stoichiometric Traits and Carbon, Nitrogen, and Phosphorus Pools across Three Different-Aged Picea asperata Mast. Plantations on the Eastern Tibet Plateau

Key Laboratory of Forest Ecology and Environment of National Forestry and Grassland Administration, Research Institute of Forest Ecology, Environment and Protection, Chinese Academy of Forestry, Beijing 100091, China
*
Author to whom correspondence should be addressed.
Forests 2020, 11(12), 1346; https://doi.org/10.3390/f11121346
Submission received: 28 October 2020 / Revised: 3 December 2020 / Accepted: 8 December 2020 / Published: 17 December 2020
(This article belongs to the Section Forest Ecology and Management)

Abstract

:
Understanding the variations in soil and plants with stand aging is important for improving management measures to promote the sustainable development of plantations. However, few studies have been conducted on the dynamics of stoichiometric traits and carbon (C), nitrogen (N), and phosphorus (P) pools across Picea asperata Mast plantations of different ages in subalpine regions. In the present study, we examined the stoichiometric traits and C, N, and P stocks in different components of three different aged (22-, 32-, and 42-year-old) P. asperata plantations by plot-level inventories. We hypothesized that the stoichiometric traits in mineral soil could shape the corresponding stoichiometric traits in soil microbes, tree roots and foliage, and the C, N, and P stocks of the total P. asperata plantation ecosystem would increase with increasing stand age. Our results show that the N:P ratio in mineral soil was significantly correlated with that in tree foliage and herbs. Additionally, the C:N ratio and C:P ratio in mineral soil only correlated with the corresponding stoichiometric traits in soil microbes and forest floor, respectively. Both the fractions of microbial biomass C in soil organic C and microbial biomass N in soil total N decreased with increasing stand age. The C, N, and P stocks of the total ecosystem did not continuously increase across stand development. In particular, the P stock of the total ecosystem exhibited a trend of increasing first and then decreasing. The aboveground tree biomass C accounted for more than 55% of the total ecosystem C stock regardless of stand age. In contrast, mineral soil and forest floor were the major contributors to the total ecosystem N and P stocks in all stands. This study suggested that all three different stands were N limited, and the stoichiometric homeostasis in the roots of P. asperata was more stable than that in the foliage. In addition, the soil microbial community assembly may change with increasing stand age for P. asperata plantations in the subalpine region.

1. Introduction

The relative concentrations of carbon (C), nitrogen (N), and phosphorus (P), termed stoichiometry, are crucial traits of individual components in terrestrial ecosystems [1,2,3]. C is the main component of organisms and contributes to approximately 50% of plant dry matter [4]; additionally, N and P are two of the essential and most limiting nutrients in organisms [5]. N is a fundamental nutrient for synthesizing a range of molecules with vital structural and functional roles, and N in plant leaves is involved in photosynthetic processes [6,7]. P is a key component of many important compounds in cells, such as phospholipids, nucleic acids, and adenosine triphosphate (ATP) [8]. The ratios of C:N and C:P represent the ability of organisms to assimilate C when simultaneously consuming N and P [9]. The ratio of N:P has been widely used as an indicator of nutrient limitation in terrestrial net primary production [10]. Previous studies showed that stoichiometric traits were not constant and varied with the differences in species, individual organs of the same species, growth period, and environmental conditions [11,12,13,14]. In terrestrial ecosystems, plants provide substrates for soil microbes, and soil microbes are associated with soil nutrient turnover and supply mineralized nutrients to plants [15]. Additionally, soil, as a key basis of the terrestrial ecosystems, plays a pivotal role in the nutrients cycle in the ecosystem [16,17,18]. Thus, stoichiometric traits of chemical elements would reflect the interactions between plants, soil, and microbes [19,20], and C:N, C:P, and N:P ratios in soil may have a regulating impact on the corresponding stoichiometric traits in other ecosystem components, especially for foliage, root, and soil microbes.
During recent decades, China has launched large-scale afforestation programs, and the achievements have attracted worldwide attention [21]. Many studies have suggested that afforestation would favor environmental development, biodiversity conservation, and climate change mitigation [22,23,24,25]. However, the deterioration of ecological functions may occur during plantation development [26]. Stoichiometric traits are critical indicators of ecological processes [6,11], and a better understanding of the stoichiometric traits will be conducive to improving the management and promoting sustainable development of the plantations. Moreover, a clear evaluation of C, N, and P stocks in soil and plants is essential for understanding the ecological effects of afforestation.
The subalpine forest area of western Sichuan is on the eastern edge of the Tibetan Plateau and is a vital ecological barrier in the upper reaches of the Yangtze River, as it plays a crucial role in reducing soil erosion, regulating runoff, conserving water sources, and biodiversity [27]. Unfortunately, the primitive subalpine coniferous forests in these areas have been clear-cut since the middle of the last century [28], and it was not until 1998 that logging activities were completely banned [29]. After clear-cutting, spruce (Picea spp.) was commonly used to implement reforestation in these areas. After thousands of square kilometers of spruce plantations have been established on the cutovers, managing these plantations is very challenging [30,31]. Thus, it is essential to comprehensively realize the variations in these plantations with stand aging to draw up rational management measures. However, information on the dynamics of stoichiometric traits and their relationships between mineral soil and other components of spruce plantation ecosystems is still inadequate. Furthermore, the variations in the elemental stocks of the spruce plantation ecosystem, along with stand development, have also been rarely reported. We hypothesized that the stoichiometric traits in mineral soil could shape the corresponding stoichiometric traits in soil microbes, tree roots and foliage, and the C, N, and P stocks of the total P. asperata plantation ecosystem would increase with increasing stand age. The objectives of the present study are to (1) determine the stoichiometric traits of plants, forest floor, mineral soil, and soil microbes in different-aged P. asperata plantations, (2) analyze the relationships between the stoichiometric traits in mineral soil and other ecosystem components, and (3) evaluate the dynamics in ecosystem C, N and P stocks and the contributions of above- and belowground components.

2. Materials and Methods

2.1. Study Sites

The present study was conducted in Miyaluo (102°41′–102°44′ E, 31°42′–31°51′ N), which is in Lixian County, western Sichuan Province, China. This area belongs to the transition zone from the Tibetan Plateau to the Sichuan Basin and is an important part of the southwestern national forest region of China. In this area, the elevations of forestland range from 2400–3900 m. It is characterized by a montane monsoon climate with annual precipitation of 600–1100 mm and an annual mean temperature of 6–10 °C [32]. Soils are classified as mountain brown soil series in Chinese soil taxonomy.

2.2. Field Sampling and Measurements

The maximum age of existing Picea asperata Mast. plantation is approximately 50 years old in this subalpine area, and the age classes of P. asperata plantations are divided into young age (<20 years old), middle age (21 to 40 years old), near maturity (41 to 60 years old), respectively. Thus, three P. asperata plantations of different ages, namely, 22-, 32-, and 42-year-old, all with pure overstories, were chosen to represent the development process from middle age to near maturity. All the stands are on the eastern slope of the subalpine area (Table 1) and are located within a 5 km radius of each other. The field measurements and sampling were carried out in July 2018. Three 20 × 20 m plots were randomly selected in each stand. The diameter at breast height (DBH) and height (H) were recorded for all trees within each plot. Above- and belowground tree biomass in each plot was calculated using allometric equations with DBH and H [31]. In each plot, five trees were randomly selected and sampled for foliage, branch, trunk, and root. The foliage and branch samples were obtained from the middle canopy. The trunk samples were obtained by using an increment borer. The root samples were taken at five random points under the canopy for a soil depth of 0–40 cm. The soil was washed out by water to the roots. In each plot, foliage, branch, trunk, and root samples were mixed as one sample for each tree component. Three 1 × 1 m micro plots were distributed along a diagonal with each plot for herb investigation. In each micro plot, all herbs were excavated. Herb samples were separated into above- and belowground components after species had been identified. The forest floor was sampled by collecting the entire organic matter within three 0.2 × 0.2 m quadrates that were randomly placed in each plot. The samples of herbs and forest floor were oven-dried at 65 ℃ to constant weight. Soil samples of 0–20 cm and 20–40 cm were collected at five random sites in each plot. Five soil samples of the same layer were combined as one composite soil sample. Then, parts of the soil sample were kept on ice in an incubator for soil microbial C, N, and P measurements, and the other part of the soil samples was air-dried and sieved through a 2 mm mesh and further used to determine the organic C, total N, and P concentrations. Soil samples for bulk density of each correspondence depth were also collected using a 100 cm3 soil ring and oven-dried at 105 °C to constant weight. After measuring the bulk density, these soil samples were sieved through a 2 mm mesh, and then, the volume of the fragments over 2 mm was determined using a graduated cylinder.
Soil organic C concentration was determined by the potassium dichromate oxidation method [33]. Soil total N concentration was determined by the semi-micro-Kjeldahl method [33]. Soil total P and plant biomass P concentrations were determined by the ascorbic acid method and vanadium (V)-molybdenum (Mo) yellow colorimetry, respectively [34]. The soil samples were fumigated with chloroform, and soil microbial C and N concentrations were determined by a Vario TOC/TNb analyzer (Elementar, Langenselbold, Hesse, Germany). Plant biomass C and N concentrations were also determined by this method. Moreover, soil microbial P was determined by Mo blue colorimetry. Plantation ecosystem element stock was defined as the sum of the tree, herb, forest floor, and soil correspondence element stock. Soil C, N, and P stocks were estimated according to the formula based on the corresponding elemental concentration, the soil horizon thickness, the bulk density, and the volumetric percentage of fragments >2 mm [4]. The elemental concentration of herb was calculated as the biomass weighted average of each species for each micro plot. The C, N, and P stocks of different plant components were calculated by multiplying the component’s biomass and the corresponding elemental concentrations, respectively. There is almost no shrub in the understory for cutting bush management. Thus, shrub was not measured in the present study.

2.3. Statistical Analysis
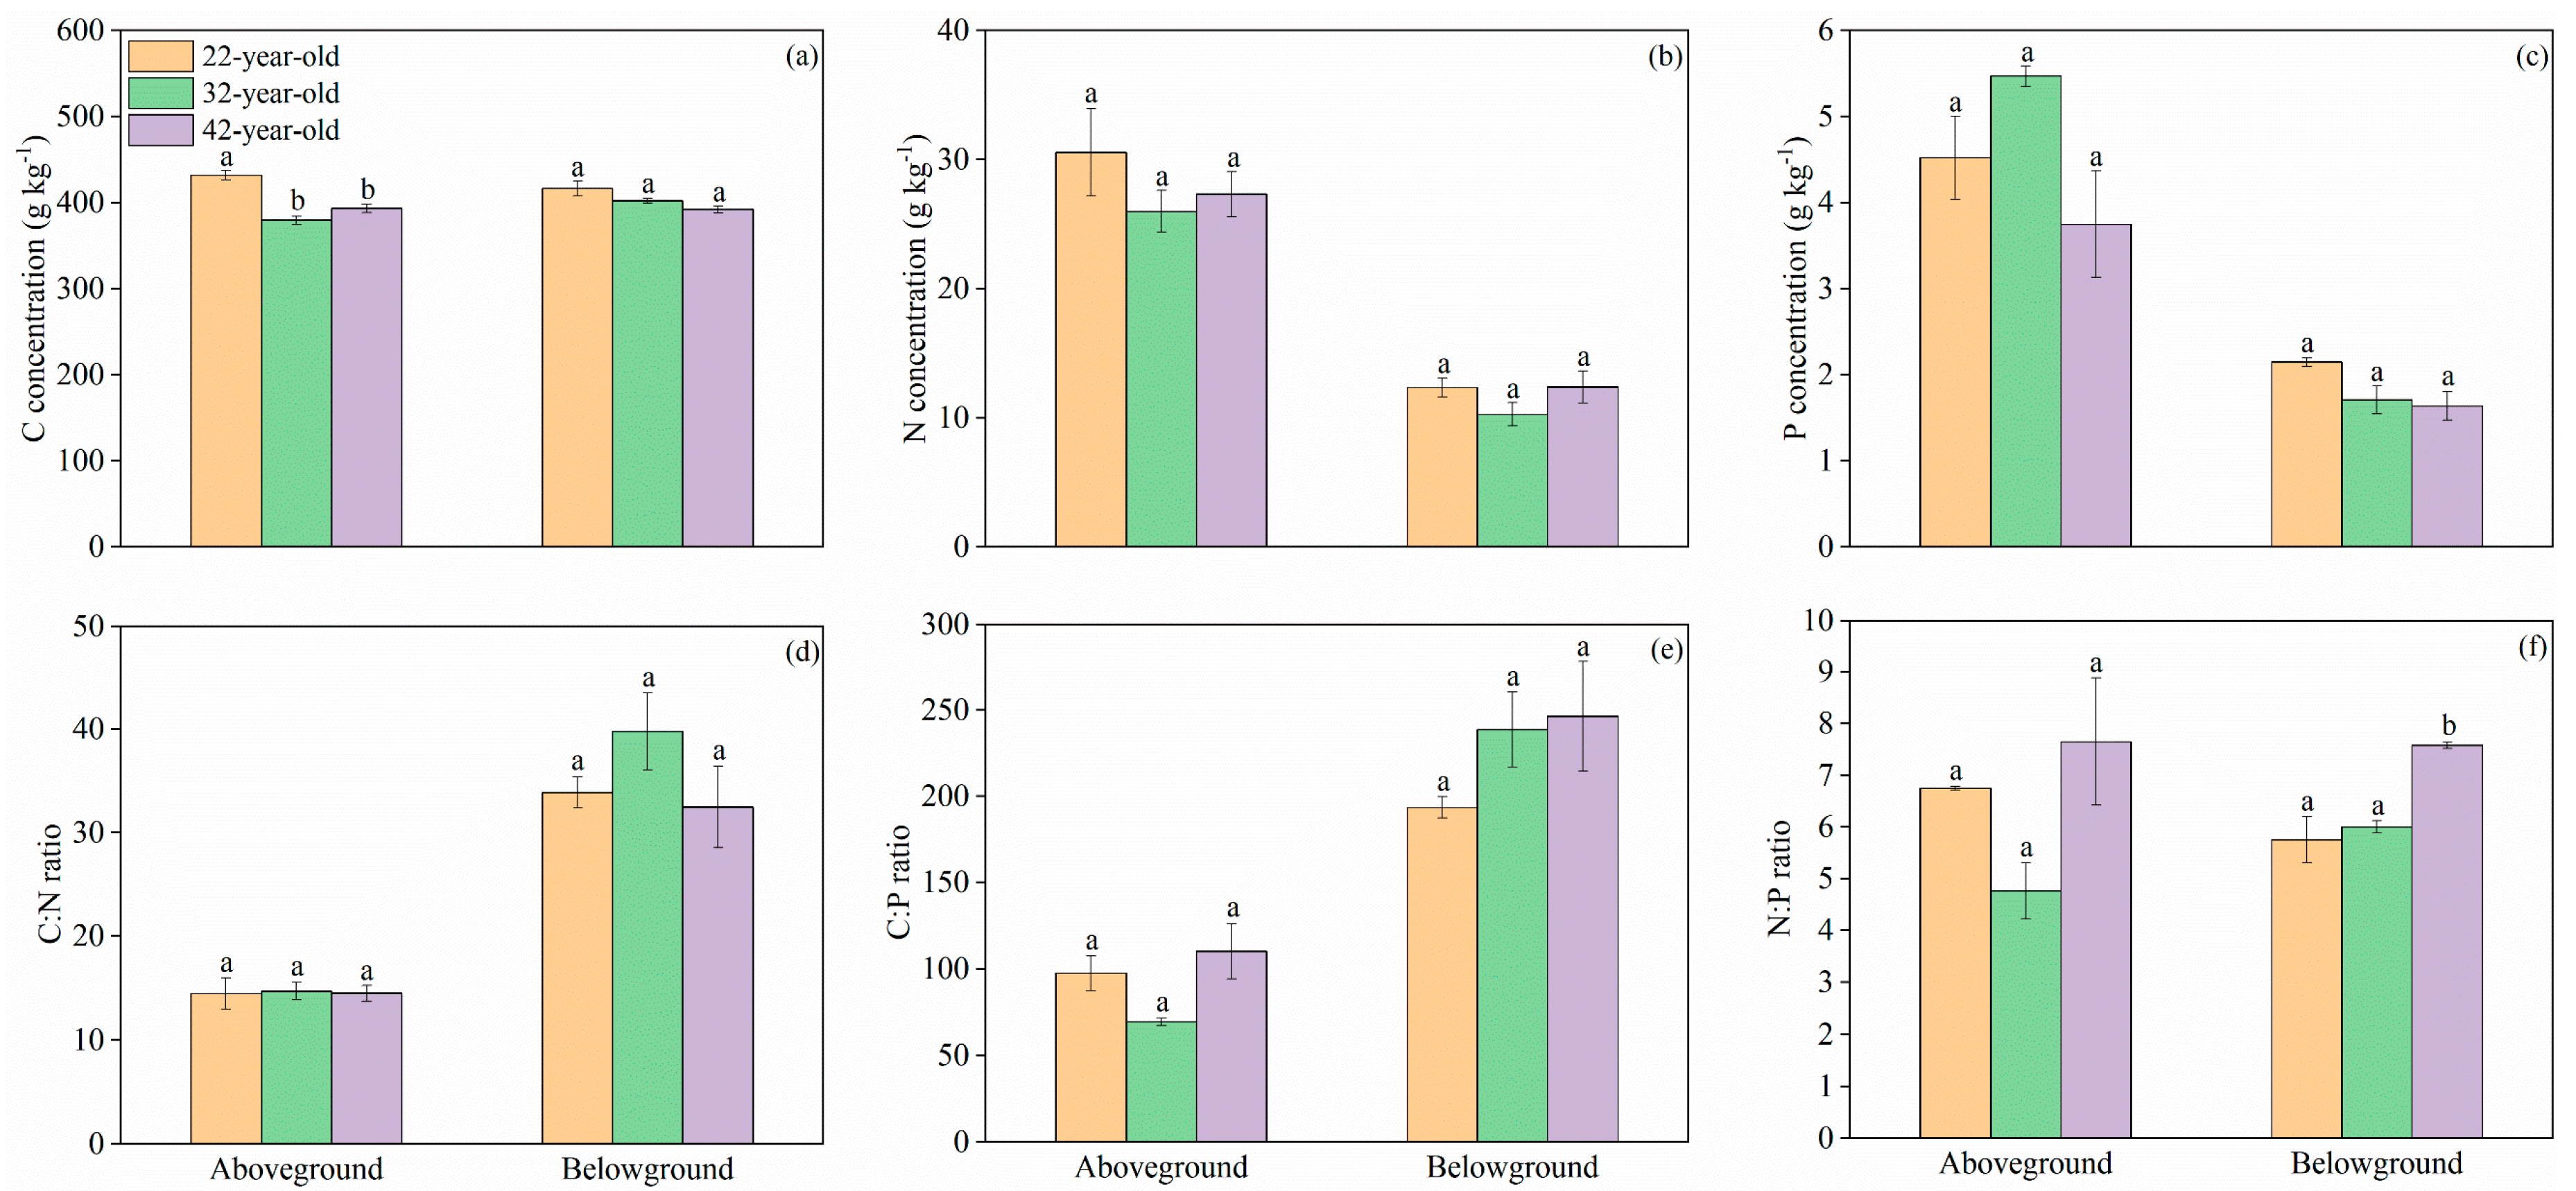
Statistical analysis was performed using the SPSS 18.0 (SPSS, Chicago, IL, USA). Data were first checked for normality using the Shapiro–Wilk test and for homogeneity of variance using Levene’s test. As the data met these analyses of variance (ANOVA) assumptions, the difference among the means of different stands and variations of different components within the same stand were respectively examined via one-way ANOVA and a Tukey test (p < 0.05). Pearson correlation analysis was performed to examine the correlation of the same variable in the different ecosystem components.

3. Results

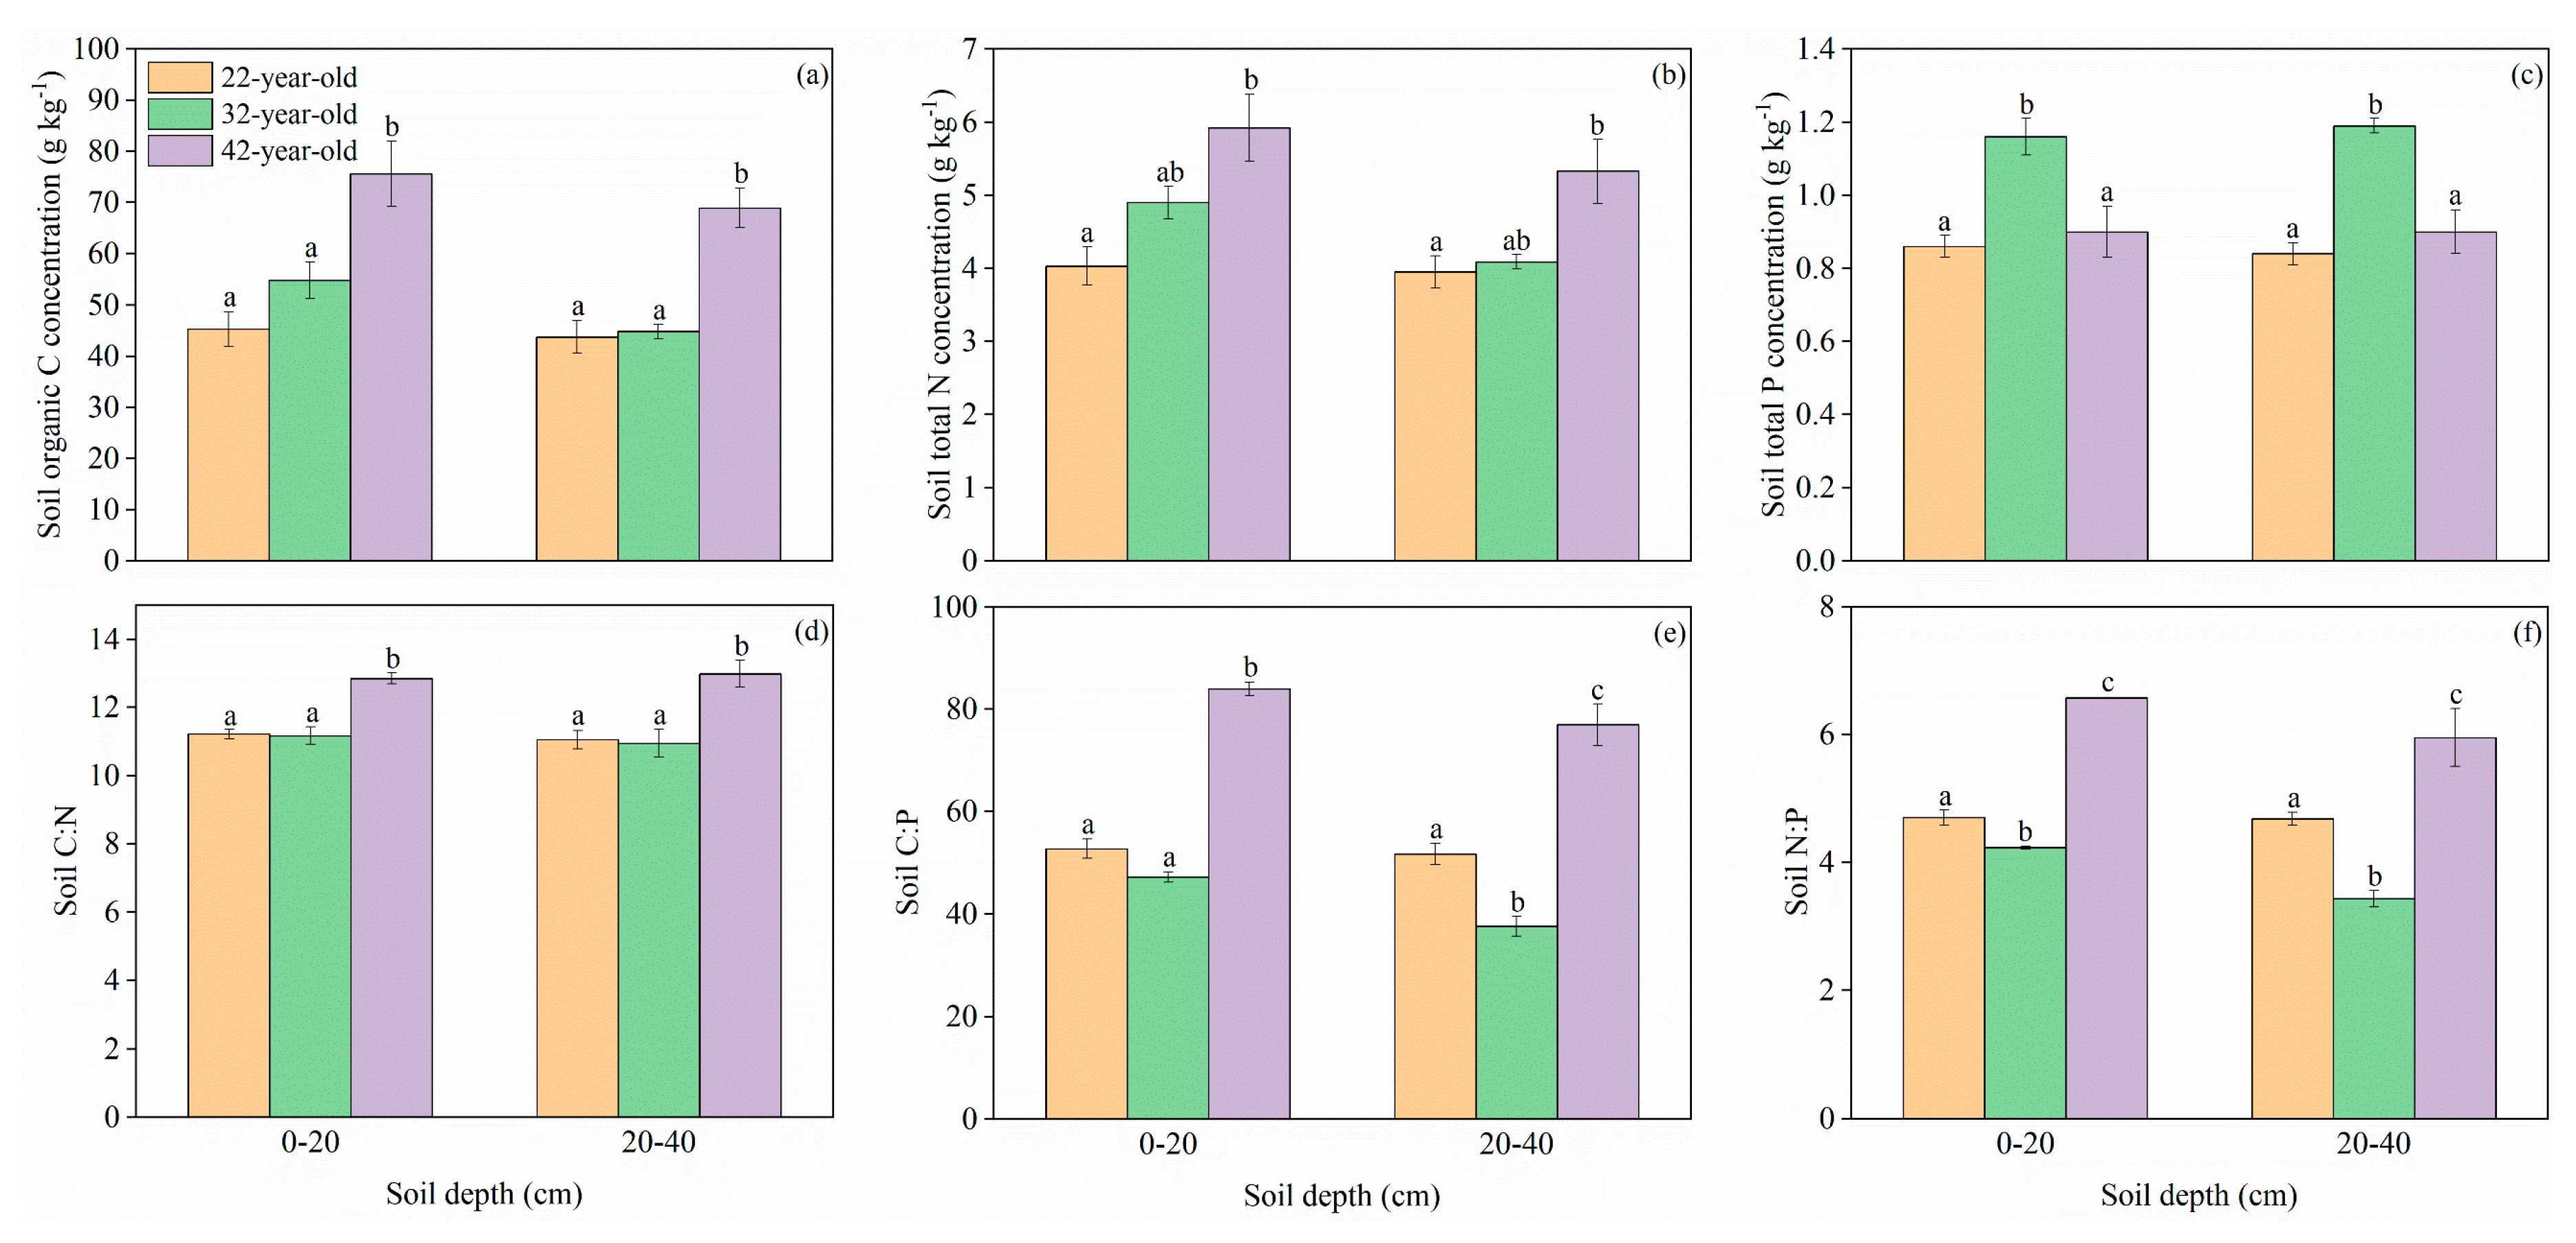
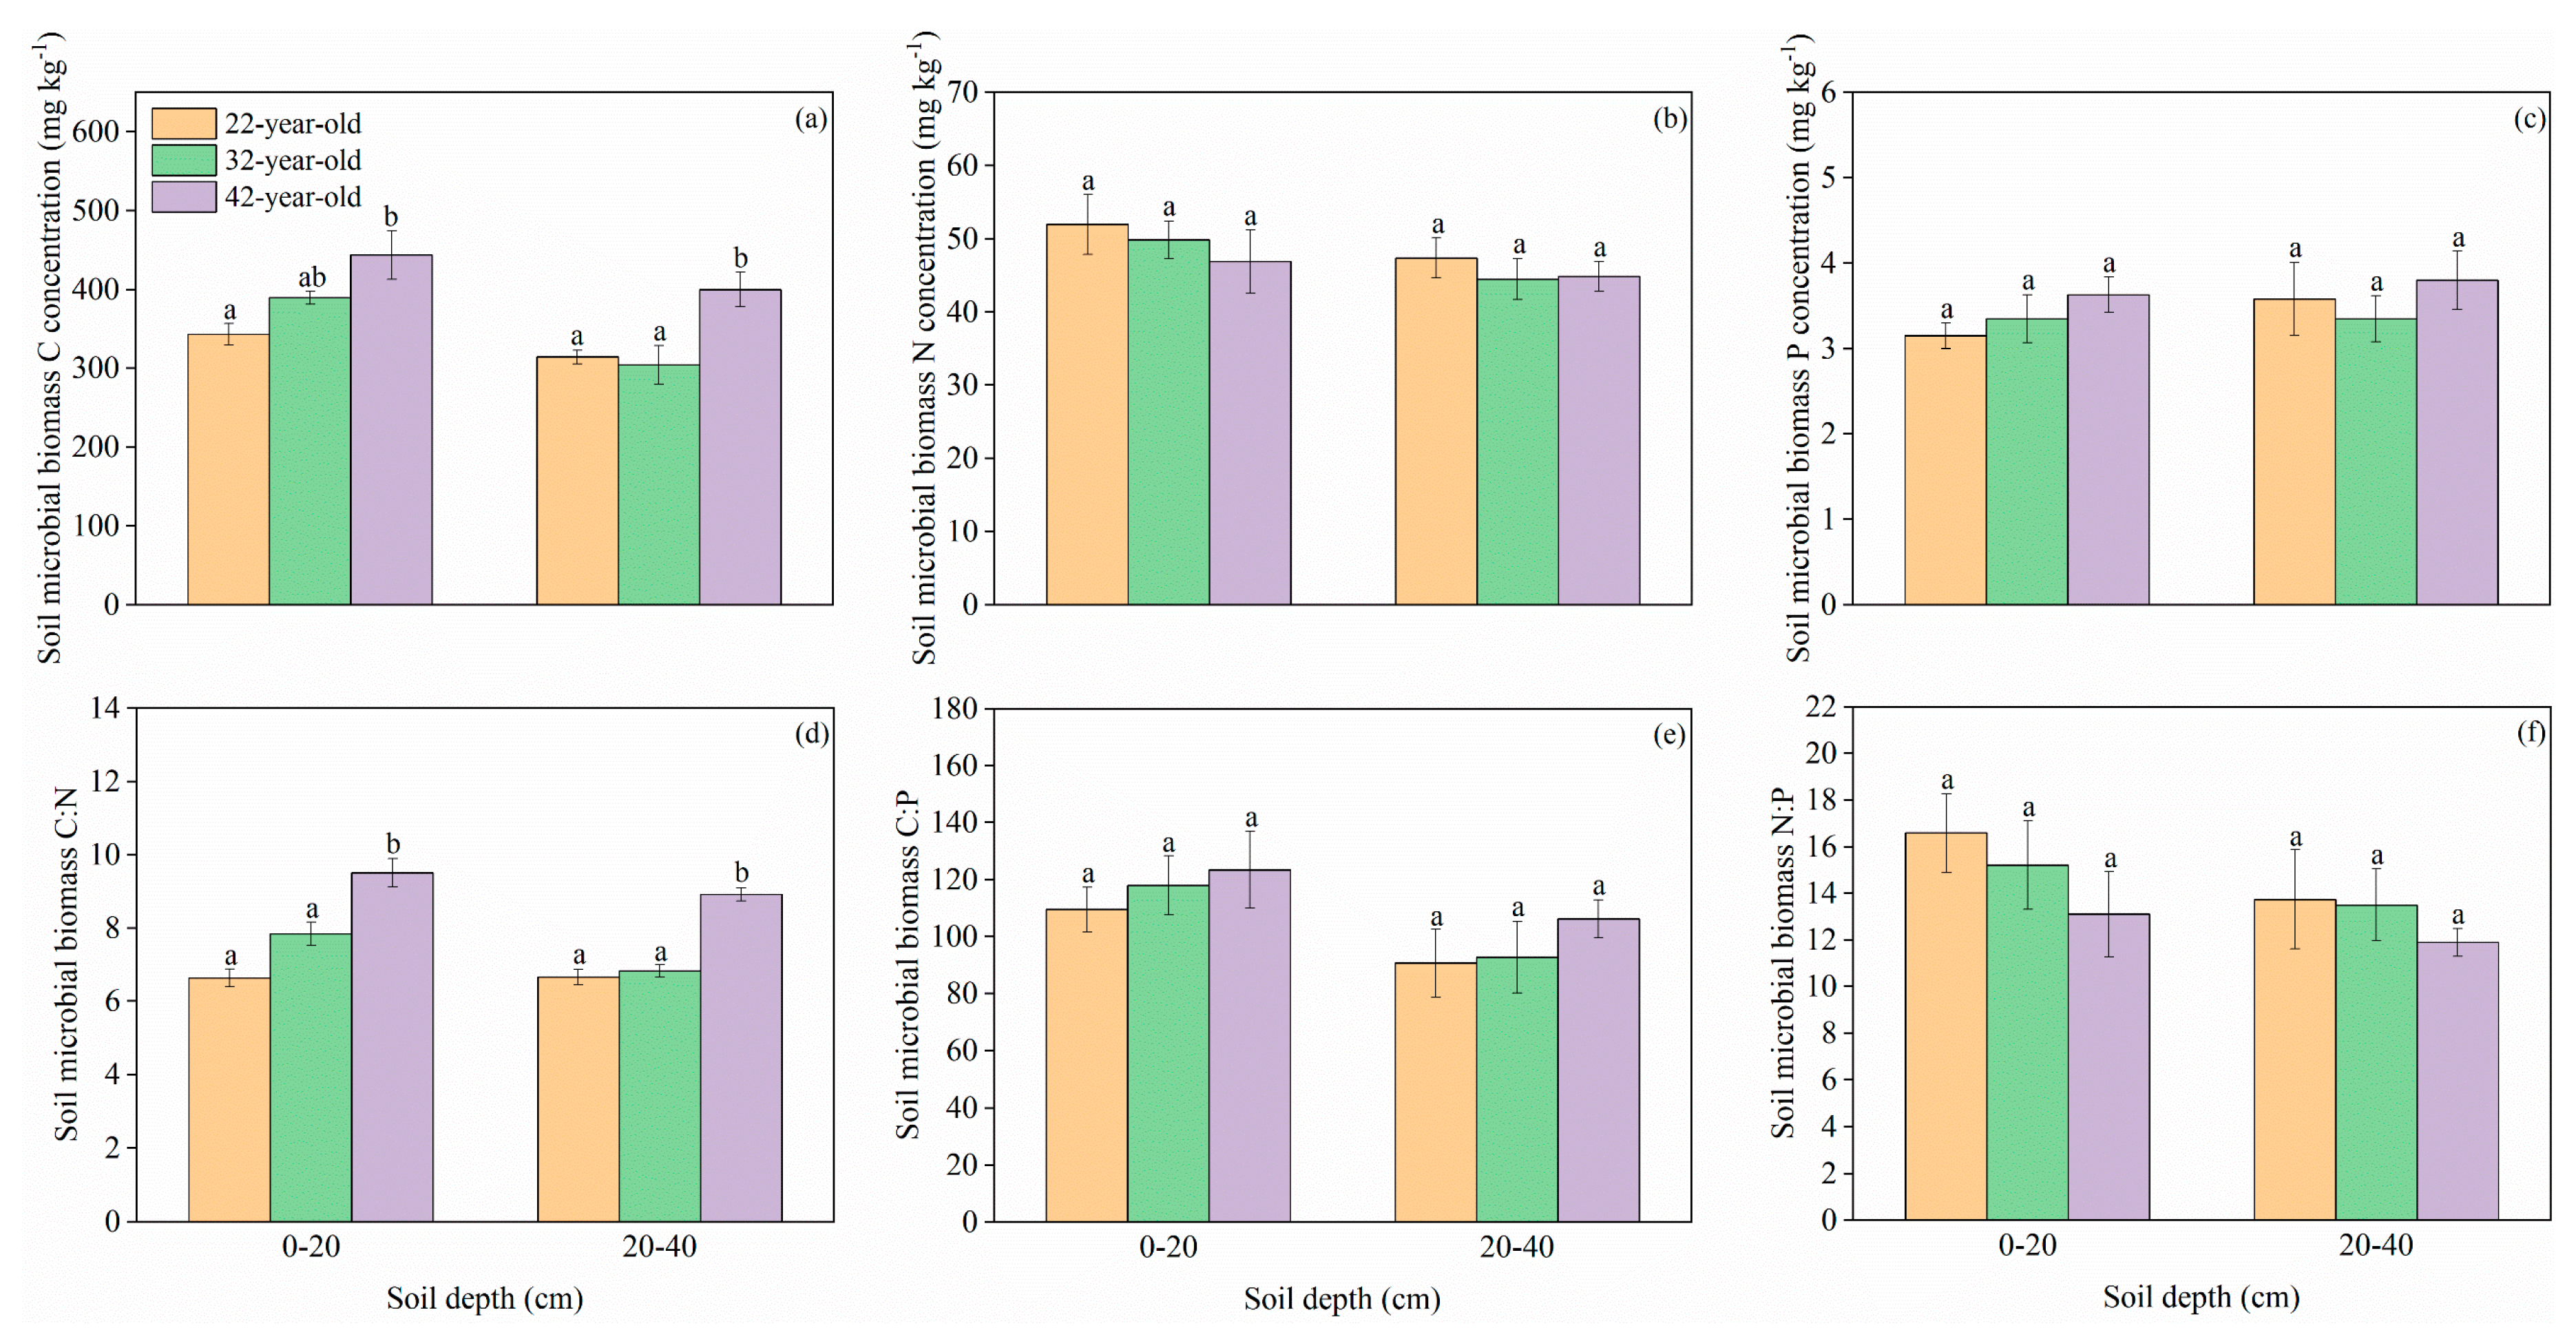
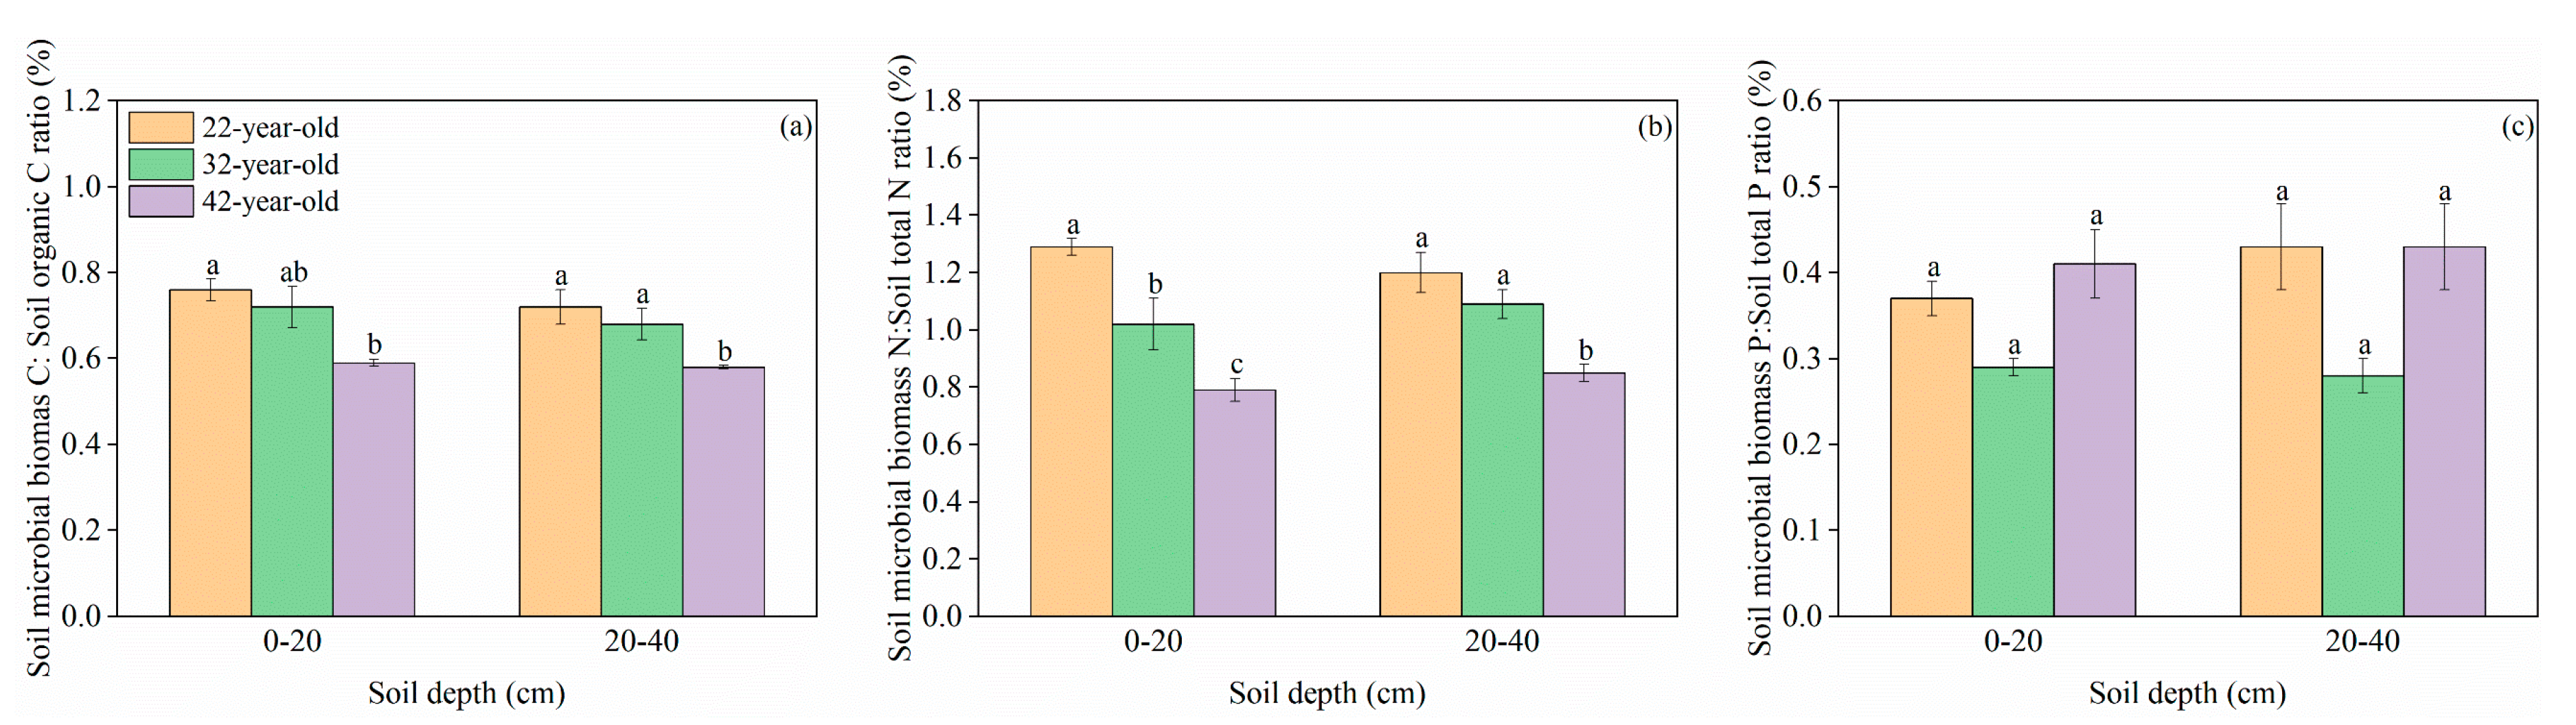
3.1. C, N, and P Concentrations and Stoichiometric Traits in Mineral Soil and Soil Microbial Biomass

The highest concentrations of soil organic C and total N were observed in the 42-year-old stand at both the 0–20 cm and 20–40 cm soil depths (Figure 1a,b). However, the soil total P concentration in the 32-year-old stand was significantly higher than that in the other two stands at these two depths (Figure 1c). For the soil microbial biomass C concentration, the mean value at the 0-20 cm soil depth increased from 343.16 mg kg−1 in the 22-year-old stand to 443.64 mg kg−1 in the 42-year-old stand (Figure 2a). At the 20–40 cm soil depth, the soil microbial biomass C concentrations in the 22- and 32-year -old stands were not much different, and both of them were significantly lower than the soil microbial biomass C concentration in the 42-year-old stand (p < 0.05) (Figure 2a). In contrast, there were no significant differences in the microbial biomass N concentration among the three stands at each soil depth (Figure 2b). At both the 0-20 cm and 20–40 cm soil depths, the microbial biomass P concentration also did not change obviously with stand age and ranged from 3.15 mg kg−1 and 3.35 mg kg−1 to 3.63 mg kg−1 and 3.80 mg kg−1, respectively (Figure 2c). Both the fractions of microbial biomass C in soil organic C and microbial biomass N in soil total N showed a decreasing trend with stand age at both the 0–20 cm and 20–40 cm soil depths (Figure 3a,b). Though the mean fraction of microbial biomass P in soil total P in the 32-year-old stands was lower than that in the other two stands at both the 0–20 cm and 20–40 cm soil depths, the differences did not reach statistical significance (Figure 3c). The soil C:N, C:P, and N:P ratios in the 42-year-old stands were all significantly higher than those in the 22- and 32-year-old stands at both the 0–20 cm and 20–40 cm soil depths (p < 0.05) (Figure 1d–f). In contrast, only the C:N ratio presented a significant variation among the three different stands for the soil microbial biomass (Figure 2d–f).

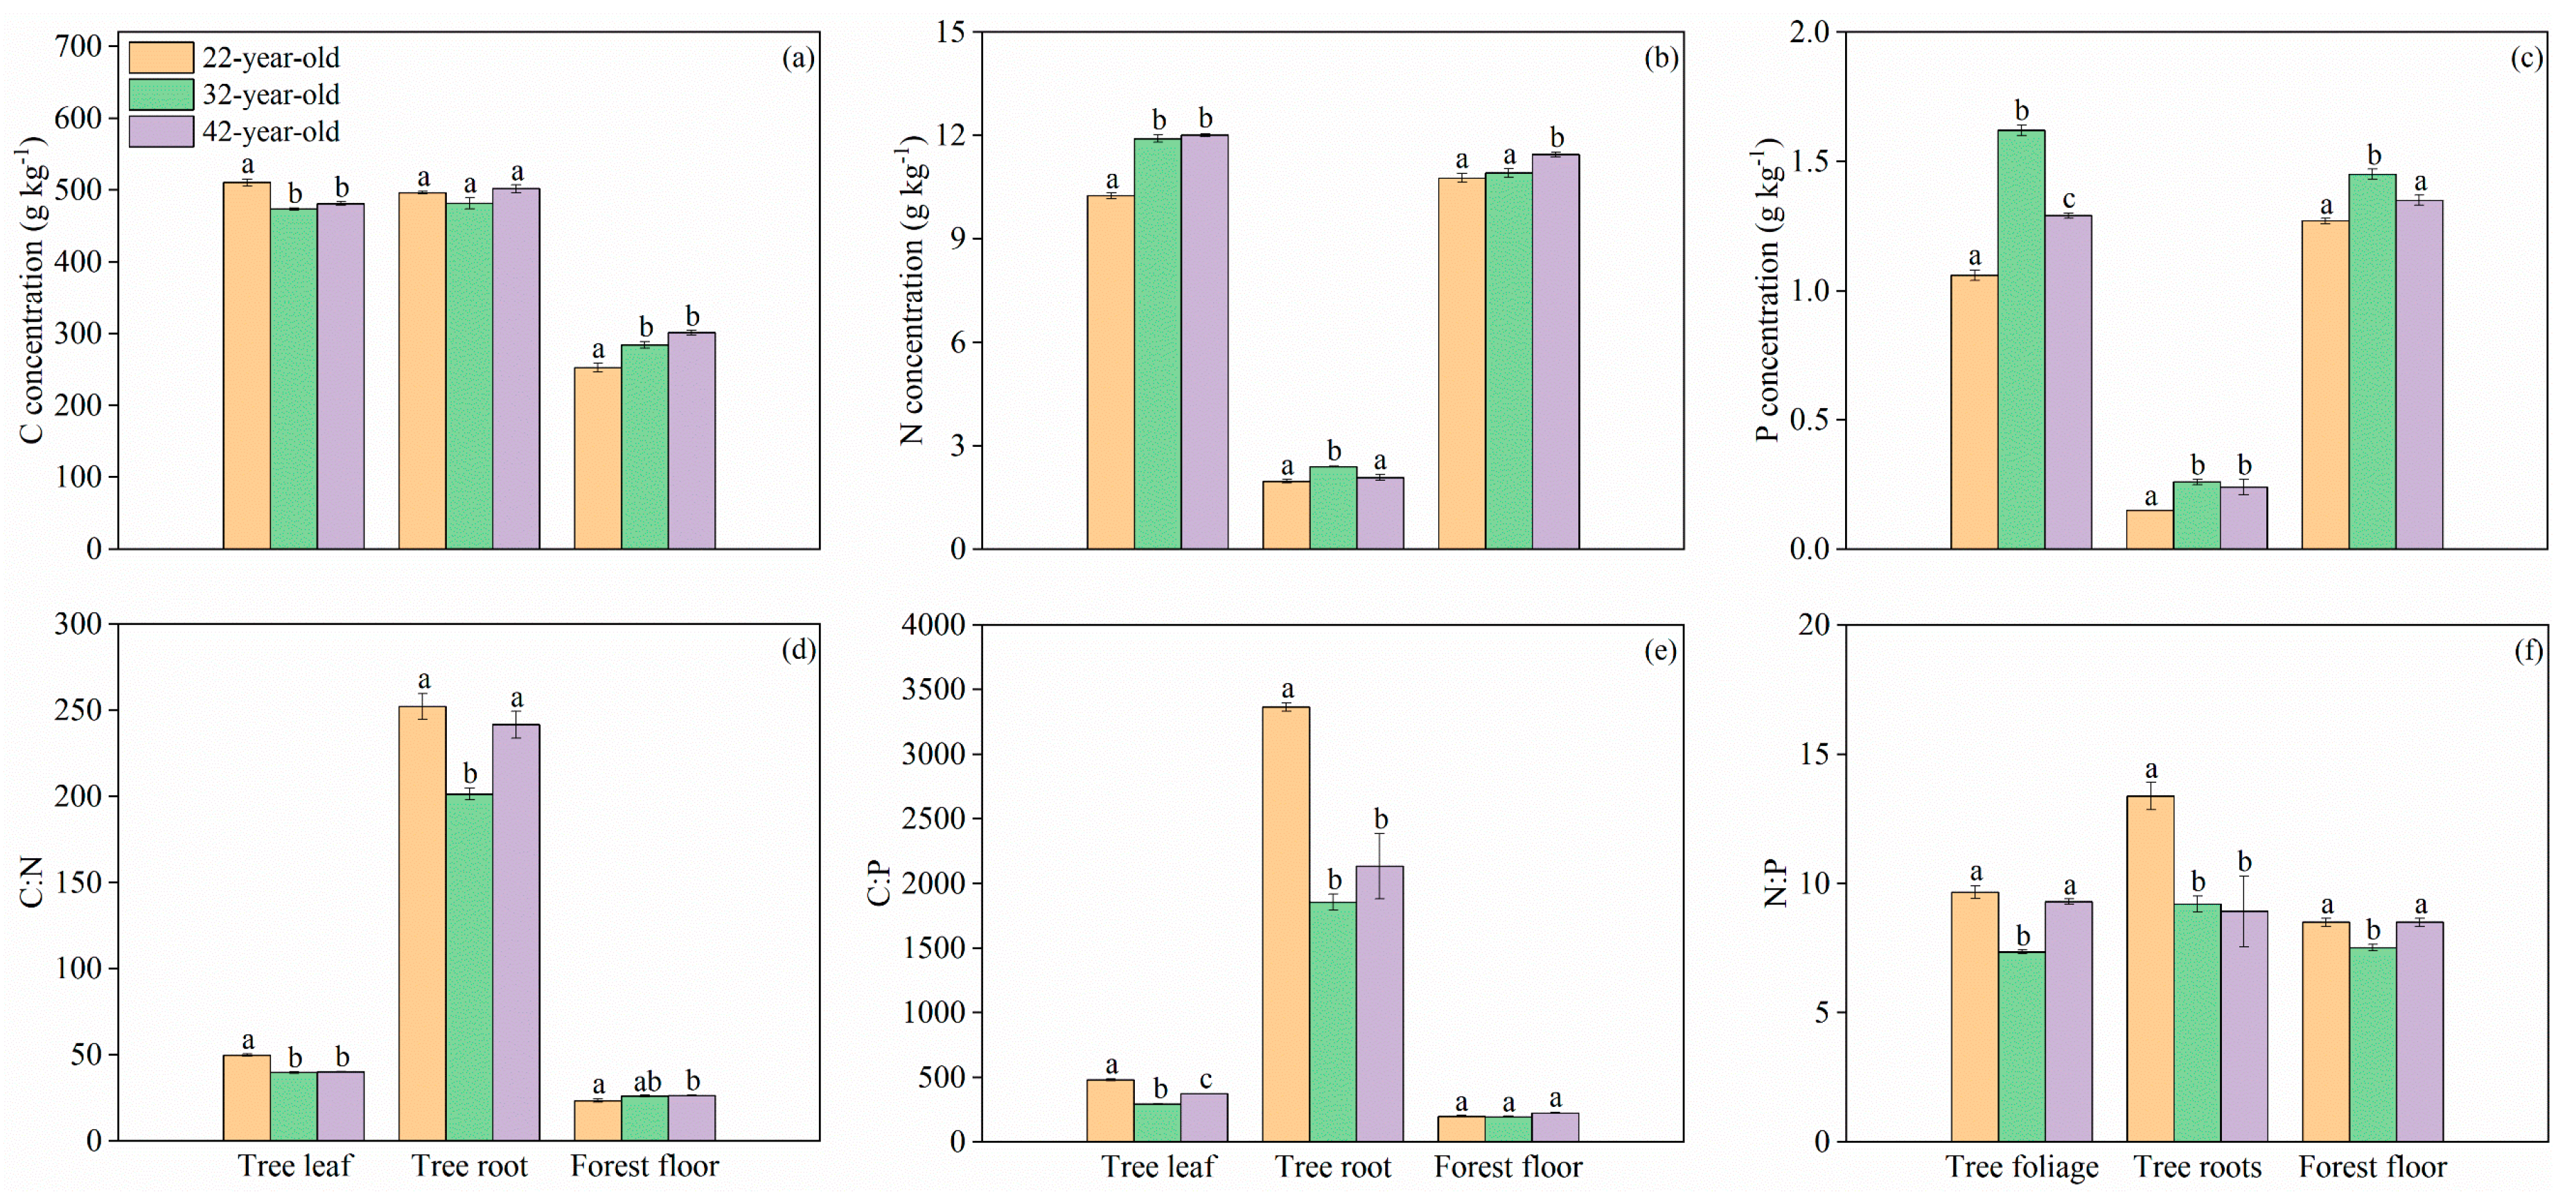
3.2. C, N, and P Concentrations and Stoichiometric Traits in Plants and Forest Floor

The variation patterns in C, N, and P concentrations of tree foliage differed from each other with stand age (Figure 4a–c). The highest concentrations of C, N, and P in tree foliage were found in the 22-, 42- and 32-year-old stands, respectively (Figure 4a–c). The C concentration of the tree roots did not significantly change with increasing stand age (Figure 4a); however, both the N and P concentrations in the tree roots significantly increased as stand age increased from 22 years to 32 years (Figure 4b,c). The mean C and N concentrations of the forest floor continuously increased from 252.76 g kg−1 and 10.77 g kg−1 in the 22-year-old stand to 301.86 g kg−1 and 11.45 g kg−1 in the 42-year-old stand, respectively (Figure 4a,b). In contrast, the P concentration of the forest floor first increased from 1.27 g kg−1 in the 22-year-old stand to 1.45 g kg−1 in the 32-year-old stand and then decreased to 1.35 g kg−1 in the 42-year-old stand (Figure 4c). With increasing stand age, the herb C, N, and P concentrations did not significantly change except for the aboveground C concentration (Figure 5a,c,e).
For the tree foliage and roots, the highest values of C:N, C:P, and N:P ratios were all observed in the 22-year-old stand, and C:N, C:P, and N:P ratios in the 22-year-old stand were significantly higher than those in the 32-year-old stand (p < 0.05) (Figure 4b,d,f). However, significant differences between the 22- and 32-year-old stands were found only for N:P ratios in the forest floor and the belowground herb (p < 0.05) (Figure 4f and Figure 5f).

3.3. Relationship between the Stoichiometric Traits of Mineral Soil and Other Ecosystem Components

The soil microbial biomass C:N ratio was significantly and positively correlated with the mineral soil C:N ratios at both the 0–20 cm and 20–40 cm soil depths (p < 0.05) (Table 2). The forest floor C:P ratio exhibited a significantly positive correlation with the mineral soil C:P ratio at both the 0–20 cm and 20–40 cm soil depths (p < 0.05) (Table 3). The N:P ratios in the belowground herb and the mineral soil were significantly and positively related at these two soil depths (p < 0.05) (Table 4). Furthermore, the N:P ratios in both tree foliage and the aboveground herb were also significantly and positively correlated with the mineral soil N:P ratio at a depth of 20–40 cm (p < 0.05) (Table 4). In contrast, the stoichiometric traits of the tree roots were not significantly related to those of the mineral soil (Table 2, Table 3 and Table 4).

3.4. Ecosystem C, N, and P Pools

With increasing stand age, the C and P stocks in the aboveground tree, tree roots, forest floor, and total ecosystem all increased first and then decreased (Table 5, Table 6 and Table 7). The N stock in the aboveground tree and tree roots and the P stock of mineral soil also followed the same variation pattern with increasing stand age (Table 6 and Table 7). However, the mean C stock in mineral soil and the mean N stock in mineral soil and total ecosystem continuously increased with increasing stand age (Table 5 and Table 6). Moreover, the C, N, and P stocks in aboveground herb and herb roots did not differ significantly among the three stands (Table 5, Table 6 and Table 7). The aboveground tree biomass was the dominant C pool, representing more than 55% of the total ecosystem C stock regardless of stand age (Table 5). In contrast, the mineral soil and the forest floor contributed much more than aboveground tree biomass to the total ecosystem N and P pool (Table 6 and Table 7).

4. Discussion

In the present study, the mineral soil C and N concentrations showed an increasing trend with increasing stand age, which is inconsistent with many previous studies [6,35,36]. These variations could be explained by the continuous input of litter and roots exudates along with stand development. However, there still exists some controversy regarding the effects of stand age on mineral soil C and N [37,38,39]. These controversial results may be caused by other influencing factors, such as previous land use, climate, and tree species, all of which may overshadow the impacts of stand age [4]. Different from the changing trend in mineral soil C and N concentrations, the highest value of mineral soil P concentration was observed in the 32-year-old stand and then decreased in the 42-year-old stand. With stand aging, the variation in soil total P concentration is more complex than that in soil C and N. Trees mobilize P from mineral soil into the biological P cycle, leading to a decrease in the soil total P concentration during the early growth process of the plantation; however, with increasing stand age, the litter input and decomposition gradually increase, which returns P to the soil and increases the total P concentration [40]. In addition, the decrease in soil pH with stand aging would reduce soil P availability because low pH drives phosphate to bind to Fe and Al precipitates [41]. Thus, the decrease in soil pH would also contribute to increasing soil total P concentration with increasing stand age. For the decrease in the total P concentration of mineral soil from the 32-year-old stand to the 42-year-old stand, this variation may be related to the plunge in tree density. During stand development, management by removing deadwood from plantations would not only decrease the elemental stock but also reduce the complement to soil P. Thus, we suggest that the total soil P concentration of mineral soil may exhibit a wave-changing pattern with increasing stand age.
In terms of soil microbes, we found that both the fraction of microbial C in soil organic C and the fraction of microbial N in soil organic N decreased with increasing stand age. The decreases in these two ratios indicate that the microbial biomass supported per unit C and N resources declined with stand aging [20]. Previous studies suggested that the fraction of microbial C in soil organic C was significantly and negatively correlated with the soil C:N ratio [42,43]. This negative relationship could be explained by soil microbes being suppressed by the lack of N resources under the condition of a high soil C:N ratio and then decreasing the C demand [44]. Moreover, the variation in the availability of soil C and N resources would further shape the assembly of the soil microbial community because bacteria are generally considered to require more N per unit biomass C accumulation than fungi [18,45]. Additionally, the accumulation of litter and decrease in pH is adverse for bacteria with stand development, which would also contribute to increasing the fungal abundance [18,46].
The C concentration of tree foliage decreased from the 22-year-old stand to the 32- and 42-year-old stands in the present study. However, the amplitude of variation is less than 10%, which was similar to the previous description for Sonneratia apetala plantations [47]. However, the N and P concentrations of tree foliage in the 32-and 42-year-old stands were much higher than those in the 22-year-old stand, resulting in a significant reduction in the C:N and C:P ratios in the two older P. asperata stands. Biomass is composed of different biochemical components that vary according to tree organ, tree species, geographical location, climate, and soil conditions [48]. Previous studies argued that increasing the C-rich metabolite concentration, such as tannins, could enhance the defense ability against diseases and insect pests [49], while the biomass N concentration and the N utilization efficiency could be changed by the variation in N supply [50,51]. Moreover, the growth rate hypothesis suggested that fast-growing organisms need relatively more P-rich RNA to support the rapid synthesis of large amounts of protein, resulting in a low biomass N:P ratio [52,53]. Hence, changes in the elemental concentrations and stoichiometric traits would reflect differences in the plant survival environment and adaptation strategies. In the present study, we suggest that both variations in nutrient demand and soil nutrient levels lead to increases in the N and P concentrations of tree foliage in the two older stands. It has been demonstrated that plant growth is limited by N if the N:P ratio < 14, constrained by P if the N:P ratio > 16, and co-limited by both N and P if the N:P ratio is between the two threshold values [54]. The present study found that all the N:P ratios in tree foliage, tree roots, and herbs were less than 14, and most of them were less than 10, indicating that all three different stands were severely scarce in terms of N nutrition. A deficiency in the N supply would reduce the production of cytokinins and accelerate leaf senescence because N nutrients are translocated from senescent leaves to young leaves [55]. The present study found that the N:P ratios in tree foliage, aboveground herbs, and belowground herbs were all significantly and positively correlated with the N:P ratio at a depth of 20–40 cm in mineral soil. In contrast, the N:P ratio in tree roots was not significantly correlated with the soil N:P ratio in any depth. These results may indicate that the stoichiometric trait in roots was less sensitive than that in tree foliage to the soil nutrient availability. These findings are consistent with the previous study that demonstrated the stoichiometric homeostasis in roots is more stable than that in foliage for both Symplocos ramosissima and Machilus gamblei seedlings [56]. However, some studies concerning other plant species suggested that stoichiometric homeostasis was stronger in foliage [17,57,58]. These contradictory results may be caused by the differences in tree species, growth stage, and external environment [59]. The present study suggests that P. asperata would prioritize meeting the requirements of N and P nutrient balance in the roots compared with foliage, which would be beneficial to sustainable growth under the environment of the thin soil layer in this subalpine area.
The total ecosystem C, N, and P stocks increased by more than 1.2-fold when increasing stand age from the 22-year-old stand to the 32-year-old stand. In contrast, the N stock was not significantly different between the 32-year-old and 42-year-old stands, and the mean C and P stocks even decreased in the 42-year-old stand, which is similar to the previous findings [60]. Our results did not in line with the hypothesis. The present study indicates that P. asperata plantations would not reach a stable state after 30 years of establishment, C and nutrient losses could occur during later stand development, and P. asperata plantations have been facing N limitation. Thus, the regular use of N fertilizers is suggested as an essential management measure for these different aged P. asperata plantations. In addition, other managements, such as adding organic matter and adjustment of tree density [30,61], may also contribute to improving the soil fertility of these P. asperata plantations, thereby achieving the goals of making land degradation neutrality and sustainable development [62,63].

5. Conclusions

The soil organic C and total N concentrations increased with increasing stand age; however, the soil total P concentration showed a changing process of increasing first and then descending. Additionally, all the stands of the P. asperata plantation were limited by the scarcity of N nutrition. The C:N, C:P, and N:P ratios of the mineral soil were only correlated with the corresponding stoichiometric traits in specific ecosystem components during stand development. The relative changes in soil C and N concentrations affected the microbial C:N ratio and may further shape the assembly of the soil microbial community. Compared with foliage, P. asperata would prioritize meeting the N requirement of the root. The C, N, and P stocks in the total ecosystem did not continue to increase significantly with increasing stand age due to the density of the P. asperata plantation plunging in the later growth stage. The proportion of aboveground tree biomass C to the C stocks of the total ecosystem was the highest regardless of stand age. In contrast, mineral soil and forest floor were the major contributors to the total ecosystem N and P stocks for all stands. The information provided by our study will provide a better understanding of the details of dynamics in P. asperata plantations established on cutovers of subalpine areas. Due to the limitation in the number of replicated stands in our study, the results do not represent the whole variation pattern of stand development. Thus, further evidence for the effects of stand age on stoichiometric traits and element stocks in P. asperata plantations will be required.

Author Contributions

Formal analysis, J.C.; Funding acquisition, H.S.; Investigation, J.C. and H.P.; Methodology, J.C., H.P., Z.C., and H.S.; Writing–original draft, J.C. All authors have read and agreed to the published version of the manuscript.

Funding

This study was supported by the National Key R&D Program of China (No. 2017YFC0505001).

Conflicts of Interest

The authors declare no conflict of interest.

References

  1. Sun, L.; Zhang, B.; Wang, B.; Zhang, G.; Zhang, W.; Zhang, B.; Chang, S.; Chen, T.; Liu, G. Leaf elemental stoichiometry of Tamarix Lour. species in relation to geographic, climatic, soil, and genetic components in China. Ecol. Eng. 2017, 106, 448–457. [Google Scholar] [CrossRef]
  2. Elser, J.J. Ecological stoichiometry: From sea to lake to land. Trends Ecol. Evol. 2000, 15, 393–394. [Google Scholar] [CrossRef]
  3. Elser, J.J.; Dobberfuhl, D.R.; Mackay, N.A.; Schampel, J.H. Organism size, life history and N:P stoichiometry. Bioscience 1996, 46, 674–684. [Google Scholar] [CrossRef] [Green Version]
  4. Cao, J.; Wang, X.; Tian, Y.; Wen, Z.; Zha, T. Pattern of carbon allocation across three different stages of stand development of a Chinese pine (Pinus tabulaeformis) forest. Ecol. Res. 2012, 27, 883–892. [Google Scholar] [CrossRef]
  5. Larsen, M.L.; Wihlelm, S.W.; Lennon, J.T. Nutrient stoichiometry shapes microbial coevolution. Ecol. Lett. 2019, 22, 1009–1018. [Google Scholar] [CrossRef]
  6. Chen, L.; Deng, Q.; Yuan, Z.; Mu, X.; Kallenbach, R.L. Age-related C:N:P stoichiometry in two plantation forests in the Loess Plateau. Ecol. Eng. 2018, 120, 14–22. [Google Scholar] [CrossRef]
  7. Peng, Y.; Li, F.; Zhou, G.; Fang, K.; Zhang, D.; Li, C.; Yang, G.; Wang, G.; Wang, J.; Yang, Y. Linkages of plant stoichiometry to ecosystem production and carbon fluxes with increasing nitrogen inputs in an alpine steppe. Glob. Chang. Biol. 2016, 23, 5249–5259. [Google Scholar] [CrossRef]
  8. Bielski, R.L. Phosphate pools, phosphate transport, and phosphate availability. Ann. Rev. Plant. Physiol. 1973, 24, 225–252. [Google Scholar] [CrossRef]
  9. Rong, Q.; Liu, J.; Cai, Y.; Lu, Z.; Zhao, Z.; Yue, W.; Xia, J. Leaf carbon, nitrogen and phosphorus stoichiometry of Tamarix chinensis Lour. in the Laizhou Bay coastal wetland, China. Ecol. Eng. 2015, 76, 57–65. [Google Scholar] [CrossRef]
  10. Li, P.; Yang, Y.; Han, W.; Fang, J. Global patterns of soil microbial nitrogen and phosphorus stoichiometry in forest ecosystems. Glob. Ecol. Biogeogr. 2014, 23, 979–987. [Google Scholar] [CrossRef]
  11. Leal, M.C.; Seehausen, O.; Matthews, B. The ecology and evolution of stoichiometric phenotypes. Trends Ecol. Evol. 2017, 32, 108–117. [Google Scholar] [CrossRef] [PubMed]
  12. Yu, H.; Fan, J.; Li, Y. Foliar carbon, nitrogen, and phosphorus stoichiometry in a grassland ecosystem along the Chinese Grassland Transect. Acta Ecol. Sin. 2017, 37, 133–139. [Google Scholar] [CrossRef]
  13. Cao, J.; Shang, H.; Chen, Z.; Tian, Y.; Yu, H. Effects of elevated ozone on stoichiometry and nutrient pools of Phoebe bourneri (Hemsl.) Yang and Phoebe Zhennan S. Lee et F. N. Wei seedlings in subtropical China. Forests 2016, 7, 78. [Google Scholar] [CrossRef] [Green Version]
  14. Heuck, C.; Weig, A.; Spohn, M. Soil microbial biomass C:N:P stoichiometry and microbial use of organic phosphorus. Soil Biol. Biochem. 2015, 85, 119–129. [Google Scholar] [CrossRef]
  15. Fan, H.; Wu, J.; Liu, W.; Yuan, Y.; Hu, L.; Cai, Q. Linkages of plant and soil C:N:P stoichiometry and their relationships to forest growth in subtropical plantations. Plant. Soil 2015, 392, 127–138. [Google Scholar] [CrossRef]
  16. Visser, S.; Keesstra, S.; Maas, G.; de Cleen, M.; Molenaar, C. Soil as a basis to create enabling conditions for transitions towards sustainable land management as a key to achieve the SDGs by 2030. Sustainability 2019, 11, 6792. [Google Scholar] [CrossRef] [Green Version]
  17. Minden, V.; Kleyer, M. Internal and external regulation of plant organ stoichiometry. Plant. Biol. 2014, 16, 897–907. [Google Scholar] [CrossRef]
  18. Fierer, N.; Strickland, D.L.; Bradford, M.A.; Cleveland, C.C. Global patterns in belowground communities. Ecol. Lett. 2009, 12, 1238–1249. [Google Scholar] [CrossRef]
  19. Zhao, F.Z.; Ren, C.J.; Han, X.H.; Yang, G.H.; Doughty, R. Changes of soil microbial and enzyme activities are linked to soil C, N and P stoichiometry in afforested ecosystems. For. Ecol. Manag. 2018, 427, 289–295. [Google Scholar] [CrossRef]
  20. Zhou, Z.-H.; Wang, C.-K. Changes of the relationships between soil and microbes in carbon, nitrogen and phosphorus stoichiometry during ecosystem succession. Chin. J. Plant. Ecol. 2016, 40, 1257–1266. [Google Scholar] [CrossRef] [Green Version]
  21. Chen, C.; Park, T.; Wang, X.; Piao, S.; Xu, B.; Chaturvedi, R.K.; Fuchs, R.; Brovkin, V.; Ciais, P.; Fensholt, R.; et al. China and India lead in greening of the world through land-use management. Nat. Sustain. 2019, 2, 122–129. [Google Scholar] [CrossRef] [PubMed]
  22. Peng, S.-S.; Piao, S.; Zeng, Z.; Ciais, P.; Zhou, L.; Li, L.Z.X.; Myneni, R.B.; Yin, Y.; Zeng, H. Afforestation in China cools local land surface temperature. Proc. Natl. Acad. Sci. USA 2014, 111, 2915–2919. [Google Scholar] [CrossRef] [PubMed] [Green Version]
  23. Yang, X.; Wang, X.; Li, N. Combating climate change: What will China’s Forestry do? Ambio 2010, 39, 340–343. [Google Scholar] [CrossRef] [Green Version]
  24. Brockerhoff, E.G.; Jactel, H.; Parrotta, J.A.; Quine, C.P.; Sayer, J. Plantation forests and biodiversity: Oxymoron or opportunity? Biodivers. Conserv. 2008, 17, 925–951. [Google Scholar] [CrossRef]
  25. Huang, M.; Zhang, L.; Gallichand, J. Runoff responses to afforestation in watershed of the Loess Plateau, China. Hydrol. Process. 2003, 17, 2599–2609. [Google Scholar] [CrossRef]
  26. Li, C.; Zhou, X. Status and future trends in plantation silviculture in China. Ambio 2000, 29, 354–355. [Google Scholar] [CrossRef]
  27. Miao, N.; Liu, S.; Shi, Z.; Yu, H.; Liu, X. Spatial patterns of dominant tree species in sub-alpine Betula-abies forest in West Sichuan of China. Chin. J. Appl. Ecol. 2009, 20, 1263–1270. [Google Scholar]
  28. Liu, Y.; Chen, J.; Liu, Q.; Wu, Y. Nitrification and denitrification in subalpine coniferous forests of different restoration stages in western Sichuan, China. Front. For. China 2007, 2, 260–265. [Google Scholar] [CrossRef] [Green Version]
  29. Zhang, Y.; Zhao, C.; Liu, S. The influence factors of sub-alpine forest restoration in Miyaluo, West Sichuan. Sci. Silvae Sin. 2005, 41, 189–193. [Google Scholar]
  30. Pang, X.-Y.; Liu, Q.; Liu, S.-Q.; Wu, Y.; Lin, B.; He, H.; Zhang, Z.-J. Changes of soil fertility quality properties under subalpine spruce plantation in Western Sichuan. Acta Ecol. Sin. 2004, 24, 261–267. [Google Scholar]
  31. Pang, X.; Huang, J.; Zhao, Q.; Feng, D.; Bao, W.; Tian, G. Ecosystem carbon stock across a chronosequence of spruce plantations established on cutovers of a high-elevation region. J. Soil Sediments 2016, 17, 2239–2249. [Google Scholar] [CrossRef]
  32. Xu, Z.; Yin, H.; Xiong, P.; Wan, C.; Liu, Q. Short-term responses of Picea asperata seedlings of different ages grown in two contrasting forest ecosystems to experimental warming. Environ. Exp. Bot. 2012, 77, 1–11. [Google Scholar] [CrossRef]
  33. Liu, G.S. Soil Physical and Chemical Analysis and Description of Soil Profiles, 1st ed.; Standards Press of China: Beijing, China, 1996; pp. 123–167. [Google Scholar]
  34. Bao, S.D. Agricultural Soil Analysis, 3rd ed.; China Agriculture Press: Beijing, China, 1999; pp. 74–270. [Google Scholar]
  35. Cao, J.; Yan, W.; Xiang, W.; Chen, X.; Lei, P. Stoichiometry characterization of soil C, N, and P of Chinese fir plantations of three different ages in Huitong, Hunan province, China. Sci. Silvae Sin. 2015, 51, 1–8. [Google Scholar]
  36. Cui, N.; Liu, X.; Zhang, D.; Zhang, J.; Liu, Y.; Deng, C.; Ji, T.; Chen, Y. The distribution pattern of carbon, nitrogen and phosphorus and the stoichiometry characteristics of Pinus massoniana plantation in different ages. Ecol. Environ. Sci. 2014, 23, 188–195. [Google Scholar]
  37. Li, Q.; Mo, Q.; Wang, F.; Li, Y.; Xu, X.; Zou, B.; Li, X.; Chen, Y.; Li, Z. Nutrient utilization by Casuarina equisetifolia plantation of different ages in the tropical coastal area of South China. Chin. J. Appl. Environ. Biol. 2015, 21, 139–146. [Google Scholar]
  38. Mao, R.; Zeng, D.-H.; Hu, Y.-L.; Li, L.-J.; Yang, D. Soil organic carbon and nitrogen stocks in an age-sequence pf poplar stands planted on marginal agricultural land in Northeast China. Plant. Soil 2010, 332, 277–287. [Google Scholar] [CrossRef]
  39. Noh, N.-J.; Son, Y.; Lee, S.-K.; Seo, K.-W.; Heo, S.-J.; Yi, M.-J.; Park, P.-S.; Kim, R.-H.; Son, Y.-M.; Lee, K.-H. Carbon and nitrogen storage in an age-sequence of Pinus densiflora stands in Korea. Sci. China Life Sci. 2010, 53, 822–830. [Google Scholar] [CrossRef]
  40. Wu, H.; Xiang, W.; Chen, L.; Ouyang, S.; Xiao, W.; Li, S.; Forrester, D.I.; Lei, P.; Zeng, Y.; Deng, X.; et al. Soil phosphorus bioavailability and recycling increased with stand age in Chinese fir plantations. Ecosystems 2020, 23, 973–988. [Google Scholar] [CrossRef]
  41. Wu, H.; Xiang, W.; Ouyang, S.; Xiao, W.; Li, S.; Chen, L.; Lei, P.; Deng, X.; Zeng, Y.; Zeng, L.; et al. Tree growth rate and soil nutrient status determine the shift in nutrient-use strategy of Chinese fir plantations along a chronosequence. For. Ecol. Manag. 2020, 476, 117896. [Google Scholar] [CrossRef]
  42. Zhou, Z.H.; Wang, C.K. Reviews and syntheses: Soil resources and climate jointly drive variations in microbial biomass carbon and nitrogen in China’s forest ecosystems. Biogeosciences 2015, 6751–6760. [Google Scholar] [CrossRef] [Green Version]
  43. Xu, X.; Schimel, J.P.; Thornton, P.E.; Song, X.; Yuan, F.; Goswami, S. Substrate and environmental controls on microbial assimilation of soil organic carbon: A framework for earth system models. Ecol. Lett. 2014, 17, 547–555. [Google Scholar] [CrossRef] [PubMed]
  44. Zhou, Z.-H.; Wang, C.-K. Responses and regulation mechanisms of microbial decomposers to substrate carbon, nitrogen, and phosphorus stoichiometry. Chin. J. Plant. Ecol. 2016, 40, 620–630. [Google Scholar] [CrossRef] [Green Version]
  45. Fanin, N.; Fromin, N.; Buatois, B.; Hättenschwiller, S. An experimental test of the hypothesis of non-homeostatic consumer stoichiometry in a plant litter-microbe system. Ecol. Lett. 2013, 16, 764–772. [Google Scholar] [CrossRef] [PubMed]
  46. Mao, R.; Cui, Q.; Zhao, Q.; Ai, G.; Li, L.; Zeng, D. Soil microbial biomass and activity in relation to stand age of poplar shelterbelts. Chin. J. Appl. Ecol. 2009, 20, 2079–2084. [Google Scholar]
  47. Ren, H.; Chen, H.; Li, Z.; Han, W. Biomass accumulation and carbon storage of four different aged Sonneratia apetala plantations in Southern China. Plant. Soil 2010, 327, 279–291. [Google Scholar] [CrossRef]
  48. Bert, D.; Danjon, F. Carbon concentration variations in the roots, stem and crown of mature Pinus Pinaster (Ait.). For. Ecol. Manag. 2006, 222, 279–295. [Google Scholar] [CrossRef]
  49. Li, M.; Yu, L.; Du, M.; Huang, Z.; Shi, J. C, N, and P stoichiometry and their interaction with plants, litter, and soil in a Cunninghamia lanceolata plantation with different ages. Acta Ecol. Sin. 2018, 38, 7772–7781. [Google Scholar]
  50. Nehe, A.S.; Misra, S.; Misra, S.; Murchie, E.H.; Chinnathambi, K.; Foulkes, M.J. Genetic variation in N-use efficiency and associated traits in Indian wheat cultivars. Field Crops Res. 2018, 225, 152–162. [Google Scholar] [CrossRef]
  51. Ainsworth, E.A.; Rogers, A. The response of photosynthesis and stomatal conductance to rising [CO2]: Mechanisms and environmental interactions. Plant. Cell Environ. 2007, 30, 258–270. [Google Scholar] [CrossRef]
  52. Elser, J.J.; Sterner, R.W.; Gorokhova, E.; Fagan, W.F.; Markow, T.A.; Cotner, J.B.; Harrison, J.F.; Hobbie, S.E.; Odell, G.M.; Weider, L.J. Biological stoichiometry from genes to ecosystems. Ecol. Lett. 2000, 3, 540–550. [Google Scholar] [CrossRef] [Green Version]
  53. Matzek, V.; Vitousek, P.M. N:P stoichiometry and protein: RNA ratios in vascular plants: An evaluation of the growth-rate hypothesis. Ecol. Lett. 2009, 12, 765–771. [Google Scholar] [CrossRef]
  54. Koerselman, W.; Meuleman, A.F.M. The vegetation N:P ratio: A new tool to detect the nature of nutrient limitation. J. Appl. Ecol. 1996, 33, 1441–1450. [Google Scholar] [CrossRef]
  55. Güsewell, S. N:P ratios in terrestrial plants: Variation and functional significance. New Phytol. 2004, 164, 243–266. [Google Scholar] [CrossRef]
  56. Shi, X.-M.; Qi, J.-H.; Song, L.; Liu, W.-Y.; Huang, J.-B.; Li, S.; Lu, H.-Z.; Chen, X. C, N and P stoichiometry of two dominant seedlings and their responses to nitrogen additions in the montane moist evergreen broad-leaved forest in Ailao Mountains, Yunnan. Chin. J. Plant. Ecol. 2015, 39, 962–970. [Google Scholar]
  57. Schreeg, L.A.; Santiago, L.S.; Wright, S.J.; Turner, B.L. Stem, root, and old leaf N:P ratios are more responsive indicators of soil nutrient availability than new foliage. Ecology 2014, 95, 2062–2068. [Google Scholar] [CrossRef] [PubMed] [Green Version]
  58. Garrish, V.; Cernusak, L.; Winter, K.; Turner, B.L. Nitrogen to phosphorus ratio of plant biomass versus soil solution in a tropical pioneer tree, Ficus insipida. J. Exp. Bot. 2010, 61, 3735–3748. [Google Scholar] [CrossRef] [PubMed]
  59. Zhang, T.; Liu, W.; Huang, J.; Hu, T.; Tang, D.; Chen, Q. Characteristics of plant ecological stoichiometry homeostasis. Guihaia 2019, 39, 701–712. [Google Scholar] [CrossRef]
  60. Alcañiz, M.; Úbeda, X.; Cerdà, A. A 13-Year Approach to Understand the Effect of Prescribed Fires and Livestock Grazing on Soil Chemical Properties in Tivissa, NE Iberian Peninsula. Forests 2020, 11, 1013. [Google Scholar] [CrossRef]
  61. Novara, A.; Pulido, M.; Rodrigo-Comino, J.; Di Prima, S.; Smith, P.; Gristina, L.; Giménez-Morera, A.; Terol, E.; Salesa, D.; Keesstra, S. Long-term organic farming on a citrus plantation results in soil organic carbon recovery. Geogr. Res. Lett. 2019, 45, 271–286. [Google Scholar] [CrossRef] [Green Version]
  62. Keesstra, S.; Mol, G.; de Leeuw, J.; Okx, J.; Molenaar, C.; de Cleen, M.; Visser, S. Soil-related sustainable development goals: Four concepts to make land degradation neutrality and restoration work. Land 2018, 7, 133. [Google Scholar] [CrossRef] [Green Version]
  63. Keesstra, S.D.; Bouma, J.; Wallinga, J.; Tittonell, P.; Smith, P.; Cerdà, A.; Montanarella, L.; Quinton, J.N.; Pachepsky, Y.; van der Putten, W.H.; et al. The significance of soils and soil science towards realization of the United Nations sustainable development goals. Soil 2016, 2, 111–128. [Google Scholar] [CrossRef] [Green Version]
Figure 1. (a) C concentration, (b) N concentration, (c) P concentration, (d) C:N, (e) C:P and (f) N:P in the mineral soil of three different aged P. asperata plantations. Different lowercase letters indicate a significant difference between different aged stands at the same soil horizon (p < 0.05).
Forests 11 01346 g001
Figure 2. (a) C concentration), (b) N concentration, (c) P concentration, (d) C:N, (e) C:P, and (f) N:P in the soil microbes of three different aged P. asperata plantations. Different lowercase letters indicate a significant difference between different aged stands at the same soil horizon (p < 0.05).
Forests 11 01346 g002
Figure 3. The fractions of (a) microbial biomass C in soil organic C, (b) microbial biomass N in soil total N, and (c) microbial biomass P in soil total P in three different aged P. asperata plantations. Different lowercase letters indicate a significant difference between different aged stands at the same soil horizon (p < 0.05).
Forests 11 01346 g003
Figure 4. (a) C concentration, (b) N concentration, (c) P concentration, (d) C:N, (e) C:P and (f) N:P in the tree biomass and the forest floor in three different aged P. asperata plantations. Different lowercase letters indicate a significant difference between different aged stands for the same variable (p < 0.05).
Forests 11 01346 g004
Figure 5. (a) C concentration, (b) N concentration, (c) P concentration, (d) C:N, (e) C:P and (f) N:P in the herb biomass of three different aged P. asperata plantations. Different lowercase letters indicate a significant difference between different aged stands for the same variable (p < 0.05).
Forests 11 01346 g005
Table 1. Basic characteristics of the three P. asperata plantations.
Stand AgeElevation
(m a.s.l.)
Slope Degree (°)Slope AspectDensity
(Trees hm−2)
Mean DBH (cm)
22330815–20East173311.93
32333018–25East155818.34
42336011–24East79223.32
DBH, Diameter at breast height.
Table 2. The relationship among the different components C:N in P. asperata plantations.
Tree LeafTree RootAboveground HerbBelowground HerbForest FloorSoil Microbes
(0–20 cm)
Soil Microbes
(20–40 cm)
Mineral Soil
(0–20 cm)
−0.4050.324−0.189−0.353−0.3400.734 *0.919 **
Mineral Soil
(20–40 cm)
−0.3830.4250.362−0.2740.5140.743 *0.840 **
* Significances are indicated at p < 0.05. ** Significances are indicated at p < 0.01.
Table 3. The relationship among the different components C:P in P. asperata plantations.
Tree LeafTree RootAboveground HerbBelowground HerbForest FloorSoil Microbes
(0–20 cm)
Soil Microbes
(20–40 cm)
Mineral Soil
(0–20 cm)
0.046−0.2180.5460.2980.787 *0.3000.370
Mineral Soil
(20–40 cm)
0.2670.0690.749 *0.1540.852 **0.0390.385
* Significances are indicated at p < 0.05. ** Significances are indicated at p < 0.01.
Table 4. The relationship among the different components N:P in P. asperata plantations.
Tree LeafTree RootAboveground HerbBelowground HerbForest FloorSoil Microbes
(0–20 cm)
Soil Microbes
(20–40 cm)
Mineral Soil
(0–20 cm)
0.504−0.3070.6520.834 **0.596−0.380−0.388
Mineral Soil
(20–40 cm)
0.717 *0.0830.803 **0.711 *0.799 *−0.421−0.278
* Significances are indicated at p < 0.05. ** Significances are indicated at p < 0.01.
Table 5. The C Stocks of different components and their contributions to the total ecosystem C pool in three different aged stands.
22-Year-Old Stand32-Year-Old Stand42-Year-Old Stand
C Stock (kg hm−2)Ratio (%)C Stock (kg hm−2)Ratio (%)C Stock (kg hm−2)Ratio (%)
Aboveground tree64,325.75
(12,202.95) a
57.87
(2.56) A
114,847.90 (10,212.70) b62.55 (0.73) A90,866.62
(9007.32) ab
56.32 (2.10) A
Aboveground herb414.04
(119.37) a
0.37
(0.08) B
117.22
(8.84) a
0.06
(0.00) B
262.08
(96.10) a
0.16
(0.05) B
Forest floor16,575.12
(1111.11) a
15.46
(1.26) C
24,780.46
(1232.39) b
13.61 (0.82) C19,474.49
(1734.13) a
12.35 (1.79) C
Tree roots10,871.25
(2209.40) a
9.75
(0.55) C
25,638.54
(2690.03) b
13.94 (0.48) C22,484.83
(2123.27) b
13.94 (0.45) C
Herb roots420.96
(112.14) a
0.38
(0.06) B
156.36
(12.04) a
0.09
(0.01) B
243.45
(80.67) a
0.15
(0.04) B
Mineral soil17,140.35
(727.440) a
16.17
(1.91) C
17,731.46
(667.12) a
9.75
(0.54) D
27,295.93
(936) b
17.08 (0.80) C
Total109,747.47 (16,062.27) a 183,271.83 (14,054.88) b 160,627.41 (10,247.59) ab
Data are presented as the mean value with the standard error (SE) given in parenthesis. Mean values within a row followed by different lowercase letters are significantly different at p < 0.05, Mean values within a column followed by different Uppercase letters are significantly different at p < 0.05.
Table 6. The N Stocks of different components and their contributions to the total ecosystem N pool in three different aged stands.
22-Year-Old Stand32-Year-Old Stand42-Year-Old Stand
N Stock (kg hm2)Ratio (%)N Stock (kg hm−2)Ratio (%)N Stock (kg hm−2)Ratio (%)
Aboveground tree189.14
(38.62) a
7.36
(1.02) A
591.22
(51.90) b
17.97 (0.95) A430. 45
(62.17) b
12.54 (1.52) A
Aboveground herb30.87
(11.42) a
1.21
(0.39) B
7.95
(0.18) a
0.24
(0.01) B
18.79
(7.74) a
0.54
(0.22) B
Forest floor710.50
(69.23) a
28.05
(0.83) C
950.67
(42.07) a
29.05 (1.49) C739.66
(69.60) a
21.80 (2.55) C
Tree roots43.72
(10.22) a
1.70
(0.29) B
127.11
(12.23) b
3.86
(0.23) B
93.36
(11.97) ab
2.72
(0.28) B
Herb roots12.24
(2.87) a
0.48
(0.09) B
3.94
(0.08) a
0.12
(0.01) B
8.11
(3.26) a
0.24
(0.09) B
Mineral soil1537.36
(69.52) a
61.21
(2.50) D
1597.77
(52.65) a
48.76 (1.15) D2124.10
(101.40) b
62.16 (0.64) D
Total2523.82
(178.50) a
3278.67
(111.71) b
3414.49
(129.34) b
Data are presented as the mean value with the standard error (SE) given in parenthesis. Mean values within a row followed by different lowercase letters are significantly different at p < 0.05, Mean values within a column followed by different Uppercase letters are significantly different at p < 0.05.
Table 7. The P Stocks of different components and their contributions to the total ecosystem P pool in three different aged stands.
22-Year-Old Stand32-Year-Old Stand42-Year-Old Stand
P Stock (kg hm2)Ratio (%)P Stock (kg hm−2)Ratio (%)P Stock (kg hm−2)Ratio (%)
Aboveground tree17.82
(4.32) a
4.00
(0.81) A
54.57
(3.91) b
8.86
(0.35) A
33.33
(3.03) a
7.04
(0.70) A
Aboveground herb4.56
(1.66) a
1.03
(0.35) A
1.69
(0.14) a
0.28
(0.02) BD
2.36
(0.67) a
0.50
(0.15) B
Forest floor83.51
(7.46) a
18.97 (0.92) B126.29
(3.61) b
20.60 (0.86) C87.39
(9.53) a
18.35 (1.66) C
Tree roots3.22
(0.62) a
0.72
(0.11) A
13.76
(1.01) b
2.24
(0.10) B
10.51
(1.92) b
2.19
(0.31) B
Herb roots2.19
(0.60) a
0.50
(0.12) A
0.66
(0.01) a
0.11
(0.00) D
1.08
(0.44) a
0.23
(0.10) B
Mineral soil327.54
(12.09) a
74.78 (2.22) C417.27
(15.60) a
67.92 (0.41) E340.12
(11.48) a
71.68 (0.92) D
Total438.84
(21.32) a
614.24
(20.47) b
474.78
(19.22) a
Data are presented as the mean value with the standard error (SE) given in parenthesis. Mean values within a row followed by different lowercase letters are significantly different at p < 0.05, Mean values within a column followed by different Uppercase letters are significantly different at p < 0.05.
Publisher’s Note: MDPI stays neutral with regard to jurisdictional claims in published maps and institutional affiliations.

