Article

Conservation–Protection of Forests for Wildlife in the Mississippi Alluvial Valley

1
Lower Mississippi Valley Joint Venture, 193 Business Park Drive, Ridgeland, MS 39157, USA
2
Lower Mississippi Valley Joint Venture, 11942 FM 848, Tyler, TX 75707, USA
3
U.S. Geological Survey, Patuxent Wildlife Research Center, 3918 Central Ave., Memphis, TN 38152, USA
*
Author to whom correspondence should be addressed.
Forests 2020, 11(1), 75; https://doi.org/10.3390/f11010075
Submission received: 2 December 2019 / Revised: 19 December 2019 / Accepted: 23 December 2019 / Published: 8 January 2020
(This article belongs to the Special Issue Protected Areas in Forest Conservation: Challenges and Opportunities)

Abstract

:
The nearly ubiquitous bottomland hardwood forests that historically dominated the Mississippi Alluvial Valley have been greatly reduced in area. In addition, changes in hydrology and forest management have altered the structure and composition of the remaining forests. To ameliorate the detrimental impact of these changes on silvicolous wildlife, conservation plans have emphasized restoration and reforestation to increase the area of interior (core) forest habitat, while presuming negligible loss of extant forest in this ecoregion. We assessed the conservation–protection status of land within the Mississippi Alluvial Valley because without protection, existing forests are subject to conversion to other uses. We found that only 10% of total land area was currently protected, although 28% of extant forest was in the current conservation estate. For forest patches, we prioritized their need for additional conservation–protection based on benefits to forest bird conservation afforded by forest patch area, geographic location, and hydrologic condition. Based on these criteria, we found that 4712 forest patches warranted conservation–protection, but only 109 of these forest patches met our desired conservation threshold of >2000 ha of core forest that was >250 m from an edge. Overall, 35% of the area of forest patches warranting conservation–protection was protected within the conservation estate. Even so, for those forest patches identified as most in need of conservation–protection, less than 10% of their area was currently protected. The conservation–protection priorities described fill an unmet need for land trusts and other conservation partners pursuing strategic forest protection in support of established bird conservation objectives.

Graphical Abstract

1. Introduction

Deforestation and conversion of land to agricultural production, abetted by levees and other flood mitigation projects, have markedly decreased the extent of bottomland hardwood forests in the Mississippi Alluvial Valley [1,2,3]. Because of this decreased forest area, many populations of forest-dependent wildlife have declined [4]. To increase the area of forest habitat for the conservation of migratory birds and other wildlife, conservation delivery professionals have relied on reforestation (also known as afforestation) to restore converted forest land. The Lower Mississippi Valley Joint Venture partnership (www.lmvjv.org) has promoted reforestation in this ecoregion for over two decades, as evidenced by avian conservation plans [5] and conservation decision support tools that prioritize restoration locations to enhance the conservation of breeding birds [6]. These avian conservation plans and restoration models were largely premised on the area and location of extant forest. Additional loss of extant forest not only has a direct negative impact on species using these habitats, but may adversely affect the efficiency of ongoing forest restoration if areas of forest loss are adjacent to ongoing forest restoration.
Protected areas that are owned or managed by conservation-oriented entities and lands subjected to perpetual conservation-oriented easements or servitudes are effective methods of ensuring permanence of extant habitat, while concurrently conserving wildlife biodiversity and providing a range of other socio-economic benefits [7]. Indeed, the United Nations Aichi Biodiversity Target is that by 2020 “at least 17% of terrestrial and inland water, and 10% of coastal and marine areas, especially areas of particular importance for biodiversity and ecosystem services, are conserved through effectively and equitably managed, ecologically representative and well-connected systems of protected areas and other effective area-based conservation measures” [8]. Despite this mandate, the conservation–protection status of bottomland forests in the Mississippi Alluvial Valley has neither been quantified nor prioritized. Similarly, the degree to which existing protected areas are ecologically representative of historical bottomland forests is unknown. The Mississippi Alluvial Valley is of particular importance to North American biodiversity and ecosystem services as the largest floodplain in North America. It seasonally supports 40% of North America’s waterfowl, 107 species of land birds breed in the ecoregion, and threatened and endangered species, such as pallid sturgeon, depend on floodplain dynamics of the Mississippi River. Thus, conservation–protection of forests in the Mississippi Alluvial Valley would greatly contribute to the United Nations Aichi Biodiversity Target.
To better understand current threats to bottomland forests and reduce the likelihood of future forest loss in the Mississippi Alluvial Valley, we sought to identify and characterize the conservation–protection status of existing forests and to prioritize additional need for forest protection within this ecoregion. We deemed forest areas to have protected conservation status when a reduced likelihood of being converted to non-forest habitat was conveyed via public (federal, state, or local government) or non-governmental conservation organization (NGO) ownership or from perpetual conservation-oriented easements or servitudes that were recorded in local land records.
Guided by the biological underpinning of a minimum area of core forest (i.e., interior forest buffered from deleterious forest edge effects), we sought to ascertain the current and future contribution of each forest patch for bird conservation based on existing levels of conservation–protection, landscape context, and hydrologic condition. Specifically, we evaluated the current level of conservation–protection for forest patches with sufficient area of core forest to be deemed important for forest-breeding birds. In addition, we presumed a greater need for conservation–protection for forest patches that were proximate to high priority reforestation zones, with the intention of increasing the efficacy of ongoing forest restoration efforts [6]. Finally, because forest patches less prone to frequent flooding have been disproportionately converted to agricultural use [1,2], we also presumed an increased need for conservation–protection of these forest patches.

2. Materials and Methods
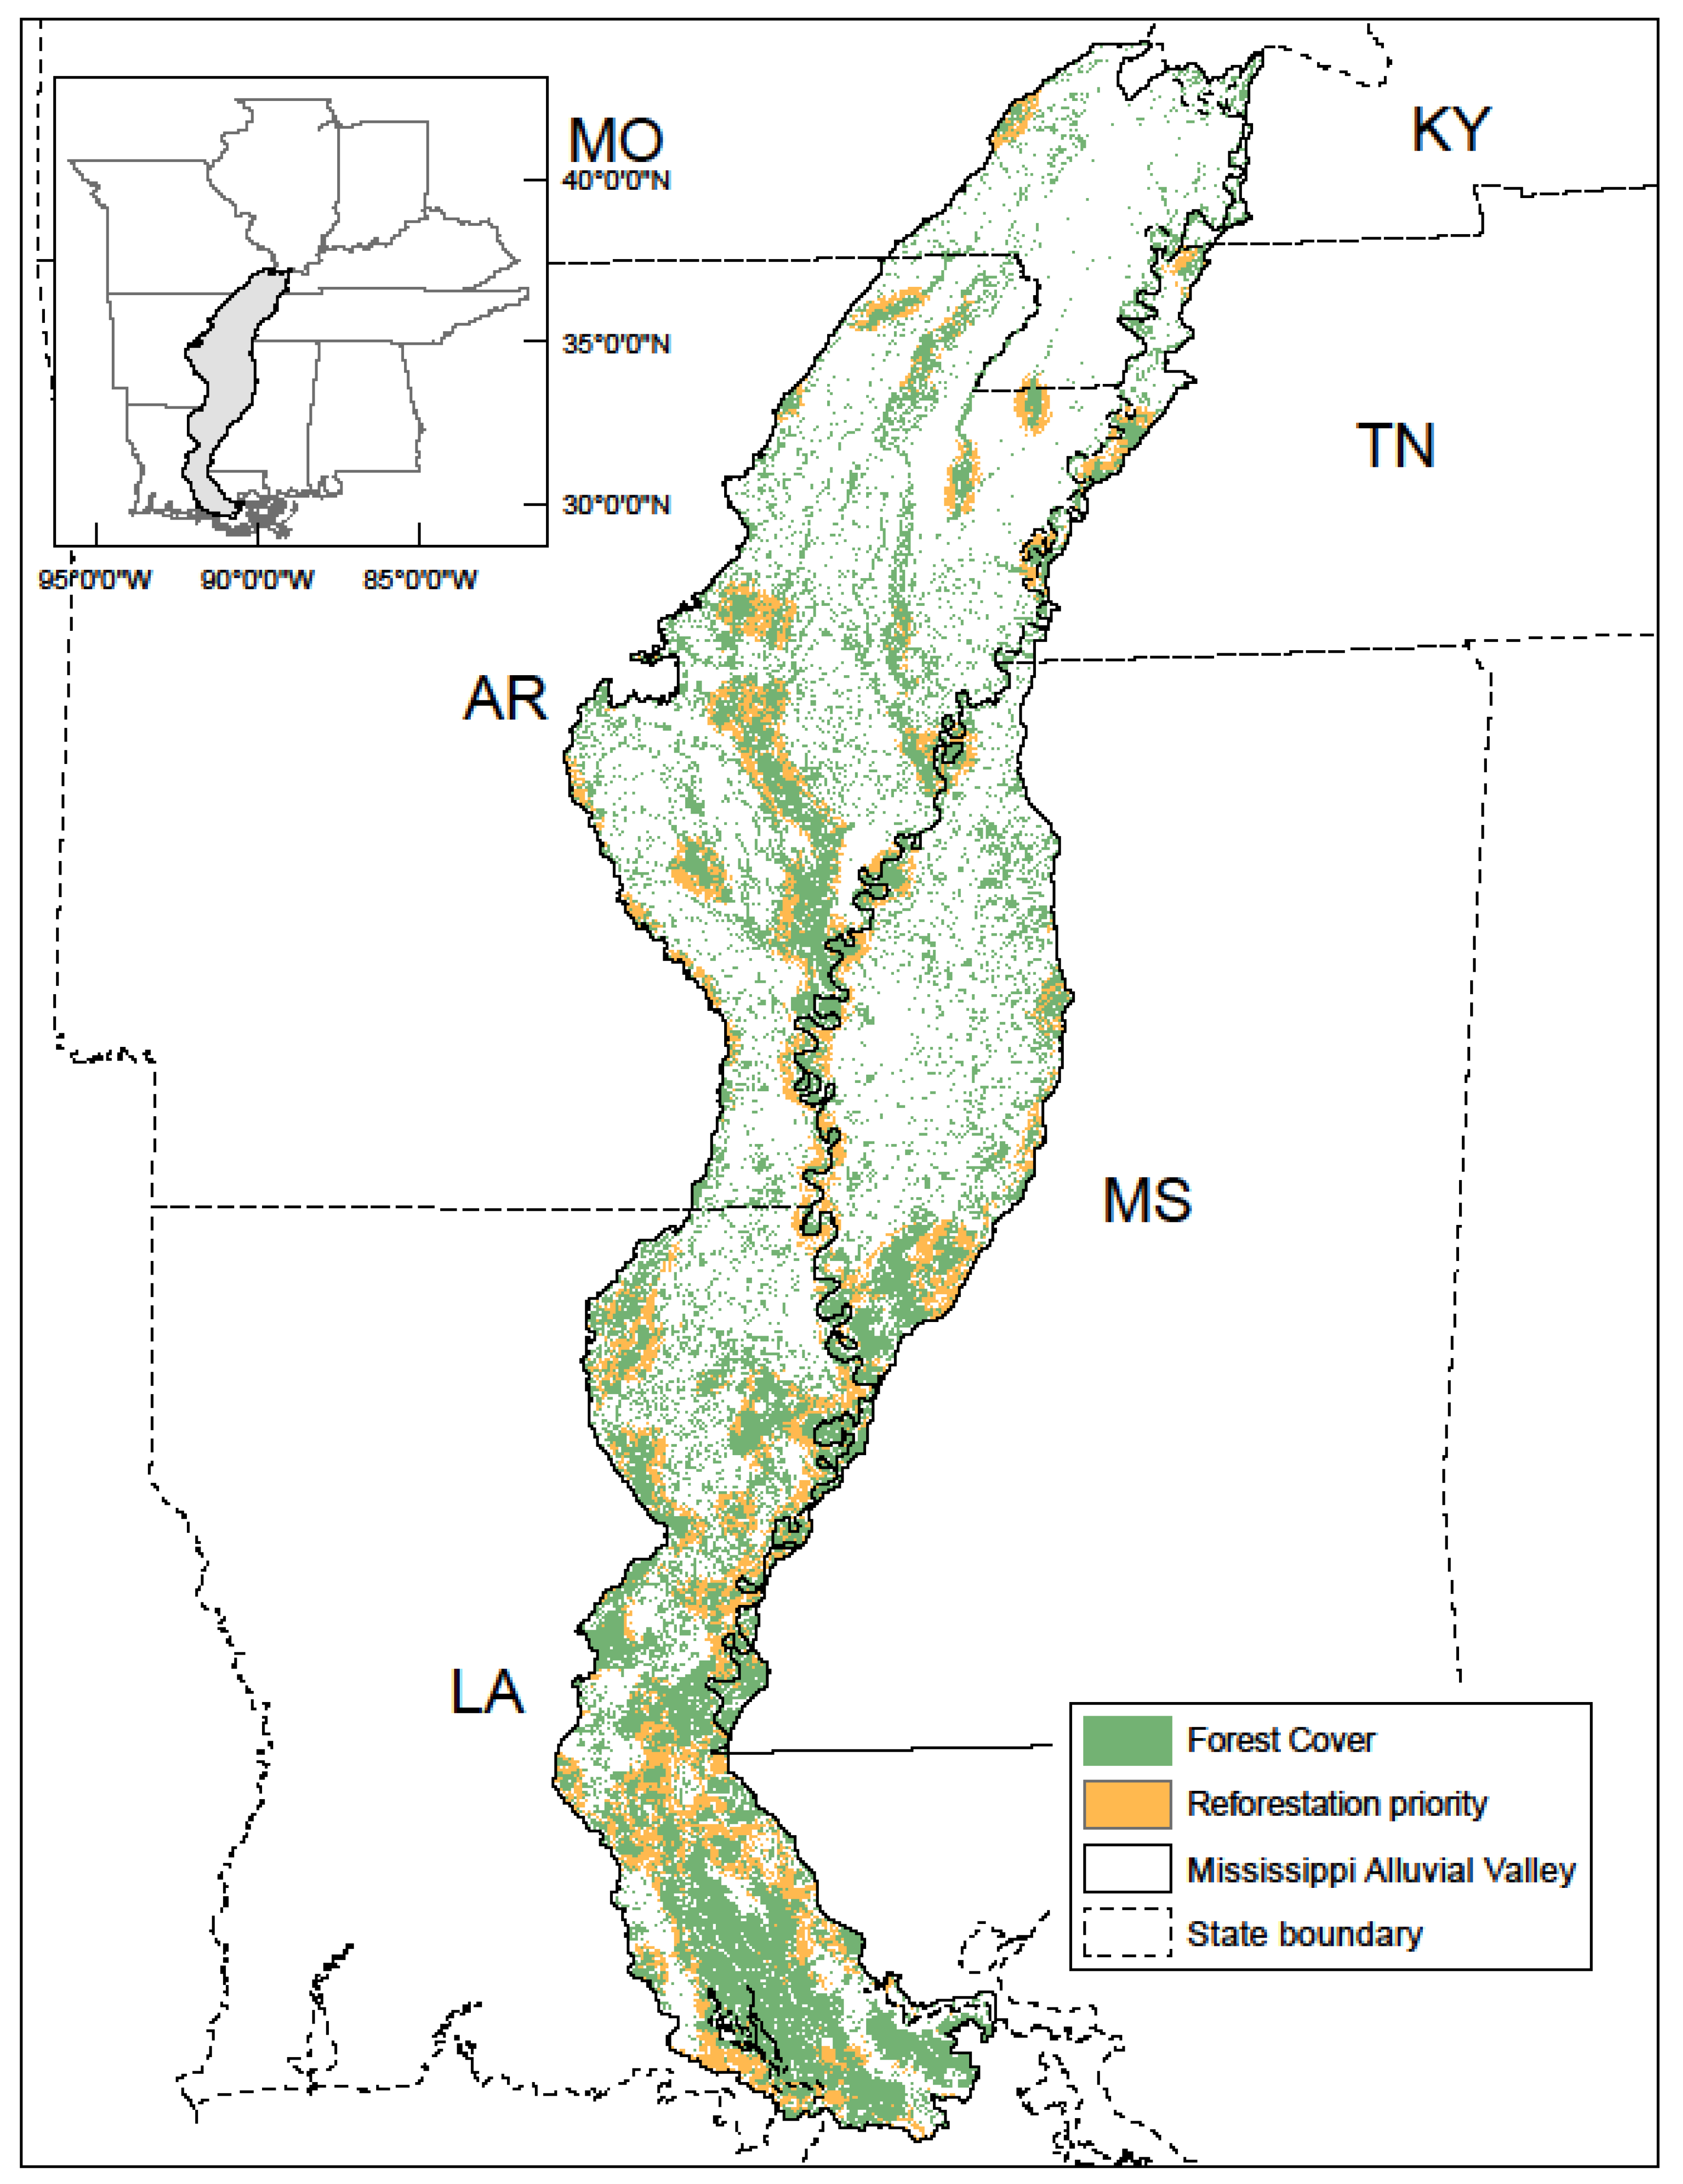
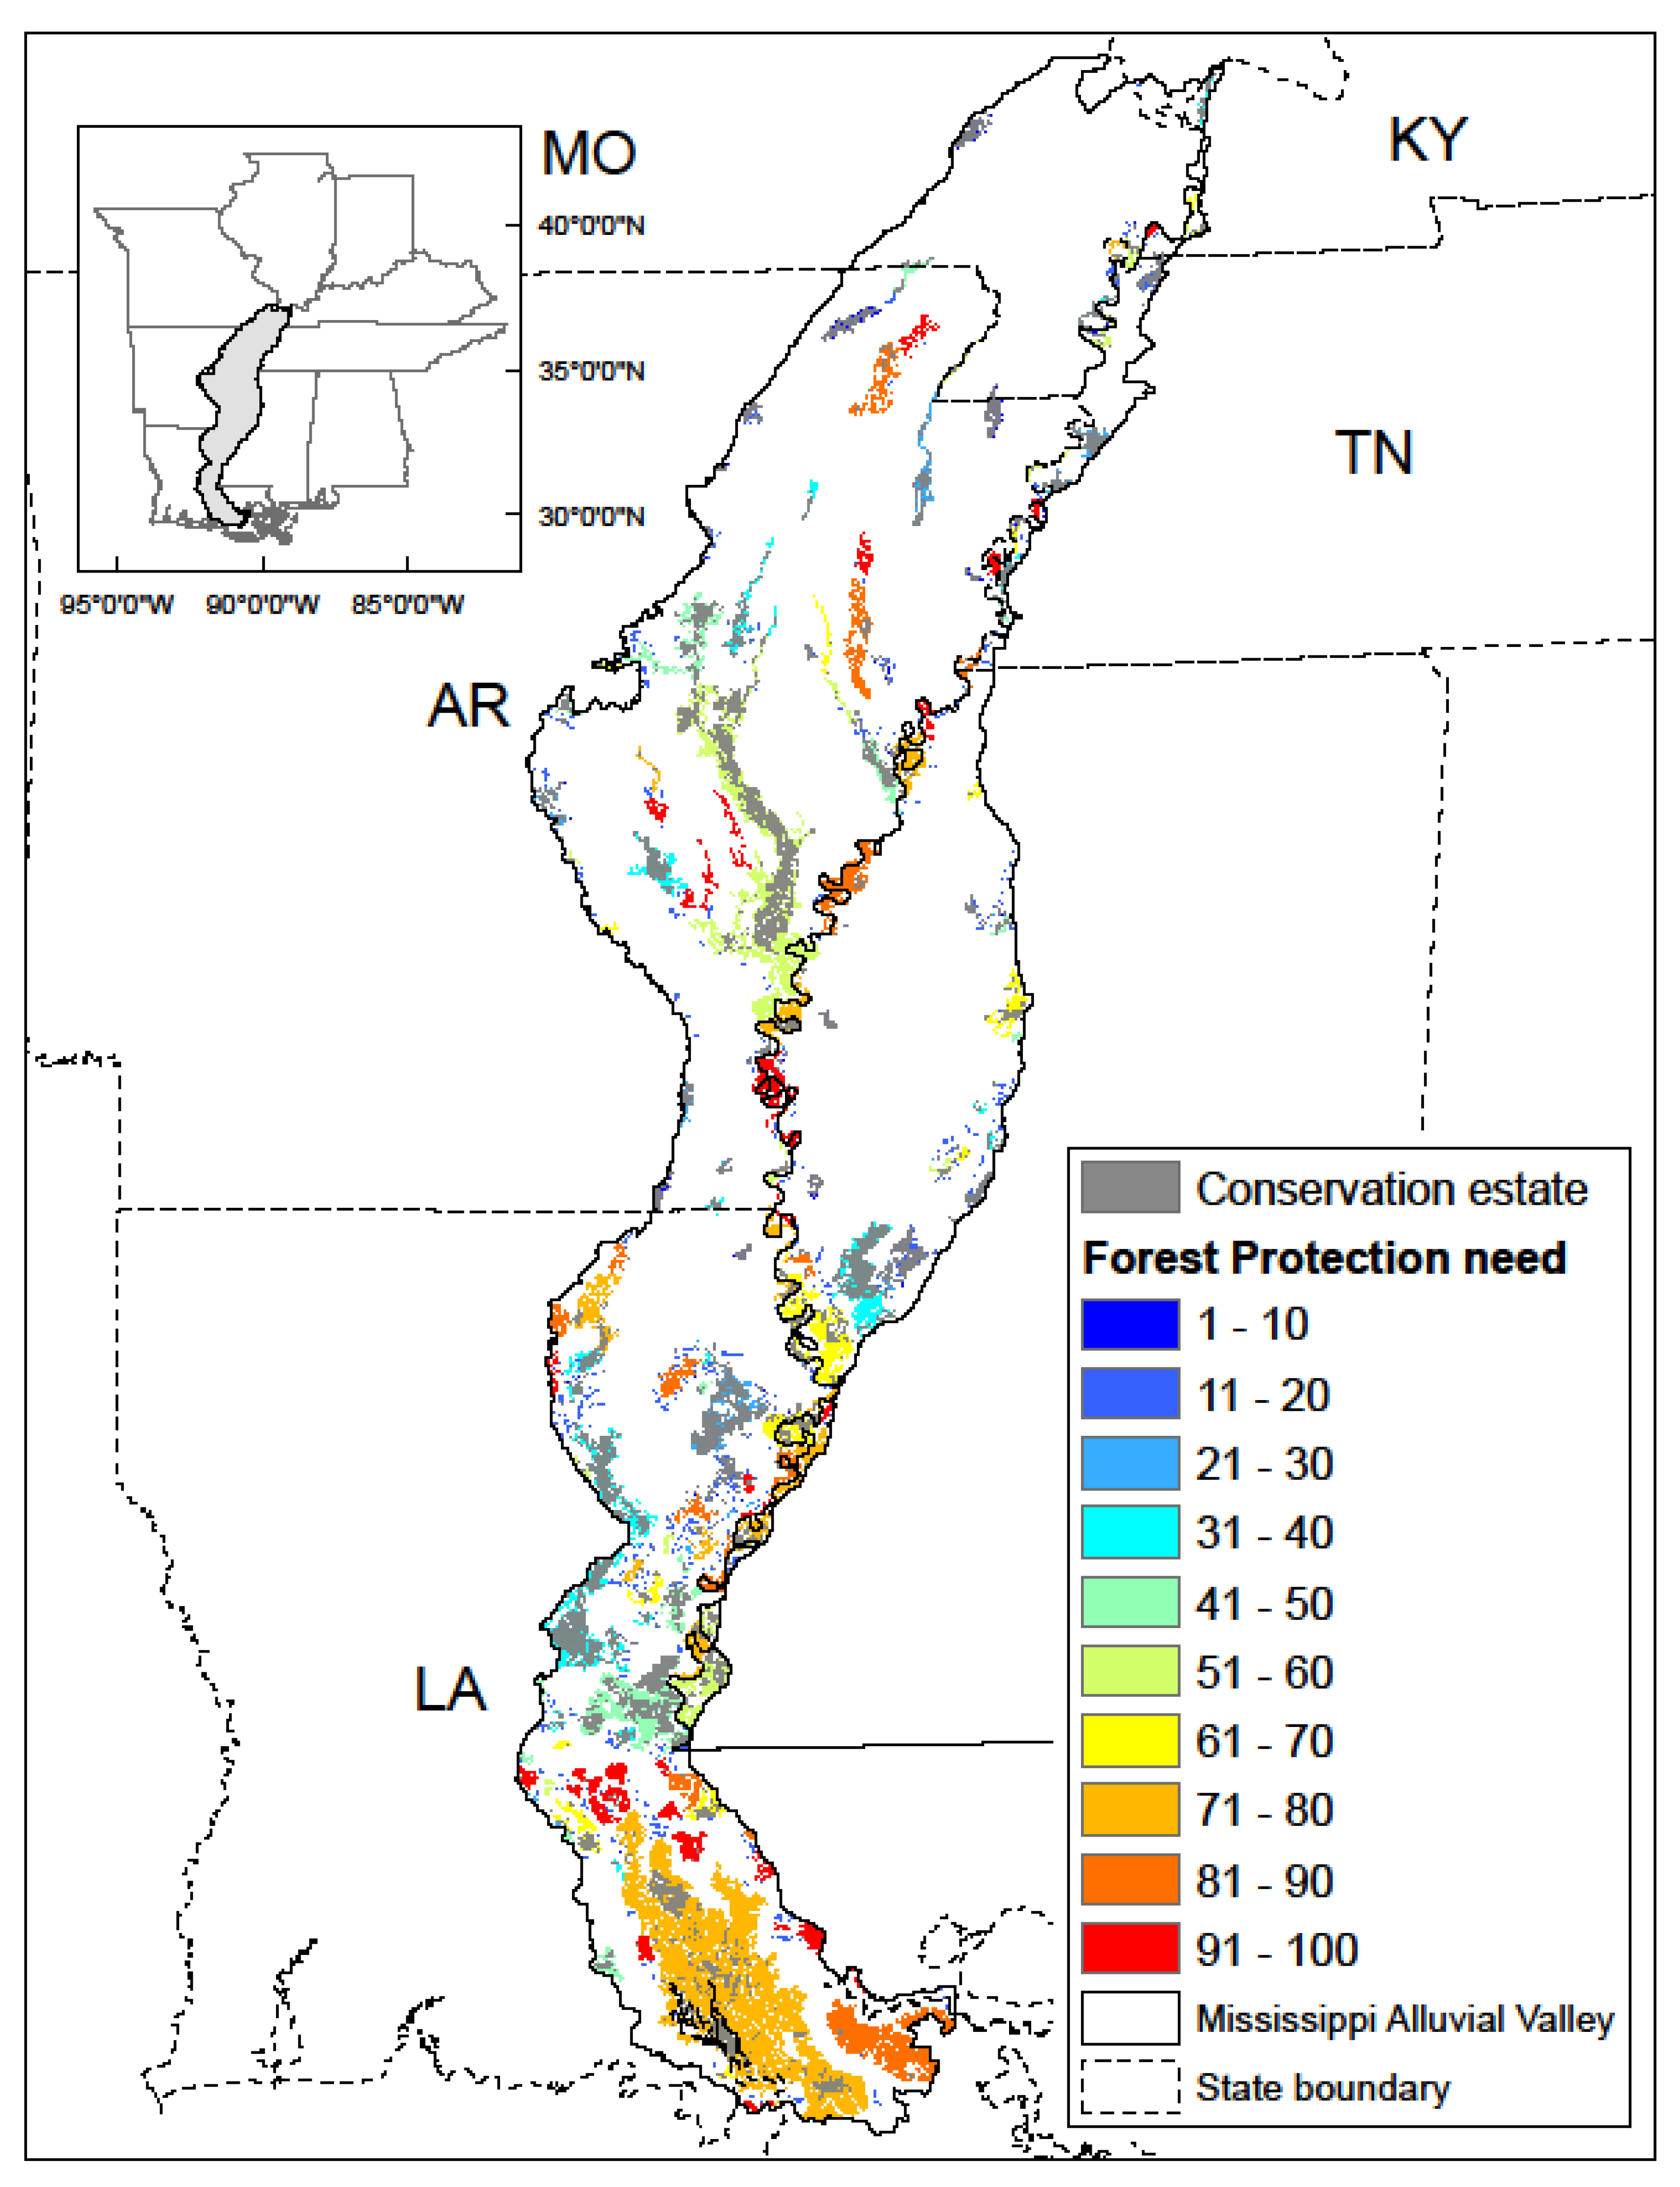
2.1. Study Area

The Mississippi Alluvial Valley Bird Conservation Region (http://nabci-us.org/resources/bird-conservation-regions-map/#bcr26) is a relatively flat, weakly dissected alluvial plain of >10 million ha within 7 states: Illinois, Missouri, Arkansas, Kentucky, Tennessee, Mississippi, and Louisiana (Figure 1). Topographic and hydrologic differences subdivide this region into 14 physiographic provinces [9]. In this ecoregion, forest-dwelling birds are of great conservation concern because over two-thirds of the area that was formerly forested has been converted to other land uses.
Average annual precipitation is 114–165 cm. Natural vegetation has been cleared from most of this ecoregion [1,2,10], being primarily converted to agriculture. Historically, extensive flooding dictated vegetative conditions, but levees, dikes, and dams have markedly altered the hydrology of the Mississippi Alluvial Valley [11]. These hydrological changes have influenced the composition and structure of the remaining forested wetlands [12,13,14].
Forest cover currently comprises approximately 30% of area within the Mississippi Alluvial Valley [3]. Remaining floodplain forests are dominated by oak-gum-cypress and elm-ash-cottonwood cover types. Co-dominant species within these forest types include oaks [overcup (Quercus lyrata), willow (Quercus phellos), Nuttall (Quercus nuttallii), water (Quercus nigra), and cherrybark (Quercus pagodaefolia)] as well as sweetgum (Liquidambar styraciflua), water hickory (Carya aquatica), sugarberry (Celtis laevigata), American elm (Ulmus americana), bald cypress (Taxodium distichum), green ash (Fraxinus pennsylvanica), and others [1]. Oak-hickory forests occur on isolated upland inclusions (e.g., Crowley’s Ridge) within this floodplain. Co-dominant upland tree species include post (Quercus stellate), southern red (Quercus falcata), black (Quercus velutina), chinkapin (Quercus muehlenbergii), and white (Quercus alba) oaks along with mockernut hickory (Carya tomentosa) and others [10].

2.2. Data Sources

Boundary: For our analyses, we used the Lower Mississippi Valley Joint Venture’s conservation planning boundary for the Mississippi Alluvial Valley Bird Conservation Region because it well delineates the transition from alluvial floodplain and deltaic lands to upland habitat. We included all upland inclusions that were wholly contained within this boundary (Figure 1; http://www.arcgis.com/home/item.html?id=c72185797b564b5995f44e9bc367163e).
Forest: We used a binary forest classification derived from 2011 Landsat satellite imagery [3] to identify extant forest habitat within, and 1 km beyond, the Mississippi Alluvial Valley boundary (Figure 1; SROWEB.DBO.T2011_forest_w_reforestation; https://gisweb.ducks.org/arcgis/rest/services/SRO/Forest_2011/MapServer/0).
Reforestation priority: Reforestation (i.e., afforestation) priorities for bird conservation have been established for restorable lands within the Mississippi Alluvial Valley. These priorities are intended to effectively increase the number of forest patches that harbor >2000 ha of core forest, while concurrently targeting more than 60% forest cover within local (320 km2) landscapes and restoration of higher elevation bottomland hardwood forests [6]. We extracted and used the highest (upper 10%) priority restoration zone from this reforestation decision support model (Figure 1; LMVJV/FBBDSM_2011; https://gisweb.ducks.org/arcgis/rest/services/LMVJV/FBBDSM_2011/MapServer).
Flood frequency: We used the inundation frequency of lands in the Gulf Coastal Plain and Ouachita Mountains (GCPO), including the Mississippi Alluvial Valley, that was developed from 50 Landsat scenes and 1334 total images depicting inundation extent under varying hydrologic conditions [15]. Inundation frequency ranged from 0% to 100% (in Supplementary Materials: GCPO Inundation Frequency Mosaic; https://www.sciencebase.gov/catalog/item/5617e3c3e4b0cdb063e3fc35).
Conservation estate: We identified lands owned or managed by conservation-oriented entities, either public or private, and lands subjected to perpetual conservation-oriented easements or servitudes from 7 geographic information system (GIS) source files:
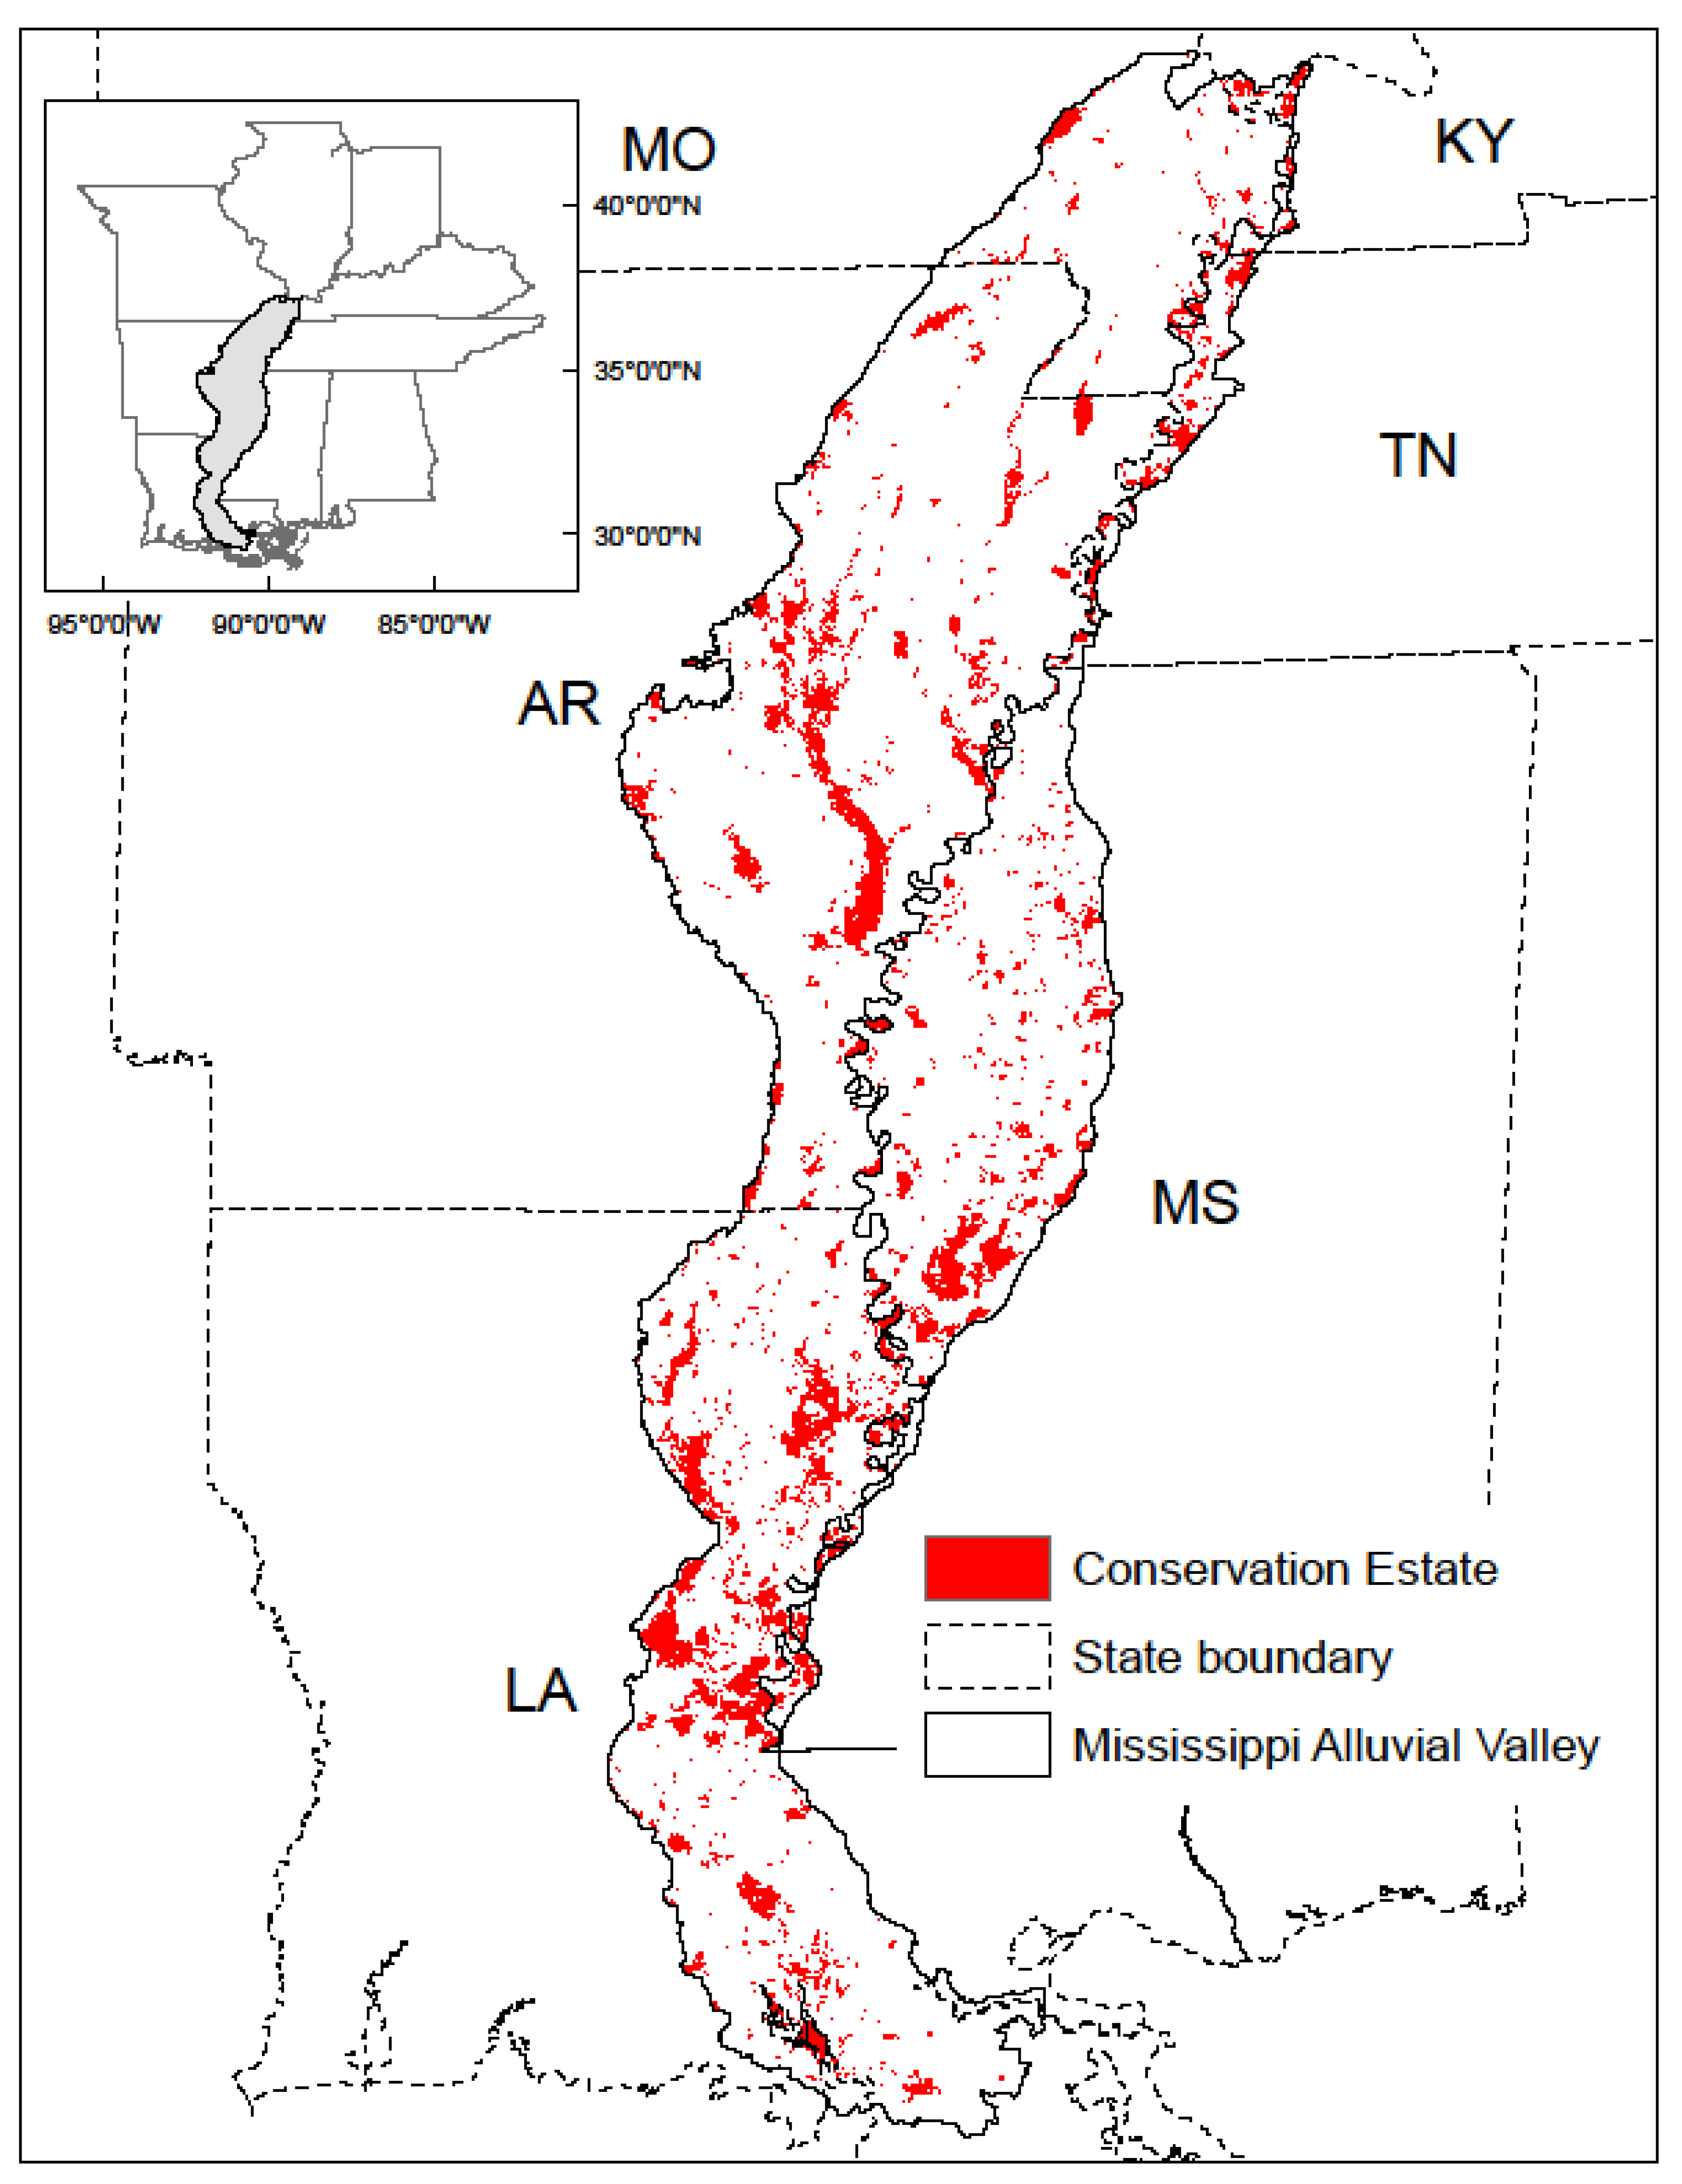
  • Protected Areas Database of the United States 2.0, 2018: From the U.S. Geological Survey Gap Analysis Project, this database included public and non-profit lands and waters. Most were public lands owned in fee title, but the database also contained long-term easements, leases, agreements, and congressional (e.g., Wilderness Area), executive (e.g., National Monument), and administrative (e.g., Area of Critical Environmental Concern) designations as documented in agency management plans (https://doi.org/10.5066/P955KPLE).
  • National Conservation Easement Data, 2018: A public–private partnership database of locations for more than 150,000 conservation easements and land trusts throughout the United States (https://www.conservationeasement.us/).
  • Ducks Unlimited Conservation Easements, 2017: Locations for lands under conservation easement with Ducks Unlimited, Inc., a non-governmental conservation organization (https://gisweb.ducks.org/arcgis/rest/services/LMVJV_Parcel/Parcel_Private/MapServer/1).
  • Wetlands Reserve Program, 2016: Location information for lands under federal conservation easements with the U.S. Department of Agriculture. These conservation easements included the Wetland Reserve Program, Wetland Reserve Enhancement Program, and Wetland Reserve Enhancement Partnership. These data are not publicly accessible.
  • State Wildlife Management Areas, 2015: A Lower Mississippi Valley Joint Venture compiled database of locations for state-owned or managed wildlife conservation areas as provided by the conservation agencies of their state partners (https://gisweb.ducks.org/arcgis/rest/services/SRO/WildlifeManagementArea/MapServer/0)
  • National Wildlife Refuge System, 2015: Locations of existing U.S. Fish and Wildlife Service and National Wildlife Refuges as well as designated “areas of interest” for potential future acquisition by the National Wildlife Refuge system (https://gis.fws.gov/arcgis/rest/services/FWSCadastral_Internet/MapServer/2).
  • The Nature Conservancy, Louisiana Lands, 2018: Locations of lands owned or managed by the non-governmental conservation organization, The Nature Conservancy in Louisiana. These data are not publicly accessible.
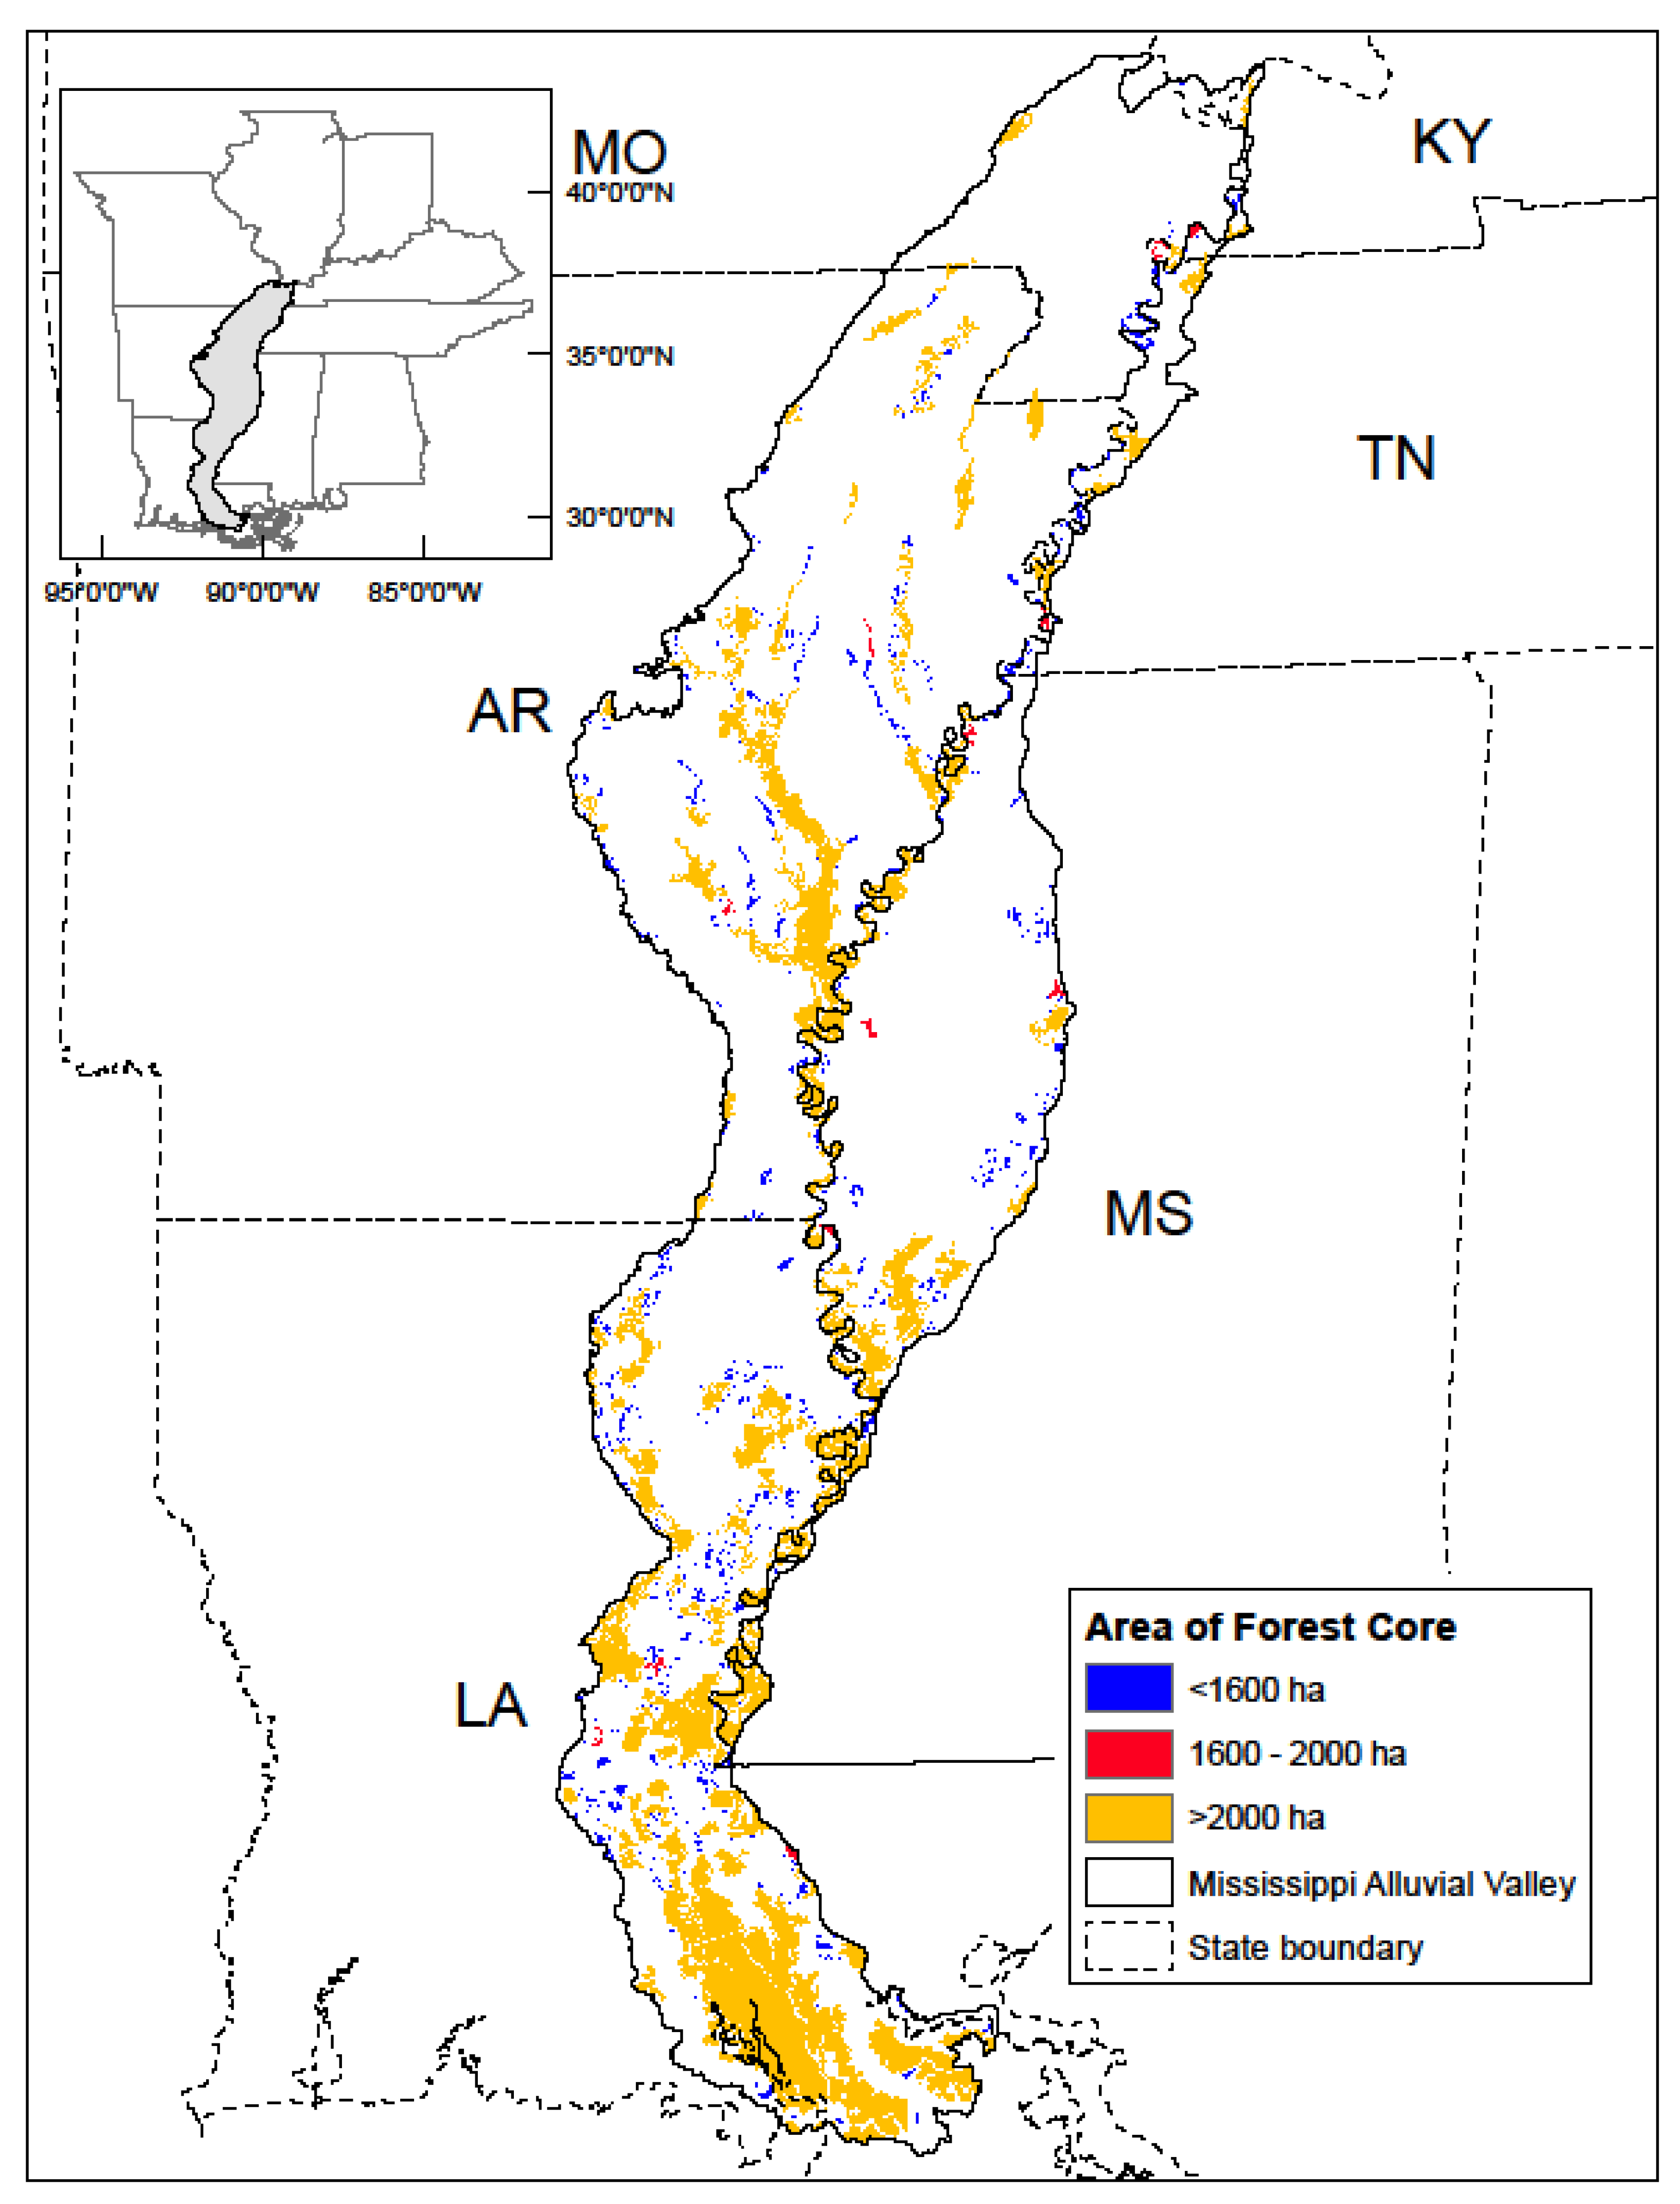
All GIS raster data were obtained or converted to 30 m (900 m2) pixel resolution for analyses. Unless otherwise stated, GIS manipulations were accomplished within ArcMap (Version 10.5.1; Environmental Systems Research Institute, Redlands, CA, USA). The above files were merged to create a unified depiction of the current conservation estate within the Mississippi Alluvial Valley (Figure 2; in Supplementary Materials: https://doi.org/10.5066/P90V76SY).

2.3. Forest Patches

Previous planning efforts for the conservation of forest-breeding birds in the Mississippi Alluvial Valley have made the biological assumption that birds occur at higher density, have increased probability of survival, and have greater reproductive success within forest interiors (i.e., core forest) [6,16,17]. To mitigate the presumed detrimental influences associated with forest edges [18], initial conservation planning in this region used a conservative 1000 m buffer from ‘hostile’ edges [19]. More recent conservation plans have assumed that a buffer distance of 250 m is enough to mitigate the detrimental effects of hostile edges [16].
We identified all extant forest patches (core forest plus the buffer), including reforested areas, within the Mississippi Alluvial Valley [3]. After identifying and including non-hostile habitats, we extracted core-forest areas that were >250 m from a hostile forest edge [16]. We considered cropland, pasture, grassland, aquaculture, urban, and suburban habitats to be hostile edges because these ecotones with forest tend to promote predator incursions [20] and greater abundance of the nest parasite, brown-headed cowbird (Molothrus ater) [21]. Conversely, we considered shrublands, emergent wetlands, and natural water bodies to be non-hostile habitats, such that forest core habitats extended to the boundary of these non-hostile edges.
Once core forest was identified, we used the ERDAS Imagine (Hexagon Geospatial, Madison, Alabama) raster processing software to clump (i.e., group) and uniquely identify all contiguous areas of core forest, hereafter referred to as ‘core clumps’. Core clumps were separated from other clumps by at least one pixel (900 m2) around the entirety of the clump, such that corner connections (i.e., diagonally connected pixels) retained continuity of the clump. The area (ha) of each forest core clump was then calculated.
In addition to reliance on forest interior habitat, previous conservation planners also assumed that a large area of core forest is needed to ensure occupancy by enough breeding individuals to diminish the likelihood of extirpation of a species from the forest patch and to provide habitat diversity consistent with the needs of priority bird species [5]. The minimum area of core forest previously recommended was 2000 ha [6]. Ongoing evaluation of habitat needs for breeding birds in this ecoregion suggests that a 2000 ha area of core forest would support populations with less than 1% likelihood of extirpation over 100 years for 46 out of 56 (82%) breeding species. Therefore, our goal was to emphasize core forest of >2000 ha. We recognized that additional forest restoration adjacent to core clumps <2000 ha could result in core clumps that exceed this threshold area. Therefore, we retained all core clumps ≥1600 ha (80% of 2000 ha). In addition, because reforestation efforts continue to focus restoration within higher priority forest restoration zones, we retained all core clumps (regardless of ha area) that were adjacent to the highest (upper 10%) reforestation priority zones (Figure 1).
We reestablished the entirety of forest patches for this set of core clumps that were ≥1600 ha or adjacent to high restoration priority zones (Figure 3), by returning the 250 m non-core forest buffer. Concurrently, we retained only forested habitat by removing water and herbaceous wetland habitat from these forest patches.

2.4. Conservation–Protection

For each forest patch meriting consideration for conservation–protection, as described above, we determined the percentage of the patch that was outside the conservation estate. Thus, forest patches with a value of 100 had no existing conservation–protection and were in greatest need of forest protection. Conversely, those patches with a value of 0 were fully protected and no additional forest protection was warranted. We adjusted the perceived need for conservation–protection of each forest patch, which was initially based solely on percent area not protected, to account for location and hydrology.

2.5. Location

Because core forest patches with <2000 ha of core area were perceived to have less than optimal conservation value for forest-breeding birds, we reduced the perceived need for conservation–protection of core forest patches with 1600–2000 ha by 50% and core forest patches with <1600 ha by 100%. Conversely, we granted patches an increased need for protection when core forest patches were adjacent to the highest priority reforestation areas and therefore have greater potential for expansion of their core area. Within these high priority forest restoration areas, we increased the attributed need for protection by 40% of their initial perceived need for conservation–protection for patches with ≥2000 ha of core forest and by 20% of their initial perceived need for conservation–protection for patches with <2000 ha of core forest (Table 1).

2.6. Hydrology

To benefit priority forest-breeding birds, conservation plans previously placed increased emphasis on retention and restoration of bottomland forest sites that are less prone to prolonged flooding [6,16]. This emphasis on drier bottomland sites was because these forests had been disproportionately converted to agriculture [2] and continue to be more suitable for conversion to non-forest use than flood-prone forests. Moreover, bottomland forests with limited flooding tend to support more understory vegetation and are therefore important for ground-nesting silvicolous bird species [6]. The excessive loss of bottomland forests that are less prone to prolonged flooding may be exacerbated within the conservation estate by the bias of protected areas to be located on less-threatened land that is not easily converted to other uses [22].
For each of the forest patches deemed to have merit for bird conservation by virtue of having a core forest habitat area >1600 ha or being located adjacent to high priority restoration zones, we calculated their mean flood probability from inundation frequency data [15]. The resultant mean percent flood frequency was inverted and scaled (0–100) as a coefficient of dryness, such that 100 represented the least flood-prone forest patches and 0 represented the most flood-prone patches. Because we perceived drier forest patches to be of greater conservation value, we granted an increase in need for conservation–protection proportional to forest patch dryness (dryness coefficient x 0.2). As such, the least flood-prone forest patches received up to 20% increase in need for protection, whereas the most flood-prone patches received a negligible increase.

3. Results

Although we found only 10% of the area within the Mississippi Alluvial Valley was protected within the current conservation estate, most (84%) of this protected area was forested. Of the 3.1 million ha of extant forest [3], 882,000 ha (28%) was protected within the conservation estate. Forested land in the Mississippi Alluvial Valley had a greater frequency of flooding (17.5% ± 24.7%; mean ± SD) compared with lands not currently forested (13.3% ± 25.1%). We found an even greater propensity for flooding (23.7% ± 30.0%) for those lands protected within the current conservation estate.
For effective conservation of silvicolous birds, we determined 4712 core forest patches, harboring >2 million ha of forest, met our criteria for needing additional conservation–protection (Figure 3). Most of this area, approximately 1.5 million ha, was within 109 forest patches that exceeded our desired threshold area of ≥2000 ha of core forest. Over 1.3 million ha within these forest patches lack current conservation protection (Table 2).
When we accounted for the forest area of a patch, its location within high priority reforestation zones, propensity for flooding, and the proportion of the patch within the existing conservation estate, the attributed need for conservation–protection ranged from 2 (least in need) to 100 (most in need). We masked areas within these forest patches that were in the current conservation estate, as these areas are already protected, and displayed the attributed need for conservation–protection of the remaining forest patches (Figure 4; https://doi.org/10.5066/P90V76SY).
Of the 109 patches with core forest area that exceeded our target of ≥2000 ha, 36% of their area was in the current conservation estate. For all forest patches deemed in greatest need of additional protection (i.e., conservation–protection need >90), ≤4% of their area was protected within the conservation estate (Table 2).

4. Discussion

Our primary motivation for this assessment was to assess the current vulnerability of extant forest in the Mississippi Alluvial Valley to potential future conversion to a non-forest habitat. Although the Convention on Biological Diversity’s Aichi Biodiversity Target (i.e., that at least 17% of terrestrial and inland water habitat be in the conservation estate) was intended as a national benchmark, the 10% protection within the Mississippi Alluvial Valley ecoregion falls well shy of this objective. Attainment of the 17% target within this ecoregion would entail increasing the area of the current conservation estate by >700,000 ha—nearly doubling the area of forest currently under conservation–protection.
Our finding that the Mississippi Alluvial Valley extant forest, and even more so the existing conservation estate, has a greater flood frequency than non-forest land supports prior conclusions that protected areas are biased towards locations that are unlikely to face land conversion pressures even in the absence of protection [22]. Worldwide, this bias in conservation–protection leads to more protected areas being at higher elevations with steeper slopes. Conversely, within the topographically limited Mississippi River floodplain this bias is toward lower, more flood-prone locations. Even though our conservation–protection model granted increased emphasis to less flood-prone bottomland forest, the existing bias of increased flood frequency associated with extant forest may overwhelm our intention of increasing the ecological representativeness of protected forests.
The vagile and often migratory habits of birds, which were our conservation emphasis during this study, suggest that connectivity of protected areas is not of paramount importance. Therefore, despite the Aichi Biodiversity Target of establishing well-connected protected areas [23], our conservation–protection model does not accentuate connectedness of lands within the conservation estate. Nevertheless, conservation planners may choose to place greater emphasis on areas that provide linkage between existing protected areas or that provide linkages between isolated populations of less vagile, resident species of conservation concern (e.g., Louisiana black bear, Ursus americanus luteolus; [24]). Alternatively, landscapes currently depauperate in habitat within the conservation estate may benefit through the provision of foundational conservation–protection of extant forest areas.
Our final model of perceived need for conservation–protection of bottomland forests included numerous, small, core forest patches, many of which were markedly below our core forest target of 2000 ha. We included these small, core forest patches because of their location within reforestation priority zones, and our hope that future forest restoration will increase their forest core area. Even though we included these small patches as in need of additional protection, their need for protection was markedly reduced relative to larger core forest patches.
We have assigned priority for conservation–protection to core forest patches in this ecoregion but these priorities should not be viewed as a directive or desire for increased public ownership of these forests. Indeed, private conservation easements, such as those executed with Ducks Unlimited or The Nature Conservancy, may be equally effective at long-term conservation of these bottomland forests [25,26].

5. Conclusions

We established the relative priority of more than 4000 forest patches in the Mississippi Alluvial Valley for increased conservation–protection for wildlife, based on their area, location, and hydrology. Only 109 of these forest patches exceeded our targeted threshold area of >2000 ha of core forest. Attainment of the international standard of 17% of area within the conservation estate will require nearly doubling the >700,000 ha of forest that is currently protected within the Mississippi Alluvial Valley. Adding this additional forest within areas targeted for forest restoration will improve the likelihood of increasing the area of existing forest patches to >2000 ha.
Extant forest within the Mississippi Alluvial Valley was skewed toward lands that are frequently flooded. Those forests that are currently afforded conservation–protection by virtue of being within the existing conservation estate also had a greater likelihood of frequent flooding. This bias in flood condition suggests that granting increased priority for conservation protection to less flood-prone forests was justified.
As conservation partners in the Mississippi Alluvial Valley invest their limited resources for conservation of forest landscapes capable of sustaining breeding bird populations, guidance with respect to more focused forest protection facilitates greater efficiency in conservation actions. As such, the conservation–protection priorities we identified fill an unmet need for land trusts and other conservation partners pursuing strategic protection in support of Joint Venture objectives. This positive impact is two-fold: (1) protecting forest tracts in ‘high need’ of protection will directly benefit species using these habitats and (2) retaining the efficacy of past and ongoing reforestation efforts predicated on the presence of adjacent core forest. Conservation delivery networks of the Joint Venture (https://www.lmvjv.org/conservation-delivery-networks), in particular, are uniquely poised to utilize this information for efficiently and effectively protecting forest lands in this region.

Supplementary Materials

Data layers depicting the Bird Conservation Region boundary, forest cover, and reforestation priority are available as digital map layers at http://gisweb.ducks.org/conservationplanning/). Digital data for flood frequency within the Gulf Coastal Plain and Ozark region are available at https://www.sciencebase.gov/catalog/item/5617e3c3e4b0cdb063e3fc35 [27]. Digital representation of existing conservation estate and conservation–protection priority of forest patches in the Mississippi Alluvial Valley are available at https://doi.org/10.5066/P90V76SY [28].

Author Contributions

A.B.E., A.E.M., and D.J.T. developed study methods; A.B.E. acquired and processed GIS data; D.J.T. was responsible for statistics, wrote the original draft, and served as corresponding author; S.K.M. administered the project and acquired funding. All authors have read and agreed to the published version of the manuscript.

Funding

This study was supported by the U.S. Fish and Wildlife Service, U.S. Geological Survey, Ducks Unlimited, The Nature Conservancy, and the American Bird Conservancy.

Acknowledgments

We thank Jim Bergan (The Nature Conservancy), Dale James (Ducks Unlimited), and Stacey Shankle (Trust for Public Land), as well as Randy Wilson and Steve Brock (U.S. Fish and Wildlife Service) for their assistance in the development and review of this assessment. Comments provided by Jane Fitzgerald, Blair Tirpak, and two anonymous reviewers improved our original manuscript. Shannon Beliew facilitated the release of data for this study.

Conflicts of Interest

The authors declare no conflicts of interest.

Disclaimer

The information and views set out in this article are those of the authors. The use of trade names in this publication does not imply endorsement by the U.S. Government.

References

  1. Rudis, V.A.; Birdsey, R.A. Forest Resource Trends and Current Conditions in the Lower Mississippi Valley; U.S. Department of Agriculture Forest Service, Southern Forest Experiment: New Orleans, LA, USA, 1986.
  2. Twedt, D.J.; Loesch, C.R. Forest Area and Distribution in the Mississippi Alluvial Valley: Implications for Breeding Bird Conservation. J. Biogeogr. 1999, 26, 1215–1224. [Google Scholar] [CrossRef]
  3. Mitchell, M.; Wilson, R.R.; Twedt, D.J.; Mini, A.; James, J.D. Object-based forest classification to facilitate landscape-scale conservation in the Mississippi Alluvial Valley. Remote Sens. Appl. Soc. Environ. 2016, 4, 55–60. [Google Scholar] [CrossRef]
  4. Pashley, D.N.; Barrow, W.C. Effects of land use practices on neotropical migratory birds in bottomland hardwood forests. In Status and Management of Neotropical Migratory Birds; Finch, D.M., Stangel, P.W., Eds.; U.S. Department of Agriculture Forest Service, Rocky Mountain Forest and Range Experiment Station: Fort Collins, CO, USA, 1993; pp. 315–320. [Google Scholar]
  5. Twedt, D.J.; Pashley, D.; Hunter, W.C.; Mueller, A.J.; Brown, C.; Ford, R.P. Partners in Flight Bird Conservation Plan for the Mississippi Alluvial Valley (Physiographic Area # 05). 1999. Available online: https://www.lmvjv.org/landbird-plans (accessed on 26 December 2019).
  6. Twedt, D.J.; Uihlein, W.B., III; Elliott, A.B. A spatially explicit decision support model for restoration of forest bird habitat. Conserv. Biol. 2006, 20, 100–110. [Google Scholar] [CrossRef]
  7. Watson, J.E.M.; Darling, E.S.; Venter, O.; Maron, M.; Walston, J.; Possingham, H.P.; Dudley, N.; Hockings, M.; Barnes, M.; Brooks, T.M. Bolder science needed now for Protected Areas. Conserv. Biol. 2016, 30, 243–248. [Google Scholar] [CrossRef]
  8. Convention on Biological Diversity. COP 10 Decision X/2: Strategic Plan for Biodiversity 2011–2020; Secretariat of the Convention on Biological Diversity: Nagoya, Japan, 2010; Available online: http://www.cbd.int/decision/cop/?id=12268 (accessed on 26 December 2019).
  9. Chapman, S.S.; Kleiss, B.A.; Omernik, J.M.; Foti, T.L.; Murray, E.O. Ecoregions of the Mississippi Alluvial Plain; Map Scale 1:1,150,000; U.S. Geological Survey: Reston, VA, USA, 2004. Available online: http://ecologicalregions.info/htm/map_eco.htm (accessed on 26 December 2019).
  10. Oswalt, S.N. Forest Resources of the Lower Mississippi Alluvial Valley; U.S. Department of Agriculture Forest Service, Southern Research Station: Asheville, NC, USA, 2013; p. 29.
  11. Remo, J.W.F.; Ickes, B.S.; Ryherd, J.K.; Guida, R.J.; Therrell, M.D. Assessing the impacts of dams and levees on the hydrologic record of the Middle and Lower Mississippi River, USA. Geomorphology 2018, 313, 88–100. [Google Scholar] [CrossRef]
  12. Keim, R.F.; Chambers, J.L.; Hughes, M.S.; Nyman, J.A.; Miller, C.A.; Amos, J.B.; Conner, W.H.; Day, J.W., Jr.; Faulkner, S.P.; Gardiner, E.S.; et al. Ecological consequences of changing hydrological conditions in wetland forests of coastal Louisiana. In Coastal Environment and Water Quality; Xu, Y.J., Singh, V.P., Eds.; Challenges in Coastal Hydrology and Water Quality, Water Resource Publications: Highlands Ranch, CO, USA, 2006; pp. 383–395. [Google Scholar]
  13. Gee, H.K.W. The Effect of Hydrologic Modifications on Floodplain Forest Tree Recruitment and Growth. Ph.D. Thesis, Louisiana State University, Baton Rouge, LA, USA, 2012; p. 140. [Google Scholar]
  14. King, S.L.; Keim, R.F. Hydrologic modifications challenge bottomland hardwood forest management. J. For. 2019, 117, 504–514. [Google Scholar] [CrossRef]
  15. Allen, Y. Landscape scale assessment of floodplain inundation frequency using Landsat imagery. River Res. Appl. 2016, 32, 1609–1620. [Google Scholar] [CrossRef]
  16. Mitchell, M.; Twedt, D.J.; Wilson, R.R.; Elliott, A.B.; James, J.D. MAV Forest Breeding Bird Decision Support Model–Update 2015; Lower Mississippi Valley Joint Venture: Jackson, MS, USA, 2015; p. 7. Available online: https://www.lmvjv.org/s/LMVJV_FBBDSM_2015_Summary.pdf (accessed on 26 December 2019).
  17. Chalfoun, A.D.; Thompson, F.R.; Ratnaswamy, M.J. Nest predators and fragmentation: A review and meta-analysis. Conserv. Biol. 2002, 16, 306–318. [Google Scholar] [CrossRef]
  18. Fletcher, R.J. Multiple edge effects and their implications in fragmented landscapes. J. Anim. Ecol. 2005, 74, 342–352. [Google Scholar] [CrossRef]
  19. Mueller, A.J.; Twedt, D.J.; Loesch, C.R. Development of management objectives for breeding birds in the Mississippi Alluvial Valley. In Strategies for Bird Conservation: The Partners in Flight Planning Process; David, R.B., Pashley, N., Cooper, R., Niles, L., Eds.; Cornell Lab of Ornithology: Ithaca, NY, USA, 1999; Available online: http://birds.cornell.edu/pifcapemay/mueller.htm (accessed on 26 December 2019).
  20. Saracco, J.F.; Collazo, J.A. Predation on artificial nests along three edge types in a North Carolina bottomland hardwood forest. Wilson Bull. 1999, 111, 541–549. [Google Scholar]
  21. Thompson, F.R.; Robinson, S.K.; Donovan, T.M.; Whitehead, D.R.; Faaborg, J. Biogeographic, landscape, and local factors affecting cowbird abundance and host parasitism levels. In Ecology and Management of Cowbirds and Their Hosts: Studies in the Conservation of North American Passerine Birds; Smith, J.N.M., Cook, T.L., Rothstein, S.I., Robinson, S.K., Sealy, S.G., Eds.; University of Texas Press: Austin, TX, USA, 2000; pp. 186–219. [Google Scholar]
  22. Joppa, L.; Pfaff, A. Reassessing the forest impacts of protection. Ann. N. Y. Acad. Sci. 2010, 1185, 135–149. [Google Scholar] [CrossRef] [PubMed]
  23. Saura, S.; Bastin, L.; Battistella, L.; Mandrici, A.; Dubois, G. Protected areas in the world’s ecoregions: How well connected are they? Ecol. Indic. 2017, 76, 144–158. [Google Scholar] [CrossRef] [PubMed]
  24. Davidson, M.; Murphy, S.M.; Ribbeck, K.; Kimmel, F.; Duguay, J. Louisiana Black Bear Management Plan; Louisiana Department of Wildlife and Fisheries: Baton Rouge, LA, USA, 2015; p. 74. Available online: http://www.wlf.louisiana.gov/louisiana-black-bear-management-plan (accessed on 26 December 2019).
  25. Bingham, H.; Fitzsimons, J.A.; Redford, K.H.; Mitchell, B.A.; Bezuary-Creel, J.; Cumming, T.L. Privately protected areas: Advances and challenges in guidance, policy and documentation. Parks 2017, 23, 13–28. [Google Scholar] [CrossRef]
  26. Mitchell, B.A.; Stolton, S.; Bezaury-Creel, J.; Bingham, H.C.; Cumming, T.L.; Dudley, N.; Fitzsimons, J.A.; Malleret-King, D.; Redford, K.H.; Solano, P. Guidelines for privately protected areas. In Best Practice Protected Area Guidelines Series No. 29; International Union for Conservation of Nature and Natural Resources: Gland, Switzerland, 2018. [Google Scholar] [CrossRef]
  27. Allen, Y.C. Landscape Scale Assessment of Floodplain Inundation Frequency in the GCPO; U.S. Geological Survey Data Release; U.S. Geological Survey: Reston, WV, USA, 2015. Available online: https://www.sciencebase.gov/catalog/item/5614315be4b0ba4884c610ae (accessed on 26 December 2019).
  28. Elliott, A.B.; Mini, A.E.; McKnight, S.K.; Twedt, D.J. Forests in the Mississippi Alluvial Valley Lacking Sufficient Conservation Protection; U.S. Geological Survey Data Release; U.S. Geological Survey: Reston, WV, USA, 2019. [CrossRef]
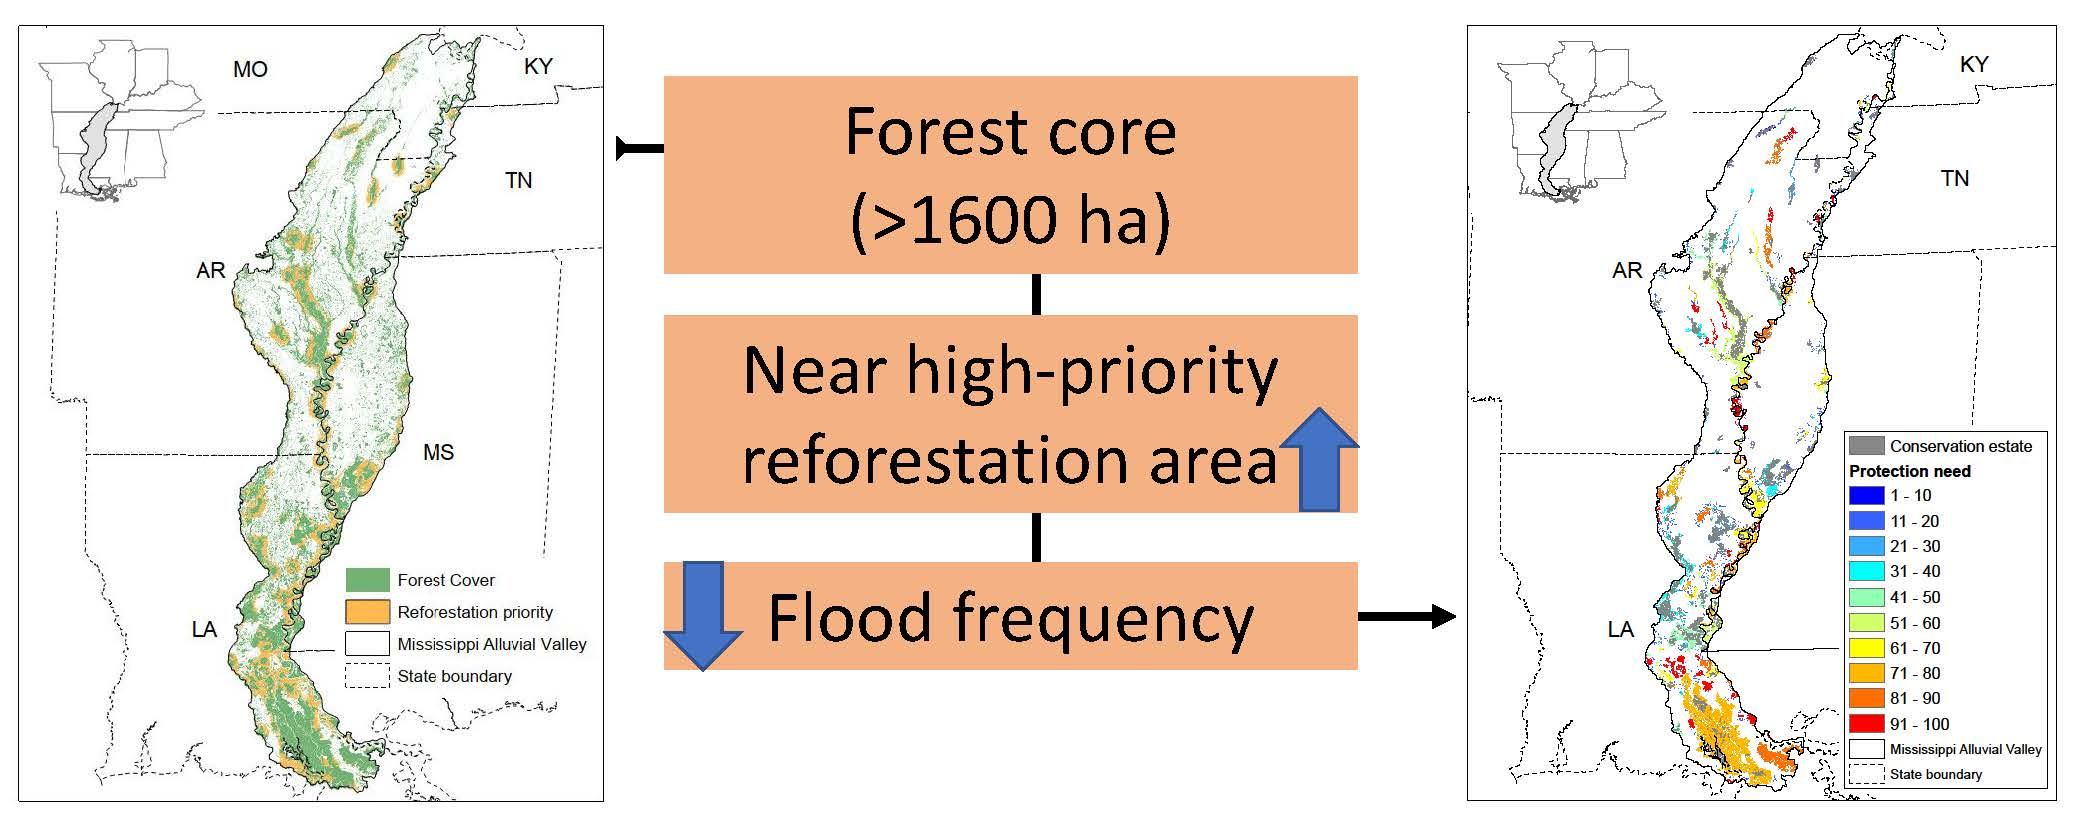
Figure 1. Forest habitat (green [3]) and high priority zones for forest restoration (brown [6]) within the Mississippi Alluvial Valley.
Forests 11 00075 g001
Figure 2. The existing conservation estate within the Mississippi Alluvial Valley wherein conservation–protection is legally mandated or culturally implied. Data sources are provided in text.
Forests 11 00075 g002
Figure 3. Extant forest patches within the Mississippi Alluvial Valley with merit for protection to support bird conservation by virtue of having interior core habitat (>250 from hostile edge) area >1600 ha or being located adjacent to high priority (upper 10%) restoration zones. Data source: this study.
Forests 11 00075 g003
Figure 4. Modeled priority (1 = low, 100 = high) of forest patches for additional conservation–protection to conserve silvicolous birds within the Mississippi Alluvial Valley. Areas with existing conservation–protection within targeted forest patches are depicted as conservation estate.
Forests 11 00075 g004
Table 1. Adjustments to attributed need for additional conservation–protection (% of patch unprotected) of forest patches within the Mississippi Alluvial Valley; reduced for small core area (% of original conservation–protection value), increased (20% or 40% of original conservation–protection value) when location was within a high priority reforestation zone, and further increased up to 20% relative to dryness of forest patch.
Area (ha)Percent of Original Core Area Conservation–Protection ValueReforestation Zone AdditionHydrology Addition
≥2000100%40%20% of dryness coefficient
1600–200050%20%20% of dryness coefficient
<16000%20%20% of dryness coefficient
Table 2. Proposed need for additional conservation–protection (2 = least in need; 100 = most in need) of 4710 forest patches within the Mississippi Alluvial Valley, their total area, and proportion of area protected within the current conservation estate.
Conservation–Protection NeedTotal Area (ha)Area (ha) in Conservation EstateProportion of Area in Conservation EstateCumulative Area (ha) to Provide Complete Conservation–Protection (From Most in Need)
23713110.841,323,272
31601360.851,323,212
415,46514,0720.911,323,188
610,10694040.931,321,795
7583855960.961,321,093
810119530.941,320,851
914,69312,5290.851,320,793
10796267690.851,318,629
11309420570.661,317,436
12862855850.651,316,399
135354540.851,313,356
1412,75887500.691,313,275
1512,48067890.541,309,267
16882060710.691,303,576
1822,29614,9650.671,300,827
1987,47385420.101,293,496
2013,48295250.711,214,565
21369323160.631,210,608
2211,73282010.701,209,231
2447,80639,7240.831,205,700
25530244480.841,197,618
2617,20610,7230.621,196,764
2713,01998550.761,190,281
30401330830.771,187,117
3118,13612,7540.701,186,187
32827455110.671,180,805
3310,42569930.671,178,042
3416828330.501,174,610
3531,46619,4320.621,173,761
3658,74141,2550.701,161,727
3796,21666,9540.701,144,241
39877158190.661,114,979
41520023790.461,112,027
4382,82649,5150.601,109,206
4422,46812,5580.561,075,895
45539124550.461,065,985
4614,05385780.611,063,049
4814471170.081,057,574
49547110.001,056,244
5034,40117,4040.511,050,774
51191,26497,2270.511,033,777
52448413330.30939,740
53646728150.44936,589
54182450.00932,937
5641,90717,4580.42931,118
58633323300.37906,669
60926528590.31902,666
6112,57148790.39896,260
6293554280.05888,568
6334,37813,3830.39879,641
6419,88567860.34858,646
65525119950.38845,547
6630388870.29842,291
6854,87316,0710.29840,140
6918595740.31801,338
7023086650.29800,053
7123416920.30798,410
7450,49611,5980.23796,761
7515,66735480.23757,863
7715,84131060.20745,744
80456,12569,7000.15733,009
8250318680.17346,584
8482567930.10342,421
8515,08418220.12334,958
8690,7986930.01321,696
871559730.05231,591
8825,15518520.07230,105
8918,7853840.02206,802
9041,37952810.13188,401
9122,8398040.04152,303
9298671340.01130,268
9334,5679060.03120,535
9461,55300.0086,874
9541701640.0425,321
9713,4724450.0321,315
100829790.008288
Total2,039,255715,983

