Article

Regional and Local Moisture Gradients Drive the Resistance to and Recovery from Drought of Picea crassifolia Kom. in the Qilian Mountains, Northwest China

School of Geography and Tourism, Shaanxi Normal University, 620 Western Changan Street, Changan District, Xi’an 710119, China
*
Author to whom correspondence should be addressed.
Forests 2019, 10(9), 817; https://doi.org/10.3390/f10090817
Submission received: 30 July 2019 / Revised: 16 September 2019 / Accepted: 17 September 2019 / Published: 19 September 2019
(This article belongs to the Section Forest Ecophysiology and Biology)

Abstract

:
Increasing evidence suggests that extreme droughts cause more frequent tree growth reduction. To understand the consequences of these droughts better, this study used tree-ring cores from nine sites to investigate how moisture and altitudinal gradients affect the radial growth of Picea crassifolia Kom., a common species in the Qilian Mountains in northwest China. The total annual precipitation and mean annual temperature in the eastern region were higher than those in the western region of the Qilian Mountains. The trees in the eastern region showed stronger resistance to drought than those in the west, as they had a smaller difference in radial growth between drought disturbance and pre-drought disturbance. At the same time, the trees in the east showed weaker ability to recover from drought, as they had a subtle difference in radial growth between post-drought disturbance and drought disturbance. Furthermore, the trees in the east also showed weaker relative resilience to drought, as they had a small difference in radial growth between post-drought and drought disturbance weighted by growth in pre-drought disturbance. For trees below 3000 m a.s.l., trees with high resistance capacity usually had low recovery capacity and low relative resilience capacity. Trees at higher altitudes also showed stronger resistance to drought and weaker ability to recover from drought after a drought event than those at lower altitudes in the middle of the Qilian Mountains. Trees at lower altitudes in the middle of the Qilian Mountains had more difficulties recovering from more severe and longer drought events. In the context of global warming, trees in the western region and at lower altitudes should be given special attention and protection in forest management to enhance their resistance to extreme droughts.

1. Introduction

Global warming combined with increased terrestrial evapotranspiration is an incontrovertible fact of the past decades [1,2,3,4]. Various studies indicate that climate warming has increased the frequency and intensity of extreme drought events [5,6]. Increasing evidence indicates that extreme droughts result in the reduction of canopy photosynthesis and have negative effects on radial growth, induce productivity declines, and increase subsequent mortality rates of trees [7,8,9,10]. Understanding how trees react to extreme droughts is essential to assessing forest ecosystem stability and to predicting forest dynamics [11].
The response of trees to drought events can be measured by stable indices including resistance, recovery, resilience, and relative resilience [12]. Resistance quantifies the difference in radial growth between the drought disturbance and the pre-drought disturbance periods. Recovery is the capacity of radial growth to recover from disturbance during the drought period. Resilience describes the ability of radial growth to regain the growth level from before the drought disturbance. Relative resilience is the resilience weighted by the negative effects experienced during the disturbance period. These four indices can reflect the trees’ ability to cope with drought disturbance.
Climatic conditions and geographic locations across the species’ distribution area are two of the main factors influencing tree responses to drought [13,14,15]. In drier areas, drought events could weaken the ability of trees to absorb water and thus lead to a radial growth decline and decreased carbohydrates in the xylem [16,17]. For instance, drought stress contributes to the significant reduction of trees’ basal area increments in the arid Tianshan Mountains, northwest China [18]. Pinus sylvestris L. and Pinus nigra Arnold. also show growth reduction at their dry distribution edge (i.e., Sierra de Baza Natural Park in Spain at the southernmost distribution limit for the two species) in the Mediterranean basin [19]. Tree growth reduction and mortality resulting from drought are frequent, especially in semi-arid and arid areas [20,21,22]. Temperate broadleaf forests in wet northeastern North America and central Europe have stronger resistance to drought; nevertheless, conifer forests in arid southwestern North America and semi-arid southern Europe show stronger ability to recover from drought [23]. In 27 forests of Pinus halepensis Mill. distributed across eastern Spain, trees at dry sites are less resilient but recover faster than those at wet sites [24]. It is important to identify trees at higher altitudes or lower altitudes that have stronger resistance to and ability to recover from drought in forest protection and management, especially in the context of global climate change.
A change in altitude also influences the way in which tree radial growth is affected by drought. Some studies have shown that drought decreased growth at low elevation and had no effects on growth at high elevation [25,26]. Another study showed that the influence of drought did not differ between altitudes [27]. In Northern Hemisphere forests, trees’ resilience to drought increased with an increase in altitude and an increase in soil moisture [23]. Abies alba Mill. in southwestern Germany also showed stronger resistance to drought at high elevations and weaker resistance at low elevations [28]. It could be thus inferred that altitude could influence the response of trees to drought.
Different drought events may influence the ability of trees to handle the drought. For example, studies in southwestern Germany showed that the drought in 1976 occurred in early spring, whereas another drought in 2003 occurred in the summer. The drought in 1976 had limited effects on the radial growth of Norway spruce, whereas the summer drought in 2003 stopped the radial growth one month earlier than the regular end of the growing season. The resistance and resilience of Norway spruce to the drought in 2003 were weaker than those of silver fir and Douglas fir in the study area, which may be attributed to the deeper and stronger root systems and longer wood formation periods of silver fir and Douglas fir. In contrast, the three species responded similarly to the drought in 1976. The reason may be that Norway spruce could resume radial growth after the drought occurred in the early spring of 1976 [28]. A study in the center of France showed that Scots pine performed better than sessile oak in response to droughts that occurred in spring during 1990–1992 and in 2010, whereas the opposite was true in drought events that occurred in summer in 2003 and 2006. The radial growth of oak species in spring could achieve almost half the annual radial increment and the newly formed earlywood vessels in spring are widely accompanied with embolism risks. These vessels are rapidly embolized as conditions become more stressful. Summer drought harms oak radial growth less, because radial increment mainly occurs during the months preceding the drought. In contrast, needles of Scots pine only appear during the summer when a mere fourth of its annual radial increment has formed. Summer droughts influence pine growth more strongly compared to spring droughts because they hamper needle formation and reduce cell enlargement [9]. Another study showed that extreme droughts that occurred in the dry season had a stronger influence on the recovery capacity of tree radial growth than did droughts that occurred in the wet season [29].
The Qilian Mountains are located to the northeast of the Tibet Plateau, northwest China [30]. Picea crassifolia Kom. is a dominant and widespread conifer species in the Qilian Mountains [31]. Many dendrochronological studies have been carried out in the Qilian Mountains because of the high climate sensitivity of Picea crassifolia. Some studies have focused on climate reconstruction from Picea crassifolia tree rings [32,33,34], and climate change-related research has also gained increasing attention [35,36,37]. However, studies on how the radial growth of Picea crassifolia responds to extreme drought events are limited.
There is significant variation in moisture from the east to the west in the Qilian Mountains, northwest China [38]. There are higher temperatures and more precipitation in the east than in the west (Figure S1). These gradients allow us to assess the different responses of radial growth to extreme droughts in divergent water stress conditions. In this study, we set up a series of sites (9 sites in total) along the moisture gradient from the east to west and along the altitudinal gradient in the middle of the Qilian Mountains to sample increment cores of Picea crassifolia. The aims of this study were to (1) analyze the regional differences and altitudinal differences of trees’ ability to cope with drought, (2) study the response of trees to different drought events, and (3) explore the relationship between the coping capacity of trees and climate factors. We hypothesize that moisture conditions are tightly correlated with the trees’ ability to cope with drought and that trees at wetter sites have higher resistance to drought and lower recovery.

2. Materials and Methods

2.1. Study Area and Sampling Design

The study region is situated in the Qilian Mountains (northwestern China, 36.433° N–40.017° N, 94.867° E–103.150° E), which is located on the northeastern margin of the Tibet Plateau (Figure 1). The terrain decreases from the northwest to the southeast and the altitude ranges from 2500 m a.s.l. to 4500 m a.s.l. Picea crassifolia is one of the dominant tree species and generally grows on shaded and semi-shaded slopes [39]. The eastern region of the Qilian Mountains is influenced by the East Asian monsoon and the western region is affected by the westerlies [40]. The climates of the eastern and western regions combine in the middle of the Qilian Mountains [41,42]. Both mean annual temperature and total annual precipitation gradually decrease from the east to west (Figure S1).
We chose four sampling regions in the Qilian Mountains, which were named TLG (Tulugou), SDL (Sidalong), LCH (Longchanghe), and QKD (Qingkedi) from the east to the west (Figure 1). Each sampling region consisted of one to four sites (Table 1). We set a quadrat (20 m × 20 m) at each sampling site in the pure Picea crassifolia forests. Dominant trees that were less affected by the surrounding trees with >20 cm diameter at breast height (approximately 1.3 m) in the quadrat were selected as sample trees [43]. We confirmed that the crown canopy of the surrounding trees did not overlap the canopy of the target tree to minimize the influence of competition among trees on growth signals.
Increment borers (5.15 mm diameter) were used to sample two cores at breast height from each tree. The details of the sampling information are shown in Table 1. The cores were processed using standard dendrochronological procedures [44], that is, fixed in wooden tanks, sanded with sandpaper, cross-dated by comparing the patterns of rings [43], and measured using Lintab 6.0 [45]. The COFECHA program was used to test the quality of the cross-dating process and cores of low quality were removed [46]. The basal area increment (BAI) of each tree at each site was calculated using the raw ring width using the following equation:
B A I t = π R t 2 + π R t 1 2
where Rt is the distance measured from the pith to the outer margin of the ring formed in year t.

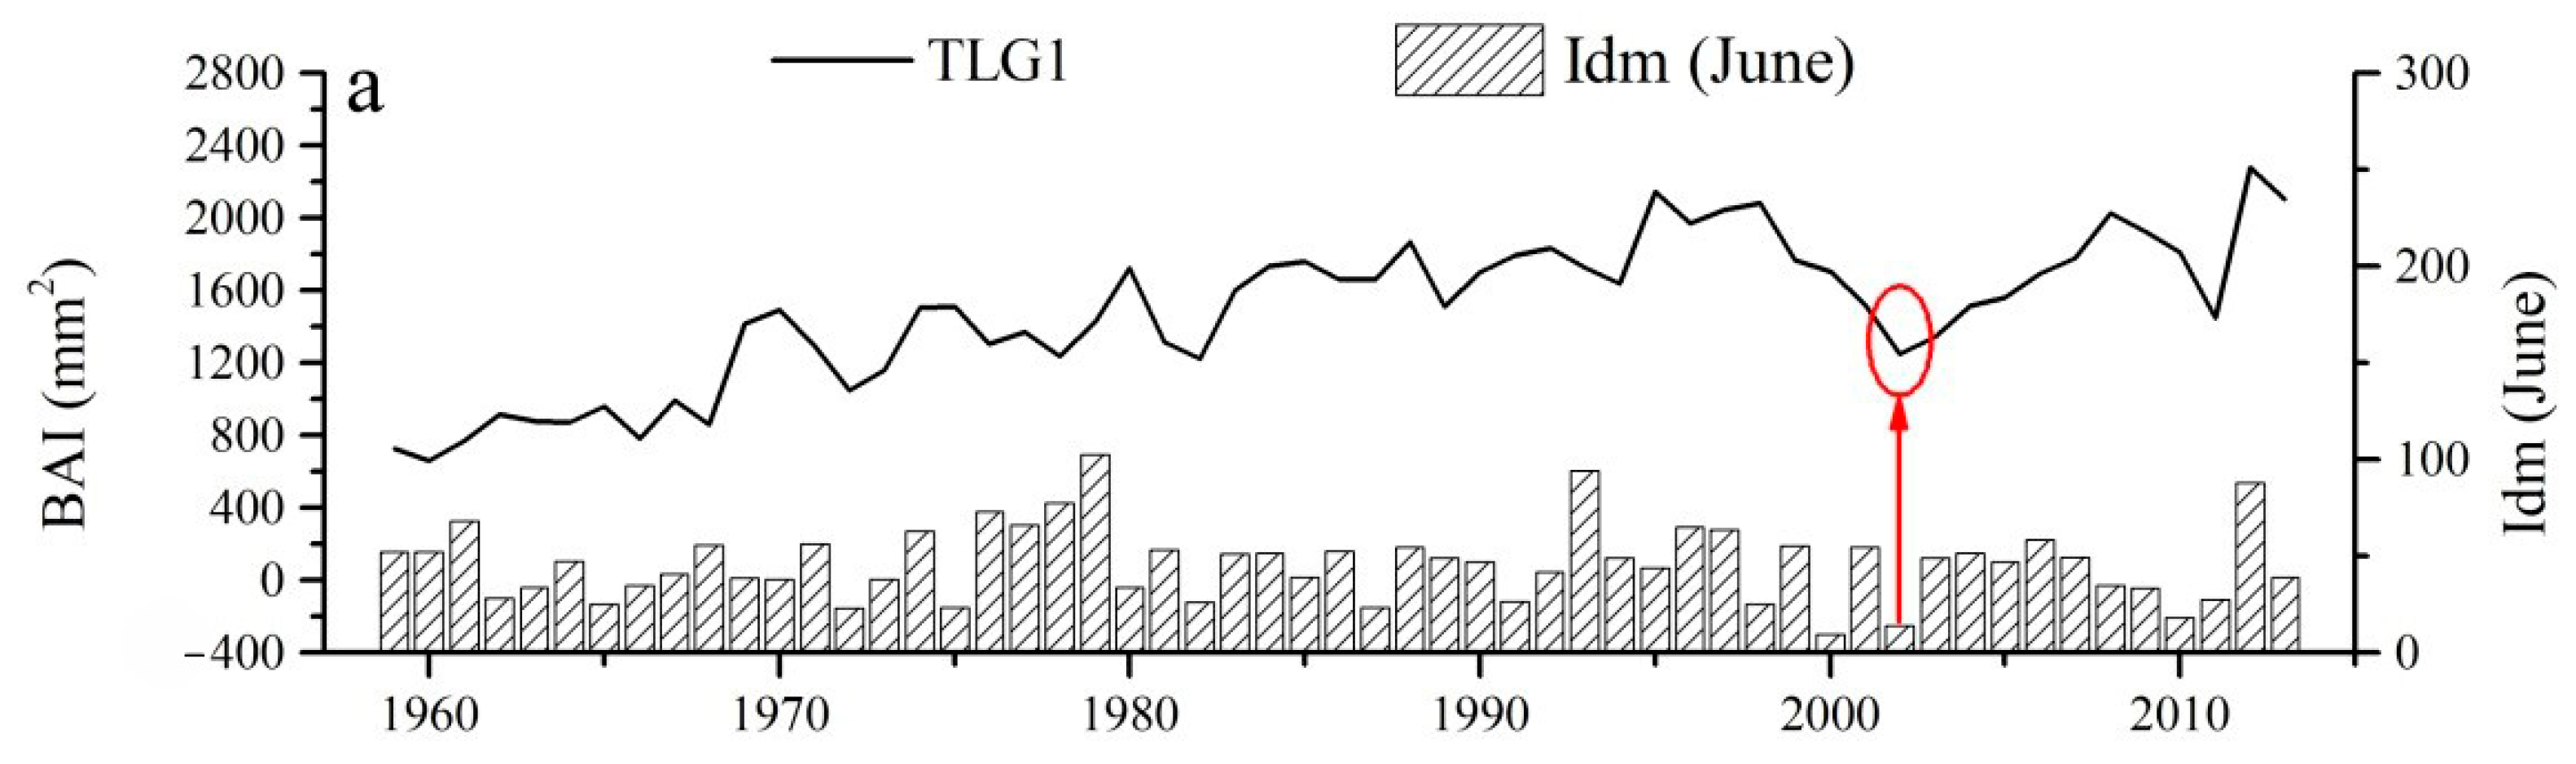
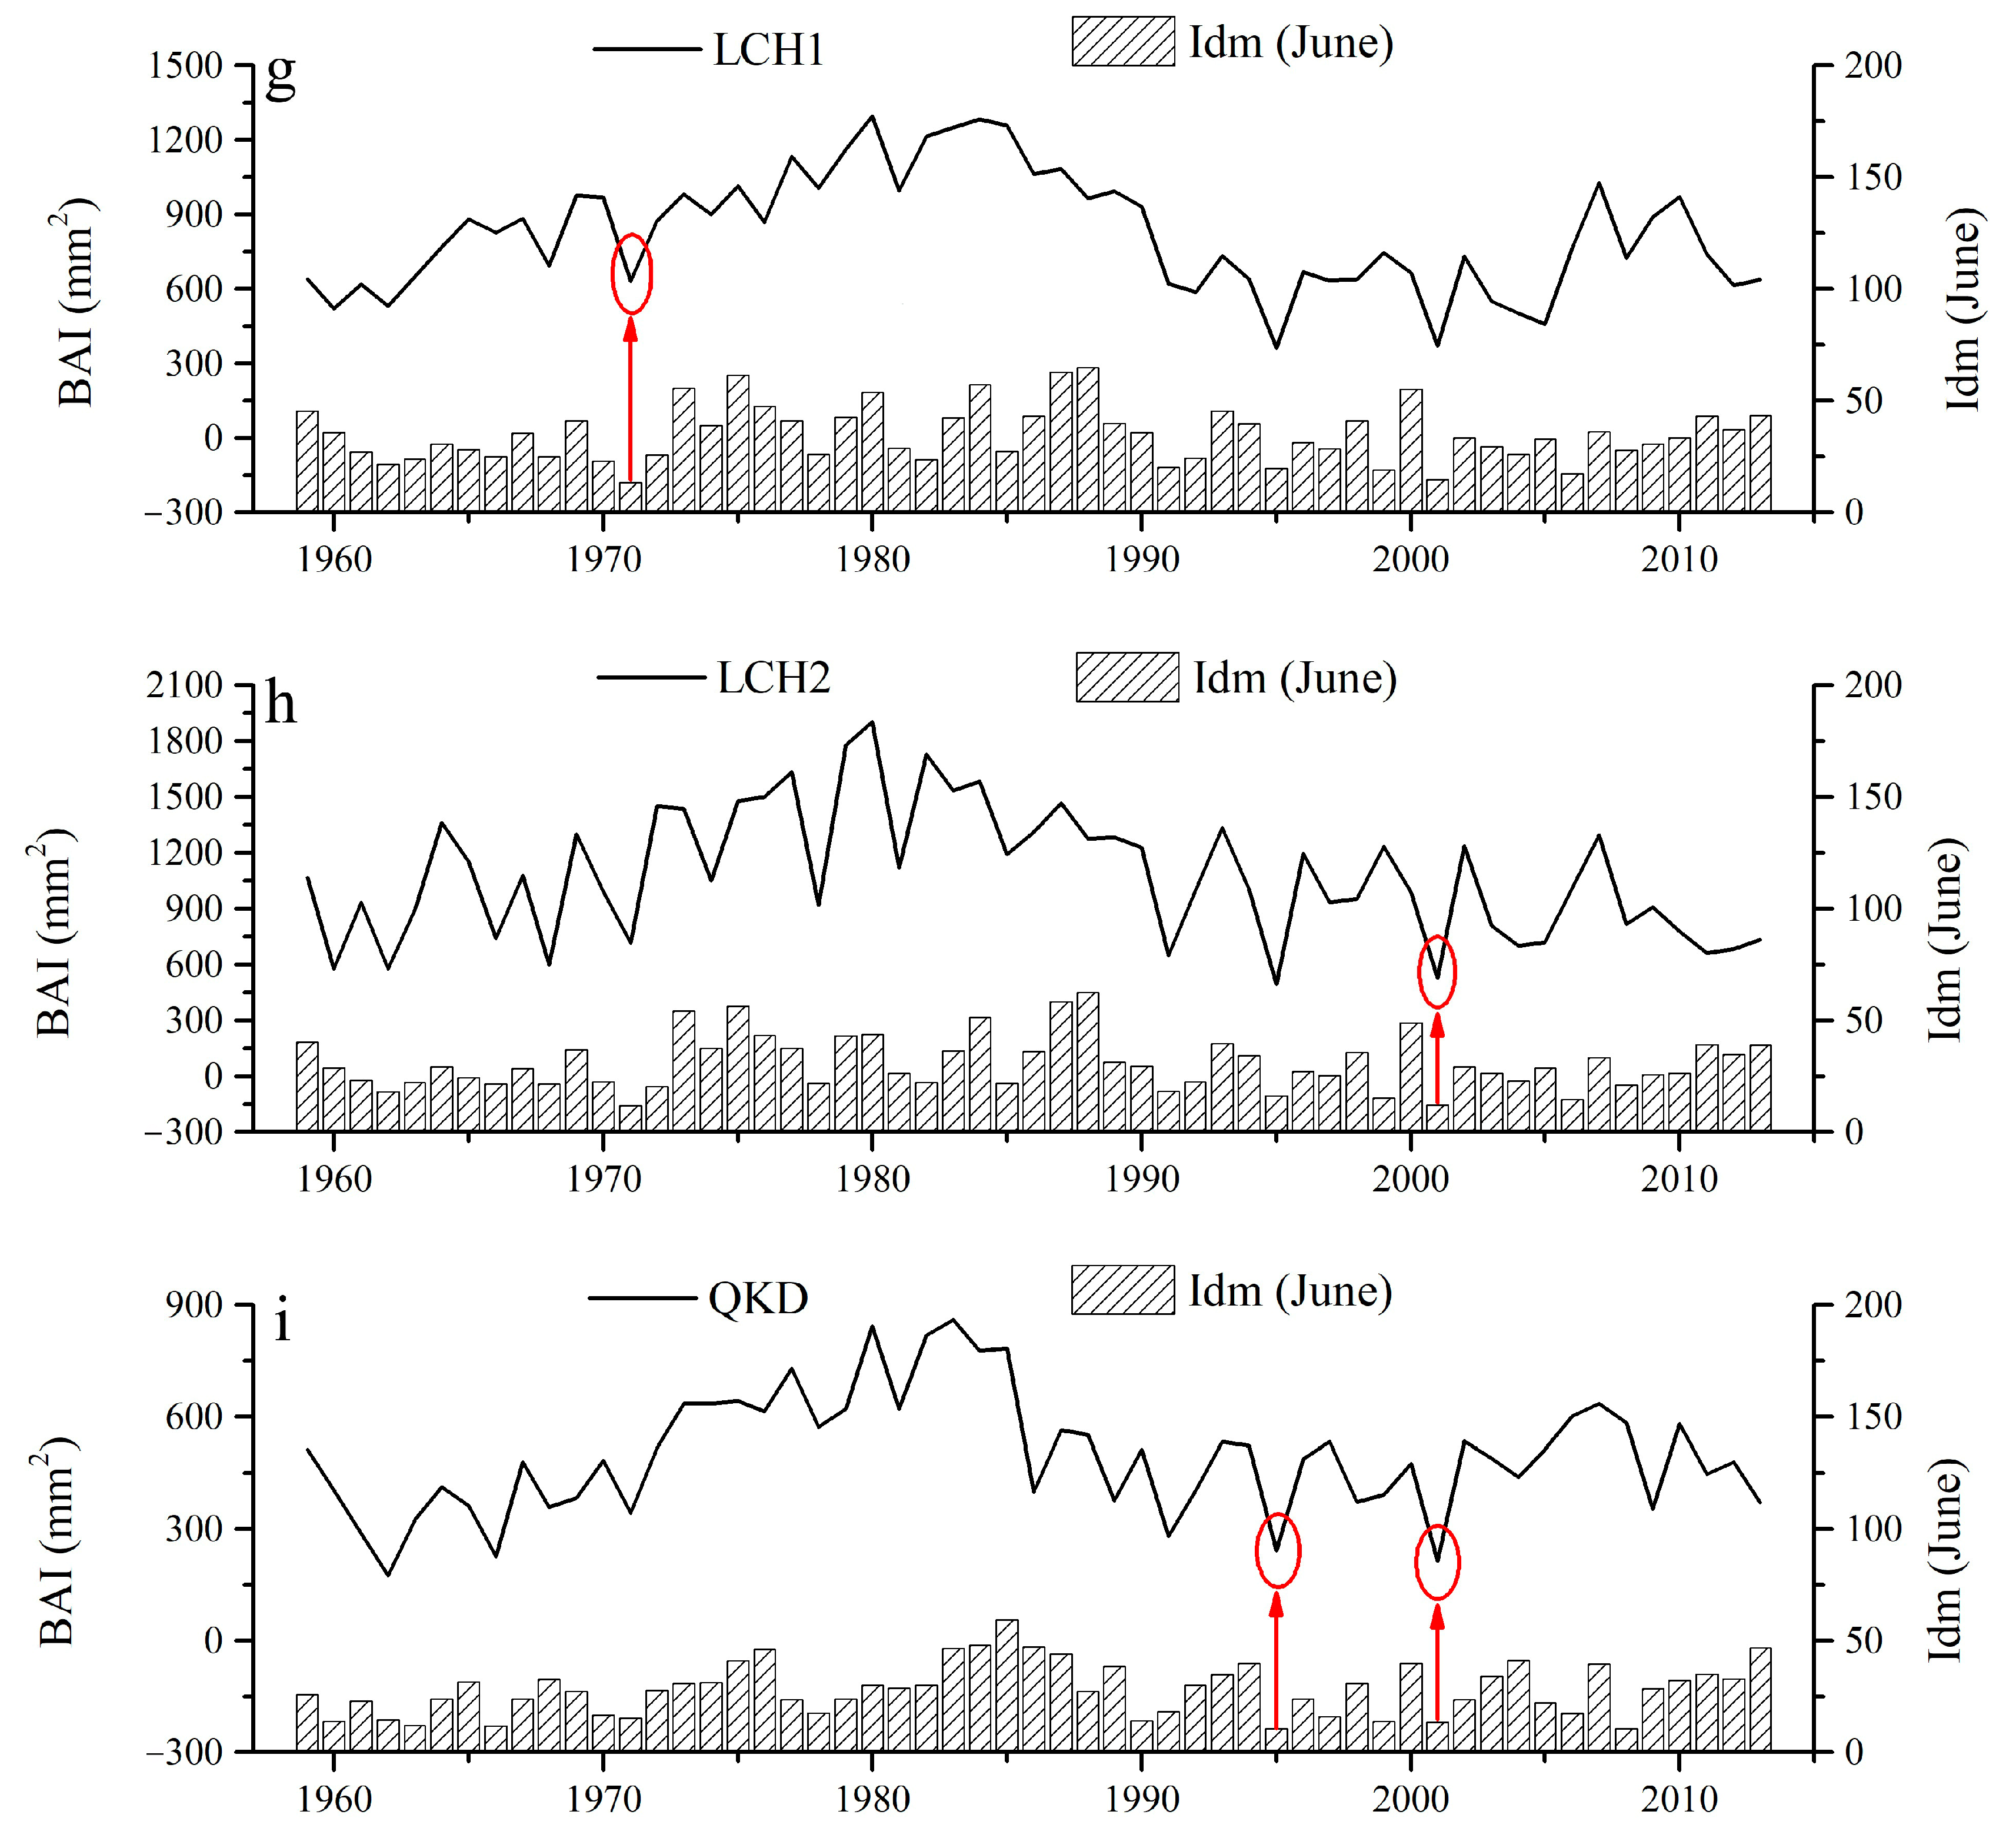
2.2. Local Climate and Pointer Year

Because there is no meteorological station at each sampling site, we calculated the local climate data at each site using the data from the nearest one or two meteorological stations, which are shown in Table 1. Precipitation data were calculated according to the proportion of vertical distance to the two nearest meteorological stations. For example, the vertical distance of site TLG1 (2922 m a.s.l.) to Wushaoling station (3045 m a.s.l.) was 123 m, whereas the vertical distance to Minhe station (1814 m a.s.l.) was 1108 m. Precipitation at TLG1 was calculated according to the following equation:
Pre ( TLG 1 ) = 1108 123 + 1108 × Pre ( Wushaoling ) + 123 123 + 1108 × Pre ( Minhe )
where Pre(TLG1) indicates precipitation at site TLG1, Pre(Wushaoling) indicates the precipitation at Wushaoling station, and Pre(Minhe) indicates the precipitation at Minhe station.
The temperature at each site was calculated according to the lapse-rate of air temperature in each sampling region. The de Martonne aridity index (Idm) at each site was calculated according to the following equation:
Idm = 12 R T + 10
where R indicates the total monthly precipitation and T indicates the mean monthly temperature; drought occurs when the Idm is lower than 30. When we calculate the annual Idm, 12R indicates the total annual precipitation and T indicates the mean annual temperature.
Most Picea crassifolia usually grow between 2650 m a.s.l. and 3200 m a.s.l. in the Qilian Mountains [37]. Our previous study there found that the radial growth of Picea crassifolia and its response to climate above 3000 m a.s.l. significantly differed with those below 3000 m a.s.l. [47]. As a result, we divided the trees into two groups in analysis. Data at TLG1, TLG2, SDL3, SDL4, LCH1, LCH2, and QKD were used to research the regional change of stable indices and those at SDL1, SDL2, SDL3, and SDL4 were used to explore the altitudinal change of indices. For the sites below 3000 m a.s.l. (seven sites), annual de Martonne aridity indices show a significant linear relationship with total annual precipitation, but no relationship with the mean annual temperature (Figure 2). For the sites in the middle of Qilian Mountains (four sites), the higher sites with more precipitation and lower temperature are wetter than the lower sites (Figure 3).
Pointer years are used to identify extremely dry years when assessing the response of radial growth to drought [48,49]. The pointer years at each site were selected using the package pointRes in R when 70% of the BAI series showed 40% relative negative growth change in a time window of three years [50]. Pointer years with low Idm values were selected as drought-linked pointer years (Figure 4). This phenomenon can be attributed to the legacy effect of drought on radial growth at relatively wetter sites.
Finally, we selected 2002 at TLG1 and TLG2; 1971–1973 at SDL1 and SDL2; 1971, 1995, and 2001 at SDL3 and SDL4; 2001 at LCH1 and LCH2; and 1995 and 2001 at QKD as the drought periods (Table S1). The drought during 1971–1973 was named as the early drought event, the drought in 1995 as the middle drought event, and the drought during 2001–2002 as the late drought event, according to their chronological order.

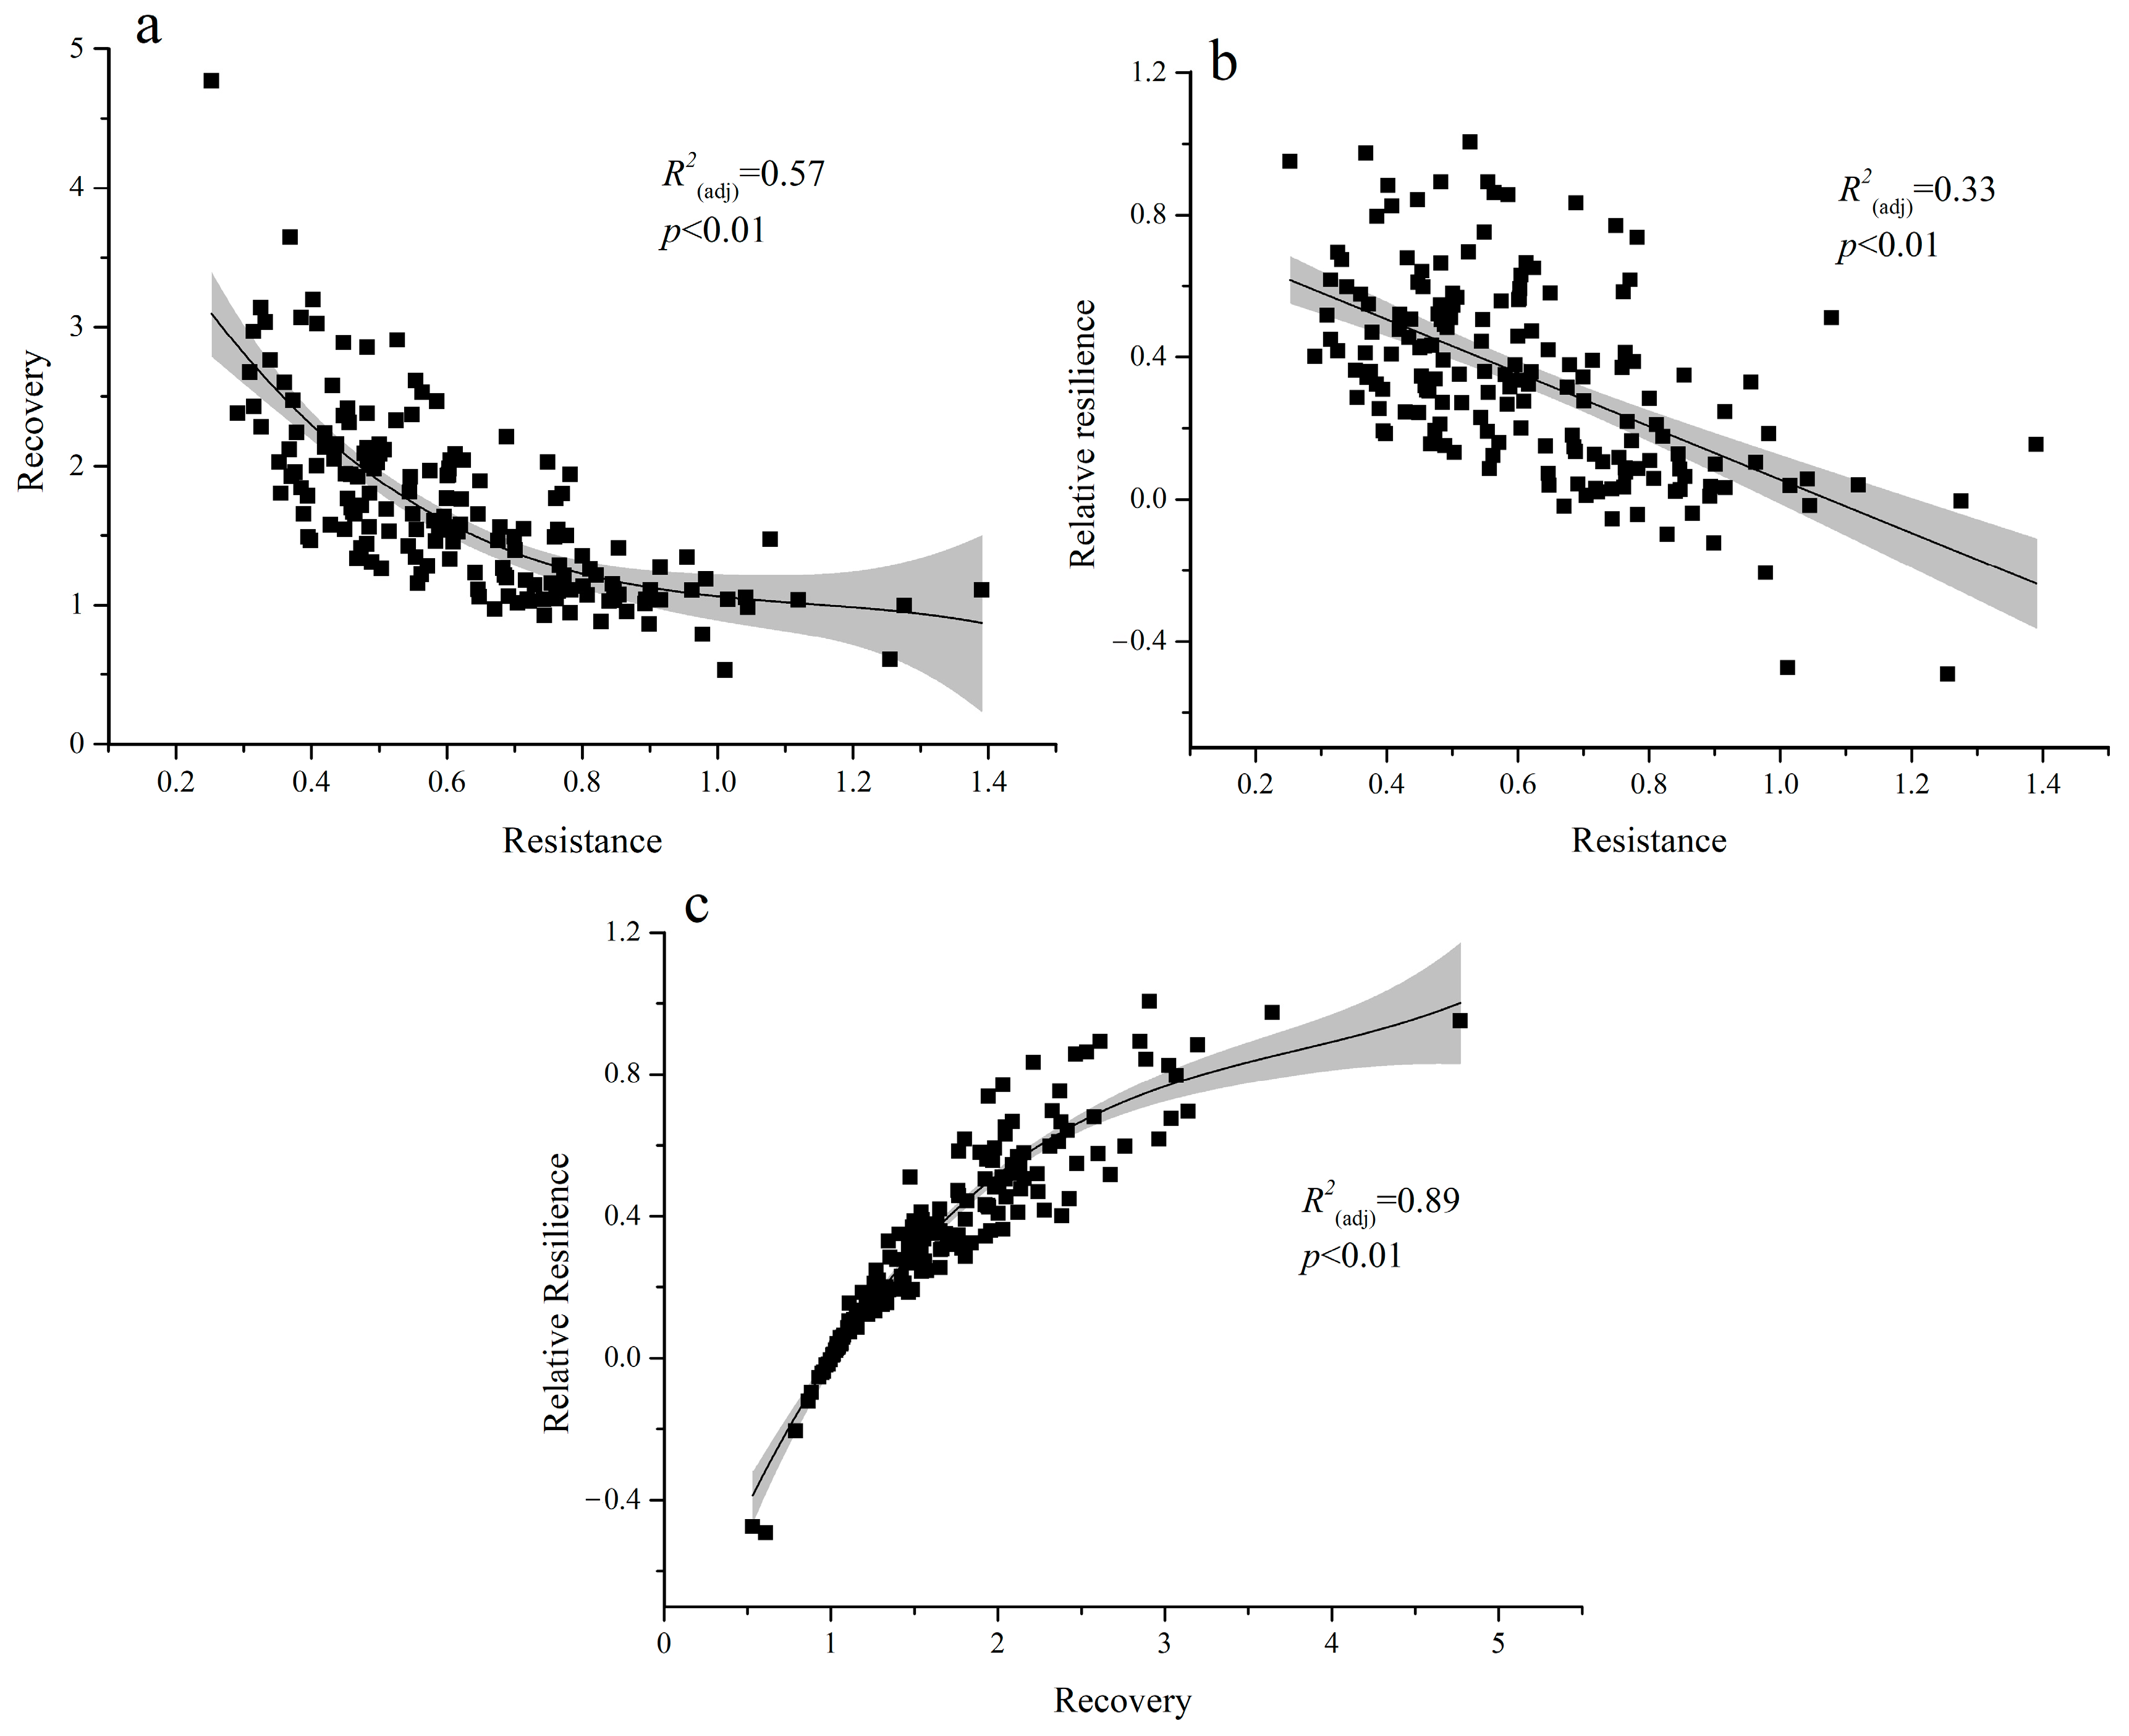
2.3. Response of Tree Radial Growth to Drought Disturbance

The response of tree radial growth to disturbance, such as drought indicated by pointer years, could be assessed by using stable indices following Lloret et al. [51]. These indices include the resistance index, recovery index, resilience index, and relative resilience index, which indicate tree radial growth in drought disturbance (i.e., Drought in Equations (4), (5) and (7)) relative to radial growth during the three years before and after the disturbance (i.e., Predrought and Postdrought in Equations (4)–(6) and (7)) [52].
Resistance quantifies the difference in radial growth between the drought disturbance and pre-drought disturbance periods:
Resistance = D r o u g h t P r e d r o u g h t  
Recovery describes the ability of radial growth to recover from disturbance during the drought period:
Recovery = P o s t d r o u g h t D r o u g h t
Resilience accounts for the ability of radial growth to regain the level before the drought disturbance:
Resilience = P o s t d r o u g h t P r e d r o u g h t
Relative resilience is the resilience weighted by negative effects experienced during the disturbance period:
Relative   resilience = P o s t d r o u g h t D r o u g h t P r e d r o u g h t

2.4. Data Analysis

At each site, the BAI of each tree was calculated by averaging the BAIs of the two cores of the tree. The four stable indices of each tree were calculated according to Equations (4)–(7) above. The sample sizes at TLG1, TLG2, SDL1, SDL2, SDL3, SDL4, LCH1, LCH2, and QKD were 24, 22, 23, 25, 25, 23, 25, 25, and 25, respectively. The stable indices of the late drought event at TLG1, TLG2, SDL3, SDL4, LCH1, LCH2, and QKD were used to study regional differences through analysis of variance (ANOVA) in IBM SPSS (version 21.0). Linear fitting and polynomial fitting were performed for the resistance indices, recovery indices, and relative resilience indices for the late drought event at these seven sites in Origin 9.0.
The stable indices of the early drought event at SDL1, SDL2, SDL3, and SDL4 were used to study altitudinal differences through ANOVA. Linear fitting and polynomial fitting were performed to assess the influence of altitude on the stable indices. The stable indices of the early, middle, and late drought events at SDL3 and SDL4 were used to study the trees’ capacity to cope with different drought events through ANOVA, because trees at these two sites suffered from three different drought events and are within a close range of altitude. The average monthly values of the de Martonne aridity index at SDL3 and SDL4 were calculated and named the SDL34-average. The mean values of the SDL34-average from March to October were calculated and named the SDL34-average(March–October). The mean value of the SDL34-average(March–October) from 1959 to 2013 was calculated and the obtained value was very close to 30. We then calculated the differences between the SDL34-average in the drought years (i.e., 1971, 1995, and 2001) and the value of 30 to quantify the drought intensity.

3. Results

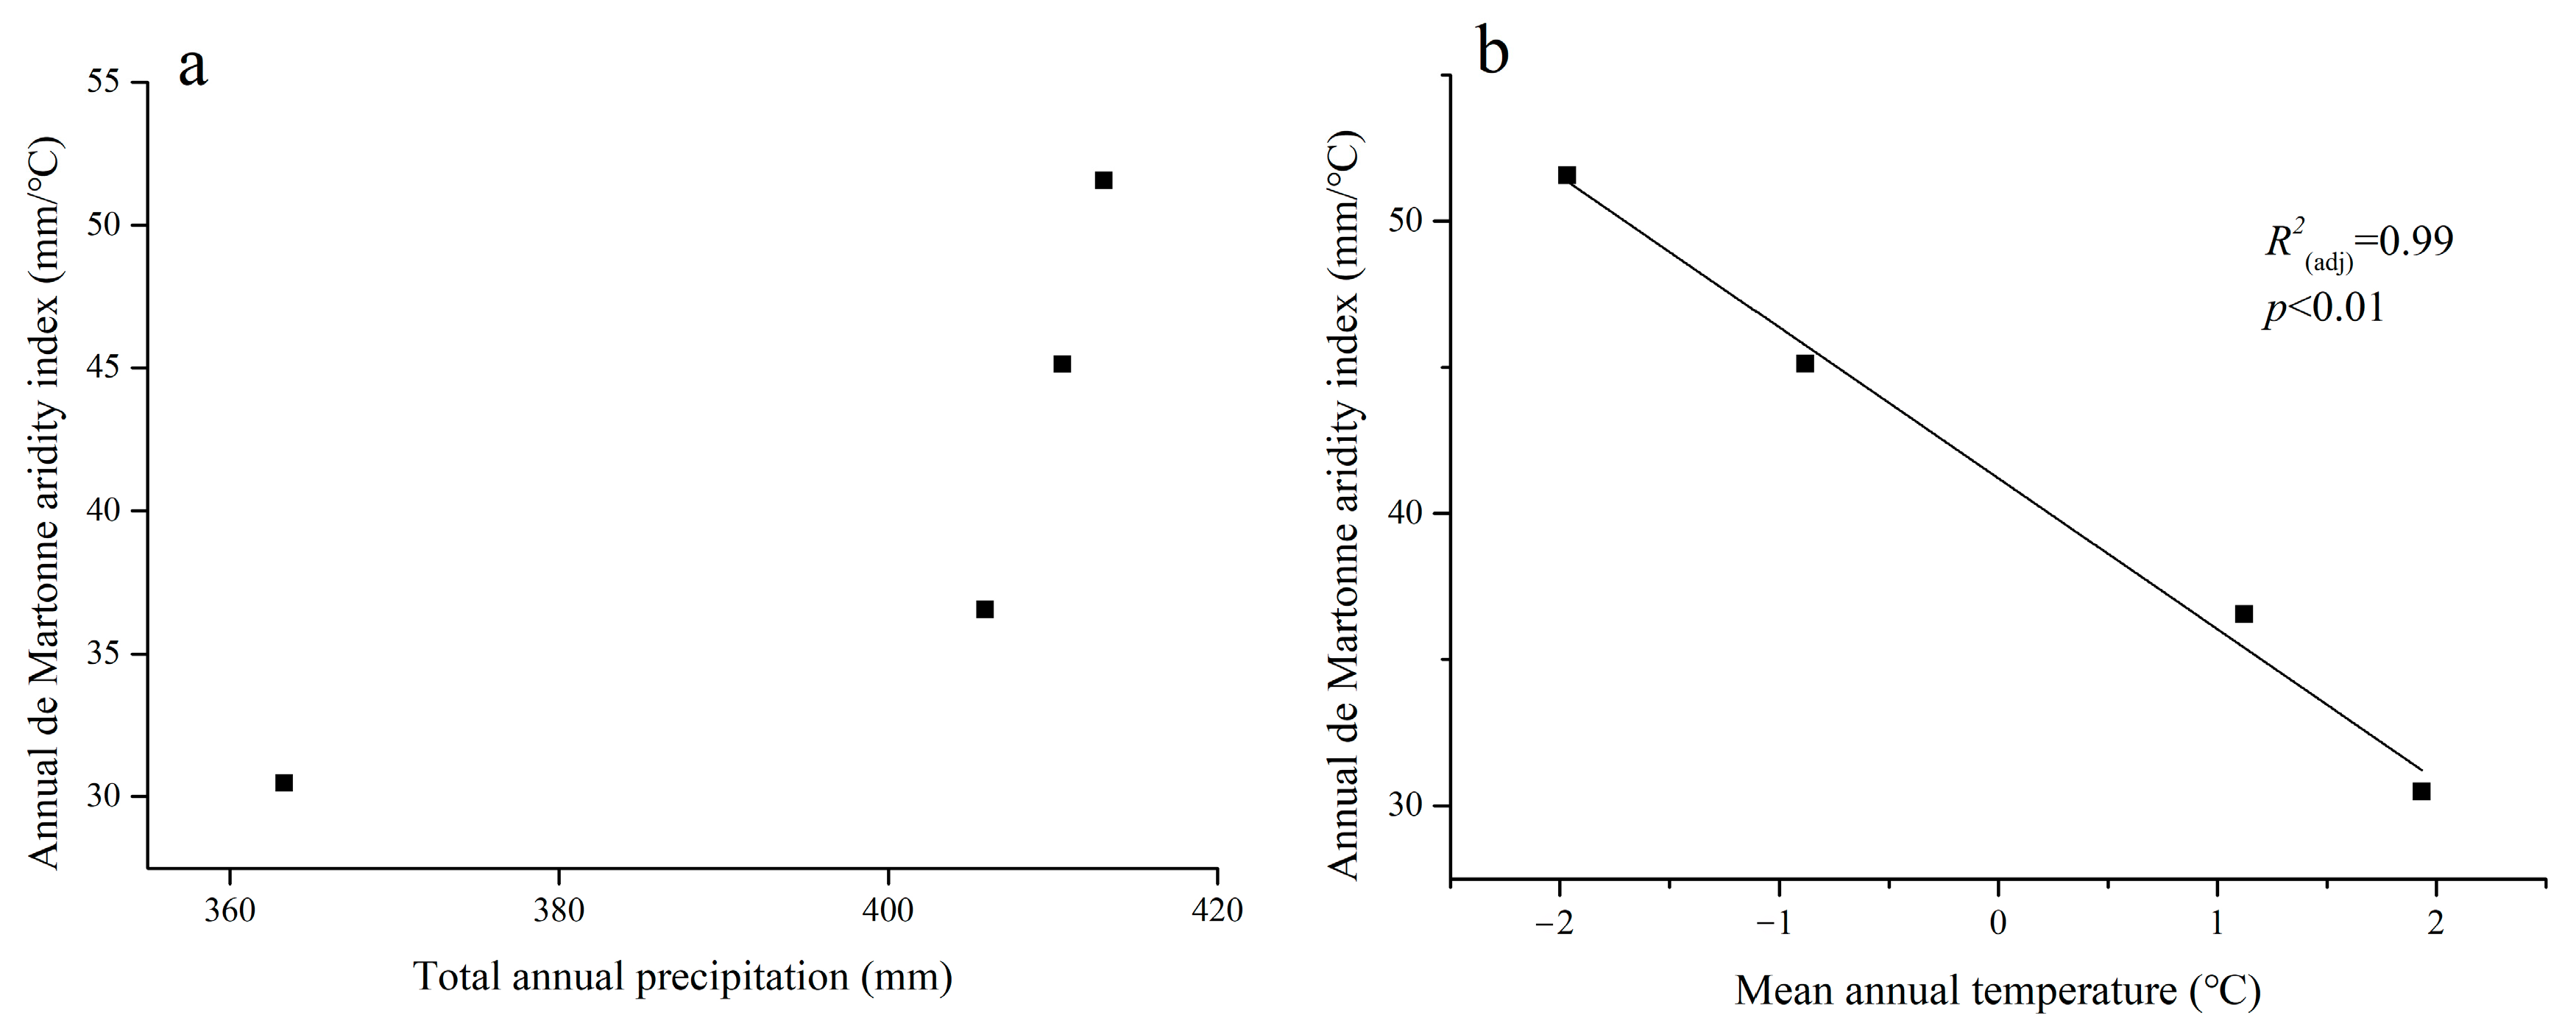
3.1. Regional Differences in Stable Indices

Results show that the resistance indices were higher in TLG1 and TLG2, followed by SDL3, SDL4, LCH1, LCH2, and finally QKD (Figure 5a). The recovery indices and relative resilience indices were higher in QKD, followed by SDL3, SDL4, LCH1, LCH2, and finally TLG1 and TLG2 (Figure 5b,d). The resilience indices at QKD were higher than those at the other sites. There were no significant differences among the resilience indices at TLG1, TLG2, SDL3, SDL4, LCH1, and LCH2 (Figure 5c). The most significant difference emerged between the resistance indices, the recovery indices, and the resilience indices at TLG and those at QKD.
The linear fitting results between the stable indices and the de Martonne aridity indices showed that trees at wetter sites have higher resistance indices, lower recovery indices, and lower relative resilience indices than trees at drier sites (Figure 6). Further, there were significant linear or polynomial relationships among the three stable indices. Resistance indices increased with decreasing recovery indices. Relative resilience indices increased with decreasing resistance indices and with increasing recovery indices (Figure 7).

3.2. Stable Indices at Different Altitudes and in Different Drought Events

The results show that the resistance indices were higher in SDL1 and SDL2, followed by SDL3 and SDL4; recovery indices were higher in SDL3, followed by SDL1, SDL2, and SDL4; resilience indices were lower in SDL4, followed by SDL1, SDL2, and SDL3; and relative resilience indices were the highest in SDL3 and the lowest in SDL4 (Figure 8). The results of linear fitting or polynomial fitting between stable indices and altitudes also showed that the resistance indices were higher and the recovery indices were lower at the lower two sites (Figure S2).

3.3. Stable Indices in Different Drought Events

The results showed that the resistance indices for the early drought event were lower, followed by the middle drought event and the late drought event. The recovery indices for the early drought event were higher, followed by the middle drought event and the late drought event. The resilience indices for the middle drought event were higher than those for the early drought event and the late drought event. The relative resilience indices for the late drought event were lower than those for the early drought event and the middle drought event (Figure 9)
The differences between the de Martonne aridity indices in the drought years and the value of 30 showed that the early and middle drought duration was three months (March–May) and the late drought duration was four months (March–June). The average difference values from March to May for the early, middle, and late drought events were −14.22, −18.93, and −19.02, respectively, which indicates that the drought intensity in spring (March–May) is ordered: The early drought event < the middle drought event < the late drought event (Figure 10).

4. Discussion

Our results show that the resistance, recovery, resilience, and relative resilience of Picea crassifolia forests to drought at the seven sites are linked to the annual de Martonne aridity indices. Trees responded differently in withstanding the influence of drought. In the late drought event, trees in the drier western region (with less total annual precipitation and lower mean temperature in the growing season) show weaker resistance, stronger recovery, stronger resilience, and stronger relative resilience than those in the wetter eastern region (with more total annual precipitation and higher mean temperature in the growing season). On one hand, this may be attributed to the fact that trees suffer from droughts in a more or less severe way depending on the microclimate of the site. As the moisture condition in the east is better than that in the west, the better microenvironment in the east during drought could help the trees there to recover faster than the trees in the west. On the other hand, the differences in the hydraulic conductivity of xylem between trees in different regions might result in various abilities to resist drought [11].
Our study on Picea crassifolia in the Qilian Mountain also showed that standard deviations and mean sensitivities of chronologies (i.e., radial growth parameters reflecting the climate sensitivity of tree growth) in the drier region were higher than those in the wetter region, suggesting that trees in the drier region were more sensitive to climate change [53]. This result was also in accordance with the trees’ lower resistance to disturbance in the drier region. The research of Gazol et al. on 27 forests distributed across eastern Spain also showed that Aleppo pine at dry sites was less resilient but recovered faster than those at wet sites [24]. The drought resistance ability of Aleppo pine in Spain was mainly linked to drought intensity, whereas the trees’ recovery ability from drought mainly depended on site precipitation. This result is similar to the results of our study. However, some other studies contradict these findings. For instance, a study carried out in the latitudinal range of Fagus sylvatica showed that populations at the dry range edge exhibited higher resistance to drought than those at the core of the species range (wetter than the dry range), and some evidence of drought-induced growth reduction was found [52]. In contrast, trees in the core of the species’ range showed the greatest sensitivity and weak resistance to drought. It is thus inferred that the response of trees to drought disturbance varied with the regional moisture conditions, but the changing characteristics may rely on the tree species and study region.
For trees below 3000 m a.s.l., there were significant linear or polynomial relationships among resistance indices, recovery indices, and relative resilience indices. Studies on Northern Hemisphere forests and the ponderosa pine forests in the northern Rocky Mountains have also shown this phenomenon [23,51]. In our study, the resistance indices were significantly and negatively related with the recovery indices and the relative resilience indices, whereas the recovery indices show a significant positive correlation with the relative resilience indices. This may result from a trade-off between resistance to drought and recovery after drought disturbance. This trade-off could occur in the forest trees if both resistance and recovery depend on the stored reserves of trees [54]. If lower consumption of storage substances results in lower resistance during the drought event, the occurrence of recovery could not benefit from the reserves left in the trees [54]. Therefore, strong resistance could lead to weak recovery or vice-versa. Notably, the high correlation between these indices may partly be attributed to the computation of these indices from the same three variables. The computing method could thus influence their real relationships to some extent.
The stable indices of trees vary with increasing altitudes at Sidalong in the middle of the Qilian Mountains. In general, trees at higher altitudes have stronger resistance to disturbance and weaker recovery ability than trees at lower altitudes. Our previous study at Sidalong also found a similar phenomenon where the chronologies of trees at lower altitudes had higher standard deviations, mean sensitivities, mean correlations between all series, and signal to noise ratios than those at higher altitudes [47]. Similarly, in the Sierra Nevada (southeastern Spain), natural Pinus sylvestris resistance showed a positive relationship with altitude, whereas resilience showed a negative association with altitude [55]. A study in south-western Germany also showed that silver fir trees at high elevations have stronger resistance to drought than those at low elevations [28]. Resilience indices and relative resilience indices in our study area showed insignificant variation along the altitudinal gradient. It could thus be inferred that altitude is a factor influencing the trees’ response to drought disturbance to some extent. As a result, special attention should be given to trees at lower altitudes when less severe droughts occur, and to trees at higher altitudes when more severe droughts occur.
The resistance indices of early drought events were lower than those of the middle and late drought events, whereas the recovery indices of the early drought event were higher than those of the middle and late drought events. This phenomenon may be attributed to the different drought durations and drought intensities of the three drought events. The early drought and middle drought occurred in spring, whereas the late drought occurred in spring as well as in early summer. The intensity of the late drought was higher than that of early drought. This phenomenon indicated that trees there, i.e., at the lower altitudes in the middle of Qilian Mountains, had more difficulty recovering from more severe and longer drought events, especially the drought occurring in summer. A study in subtropical China found that a higher intensity and shorter-duration fast drought led to a faster decrease in the trees’ hydraulic and photosynthetic functions than a lower intensity and longer-duration slow drought [56]. Similarly, the higher intensity and longer duration late drought harmed the radial growth more seriously than the other two droughts in this study. Furthermore, another study on the trees’ ability to cope with droughts found that extreme droughts during the dry season had stronger effects on recovery ability than did droughts during the wet season at the global scale [29], indicating that the season when drought occurred was also essential to the trees’ coping ability. Therefore, the intensity, duration, and timing of the drought are all factors affecting the responses of trees to drought events.

5. Conclusions

This study explores the influence of moisture gradient, altitude, and different drought events on trees’ ability to cope with drought. Trees in the wetter east have higher resistance indices and lower recovery indices, resilience indices, and relative resilience indices than those in the drier west of the Qilian Mountains, which is in accord with our hypothesis. For trees below 3000 m a.s.l., trees with high resistance capacity usually have low recovery capacity and low relative resilience capacity. Trees at higher altitudes showed stronger resistance to and weaker ability to recover from drought events than those at lower altitudes in the middle of the Qilian Mountains. The intensity and timing of the drought was also a major factor influencing the response of a tree to the drought event. The more severe and longer drought events harm the radial growth more. Global warming tends to cause more frequent and severe extreme drought events. As a result, special attention and protection should be given to trees in the western region and at lower altitudes in the Qilian Mountains to enhance their resistance to extreme droughts. Under extremely severe droughts, trees in the eastern region and at higher altitudes are less able to recover from harm, which should be taken into account in forest management strategies.

Supplementary Materials

The following are available online at https://www.mdpi.com/1999-4907/10/9/817/s1, Figure S1: The de Martonne Index (a), the total annual precipitation (b), and mean annual temperature (c) from 1959–2013 in the Qilian Mountains, Figure S2: The relationships between the resilience indices (a: Resistance, b: Recovery, c: Resilience, d: Relative resilience) and altitudes reflected by the linear fitting or polynomial fitting, Table S1: The information of point years at each site.

Author Contributions

L.Z. and X.Z. were responsible for the research design and for coordinating the editing of the paper. Data collection and analyses were partitioned as follows: Site inventory and sampling (H.L., Y.R., and K.W.), tree-ring width measurement (L.Z.), tree-ring growth and climate relationship analysis (L.Z. and H.L.). L.Z. and X.L. contributed to editing and reviewing the manuscript.

Funding

This research was funded by the National Natural Science Foundation of China (grant number 41801024 and 41807431); the China Postdoctoral Science Foundation (2018M640946); the Shaanxi Province Postdoctoral Science Foundation of China (2018BSHEDZZ30); and the Fundamental Research Funds for the Central Universities (GK201801007 and GK201803050).

Acknowledgments

The authors would like to thank Huhu Kang, Guobao Xu, and Wenzhi Wang for sampling the tree-ring cores.

Conflicts of Interest

The authors declare no conflict of interest.

References

  1. Wu, X.C.; Liu, H.Y.; Li, X.Y.; Ciais, P.; Babst, F.; Guo, W.; Zhang, C.; Magliulo, V.; Pavelka, M.; Liu, S. Differentiating drought legacy effects on vegetation growth over the temperate Northern Hemisphere. Glob. Chang. Biol. 2018, 24, 504–516. [Google Scholar] [CrossRef] [PubMed]
  2. Greve, P.; Orlowsky, B.; Mueller, B.; Sheffield, J.; Reichstein, M.; Seneviratne, S.I. Corrigendum: Global assessment of trends in wetting and drying over land. Nat. Geosci. 2014, 7, 848. [Google Scholar] [CrossRef]
  3. Trenberth, K.E.; Dai, A.; Schrier, G.V.D.; Jones, P.D.; Barichivich, J.; Briffa, K.R.; Sheffield, J. Global warming and changes in drought. Nat. Clim. Chang. 2013, 4, 17–22. [Google Scholar] [CrossRef]
  4. Novick, K.A.; Ficklin, D.L.; Stoy, P.C.; Williams, C.A.; Bohrer, G.; Oishi, A.C.; Papuga, S.A.; Blanken, P.D.; Noormets, A.; Sulman, B.N. The increasing importance of atmospheric demand for ecosystem water and carbon fluxes. Nat. Clim. Chang. 2016, 6, 1023–1027. [Google Scholar] [CrossRef] [Green Version]
  5. Dai, A. Increasing drought under global warming in observations and models. Nat. Clim. Chang. 2013, 3, 52–58. [Google Scholar] [CrossRef]
  6. Vicente-Serrano, S.M.; Camarero, J.J.; Azorin-Molina, C. Diverse responses of forest growth to drought time-scales in the Northern Hemisphere. Global. Ecol. Biogeogr. 2015, 23, 1019–1030. [Google Scholar] [CrossRef]
  7. Mcdowell, N.; Pockman, W.T.; Allen, C.D.; Breshears, D.D.; Kolb, T.; Plaut, J.; Sperry, J.; West, A.; Williams, D.G.; Yepez, E.A. Mechanisms of plant survival and mortality during drought: Why do some plants survive while others succumb to drought? New Phytol. 2016, 178, 719–739. [Google Scholar] [CrossRef] [PubMed]
  8. Vacchiano, G.; Mondino, E.B.; Motta, R. Evidences of drought stress as a predisposing factor to Scots pine decline in Valle d’Aosta (Italy). Eur. J. For. Res. 2012, 131, 989–1000. [Google Scholar] [CrossRef]
  9. Merlin, M.; Perot, T.; Perret, S.; Korboulewsky, N.; Vallet, P. Effects of stand composition and tree size on resistance and resilience to drought in sessile oak and Scots pine. For. Ecol. Manag. 2015, 339, 22–33. [Google Scholar] [CrossRef] [Green Version]
  10. Barbeta, A.; Mejía Chang, M.; Ogaya, R.; Voltas, J.; Todd, E.D.; Penuelas, J. The combined effects of a long-term experimental drought and an extreme drought on the use of plant-water sources in a Mediterranean forest. Glob. Chang. Biol. 2015, 21, 1213–1225. [Google Scholar] [CrossRef]
  11. Anderegg, W.R.; Schwalm, C.; Biondi, F.; Camarero, J.J.; Koch, G.; Litvak, M.; Ogle, K.; Shaw, J.D.; Shevliakova, E.; Williams, A.P. Pervasive drought legacies in forest ecosystems and their implications for carbon cycle models. Science 2015, 349, 528–532. [Google Scholar] [CrossRef] [PubMed] [Green Version]
  12. Grimm, V.; Wissel, C. Babel, or the ecological stability discussions: An inventory and analysis of terminology and a guide for avoiding confusion. Oecologia 1997, 109, 323–334. [Google Scholar] [CrossRef] [PubMed]
  13. Grossiord, C.; Granier, A.; Ratcliffe, S.; Bouriaud, O.; Bruelheide, H.; Chećko, E.; Forrester, D.I.; Dawud, S.M.; Finér, L.; Pollastrini, M. Tree diversity does not always improve resistance of forest ecosystems to drought. Proc. Natl. Acad. Sci. USA 2014, 111, 14812–14815. [Google Scholar] [CrossRef] [PubMed] [Green Version]
  14. Gazol, A.; Camarero, J.J.; Gutiérrez, E.; Popa, I.; Andreu-Hayles, L.; Motta, R.; Nola, P.; Ribas, M.; Sangüesa-Barreda, G.; Urbinati, C. Distinct effects of climate warming on populations of silver fir (Abies alba) across Europe. J. Biogeogr. 2015, 42, 1150–1162. [Google Scholar] [CrossRef]
  15. Pasho, E.; Camarero, J.J.; De, L.M.; Vicenteserrano, S.M. Spatial variability in large-scale and regional atmospheric drivers of Pinus halepensis growth in eastern Spain. Agric. For. Meteorol. 2011, 151, 1106–1119. [Google Scholar] [CrossRef]
  16. Subedi, N.; Sharma, M. Climate-diameter growth relationships of black spruce and jack pine trees in boreal Ontario, Canada. Glob. Chang. Biol. 2013, 19, 505–516. [Google Scholar] [CrossRef] [PubMed]
  17. Deslauriers, A.; Beaulieu, M.; Balducci, L.; Giovannelli, A.; Gagnon, M.J.; Rossi, S. Impact of warming and drought on carbon balance related to wood formation in black spruce. Ann. Bot. Lond. 2014, 114, 335–345. [Google Scholar] [CrossRef] [Green Version]
  18. Wu, X.C.; Liu, H.Y.; Wang, Y.F.; Deng, M.H. Prolonged limitation of tree growth due to warmer spring in semi-arid mountain forests of Tianshan, northwest China. Environ. Res. Lett. 2013, 8, 024016. [Google Scholar] [CrossRef] [Green Version]
  19. Herrero, A.; Rigling, A.; Zamora, R. Varying climate sensitivity at the dry distribution edge of Pinus sylvestris and P. nigra. For. Ecol. Manag. 2013, 308, 50–61. [Google Scholar] [CrossRef]
  20. Allen, C.D.; Breshears, D.D.; Mcdowell, N.G. On underestimation of global vulnerability to tree mortality and forest die-off from hotter drought in the Anthropocene. Ecosphere 2015, 6, 1–55. [Google Scholar] [CrossRef]
  21. Chen, H.Y.H.; Yong, L. Net aboveground biomass declines of four major forest types with forest ageing and climate change in western Canada’s boreal forests. Glob. Chang. Biol. 2015, 21, 3675–3684. [Google Scholar] [CrossRef] [PubMed]
  22. Liu, H.; Williams, A.P.; Allen, C.D.; Guo, D.; Wu, X.; Anenkhonov, O.A.; Liang, E.; Sandanov, D.V.; Yin, Y.; Qi, Z. Rapid warming accelerates tree growth decline in semi-arid forests of Inner Asia. Glob. Chang. Biol. 2013, 19, 2500–2510. [Google Scholar] [CrossRef] [PubMed]
  23. Gazol, A.; Camarero, J.J.; Anderegg, W.R.L.; Vicente-Serrano, S.M. Impacts of droughts on the growth resilience of Northern Hemisphere forests. Global. Ecol. Biogeogr. 2017, 26, 166–176. [Google Scholar] [CrossRef]
  24. Gazol, A.; Ribas, M.; Gutiérrez, E.; Camarero, J.J. Aleppo pine forests from across Spain show drought-induced growth decline and partial recovery. Agric. For. Meteorol. 2017, 232, 186–194. [Google Scholar] [CrossRef]
  25. Candel-Perez, D.; Linares, J.C.; Vinegla, B.; Lucas-Borja, M.E. Assessing climate-growth relationships under contrasting stands of co-occurring Iberian pines along an altitudinal gradient. For. Ecol. Manag. 2012, 274, 48–57. [Google Scholar] [CrossRef]
  26. Carlos Linares, J.; Antonio Tiscar, P. Climate change impacts and vulnerability of the southern populations of Pinus nigra subsp salzmannii. Tree Physiol. 2010, 30, 795–806. [Google Scholar] [CrossRef] [PubMed]
  27. Yang, B.; He, M.H.; Melvin, T.M.; Zhao, Y.; Briffa, K.R. Climate control on tree growth at the upper and lower treelines: A case study in the Qilian Mountains, Tibetan Plateau. PLoS ONE 2013, 8, e690657. [Google Scholar] [CrossRef]
  28. Vitali, V.; Büntgen, U.; Bauhus, J. Silver fir and Douglas fir are more tolerant to extreme droughts than Norway spruce in south-western Germany. Glob. Chang. Biol. 2017, 23, 5108–5119. [Google Scholar] [CrossRef]
  29. Huang, M.; Wang, X.; Keenan, T.F.; Piao, S. Drought timing influences the legacy of tree growth recovery. Glob. Chang. Biol. 2018, 24, 3546–3559. [Google Scholar] [CrossRef] [Green Version]
  30. Zheng, D. The system of physico-geographical regions of the Qinghai-Xizang (Tibet) Plateau. Sci. China (Ser. D) 1996, 39, 410–417. [Google Scholar] [CrossRef]
  31. Liu, X.C. Picea Crassifolia; Lanzhou University Press: Lanzhou, China, 1992. (In Chinese) [Google Scholar]
  32. Chen, F.; Yuan, Y.J.; Wei, W.S.; Zhang, R.B.; Yu, S.L.; Shang, H.M.; Zhang, T.W.; Qin, L.; Wang, H.Q.; Chen, F.H. Tree-ring-based annual precipitation reconstruction for the Hexi Corridor, NW China: Consequences for climate history on and beyond the mid-latitude Asian continent. Boreas 2013, 42, 1008–1021. [Google Scholar] [CrossRef]
  33. Chen, F.; Yuan, Y.J.; Wei, W.S.; Yu, S.L.; Fan, Z.A.; Zhang, R.B.; Zhang, T.W.; Li, Q.; Shang, H.M. Temperature reconstruction from tree-ring maximum latewood density of Qinghai spruce in middle Hexi Corridor, China. Theor. Appl. Climatol. 2012, 107, 633–643. [Google Scholar] [CrossRef]
  34. Liang, E.Y.; Shao, X.M.; Liu, X.H. Annual precipitation variation inferred from tree rings since AD 1770 for the western Qilian Mts., Northern Tibetan Plateau. Tree-Ring Res. 2009, 65, 95–103. [Google Scholar] [CrossRef]
  35. Gao, L.; Gou, X.; Deng, Y.; Yang, M.; Zhang, F. Assessing the influences of tree species, elevation and climate on tree-ring growth in the Qilian Mountains of northwest China. Trees-Struct. Funct. 2017, 31, 393–404. [Google Scholar] [CrossRef]
  36. Tian, Q.; He, Z.; Xiao, S.; Peng, X.; Ding, A.; Lin, P. Response of stem radial growth of Qinghai spruce (Picea crassifolia) to environmental factors in the Qilian Mountains of China. Dendrochronologia 2017, 44, 76–83. [Google Scholar] [CrossRef]
  37. Gao, L.; Gou, X.; Deng, Y.; Wang, Z.; Gu, F.; Wang, F. Increased growth of Qinghai spruce in northwestern China during the recent warming hiatus. Agric. For. Meteorol. 2018, 260–261, 9–16. [Google Scholar] [CrossRef]
  38. Liu, Z.; Zhou, P.; Zhang, F.; Liu, X.; Chen, G. Spatiotemporal characteristics of dryness/wetness conditions across Qinghai Province, Northwest China. Agric. For. Meteorol. 2013, 182–183, 101–108. [Google Scholar] [CrossRef]
  39. Liang, E.Y.; Shao, X.M.; Eckstein, D.; Huang, L.; Liu, X.H. Topography- and species-dependent growth responses of Sabina przewalskii and Picea crassifolia to climate on the northeast Tibetan Plateau. For. Ecol. Manag. 2006, 236, 268–277. [Google Scholar] [CrossRef]
  40. Liang, E.Y.; Shao, X.M.; Eckstein, D.; Liu, X.H. Spatial variability of tree growth along a latitudinal transect in the Qilian Mountains, northeastern Tibetan Plateau. Can. J. For. Res. 2010, 40, 200–211. [Google Scholar] [CrossRef]
  41. Li, D.L.; Liu, D.X. Climate in Gansu; China Meteorological Press: Beijing, China, 2000. [Google Scholar]
  42. Tang, X.; Sun, G.W.; Qian, W.H. Study on the Northernmost Boundary of East-Asian Summer Monsoon; China Meteorological Press: Beijing, China, 2007. [Google Scholar]
  43. Cook, E.R.; Kairiukstis, L.A. Methods of Dendrochronology: Applications in the Environmental Sciences; Springer: Berlin/Heidelberg, Germany, 1990. [Google Scholar] [CrossRef]
  44. Fritts, H. Tree Rings and Climate; Elsevier: Amsterdam, The Netherlands, 2012. [Google Scholar]
  45. Rinn, F. TSAPWin: Time Series Analysis and Presentation for Dendrochronology and Related Applications; Rinntech: Heidelberg, Germany, 2003. [Google Scholar]
  46. Holmes, R.L. Computer-assisted quality control in tree-ring dating and measurement. Tree-Ring Bull. 1983, 43, 69–78. [Google Scholar] [CrossRef]
  47. Zhang, L.; Jiang, Y.; Zhao, S.; Kang, X.; Zhang, W.; Liu, T. Lingering response of radial growth of Picea crassifolia to climate at different altitudes in the Qilian Mountains, Northwest China. Trees-Struct. Funct. 2017, 31, 455–465. [Google Scholar] [CrossRef]
  48. Lebourgeois, F.; Breda, N.; Ulrich, E.; Granier, A. Climate-tree-growth relationships of European beech (Fagus sylvatica L.) in the French Permanent Plot Network (RENECOFOR). Trees-Struct. Funct. 2005, 19, 385–401. [Google Scholar] [CrossRef]
  49. Neuwirth, B.; Schweingruber, F.H.; Winiger, M. Spatial patterns of central European pointer years from 1901 to 1971. Dendrochronologia 2007, 24, 79–89. [Google Scholar] [CrossRef]
  50. Maaten-Theunissen, M.V.D.; Maaten, E.V.D.; Bouriaud, O. pointRes: An R package to analyze pointer years and components of resilience. Dendrochronologia 2015, 35, 34–38. [Google Scholar] [CrossRef]
  51. Lloret, F.; Keeling, E.G.; Sala, A. Components of tree resilience: Effects of successive low-growth episodes in old ponderosa pine forests. Oikos 2011, 120, 1909–1920. [Google Scholar] [CrossRef]
  52. Cavin, L.; Jump, A.S. Highest drought sensitivity and lowest resistance to growth suppression are found in the range core of the tree Fagus sylvatica L. not the equatorial range edge. Glob. Chang. Biol. 2017, 23, 362–379. [Google Scholar] [CrossRef] [PubMed]
  53. Zhang, L.; Jiang, Y.; Zhao, S.; Jiao, L.; Wen, Y. Relationships between tree age and climate sensitivity of radial growth in different drought conditions of Qilian Mountains, northwestern China. Forests 2018, 9, 135. [Google Scholar] [CrossRef]
  54. Galiano, L.; Martínez-Vilalta, J.; Lloret, F. Carbon reserves and canopy defoliation determine the recovery of Scots pine 4 yr after a drought episode. New Phytol. 2011, 190, 750–759. [Google Scholar] [CrossRef]
  55. Rubio-Cuadrado, Á.; Camarero, J.J.; Aspizua, R.; Sánchez-González, M.; Gil, L.; Montes, F. Abiotic factors modulate post-drought growth resilience of Scots pine plantations and rear-edge Scots pine and oak forests. Dendrochronologia 2018, 51, 54–65. [Google Scholar] [CrossRef] [Green Version]
  56. Duan, H.; Li, Y.; Xu, Y.; Zhou, S.; Liu, J.; Tissue, D.T.; Liu, J. Contrasting drought sensitivity and post-drought resilience among three co-occurring tree species in subtropical China. Agric. For. Meteorol. 2019, 272, 55–68. [Google Scholar] [CrossRef]
Figure 1. Locations of the sampling regions and nearest meteorological stations in the study area (the Qilian Mountains).
Forests 10 00817 g001
Figure 2. The relationships between the annual de Martonne aridity index and total annual precipitation (a) and mean annual temperature (b) for the sites below 3000 m a.s.l.
Forests 10 00817 g002
Figure 3. The relationships between the annual de Martonne aridity index and total annual precipitation (a) and mean annual temperature (b) for the sites in the middle of the Qilian Mountains.
Forests 10 00817 g003
Figure 4. Growth patterns presented by the mean basal area increment (BAI) and the corresponding de Martonne aridity index (Idm) at TLG1 (a), TLG2 (b), SDL1 (c), SDL2 (d), SDL3 (e), SDL4 (f), LCH1 (g), LCH2 (h) and QKD (i) (the radial growth in different moisture conditions usually differ with each other significantly. In order to highlight the extreme low values better, we set different BAI scales in the sub-figures). TLG1 (Tulugou), TLG2, SDL1 (Sidalong), SDL2, SDL3, SDL4, LCH1 (Longchanghe), LCH2, and QKD (Qingkedi) refer to the different sampling sites shown in Table 1.
Forests 10 00817 g004aForests 10 00817 g004bForests 10 00817 g004c
Figure 5. The regional differences in stable indices ((a): Resistance; (b): Recovery; (c): Resilience, (d): Relative resilience) indicated by ANOVA analysis. The different letters above the boxes indicate significant differences between the two boxes, the same letter indicates insignificant difference. TLG1, TLG2, SDL3, SDL4, LCH1, LCH2, and QKD refer to the different sampling sites shown in Table 1.
Forests 10 00817 g005
Figure 6. The linear relationships between the stable indices ((a): Resistance, (b): Recovery, (c): Resilience, (d): Relative resilience) and the annual de Martonne aridity index.
Forests 10 00817 g006aForests 10 00817 g006b
Figure 7. Relationships between resistance indices and recovery indices (a), between resistance indices and relative resilience indices (b), and between recovery indices and relative resilience indices (c) at a regional scale. The black line is the fitted line with 95% confidence interval (grey part).
Forests 10 00817 g007
Figure 8. The altitudinal differences in stable indices ((a): Resistance; (b): Recovery; (c): Resilience, (d): Relative resilience) for the early drought event indicated by ANOVA analysis. The different letters above the boxes indicate significant differences between the two boxes, the same letter indicates an insignificant difference. SDL1, SDL2, SDL3, and SDL4 refer to the different sampling sites shown in Table 1.
Forests 10 00817 g008
Figure 9. The differences in stable indices ((a): Resistance; (b): Recovery; (c): Resilience, (d): Relative resilience) at SDL3 and SDL4 for the early drought event, middle drought event, and late drought event indicated by ANOVA analysis. The different letters above the boxes indicate significant differences between the two boxes, the same letter indicates insignificant difference. The time period of the early drought is 1971, middle drought is 1995, late drought is 2001.
Forests 10 00817 g009
Figure 10. The differences between the average values of the de Martonne aridity index at SDL3 and SDL4 (the different sampling sites are shown in Table 1) in the drought years and the value of 30. The time period of the early drought is 1971, middle drought is 1995, late drought is 2001.
Forests 10 00817 g010
Table 1. Summary of the sampling sites along the gradient of Qilian Mountains.
SitesAltitude (m a.s.l.)Latitude (°N)Longitude (E°)Slope (°)AspectNo. of TreesNearest Meteorological Stations
TLG1292236.70102.6930north26Wushaoling, Minhe
TLG2280236.70102.7026north29Wushaoling, Minhe
SDL1320038.4399.9232northeast26Yeniugou, Qilian
SDL2300038.4399.9328northeast25Yeniugou, Qilian
SDL3278038.4499.9130northeast27Qilian
SDL4265038.4599.9127northeast28Qilian, Sunan
LCH1283738.8199.6826north27Yeniugou, Sunan
LCH2266038.8199.6724north26Yeniugou, Sunan
QKD292539.5398.0525north27Jiuquan, Tuole

