Article

Use of MODIS NDVI Products to Map Tree Mortality Levels in Forests Affected by Mountain Pine Beetle Outbreaks

by
Joseph P. Spruce
1,*,
Jeffrey A. Hicke
2,
William W. Hargrove
3,
Nancy E. Grulke
4 and
Arjan J. H. Meddens
5
1
Leidos, 88384 Diamondhead Dr E, Diamondhead, MS 39525, USA
2
Department of Geography, University of Idaho, Moscow, ID 83844, USA
3
USDA Forest Service, Eastern Forest Environmental Threat Assessment Center, Asheville, NC 28804, USA
4
USDA Forest Service, Western Wildland Environmental Threat Assessment Center, Prineville, OR 97754, USA
5
Department of Natural Resources and Society, University of Idaho, Moscow, ID 83844, USA
*
Author to whom correspondence should be addressed.
Forests 2019, 10(9), 811; https://doi.org/10.3390/f10090811
Submission received: 19 July 2019 / Revised: 6 September 2019 / Accepted: 11 September 2019 / Published: 17 September 2019
(This article belongs to the Special Issue Dieback on Drought-Prone Forest Ecosystems)

Abstract

:
Extensive bark beetle outbreaks have recently occurred in western North American forests, resulting in overstory tree mortality across millions of hectares. Annual aerial surveys are currently used to operationally monitor bark beetle induced tree mortality, though this method is subjective and can exclude some forest areas. Daily Moderate Resolution Imaging Spectroradiometer (MODIS) satellite data offer a potential alternative means to develop regional tree mortality maps. Accurate methods using such data could aid natural resource managers in surveys of forests with frequent overstory mortality, helping to prioritize forest treatment and restoration activities. This paper discusses a study to test the potential of using MODIS data to detect tree mortality. We developed and tested an approach to use 250-m resolution MODIS Normalized Difference Vegetation Index (NDVI) data products collected during a mountain pine beetle (MPB) outbreak and related tree mortality event in the northern Rocky Mountains of Colorado, USA. The 94 km2 study area is predominantly lodgepole pine forest with most of the MPB-caused mortality occurring between 2003 and 2008. We used a 2.4-m forest conditions map from 2008 aerial multispectral imagery to calculate percentage of mortality within 240-m pixels for use as reference data. Using either daily or 16-day products, MODIS NDVI change products were calculated for 2008 versus either 2000 or 2003 baselines. MODIS change products were used as predictors in linear regression analysis to assess correlation between MODIS data and the aerial percent forest mortality map. Depending on the MODIS product, linear regression analyses yielded r2 values ranging from 0.362 to 0.544 without outliers removed and from 0.406 to 0.570 with extreme outliers removed. Daily MODIS NDVI products from 2003 and 2008 were used with exponential regression to improve the r2 to 0.593. The project showed some MODIS NDVI data potential for mapping percent tree mortality in forests subjected to regional bark beetle outbreaks and severe drought.

1. Introduction

1.1. Statement of Problem

Over the last two decades, bark beetle outbreaks have resulted in high mortality in coniferous forests across millions of hectares in the western US [1]. During this time, bark beetle populations erupted, exceeding the frequencies, impacts, and geographic ranges noted in the past 125 years of records [2]. In particular, the mountain pine beetles (MPB; Dendroctonus ponderosae Hopkins) (Coleoptera: Scolytidae) have damaged millions of hectares of pine forest across many western US states and British Colombia [3]. MPB is considered the most destructive forest insect in western North America (Figure 1) [4,5,6]. Information on the location, extent, and severity of bark beetle damage is needed by entomologists, ecologists, and natural resource managers to help understand the impacts and occurrences of overstory tree mortality and to prioritize restoration activities for minimizing future outbreaks. Such information is especially important in areas near residential communities, as heavily impacted forest stands with frequent tree mortality can pose public safety hazards to people, infrastructure, forest management, and disaster (e.g., wildfire) management in the affected area [7,8].

1.2. Mapping US Forest Mortality with Aerial Insect and Disease Survey Data

For at least the last 20 years, the primary source of information on the location, severity, and extent of insect damage to forests in the US has been obtained through what is now known as the annual USDA Forest Service aerial Insect and Disease Survey (IDS) mapping products [9]. Previously known as Aerial Detection Survey (ADS) data, IDS products can include estimates of dead trees per acres for bark beetle-related forest mortality. Aerial surveys of disturbed forests have been used to depict areas with forest mortality caused by bark beetles [1,10] and used to assess bark beetle damage impacts on carbon stocks at broad regional scales [11,12]. IDS products have also been used as a reference data set in assessing other geospatial forest disturbance mapping products [13,14,15,16,17,18].
Because the information in the aerial surveys are subjectively gathered and recorded by human observers, these data have some uncertainty. Like electro-optical remote sensing data, IDS data collections can also be affected by impaired visibility from cloud cover, smoke, and haze [19]. Several studies assessed accuracy of IDS in estimating tree mortality, and found errors in both omission and commission, as well as locational errors compared to ground reference data [10,20,21]. The authors of [10] concluded that IDS forest mortality maps contain classification errors, though are still useful. When compared to fine-resolution airborne and satellite imagery, tree mortality from US aerial surveys was underestimated by factors of 3-20 [3]. A final issue that because of budget constraints, not all forested areas may be observed with an aerial IDS every year. While imperfect, IDS does provide basic annual information on the location, extent, severity, and causal agent for many forest disturbances in the United States (CONUS) that are not available otherwise [9].

1.3. Remote Sensing of Forest Mortality

Given the uncertainties and subjective nature of IDS regional maps of overstory tree mortality, remotely sensed imagery has the potential to complement such IDS products. Previous work has included efforts to apply high (i.e., fine), medium, and coarse spatial resolution multispectral remote sensing data sets to derive forest mortality maps. Fine and moderate spatial resolution aerial and satellite (e.g., QuickBird, Landsat) imagery with visible and near infrared multispectral bands has been used for detecting MPB forest mortality for various regional study areas [22,23,24,25,26,27,28]. While useful, such satellite data are not typically always available in cloud free form for broad regions on either an annual or seasonal basis at a time of year when insect-related forest disturbance can be easily detected. Acquisition cost can be another factor when it comes to procuring aerial and satellite image data, especially data acquired by commercial systems at high spatial resolutions (e.g., 5-m pixels or finer).
In contrast to sensors like QuickBird and Landsat, satellite imagery from the Moderate Resolution Imaging Spectroradiometer (MODIS) sensors offers advantages in terms of twice-daily data availability over broad areas (or processed to 8-day composites) and is available for free. MODIS data from two satellites, Terra and Aqua, together typically collect two images per day for most areas in the conterminous US at a 250-m spatial resolution for the red and near-infrared bands and provide time series of data on regional forest conditions from 2000 to present. This combination of spatial and temporal resolution has been used for detecting many regional forest disturbances [21,29,30,31] but may be more limited in its application to detect smaller, localized forest disturbances [20,32].
Different spectral vegetation indices from daily MODIS reflectance data have been used to detect regional forest defoliation from some insects [20,21,29,31]. The authors of [33] employed various spectral indices from 16-day composited MODIS MOD13 data to map forest mortality within pine plantations in Australia damaged by Ips bark beetles. In doing so, 231.7-m Normalized Difference Vegetation Index (NDVI), Normalized Difference Infrared Index (NDII), and Enhanced Vegetation Index (EVI) change products had relatively low r2 values with a 15-cm resolution aerial image-based map of tree mortality that was used as reference data. The use of the MOD13 NDVI data resulted in a r2 of 0.39 [33], although relatively few observations were used (n = 62). The authors of [33] also tested the influence of mixed pixels, which did not appear to affect r2 unless the pixels were less than 25 percent forested. Such mixed pixels were mitigated using a forest mask technique [33].
Despite its high potential, there have been only a few initial studies on the capability of using MODIS for monitoring regional forest mortality from MPB outbreaks. The authors of [26] generated a thematic map of forest mortality from a single date of MODIS multispectral data that yielded an overall accuracy of 78% compared to an accurate, field-checked 2.4-m forest mortality map derived from aerial imagery. A separate study [15] later generated a 2008 versus 2003 MODIS NDVI difference map depicting MPB mortality in Colorado that demonstrated visual agreement with IDS maps of MPB mortality for the same area.
Thus, there exists the need for more studies to assess additional methods using MODIS imagery to map MPB-caused overstory tree mortality. Consequently, we investigated the potential utility of MODIS for this application in two ways. First, given the coarse spatial resolution, we assessed the application of MODIS NDVI data in estimating percent mortality on a per pixel basis (i.e., depicting damage severity), not just classifying pixels as predominantly having mortality present or absent. Secondly, we assessed the potential of using time series of daily satellite remote sensing data (as opposed to 16-day temporally composted data) to supplement or complement IDS-based forest mortality mapping products.

2. Materials and Methods
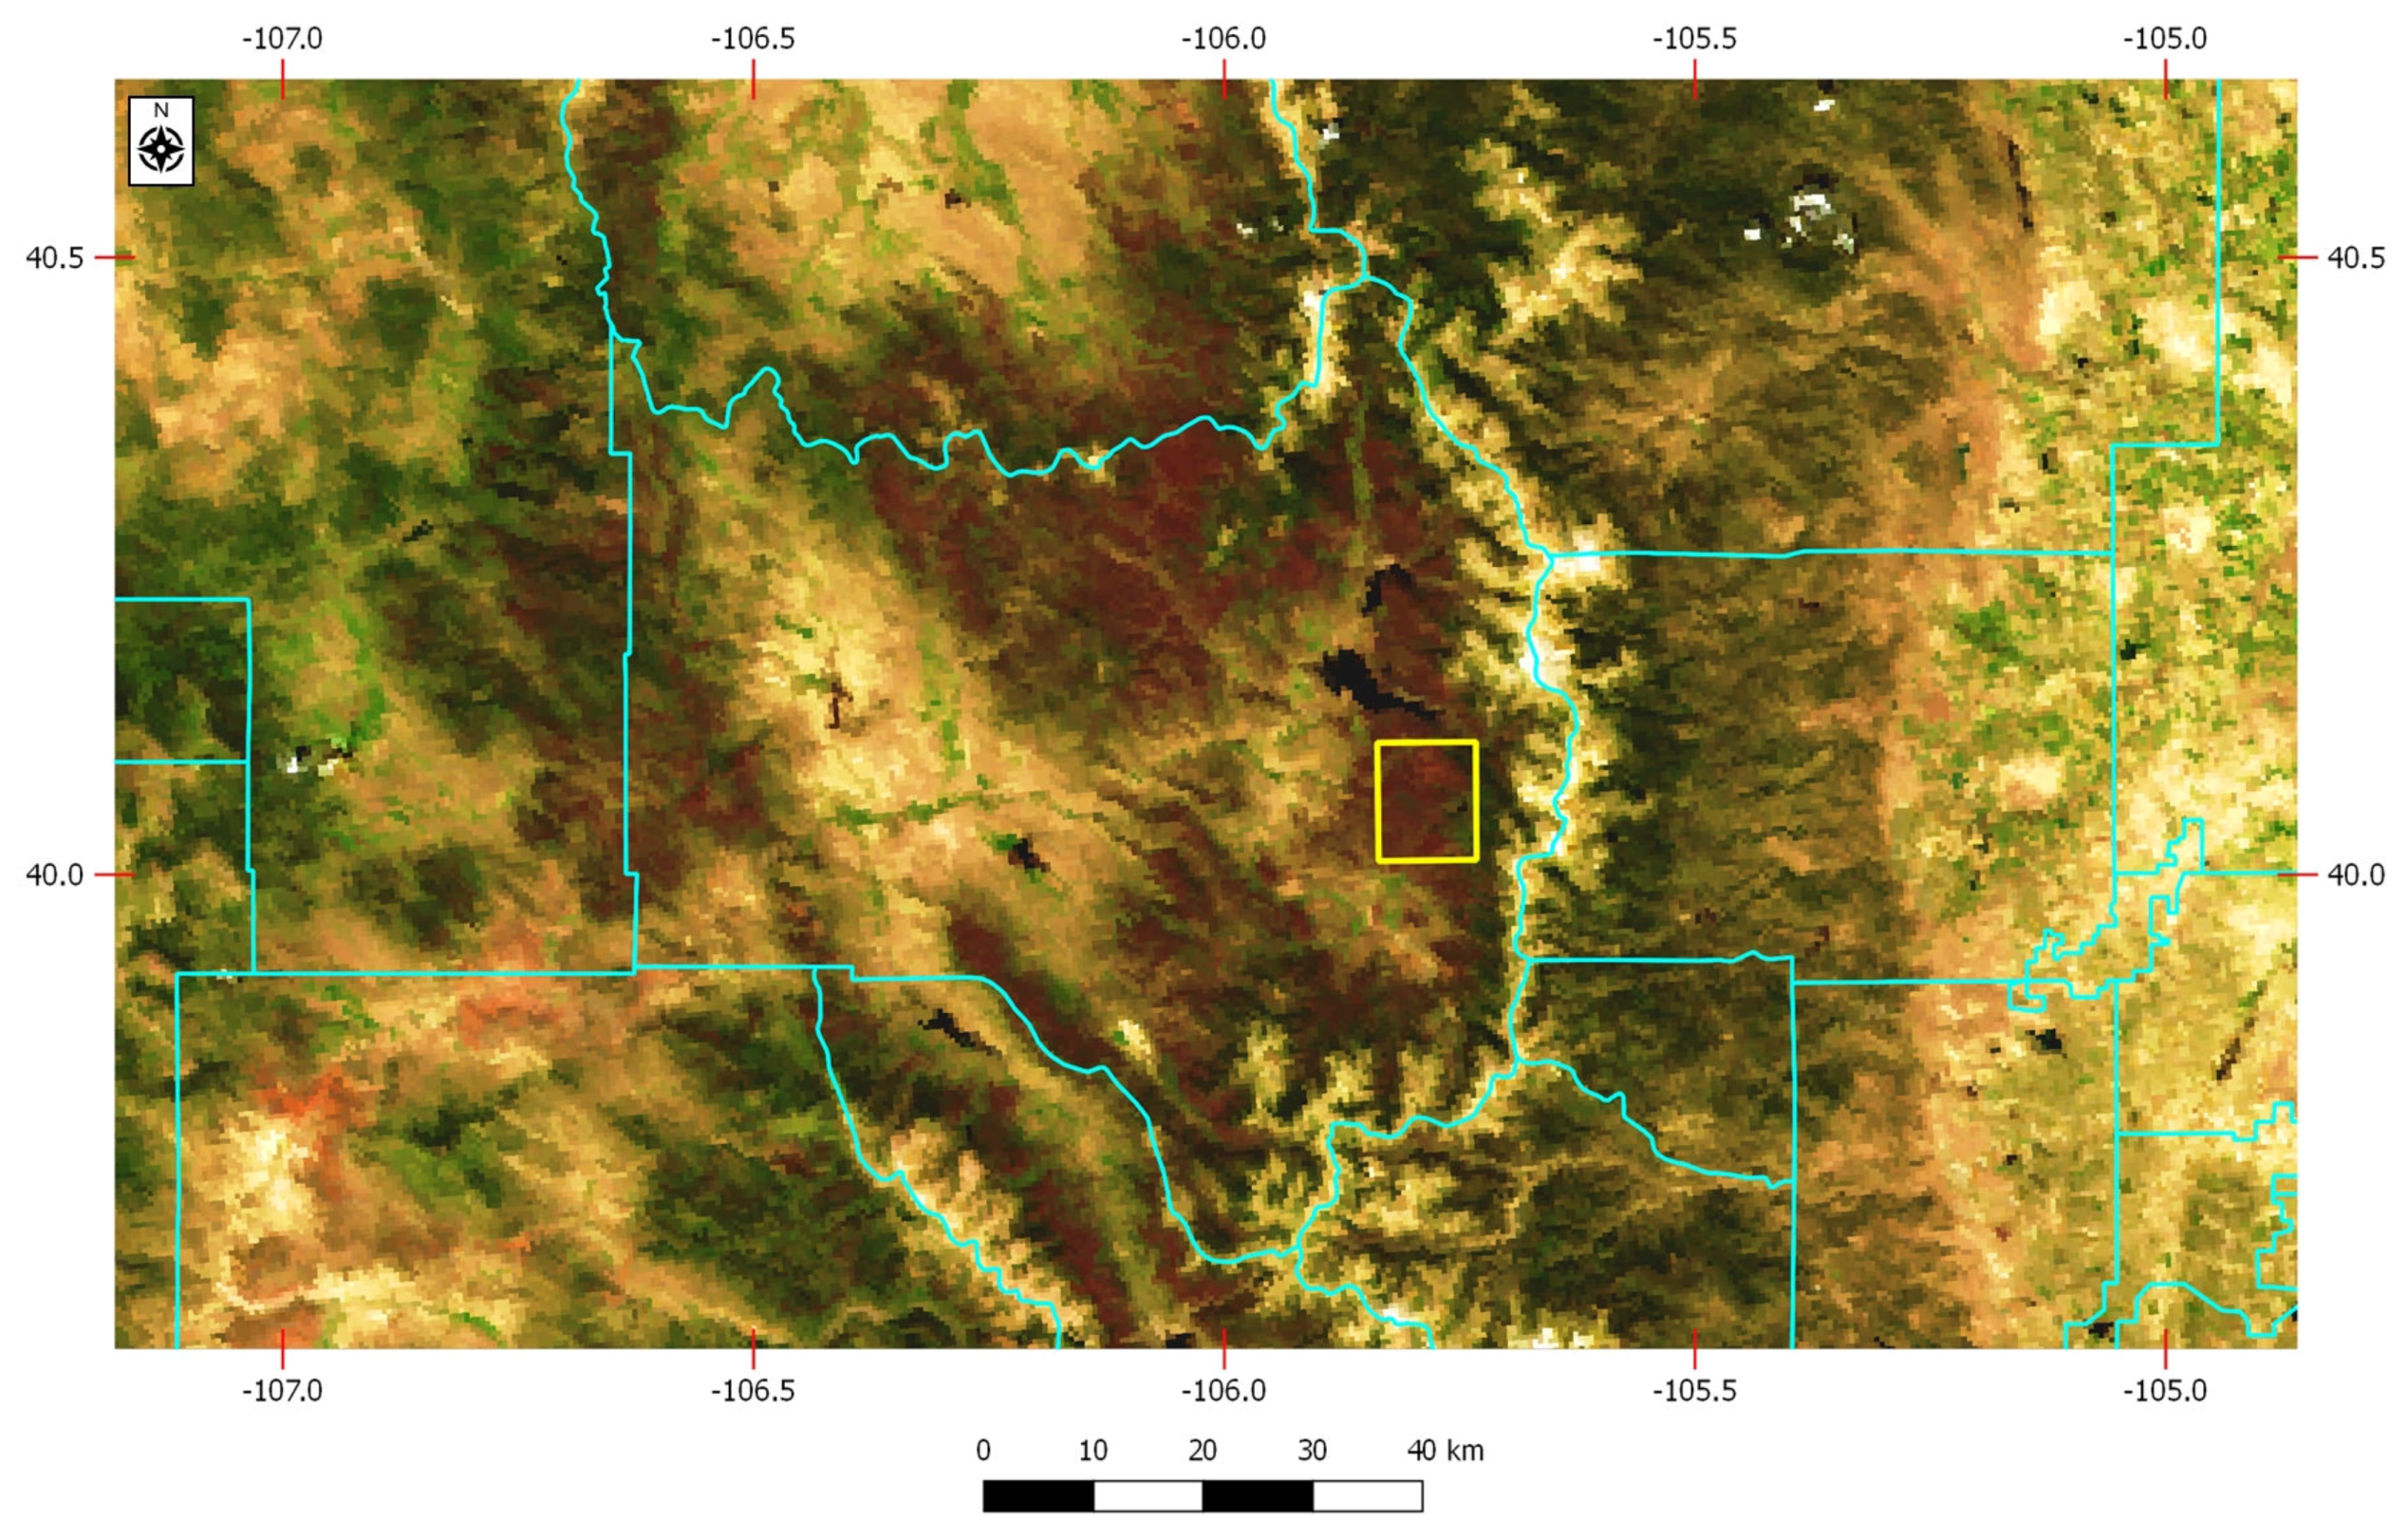
2.1. Study Area

The study area is in a portion of the Arapaho National Forest just west of the Continental Divide in the U.S. north-central Colorado Rocky Mountains that experienced a major outbreak of MPB causing extensive forest mortality (Figure 2). Located in Grand County, the study area bio-physical characteristics discussed herein are based on [34]. With elevations ranging from 2500 to 3400 m, this area includes extensive subalpine forest dominated by lodgepole pine (Pinus contorta Dougl. ex Loud.). Spruce-fir forest stands composed of Engelmann spruce (Picea engelmannii Parry ex Engelm) and subalpine fir (Abies lasiocarpa (Hook.) Nutt.) trees occur along riparian zones and at higher elevations. Herbaceous meadows occur in riparian areas, along with occasional water bodies. Some trembling aspen (Populus tremuloides Michx.) trees occur at intermediate elevations. The authors of [34] also report that the study area has an average annual precipitation of approximately 52 cm, and with mean minimum and maximum temperatures of −10.2 and 9.8 °C, respectively, based on Fraser, CO weather station data from [35].
The MPB outbreak in our study area began in the mid-1990s and accelerated after a multiyear drought occurred in the early years of the 21st century. This outbreak in conjunction with the drought led to much of the mature lodgepole pine west of the continental divide in northern Colorado being killed by August 2008, with dead red forest crowns frequent across the landscape and dead gray crowns also occurring [36]. The MPB-caused tree mortality was related in part to drought and higher temperatures [37,38,39] with the predominance of mature lodgepole pine forest as an additional important factor [39]. Drought in the region during 2001–2003 was noted as being severe by [39] based on Palmer Drought Severity Index data from NOAA. The 2002 drought for many areas in Colorado was particularly severe according to [40].

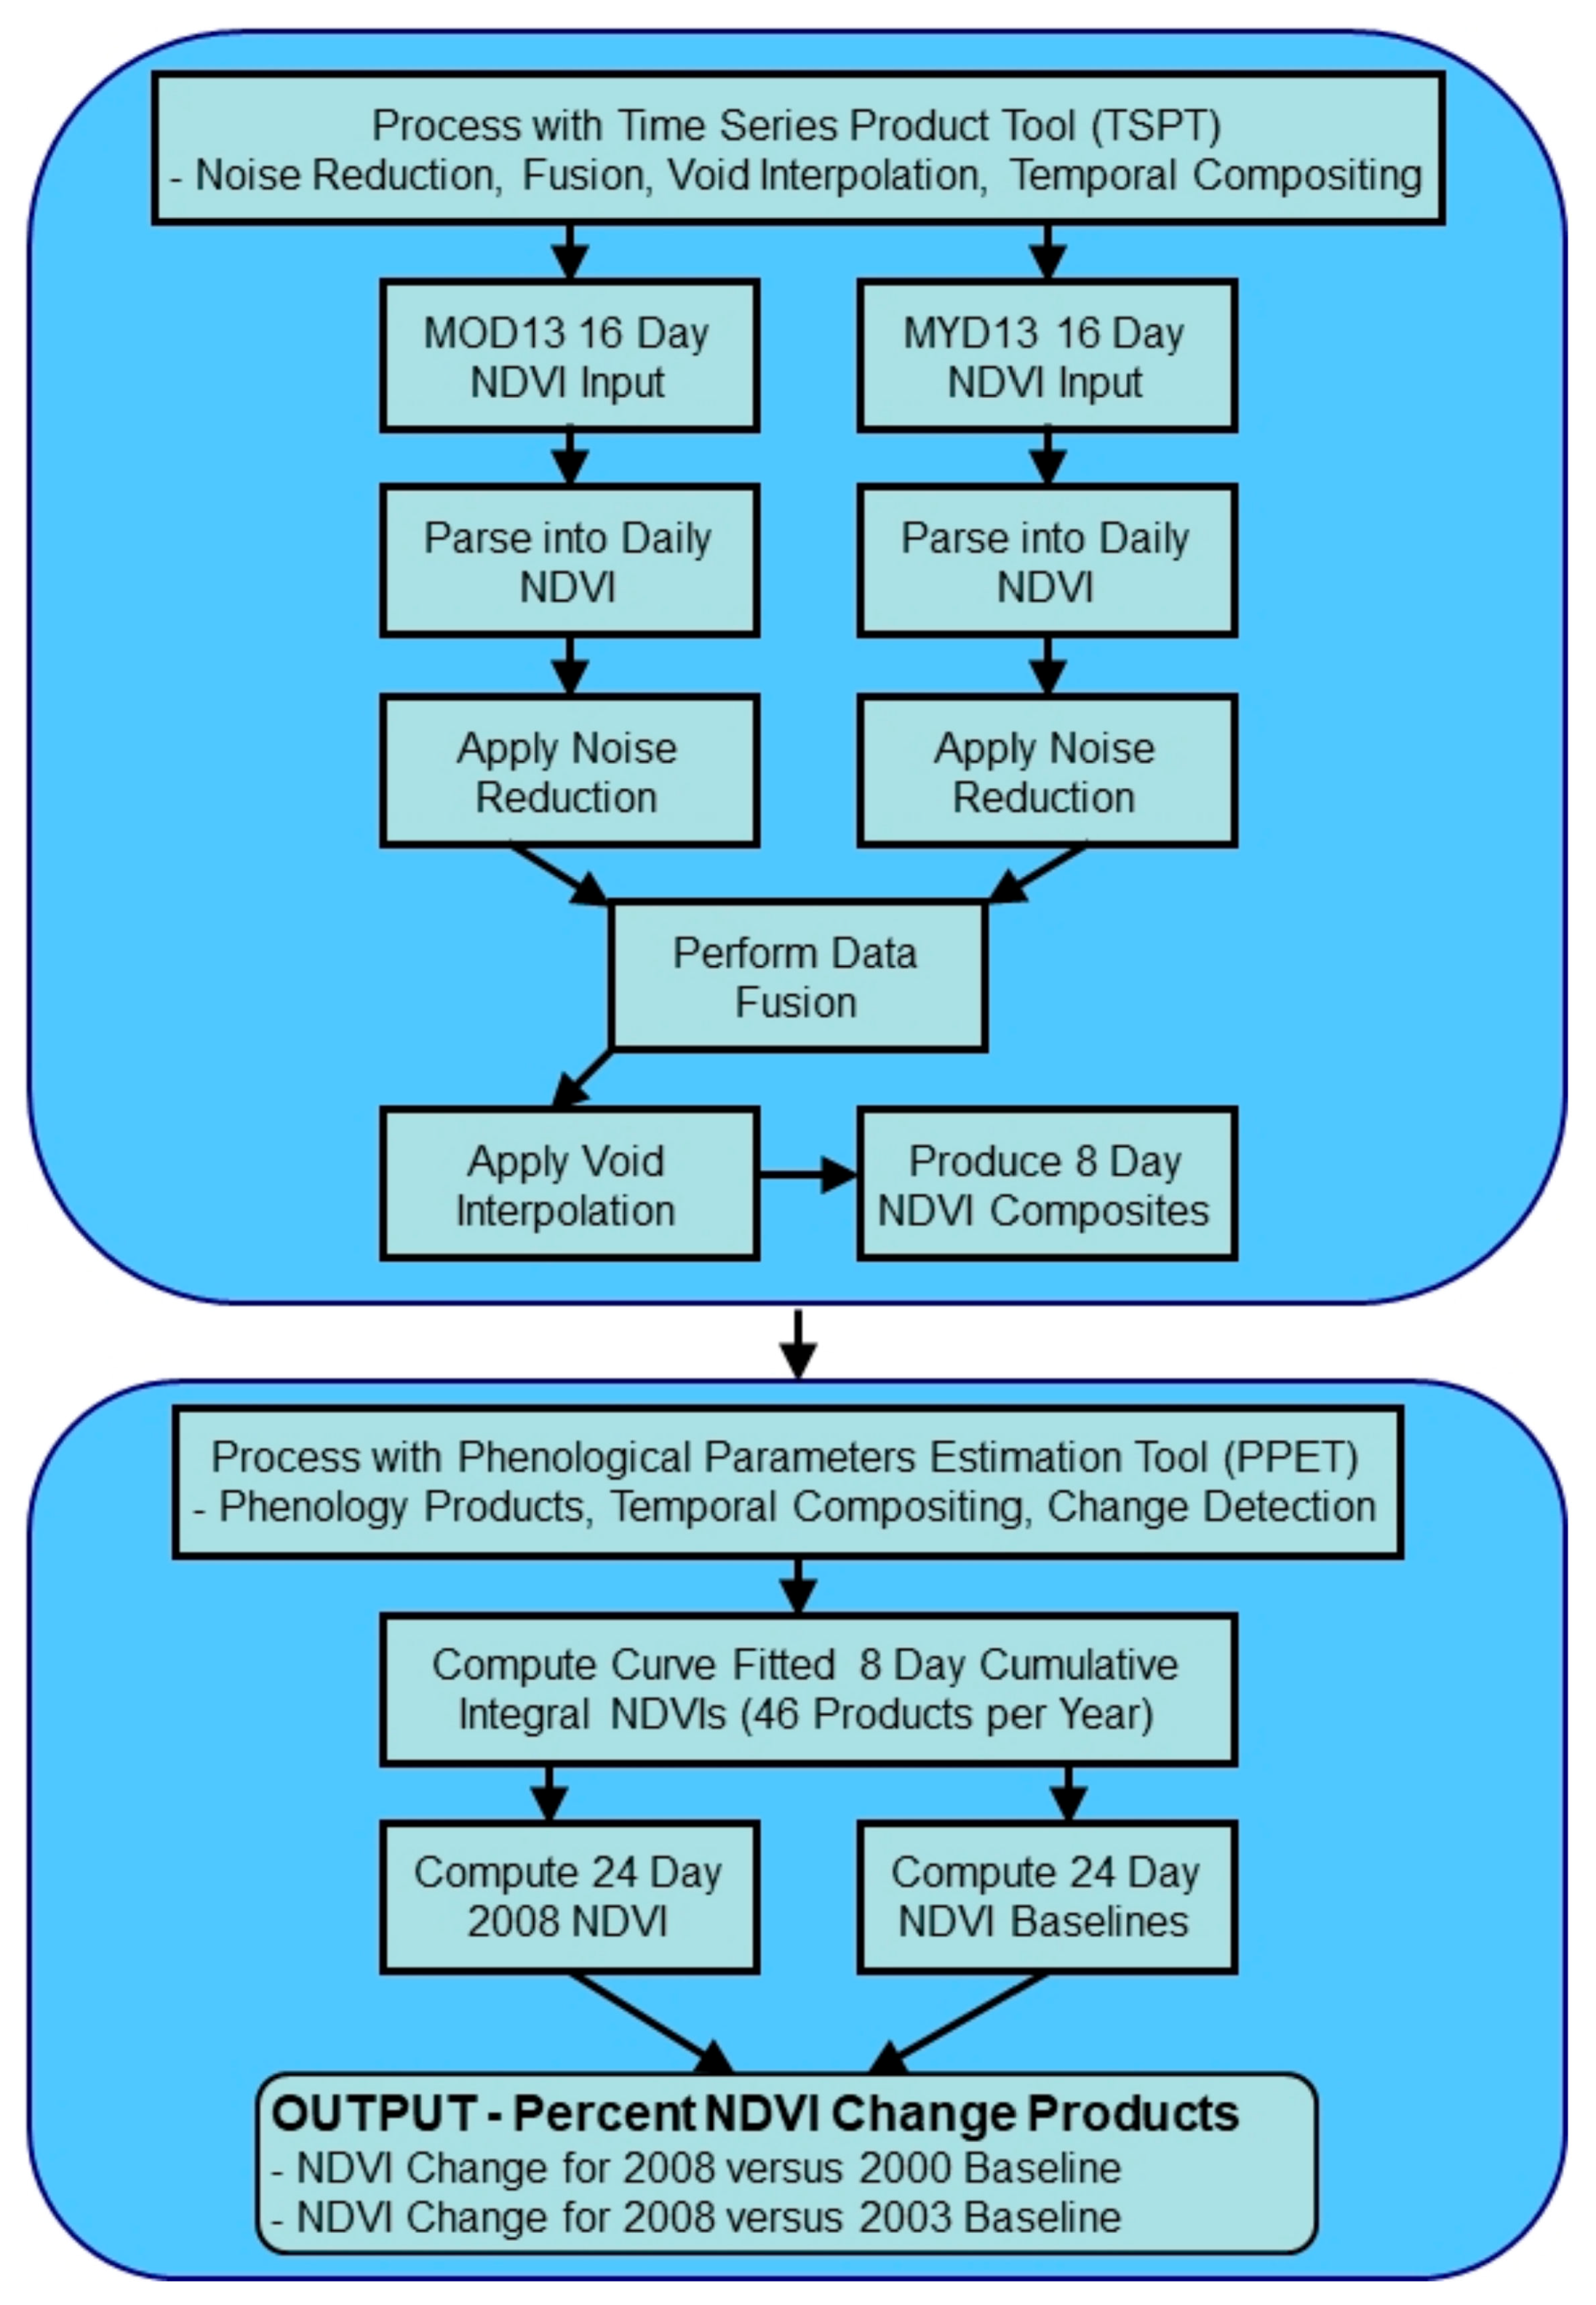
2.2. MODIS Data Preparation

For this study, we used Collection 5 MODIS satellite data products acquired from the USGS Land Processes Distributed Active Archive Center (LP DAAC), including 250-m 16-day NDVI MOD13 and MYD13 products, plus 250-m daily surface reflectance data from MOD09 and MYD09 products (Table 1). The acquired MODIS data sets were temporally processed for the mid to late summer period when MPB-caused mortality was highly distinct [19,41] and when cloud cover was less frequent [42]. This time of year was also similar to when our reference data were collected for the study area in the form of aerial imagery and field measurements. The MOD13 and MOD09 products used in the study were from the Terra satellite, while the MYD13 and MYD09 products were from the Aqua satellite. The 16-day MOD13/MYD13 NDVI products [43] were based on daily MOD09/MYD09 atmospherically corrected reflectance data [44]. The MOD13/MYD13 NDVI products were originally derived using a constrained view angle/NDVI maximum value compositing technique described by [43].

2.2.1. MOD13/MYD13 Data

MOD13 Terra and MYD13 Aqua NDVI data were temporally processed into annual NDVI time series using two custom software packages known as the Time Series Product Tool (TSPT) [21,45,46,47] and the Phenological Parameters Estimation Tool (PPET) [48,49]. The authors of [29] provide a description of CONUS vegetation phenology products output by PPET. For this project, TSPT was used to perform most of the temporal processing of the annual NDVI time series data from MOD13 and MYD13 data, and PPET was used to further refine the fused MOD13/MYD13 NDVI data after TSPT processing (Figure 3).
TSPT was used initially to read the MOD13 and MYD13 NDVI values and quality assurance (QA) data, including image acquisition dates for each pixel, which were then disaggregated from 16-day composites into daily data. MOD13 and MYD13 QA data were also used to remove pixels affected by clouds and cloud shadows. NDVI noise artifacts were removed using a spike detection and removal algorithm, and data with extremely oblique viewing geometry (e.g., data acquired with view zenith angles exceeding 50 degrees) were removed. Once cleaned, the MODIS Aqua and Terra data was merged via maximum value compositing of NDVI for a given date of daily data. Data voids in the NDVI time series were then filled using an interpolation technique that included temporally filtering via curve fitting with the Savitzky Golay (SG) algorithm [50]. After interpolation, NDVI was reaggregated from daily into 8-day NDVI composites. In processing the MOD13/MYD13 data, the TSPT upward and downward spike detection threshold was set to 0.05, the SG frame size was assigned to 23 days and the SG full width half maximum (FWHM) was set to 16 days. In addition, all negative NDVIs were assigned to 0 and the positive NDVIs multiplied by 100.
The resulting NDVI products from TSPT processing were then used in PPET to generate 8-day cumulative integral (CI) NDVI products, yielding 46 total products per year. In doing so, the CI NDVI products were subjected to segmented curve fitting to provide additional smoothing. Individual dates of 8-day NDVI were calculated from the CI NDVI products by subtraction of the previous date of CI NDVI from a current date of CI NDVI [51]. After PPET processing, the 8-day NDVIs were reaggregated into 24-day NDVIs (via maximum value compositing) with each 24-day product date interleaved by 8-days with the preceding and subsequent date [30]. This 24-day temporal composite aggregation is employed for near-real time regional forest disturbance monitoring by the USDA Forest Service ForWarn system in which cloud free NDVIs are needed for regional forest monitoring across the CONUS. For this study, the 24-day interval of 5–28 August was chosen for analyzing NDVI change and MPB forest mortality within the study area.

2.2.2. MOD09/MYD09 Data

We also evaluated products derived from daily MODIS imagery to test if such data could produce a more refined, accurate NDVI change product for estimating percent tree mortality. Daily MOD09 Terra and MYD09 Aqua reflectance data were temporally processed using TSPT software with parameter settings for the noise reduction and void interpolation steps optimized for these data. In addition, daily NDVI was computed from the MOD09/MYD09 reflectance data. TSPT settings included the upward and downward spike detection threshold set to 0.05 maximum slope between dates, the SG frame size set to 23 days, and the SG full width half maximum set to 16 days. Data were only processed when view zenith angles were ≤ 50 degrees. For TSPT to effectively process the daily reflectance data into daily NDVI products, the data collection period included the date of comparison, plus approximately one month of data was used from before and after the targeted date of observation. These extra days of data were needed to interpolate NDVIs for dates with data voids in the time series.

2.2.3. Percent NDVI Change Maps

After preliminary processing of MODIS NDVI data, percent NDVI change products were calculated with the following formula: Percent NDVI change = ((((NDVI current − NDVI historical)/NDVI historical) × 100) + 101), where current is the current year (2008) and historical is either 2000 or 2003. This change metric is comparable to that used in the derivation of forest change product resident to the ForWarn system [30,31]. MODIS NDVI change maps generated for the project included: (a) MOD09/MYD09 2008 versus 2000 NDVI change; (b) MOD09/MYD09 2008 versus 2003 NDVI change; (c) MOD13/MYD13 2008 versus 2000 NDVI change; and (d) MOD13/MYD 13 2008 versus 2003 NDVI change (Figure 4). Such change products have values that range from −100 to +100%. For this project, we added 101 to rescale the output from 1 to 201. Rarely occurring extreme negative change outliers (those less than −100% change) were set to 1 in the final output and rarely occurring extreme positive change outliers (those greater than +100% change) were set to 201 in the final output. The no-change value was set to 101. This rescaling procedure was performed so that the change products could be output as unsigned 8-bit data files.

2.3. Reference Data Preparation

The primary reference data for the project was a 2.4-m resolution forest cover and condition map derived by classification of aerial multispectral imagery acquired on 13 August 2008 (Figure 5). The multispectral data used in the classification was originally acquired at a spatial resolution of 30 cm and was aggregated to 2.4-m resolution prior to the classification [34]. This map included three forest condition classes (live forest (with green overstory canopies), dead forests (with either dead red and dead gray trees) in addition to herbaceous vegetation (e.g., meadows), bare soil, and shadow/water classes. This map was assessed by [34] using field measurements from 400-m2 circular plots in conjunction with interpretation of randomly sampled locations on aerial true and false color imagery acquired at 1-m resolution.
To compare to MODIS percent NDVI change products, the aerial forest condition map was further processed into a series of fractional abundance maps, one for each mapped class. In each case, a given forest condition class was recoded to 100 and then spatially aggregated into a 240-m fractional abundance product that reported the percent of the pixel occupied by the featured condition (e.g., dead red forest). To derive the aerial percent forest mortality map, fractional abundance images for the dead red and dead gray tree categories were added together into a composite percent mortality map (Figure 5d). Non-mapped pixels outside the effective map area were assigned a null value and were disregarded for subsequent processing. The output was then reprojected to match the MODIS spatial resolution and projection.

2.4. Regression Analysis

The project assessed relationships between a “reference” aerial percent forest mortality map and various MODIS-based NDVI change maps. The aerial imagery-based percent forest mortality map was used as the dependent variable “y” for multiple regression analyses that used a given NDVI change map as the independent variable “x”. The results of these regression analyses are summarized in Table 2 and regarded the following NDVI change maps: (1) change in MOD13/MYD13 maximum NDVI for August 5–28 of 2008 versus 2000; (2) change in MOD13/MYD13 maximum NDVI for 5–28 August 2008 versus 2003; (3) change in MOD09/MYD09 maximum NDVI for the middle date of 5–28 August 2008 versus 2003; and (4) change in MOD09/MYD09-based daily NDVI for middle date of 5–28 August of 2008 versus 2003. For the MOD09/MYD09 data, August 17 was considered the middle date. These models tested the effect of using two different kinds of standard MODIS 250-m resolution data products (MOD09/MYD09 reflectance and MOD13/MYD13 NDVI), which were temporally processed in a different manner. In addition, we tested the effect of two different baselines (2003 versus 2000) from which NDVI change maps were computed in relation to 2008 data. The two years of baselines were tried because the earliest baseline used only MODIS Terra data. The 2003 baseline includes data from MODIS Terra and Aqua sensors. Also, the first baseline of 2000 was collected at an earlier stage of the MPB outbreak.
The effect of extreme spurious outliers on regression results was explored by removing data points with ± three or more standard deviations from a the mean value of a given tested MODIS percent NDVI change product. After outlier removal, the regression analyses were rerun and summarized as Table 3. For the MODIS product with the highest estimated r and r2 result from linear regression analysis, an r2 was also computed using a nonlinear exponential equation in order to compare to the linear regression results. For the best linear regression result, percent tree mortality map were computed from the applicable MODIS NDVI change map using linear and nonlinear regression equations. In addition to the scatter plot and r2 analysis, the MODIS-based forest mortality maps (from the linear and nonlinear models) were compared visually to the aerial-based percent mortality map.

3. Results

3.1. MODIS NDVI Change versus Percent Tree Mortality Map Using All Pixels

The daily reflectance-based NDVI change map for 2008 with the 2003 baseline was compared to the reference aerial image-based percent tree mortality map, yielding an r2 of 0.544. In contrast, the 16-day MOD13/MYD13 NDVI change product using the 2003 baseline yielded a lower explained variance (r2 = 0.362). Using 2000 as the baseline instead of 2003 decreased the r2 for MOD09/MYD09 data (r2 = 0.425), but the explained variance for MOD13/MYD13-based data compared to reference data increased slightly using the 2000 baseline (r2 = 0.393). The MOD09/MYD09 data for each of the two baseline years showed higher r2 values than the best result from MOD13/MYD13 data. The MOD09/MYD09 NDVI change product with the 2003 baseline yielded the lowest standard error (14.577), though the amount was still higher than desired. In contrast, the MOD13/MYD13 change product with the 2003 baseline yielded the highest standard error (17.249).

3.2. MODIS NDVI Change versus Percent Tree Mortality Map with Outliers Removal

After outlier removal, processed daily MOD09/MYD09 NDVI data using the 2003 baseline and the reference data yielded an r2 of 0.570; with the 2000 baseline, r2 = 0.479 (Table 3). Upon outlier removal, processed MOD13/MYD13 NDVI data with outlier removal produced higher r2 values with the reference data using the 2003 (r2 = 0.523) and 2000 baseline (r2 = 0.406). After outlier removal, the MOD13/MYD13 NDVI change product using the 2003 baseline yielded a higher r2 value than the MOD09/MYD09 NDVI change product using a 2000 baseline (Table 3). With outlier removal applied, the best temporally processed MOD09/MYD09 data produced better r2 results (more of the variance explained) with the reference aerial forest mortality map (r2 = 0.570) compared to that with the best temporally processed MOD13/MYD13 NDVI data with the reference data (r2 = 0.523). For the NDVI change products with outlier removal, the standard error was somewhat reduced, compared to the same change maps with extreme outlier removal (Table 2 and Table 3). With outlier removal applied, the standard error was more similar for the MOD09/MYD09 and MOD13/MYD13 NDVI change maps using the 2003 baseline (14.150 versus 14.888). Although the standard error was reduced for all the regressions with outlier removal applied, there was still a higher than desired standard of error for all tested products with outlier removal.
Figure 6 shows the scatter plot of the NDVI change product and the aerial image mortality for the linear regression model with the best r2 (MOD09/MYD09 data with 2003 baseline). This figure visually depicts the relationship between the MODIS NDVI change map and aerial tree mortality map, including linear and nonlinear (exponential) trend lines overlain onto the scatter plot. Based on the r2 value, the linear model indicates moderate statistical explanatory power for this NDVI change map overall. The scatter plot shows that a linear relationship occurs between a given MODIS NDVI change map and aerial forest mortality map data. However, a range of NDVI change values can occur for a given percent mortality level from the aerial data. Based on the linear trend line, the percent mortality appears to peak at ~80%, though the maximum percent mortality on the aerial map is 85%. This suggests that the linear model may under predict very high percent mortality levels. The linear model also suggests that the MODIS-based NDVI change of ~+3% (on x-axis) is roughly equivalent to 0% mortality on the aerial data (on y-axis). However, the 0% mortality level on the aerial map is more frequently represented by NDVI change values that are negative. In some cases, NDVI change values may be influenced by sub-lethal MPB impacts to attacked but still living trees [30,31].
The nonlinear model produced a higher r2 (0.593) than the linear model (0.570) (Figure 6). The nonlinear model appears to reduce NDVI change predicted percent mortality values in the mid-range of the percent mortality values represented on the aerial-based forest mortality map. In addition, the nonlinear model may over-estimate the highest percent mortality values, given that the aerial data’s maximum percent mortality of 85%. The nonlinear model’s trend line does appear to more effectively follow data points in the highest and the lowest percent mortality levels. However, fewer data points are present in the highest percent mortality levels.
Figure 7 compares percent tree mortality maps derived from aerial (Figure 7a) and MODIS data (Figure 7c,d). The MODIS tree mortality maps were computed using the MOD09/MYD09 NDVI change map for 2008 versus 2003 in conjunction with regression equations (linear and exponential) that used the relationship between the rescaled NDVI change map and the aerial mortality map (equations given in Figure 6) to derive predictive MODIS-based mortality maps, applying both linear and exponential models. A visual comparison of the MODIS- and aerial-based mortality maps showed many areas with good correspondence in general. In addition, the linear model (Figure 7c) appears to more closely approximate the patterns evident in the aerial forest mortality map (Figure 7a). However, the exponential model (Figure 7d) shows lower mortality levels more comparable to those on the aerial mortality map (Figure 7a) that correspond with areas that have a mixture of live green forests and sometimes non-forest green vegetation on the aerial false color RGB (Figure 7b). Consequently, the exponential model (Figure 7d) may depict the lower mortality level areas more effectively than the linear model (Figure 7c). The scatter plot shows a high amount of variability, though the trend lines appear to dissect the data cloud in an expected manner.

4. Discussion

Our assessment of the effect of baseline year indicated that the MODIS NDVI change products using the 2003 baseline yielded higher r2 values than those using 2000. Differences could be related to the reduced data availability of MODIS data in 2000. Only one MODIS instrument was in operation as of 2000 (Terra), and frequent cloud cover occurred in the study area during August 2000, based on QA data and visual inspection of reflectance data. The full collection of Aqua data began in 2003, which meant that twice as much daily MODIS data were available for producing the 2003 baseline data set compared to 2000, thereby allowing for more data with greater cloud free coverage and increased frequency of quality NDVIs. Our regression analyses also showed that the temporally processed daily MOD09/MYD09 data produced slightly better r2 values than the 16-day MOD13/MYD13 products (Table 2 and Table 3). The results suggest that the temporal processing of MODIS time series data may be improved by processing daily instead of pre-composited 16-day NDVI data.
The MODIS-based mortality maps shown in Figure 7 were also compared visually to understand differences with aerial mortality data products. For the linear model, the differences were most apparent for the lowest and highest percent tree mortality levels. Some differences between the aerial and MODIS products appeared to occur in areas with small or narrow patches of non-forest and live non-attacked forest that were intermingled with or were adjacent to areas of forest mortality as seen on the 2.4-m aerial imagery. Similarly, edges between larger patches of differing land cover types and conditions also tended to be more spatially mixed on MODIS 250-m data. Differences between the test and reference maps could be due to several reasons: (1) underestimation of mortality for lower NDVI change levels; (2) overestimation of mortality at higher levels of negative NDVI change; (3) mixed pixel effects (forest and non-forest classes); (4) uncertainties in co-registration of the aerial and MODIS images; and resampling of the MODIS and aerial data to a common map projection; (5) the coarser 250-m spatial resolution of the MODIS data relative to the aerial data; and (6) the relative low frequency of low percent mortality areas in the study area. Although infrequent, some residual spurious data values (e.g., from unmitigated atmospheric contamination) in the MODIS change products may occasionally occur. Another possible factor may be classification error in the spatially averaged 240-m aerial percent mortality classification product, though this effect is likely to be a very minor or negligible issue given that the aerial classification of six classes at 2.4-m resolution produced an overall accuracy of 90% compared to ground reference data [34]. The integration of the MODIS and aerial data was another potential factor, given that the two data sources had different spatial resolutions and map projections.
Our study found that the inclusion of infrequent extreme outliers in the regression analyses lowered the r2 value, especially with respect to the MOD13/MYD13-based forest change products (Table 2). By pruning the most extreme outliers to exclude values exceeding mean MODIS NDVI change ±3 standard deviations (SDs), the regression results improved, especially for the MOD13/MYD13-based product using the 2003 baseline (Table 3). This refinement provided a means for assessing performance that considers most of the data, only excluding the most extreme yet rare outlier data considered to be “noise”. It is possible that the r2 values may be further improved by using a more stringent threshold for pruning outliers, such as the mean NDVI change plus a 2 SD instead threshold instead.
In terms of r value (as opposed to r2), all the tested MODIS products (without and with outlier removal) exceeded values of −0.60 (Table 2 and Table 3), indicating moderate strength between the compared variables [52]. The best MOD09/MYD09 and MOD13/MYD13 results obtained with outlier removal yielded r correlation coefficients greater than −0.7, which [52] considers to be of high strength.
In this study, the best linear regression for using MODIS NDVI data to estimate forest mortality resulted in an r2 of 0.57, which exceeded the best r2 of 0.39 reported by [33], which used MODIS 16-day MOD13 NDVI to estimate forest mortality in pine plantations due to Ips bark beetle attacks. Our project’s higher r2 values may be due to additional temporal processing of the MODIS data, the inclusion of MODIS Aqua data along with MODIS Terra data, differences in landscape characteristics (e.g., patch sizes, cover types, and tree mortality levels), plus our study used a much higher number of observations used to compute the correlations. In addition, our study aimed to estimate percent forest mortality as the fraction of forest canopy cover that exhibited forest mortality. In contrast, [33] defined forest mortality in terms of number of dead trees per pixel. It may be more difficult to map the number of dead crowns, given that crown size can vary according to tree species, height, age, and growing conditions (i.e., site).
Environmental factors may also influence the correlation between MODIS and aerial imagery products. The level of cloud cover can significantly influence the number of quality data points available. We used Collection 5 MODIS data for the project, given it was the level of MODIS data that was available at the time the study was conducted. It is possible that using Collection 6 MODIS data may result in improved percent forest mortality maps, given that calibration coefficients, product generation methods, and data quality assessment algorithms have been updated. Correlations may also be improved by including other meaningful explanatory environmental variables in a multiple regression analysis, such as digital elevation data and detailed forest cover type maps from, e.g., the Gap Analysis Project [53] or Landscape Fire and Resource Management Planning Tools Project (LANDFIRE) [54]. With bark-beetle induced forest mortality, the contrast between live and dead forest canopies (regardless of being dead red or gray) is distinct to the visible eye. The comparisons of MODIS-based percent forest mortality maps to reference data may also be aided using IDS data to identify general locations of recorded forest mortality areas, taking into account that the IDS data can have classification and locational errors.
The results presented here pertain to a mature predominately lodgepole pine forest attacked by MPBs in which most of the overstory trees were either in a dead red or gray state as of 2008. MODIS 250-m NDVI change products from both prior to and after MPB attack provide information on the relative severity or intensity of the damage, as a function of forest canopy greenness decline. MODIS NDVI change imagery typically shows relative change in canopy greenness due to extensive, severe forest disturbances, such as MPB-induced forest mortality, especially when the damage is sufficiently extensive and severe within a given pixel. However, the ability of MODIS NDVI forest change maps to be converted into effective percent forest mortality maps may also depend in part on the mixture of land cover types within the MODIS pixel, as well as the amount of reduction in greenness occurring in MPB-killed forests.
We used 250-m MODIS NDVI data, in part because it uses finer spatial resolution spectral band data compared with the 500-m resolution MODIS spectral bands. It is conceivable that other spectral indices could improve MODIS-based estimations of MPB mortality, especially if employing additional temporal processing techniques (e.g., perhaps using a Bidirectional Reflectance Distribution Function (BRDF) as a step). However, some of the MODIS 500-m resolution bands can have data quality issues, such as data dropouts in MODIS Aqua band 6 (1.6-micron short wave infrared [55] and misregistration of short-wave infrared to visible and near infrared bands [56]. Furthermore, MODIS 250-m products have four times finer spatial resolution than the 500-m data, and this finer 250-m resolution may be an important factor for discriminating changes in canopy greenness in smaller patches than observed at the 500-m scale.
The best MODIS-based percent mortality map from our project yielded a r2 of 0.59. However, the standard error for the tested products was high (best case for linear regression was 14.150) and we acknowledge there is room for improvement. We think the performance of the percent forest mortality models may improve with additional research into the following: (1) alternative methods for processing the MODIS data, including methods for noise reduction and co-registration of NDVI and reference data on forest mortality; (2) use of MODIS Collection 6 data which may improve the quality of acquired MODIS data products; (3) use of other explanatory environmental variables in the model in addition to percent change in NDVI, such as digital elevation models and perhaps meteorological data; (4) use of alternative regression methods, such as logistic regression; (5) incorporation of detailed vegetative cover type geospatial data; and (6) use of percent tree canopy geospatial data in refining maps of forest mortality, which in particular may help improve the development of more viable percent forest mortality maps in semi-open forests and woodlands, such as pinyon juniper woodlands. In addition, other relevant research needs to be conducted, including: (1) use of alternatives to aging MODIS systems (e.g., OLCI and VIIRS) for producing percent forest mortality maps at the regional scale; and (2) use of alternative spectral indices to NDVI that may yield improved maps of percent forest mortality.
MODIS percent NDVI change products are currently used in the ForWarn near real time on-line system for viewing, detecting, assessing, and tracking regional forest disturbances across CONUS [30,31]. ForWarn presently uses MODIS Collection 6 near real time NDVI data from the Global Inventory Monitoring and Modeling Studies (GIMMS) Global Agricultural Monitoring (GLAM) system, along with historical baseline NDVIs from temporally processed MOD/MYD13 data, to compute forest disturbance monitoring products that are displayed in the system’s geospatial data viewer. The methods we discuss here are amenable to automation within ForWarn in that regression equations, once constructed, could be used to generate MODIS NDVI-based forest mortality maps in near real time, especially if combined with other relevant geospatial data and GIS-based decision rules. The use of MODIS NDVI data for estimating percent forest mortality is a value-added product that can be used to aid the ForWarn system as well as part of an overall effort to synoptically monitor forest conditions with a multi-scale, multi-technology approach involving ground, aerial, and satellite observations. Such a multi-stage sampling approach to forest health monitoring and assessment was discussed by [9].

5. Conclusions

In this study, we performed regression analysis to compute and assess r and r2 values for different MODIS 250-m NDVI change products compared to a previously produced, highly accurate percent forest mortality map derived from high spatial resolution aerial multispectral imagery. For the best apparent change map, we applied regression equations from the earlier analysis on the MODIS NDVI change map to compute percent mortality maps. The study resulted in a method using MODIS imagery that could be employed to help scale up forest mortality mapping from a local to regional scale. Our study demonstrated that moderate to high strength correlations (r values) occurred for various MODIS NDVI change products compared to a percent mortality map from aerial reference data. We found that the best r2 values were obtained with temporally processed daily NDVI computed from MODIS surface reflectance data, though similar results were obtained from temporally processed 16-day NDVI products. The highest r2 values occurred when using the daily MODIS MOD09/MYD09-based NDVI products. The project also used the best apparent MODIS-based data in conjunction with aerial data to compute mortality maps that compare favorably with a reference mortality map derived from only aerial data. Based on results from this study, our technique should work comparably for other lodgepole pine forests in the region similarly affected by a multiyear MPB outbreak. By 2008, the overstory lodgepole pine forests in the study area were for the most part severely impacted by MPB. While our results are promising, additional studies need to be conducted on other areas with bark beetle damaged forest, including forests less damaged by MPB, to further assess the potential of MODIS data for this application. Other sources of satellite data should also be considered, given that the MODIS sensors are nearing the end of their life span.
The development and demonstration of this MODIS technique could not have been performed without the availability of an accurate high-spatial resolution forest mortality map for a sufficiently sizeable area (i.e., small region). However, now that regression models have been built, the best apparent models (linear and nonlinear) produced from this project could be used to compute MODIS-based mortality maps for other lodgepole pine forested areas. Based on project results, the nonlinear model in conjunction with a MODIS NDVI change map may be able to detect lower levels of mortality than the linear model, which could be useful in initially mapping early stages of MPB outbreaks. For other types of forests with bark beetle outbreaks, it may be necessary to build new regression models for using MODIS data to produce forest mortality maps. Where high spatial resolution aerial imagery-based forest mortality maps do not typically exist as reference data, it may be possible to construct alternative reference forest mortality maps from such sources as National Agriculture Imagery Program (NAIP), Landsat and Sentinel-2 satellite, higher resolution commercial satellite, aerial IDS, and/or in-situ data.
The MODIS NDVI change products used in this study were generated to aid ForWarn and other near real time forest disturbance detection and monitoring systems. This study provided evidence that useful forest mortality mapping products can be generated from temporally processed MODIS 250-m NDVI data from the ForWarn system. Such mortality maps could be integrated into the ForWarn system to help end-users (e.g., resource managers) in assessing regionally extensive forest mortality due to multiyear bark beetle outbreaks. MODIS-based percent forest mortality products can also potentially aid forest salvage and restoration efforts, fire fuel mapping, and forest mortality risk mapping (e.g., during drought years). The project also provided evidence that use of daily MOD09/MYD09 data may improve generation and utility of near real time NDVI change products resident to the US Forest Service’s ForWarn system. A similar finding was made by [21] regarding the mapping of gypsy moth defoliation with MODIS data.
While the mortality mapping technique from this project showed potential for MPB impacted lodgepole pine dominated forests, it does not determine or predict causal agents and does not summarize results according to mapped cover type. More effort is needed to develop these additional capabilities. Additional work is also required to further assess the application with respect to other bark beetle damage and other forest disturbances, cover types, and locations. More studies are needed to assess potential of MODIS for estimating tree mortality in other forest and woodland types in the western US, such as high elevation spruce-fir forests and pinyon-juniper woodlands. Additional research is also needed to further improve and refine models of percent forest mortality from MODIS and comparable satellite systems. If this MODIS-based method proves to be effective for other forest types, bark beetle species, mortality levels, and locations, then such a validated procedure could be applied for forest mortality mapping at regional and national scales.

Author Contributions

This study was initially conceptualized by N.E.G., J.A.H., W.W.H., and J.P.S. and investigated by J.P.S., J.A.H., W.W.H., N.E.G., and A.J.H.M. The methodology was developed by J.P.S., J.A.H., W.W.H., and N.E.G. Validation and other data analysis were performed by J.P.S. and reviewed by J.A.H., W.W.H., N.E.G., and A.J.H.M. with essential reference data provided by A.J.H.M. J.P.S. drafted and refined the manuscript with reviews and additional editing by J.A.H., W.W.H., N.E.G., and A.J.H.M.

Funding

The project’s geospatial data processing and analysis was conducted with funding from the USDA Forest Service Threat Assessment Centers (EFETAC and WWETAC) to NASA Stennis Space Center, as part of a multi-federal agency collaborative multiyear project to develop and deploy national and regional forest threat early warning system tools. In doing so, personnel from the Computer Sciences Corporation (CSC), Inc. and ASRC Research and Technology Solutions (ARTS) performed project data processing and analysis under contract NNS10AA35C. This manuscript was completed with funding from a USDA Forest Service grant to Leidos (contract HHSN316201200034W, award AG4568D170050).

Acknowledgments

Jerry Gasser from Lockheed Martin assisted in processing MODIS data. Phil Kuper of CSC acquired the MODIS data utilized in the project. James Smoot of CSC and Jason Jones from ARTS provided additional remote sensing and GIS data processing and analysis support. Robert Hubbard of the USDA Forest Service Rocky Mountain Experiment Station provided information and data that was useful to the project. Steve Norman of the USDA Forest Service also helped in developing one of the main figures. Opinions, findings, and conclusions or recommendations given in this work are those of the author(s) and do not necessarily reflect the views of the USDA Forest Service, NASA or other participating organizations.

Conflicts of Interest

The authors declare no conflict of interest. The project design and implementation were conducted by a multi-organizational team that included researchers from the initial funding organization, the USDA Forest Service.

References

  1. Hicke, J.A.; Meddens, A.J.H.; Kolden, C.A. Recent tree mortality in the western United States from bark beetles and forest fires. For. Sci. 2016, 62, 141–153. [Google Scholar]
  2. Raffa, K.F.; Aukema, B.H.; Bentz, B.J.; Carroll, A.L.; Hicke, J.A.; Turner, M.G.; Romme, W.H. Cross-scale drivers of natural disturbances prone to anthropogenic amplification: Dynamics of biome-wide bark beetle eruptions. BioScience 2008, 58, 501–517. [Google Scholar] [CrossRef]
  3. Meddens, A.J.H.; Hicke, J.A.; Ferguson, C.A. Spatiotemporal patterns of observed bark beetle-caused tree mortality in British Columbia and the western United States. Ecol. Appl. 2012, 22, 1876–1891. [Google Scholar] [CrossRef] [PubMed]
  4. Wood, S.L. A revision of bark beetle genus Dendroctonus erichson (Coleoptera: Scolytidae). Gt. Basin Nat. 1963, 23, 1–117. [Google Scholar]
  5. Furniss, R.L.; Carolin, V.M. Western Forest Insects; USDA US Department of Agriculture, Forest Service Misc. Publ.: Washington, DC, USA, 1977; Volume 1339, 654p.
  6. Bone, C.; Wulder, M.A.; White, J.C.; Robertson, C.; Nelson, T.A. A GIS-based risk rating of forest insect outbreaks using aerial overview surveys and the local Moran’s I statistic. Appl. Geogr. 2013, 40, 161–170. [Google Scholar] [CrossRef]
  7. Hoffman, D. Danger Tree Mitigation Guidelines for Managers; Report No. 1151-2815P–MTDC; USDA Forest Service, Technology & Development: Missoula, MT, USA, 2011; 28p.
  8. USDA. USDA Forest Service Situation Summary of Recent Tree Mortality on Sequoia National Forest; Report No. SS15-005; USDA Forest Service, State and Private Forestry, Forest Health Protection, South Sierra Shared Service Area: Sonora, CA, USA, 2015; 14p.
  9. Ellenwood, J.; Sapio, F.; Mai, J.; Thomas, V. Working Towards an Integrated Approach for Monitoring Forest Disturbance at Multiple Scales and Frequency, Chapter 7. In Forest Health Monitoring: National Status, Trends and Analysis 2013 Report; Gen. Tech. Rep. SRS-207; U.S. Department of Agriculture Forest Service, Southern Research Station: Asheville, NC, USA, 2015; pp. 101–122. [Google Scholar]
  10. Johnson, E.W.; Ross, J. Quantifying error in aerial survey data. Aust. For. 2008, 71, 216–222. [Google Scholar] [CrossRef]
  11. Kurz, W.A.; Dymond, C.C.; Stinson, G.; Rampley, G.J.; Neilson, E.T.; Carroll, A.L.; Ebata, T.; Safranyik, L. Mountain pine beetle and forest carbon feedback to climate change. Nature 2008, 452, 987–990. [Google Scholar] [CrossRef]
  12. Hicke, J.A.; Meddens, A.J.H.; Allen, C.D.; Kolden, C.A. Carbon stocks of trees killed by bark beetles and wildfire in the western United States. Environ. Res. Lett. 2013, 8, 035032. [Google Scholar] [CrossRef] [Green Version]
  13. Vogelmann, J.E.; Tolk, B.; Zhu, Z.L. Monitoring forest changes in the southwestern United States using multitemporal Landsat data. Remote Sens. Environ. 2009, 113, 1739–1748. [Google Scholar] [CrossRef]
  14. Meigs, G.W.; Kennedy, R.E.; Cohen, W.B. A Landsat time series approach to characterize bark beetle and defoliator impacts on tree mortality and surface fuels in conifer forests. Remote Sens. Environ. 2011, 115, 3707–3718. [Google Scholar] [CrossRef]
  15. Vogelmann, J.E.; Kost, J.R.; Tolk, B.; Howard, S.; Short, K.; Chen, X.; Huang, C.; Pabst, K.; Rollins, M.G. Monitoring landscape change for LANDFIRE using multi-temporal satellite imagery and ancillary data. IEEE J. Sel. Top. Appl. Earth Obs. Remote Sens. 2011, 4, 252–264. [Google Scholar] [CrossRef]
  16. Buma, B.; Pugh, E.T.; Wessman, C.A. Effect of the current major insect outbreaks on decadal phenological and LAI trends in southern Rocky Mountain forests. Int. J. Remote Sens. 2013, 34, 7249–7274. [Google Scholar] [CrossRef]
  17. Walter, J.A.; Platt, R.V. Multi-temporal analysis reveals that predictors of mountain pine beetle infestation change during outbreak cycles. For. Ecol. Manag. 2013, 302, 308–318. [Google Scholar] [CrossRef]
  18. Liang, L.; Chen, Y.; Hawbaker, T.J.; Zhu, Z.; Gong, P. Mapping Mountain Pine Beetle Mortality through Growth Trend Analysis of Time-Series Landsat Data. Remote Sens. 2014, 6, 5696–5716. [Google Scholar] [CrossRef] [Green Version]
  19. Ciesla, W.M. Remote Sensing in Forest Health Protection; FHTET Report No. 00-03; U.S. Department of Agriculture, Forest Service, Forest Health Technology Enterprise Team, Remote Sensing Applications Center: Salt Lake City, UT, USA, 2000; 266p.
  20. De Beurs, K.M.; Townsend, P.A. Estimating the effect of gypsy moth defoliation using MODIS. Remote Sens. Environ. 2008, 112, 3983–3998. [Google Scholar] [CrossRef]
  21. Spruce, J.P.; Sader, S.; Ryan, R.E.; Smoot, J.; Kuper, P.; Ross, K.; Prados, D.; Russell, J.; Gasser, G.; McKellip, R.; et al. Assessment of MODIS NDVI Time Series Data Products for Detecting Forest Defoliation from Gypsy Moth Outbreaks. Remote Sens. Environ. 2011, 115, 427–437. [Google Scholar] [CrossRef]
  22. White, J.C.; Wulder, M.A.; Brooks, D.; Reich, R.; Wheate, R.D. Detection of Red Attack Stage Mountain Pine Beetle Infestation with Spatial Resolution Satellite Imagery. Remote Sens. Environ. 2005, 96, 340–351. [Google Scholar] [CrossRef]
  23. Coops, N.C.; Johnson, M.; Wulder, M.A.; White, J.C. Assessment of QuickBird high spatial resolution imagery to detect red attack damage due to mountain pine beetle infestation. Remote Sens. Environ. 2006, 103, 67–80. [Google Scholar] [CrossRef]
  24. Wulder, M.A.; White, J.C.; Coops, N.C.; Butson, C.R. Multi-temporal analysis of high spatial resolution imagery for disturbance monitoring. Remote Sens. Environ. 2008, 112, 2729–2740. [Google Scholar] [CrossRef]
  25. Hicke, J.A.; Logan, J.A. Mapping whitebark pine mortality caused by a mountain pine beetle outbreak with high spatial resolution satellite imagery. Int. J. Remote Sens. 2009, 30, 4427–4441. [Google Scholar] [CrossRef]
  26. Meddens, A.J.H.; Hicke, J.A.; Vierling, L.A.; Eitel, J.U.H. Detection of Beetle-Caused Tree Mortality from Satellite Imagery for Use in the LANDFIRE Project: Methods Development and Evaluation, Report on the University of Idaho/USGS Cooperative Agreement Entitled “Establishment of a New Cooperative Research Partnership to Develop Algorithms for Improved Automated Remote Detection of Land Areas Containing High Fire Risk for Incorporation Into LANDFIRE”; University of Idaho: Moscow, ID, USA, 2009; 41p. [Google Scholar]
  27. Bright, B.C.; Hicke, J.A.; Hudak, A.T. Estimating aboveground carbon stocks of a forest affected by mountain pine beetle in Idaho using lidar and multispectral imagery. Remote Sens. Environ. 2012, 124, 270–281. [Google Scholar] [CrossRef] [Green Version]
  28. Macfarlane, W.W.; Logan, J.A.; Kern, W.R. An innovative aerial assessment of Greater Yellowstone Ecosystem mountain pine beetle-caused whitebark pine mortality. Ecol. Appl. 2013, 23, 421–437. [Google Scholar] [CrossRef]
  29. Hargrove, W.W.; Spruce, J.P.; Gasser, G.E.; Hoffman, F.M. Toward a national early warning system for forest disturbances using remotely sensed canopy phenology. Photogramm. Eng. Remote Sens. 2009, 75, 1150–1156. [Google Scholar]
  30. Norman, S.P.; Hargrove, W.W.; Spruce, J.P.; Christie, W.M.; Schroeder, S.W. Highlights of Satellite-Based Forest Change Recognition and Tracking Using the ForWarn System; Gen. Tech. Rep. SRS-GTR-180; USDA-Forest Service, Southern Research Station: Asheville, NC, USA, 2013; 30p.
  31. Norman, S.P.; Hargrove, W.W.; Spruce, J.P.; Christie, W.M. Monitoring Forest Disturbances across Seasons Using the ForWarn Recognition and Tracking System, Chapter 6. In Forest Health Monitoring: National Status, Trends and Analysis 2013 Report; Gen. Tech. Rep. SRS-207; U.S. Department of Agriculture Forest Service, Southern Research Station: Asheville, NC, USA, 2015; pp. 85–99. [Google Scholar]
  32. Jin, S.; Sader, S.A. MODIS time-series imagery for forest disturbance detection and quantification of patch size effects. Remote Sens. Environ. 2005, 99, 462–470. [Google Scholar] [CrossRef]
  33. Verbesselt, J.; Robinson, A.; Stone, C.; Culvenor, D. Forecasting tree mortality using change metrics from MODIS satellite data. For. Ecol. Manag. 2009, 258, 1166–1173. [Google Scholar] [CrossRef]
  34. Meddens, A.J.H.; Hicke, J.A.; Vierling, A. Evaluating the potential of multispectral imagery to map multiple stages of tree mortality. Remote Sens. Environ. 2011, 115, 1632–1642. [Google Scholar] [CrossRef]
  35. Western Regional Climate Center. Fraser, Colorado (053113), Period of Record Monthly Climate Summary. 2019. Available online: https://wrcc.dri.edu/cgi-bin/cliMAIN.pl?cofras (accessed on 26 March 2019).
  36. Meddens, A.J.H.; Hicke, J.A. Spatial and temporal patterns of Landsat-based detection of tree mortality caused by a mountain pine beetle outbreak in Colorado, USA. For. Ecol. Manag. 2014, 322, 78–88. [Google Scholar] [CrossRef]
  37. Chapman, T.B.; Vleban, T.T.; Schoennagel, S.T. Spatiotemporal patterns of mountain pine beetle activity in the southern Rocky Mountains. Ecology 2012, 93, 2175–2185. [Google Scholar] [CrossRef]
  38. Creeden, E.P.; Hicke, J.A.; Buotte, P.C. Climate, weather, and recent mountain pine beetle outbreaks in the western United States. For. Ecol. Manag. 2014, 312, 239–251. [Google Scholar] [CrossRef]
  39. Negron, J.F.; Cain, B. Mountain pine beetle in Colorado: A story of changing forests. J. For. 2018, 117, 144–151. [Google Scholar] [CrossRef]
  40. Pielke, R.A.; Doesken, N.; Bliss, O.; Green, T.; Chaffin, C.; Salas, J.D.; Woodhouse, C.A.; Lukas, J.J.; Wolter, K. Drought 2002 in Colorado: An unprecedented drought or a routine drought? Pure Appl. Geophys. 2005, 162, 1455–1479. [Google Scholar] [CrossRef]
  41. Heller, R.C.; Aldrich, R.C.; McCambridge, W.F.; Weber, F.P. The Use of Multispectral Sensing Techniques to Detect Ponderosa Pine Trees Under Stress, From: Insect or Disease; Ann. Prog. Report, For. Remote Sensing Lab. for Nat. Resource Prog.; Submitted to NASA by the USFS Pacific SW For. and Range Exp. Station; University of California: Berkeley, CA, USA, 1969; 59p. [Google Scholar]
  42. Meddens, A.J.H.; Hicke, J.A.; Vierling, L.A.; Hudak, A.T. Evaluating methods to detect bark beetle-caused tree mortality using single-date and multi-date Landsat imagery. Remote Sens. Environ. 2013, 132, 49–58. [Google Scholar] [CrossRef]
  43. Huete, A.R.; Didan, K.; Miura, T.; Rodriguez, E.P.; Gao, X.; Ferreira, L.G. Overview of the radiometric and biophysical performance of the MODIS vegetation indices. Remote Sens. Environ. 2002, 83, 195–213. [Google Scholar] [CrossRef]
  44. Vermote, E.F.; El Saleous, N.Z.; Justice, C.O. Atmospheric correction of MODIS data in the visible to middle infrared: First results. Remote Sens. Environ. 2002, 83, 97–111. [Google Scholar] [CrossRef]
  45. McKellip, R.; Ryan, R.E.; Prados, D.; Blonski, S. Crop surveillance demonstration using a near-daily MODIS vegetation index time series. In Proceedings of the 2005 International Workshop on the Analysis of Multi-Temporal Remote Sensing Images, Biloxi, MS, USA, 16–18 May 2005; IEEE: Piscataway, NJ, USA, 2005. [Google Scholar]
  46. McKellip, R.; Prados, D.; Ryan, R.; Ross, K.; Spruce, J.; Gasser, G.; Greer, R. Remote sensing time series analysis, a vegetation monitoring tool. NASA Tech Briefs 2008, 32, 63–64. [Google Scholar]
  47. Ramsey, E.; Spruce, J.; Rangoonwala, A.; Suzouki, Y.; Smoot, J.; Gasser, J.; Bannister, T. Daily MODIS data trends of hurricane-induced forest impact and early recovery. Photogramm. Eng. Remote Sens. 2011, 77, 133–143. [Google Scholar]
  48. Ross, K.W.; Spiering, B.A.; Kalcic, M.T. Monitoring Phenology as Indicator for Timing of Nutrient Inputs in Northern Gulf Watersheds. In Proceedings of the OCEANS 2009, MTS/IEEE Biloxi—Marine Technology for Our Future: Global and Local Challenges, Biloxi, MS, USA, 26–29 October 2009. [Google Scholar]
  49. McKellip, R.D.; Ross, K.W.; Spruce, J.P.; Smoot, J.C.; Ryan, R.E.; Gasser, G.E.; Prados, D.L.; Vaughan, R.D. Phenological Parameters Estimation Tool. NASA Tech Briefs 2010, 34, 49–50. [Google Scholar]
  50. Savitzky, A.; Golay, M. Smoothing and differentiation of data by simplified least squares procedures. Anal. Chem. 1964, 36, 1627–1639. [Google Scholar] [CrossRef]
  51. Spruce, J.P.; Gasser, G.E.; Hargrove, W.W. MODIS NDVI Data, Smoothed and Gap-Filled, for the Conterminous US: 2000–2013; ORNL DAAC: Oak Ridge, TN, USA, 2015; Available online: https://doi.org/10.3334/ORNLDAAC/1299 (accessed on 16 September 2019).
  52. Mukaka, M.M. Statistics Corner: A guide to appropriate use of Correlation coefficient in medical research. Malawi Med. J. 2012, 24, 69–71. [Google Scholar]
  53. Davidson, A. GAP national land cover data: Recent developments. GAP Bull. 2010, 18, 5–7. [Google Scholar]
  54. Rollins, M.G. LANDFIRE: A nationally consistent vegetation, wildland fire, and fuel assessment. Int. J. Wildl. Fire 2009, 18, 235–249. [Google Scholar] [CrossRef]
  55. Wang, L.L.; Qu, J.J.; Xiong, X.X.; Hao, X.J.; Xie, Y.; Che, N.Z. A new method for retrieving band 6 of Aqua MODIS. IEEE Geosci. Remote Sens. Lett. 2006, 3, 267–270. [Google Scholar] [CrossRef]
  56. Wang, L.; Xiong, X.; Qu, J.J.; Xie, Y.; Hao, X.; Che, N. Impact assessment of Aqua MODIS band-to-band misregistration on snow index. J. Appl. Remote Sens. 2007, 1, 013531. [Google Scholar]
Figure 1. Examples of mountain pine beetle (MPB) damage: (a) view of “mined” inner bark gallery with mature MPBs; (b) view of gallery with MPB larvae; (c) MPB pitch tubes on lower trunk of mass attacked lodgepole pine tree; (d) landscape photo of MPB induced “dead red” forest mortality area in 2007 at Rabbit Ears’ Pass, Colorado; (e) intra-stand photo of MPB-killed trees (yellow to red crowns) in 2007 at Rabbit Ears’ Pass, Colorado; (f) 2013 aerial photo of gray phase MPB killed forest in the Arapaho National Forest (NF) in Colorado; and (g) 2006 image of MPB killed forest at the Fraser Experimental Forest in the Arapaho NF. Image credits: (a) David Powell USDA Forest Service (retired), Bugwood.org; (b) William M. Ciesla, Forest Health Management International, Bugwood.org; (c) Steven Katovich, USDA Forest Service, Bugwood.org (d,e) Whitney Cranshaw, Colorado State University, Bugwood.org; (f) Justin Backsen, USDA Forest Service; and (g) Charles Rhoades, USDA Forest Service.
Forests 10 00811 g001
Figure 2. Location of study area in Grand County of northern Colorado, USA. The study area boundary is shown in yellow and draped over a county boundary map in cyan and a daily moderate resolution imaging spectroradiometer (MODIS) true color satellite image from 12 August 2008. The map grid reports geographic coordinates. Most of the study area is shown on the MODIS image in red tones due to the high frequency of dead red crowns from MPB at the time of image data collection. The above map shows map coordinates in terms of latitude and longitude.
Forests 10 00811 g002
Figure 3. Workflow used to generate MODIS percent NDVI change maps from MOD13/MYD13 NDVI data. MOD13 is the 16-day composite data from the Terra satellite; MYD13 is from the Aqua satellite. The same workflow also generally applies to the NDVI change products derived directly from daily MOD09/MYD09 products, except that the MOD09/MYD09 change products used daily NDVI data as inputs to temporal data processing.
Forests 10 00811 g003
Figure 4. MODIS NDVI change maps computed for the project: (a) MOD09/MYD09 2008 versus 2000 NDVI change; (b) MOD09/MYD09 2008 versus 2003 NDVI change; (c) MOD13/MYD13 2008 versus 2000 NDVI change; and (d) MOD13/MYD 13 2008 versus 2003 NDVI change. The above maps show map coordinates in terms of latitude and longitude.
Forests 10 00811 g004
Figure 5. Aerial data products compared to example MODIS forest mortality map produced from project: (a) aerial true color image at a 2.4-m resolution, showing dead red forests in red brown tones live forest in dark green tones, and mountain meadows in lighter green tones; (b) aerial false color image with red, near infrared, and green loaded into RGB channels, showing dead red forest in maroon brown, live forest in dark green, and mountain meadows in mint green tones; (c) recoded aerial forest conditions map by [34]; and (d) aerial percent forest mortality map spatially aggregated to the 240-m resolution. The above maps show map coordinates in terms of latitude and longitude.
Forests 10 00811 g005
Figure 6. Scatter plot with superimposed linear (black) and curvilinear exponential trend line (red) for overall highest observed r and r2 values between MODIS NDVI change map (shown in y-axis) and aerial reference forest mortality map (shown in x-axis). The MODIS product for above chart is based on TSPT processed MOD09/MYD09 daily NDVI data for 2008 compared to a 2003 baseline with extreme outliers removed. The regression equations for the two trend lines are given in the lower right of graph relative to the rescaled data, with the linear equation in black and the exponential equation in red. The data points are colorized and sized according to point frequency to help show shape and distribution of the data cloud.
Forests 10 00811 g006
Figure 7. Comparisons of aerial and MODIS-based forest mortality maps: (a) aerial percent forest mortality map; (b) aerial false color RGB image based on red, near infrared, and blue loaded into RGB channels; (c) MODIS MOD09/MYD09 percent forest mortality map for 2008 versus 2003 based on linear regression model; and (d) MODIS MOD09/MYD09% forest mortality map for 2008 versus 2003 based on curvilinear exponential-based regression model. The aerial false color RGB (b) shows dead red forest in brown, live forest in dark green, and mountain meadows in bright green tones. The above maps show map coordinates in terms of latitude and longitude.
Forests 10 00811 g007
Table 1. Description of MODIS data products used to develop percent forest mortality maps.
ProductSensorObservation ParameterTemporal ResolutionSpatial Resolution
MOD09TerraGround reflectance (atmospherically corrected)Daily250-m
MYD09AquaGround reflectance (atmospherically corrected)Daily250-m
MOD13TerraMaximum value 16-day NDVI1 calculated from high quality daily MOD09 data16 Day250-m
MYD13AquaMaximum value 16-day NDVI calculated from high quality daily MYD09 data16 Day250-m
NDVI1 = Normalized Difference Vegetation Index.
Table 2. Results of linear regression analysis comparing MODIS percent NDVI change to aerial percent forest mortality map, including r (correlation coefficient), r2 (coefficient of determination), and s (standard error of the regression). The number of observations was n = 1659, with no outliers removed.
StatisticPercent NDVI Change—MOD/MYD09 Daily 2008 vs. 2000Percent NDVI Change—MOD/MYD09 Daily 2008 vs. 2003Percent NDVI Change—MOD/MYD13 16 Day 2008 vs. 2000Percent NDVI Change—MOD/MYD13 16 Day 2008 vs. 2003
r0.6520.7380.6270.602
r20.4250.5440.3930.362
s16.38014.57716.82117.249
Table 3. Results of linear regression analysis comparing MODIS percent NDVI change to aerial percent forest mortality map with removal of spurious, most extreme outliers, including r (correlation coefficient), r2 (coefficient of determination), and s (standard error of the regression).
StatisticPercent NDVI Change—MOD/MYD09 Daily 2008 vs. 2000Percent NDVI Change—MOD/MYD09 Daily 2008 vs. 2003Percent NDVI Change–MOD/MYD13 16 Day 2008 vs. 2000Percent NDVI Change—MOD/MYD13 16 Day 2008 vs. 2003
r0.6920.7550.6370.723
r20.4790.5700.4060.523
s15.56414.15016.61114.888
Total Used Observations1654165816561655
Total Discarded Observations5134

