Review

Catering Information Needs from Global to Local Scales—Potential and Challenges with National Forest Inventories

1
Natural Resources Institute Finland (Luke), P.O. Box 68, 80101 Joensuu, Finland
2
Natural Resources Institute Finland (Luke), P.O. Box 2, 00791 Helsinki, Finland
3
Department of Forest Sciences, University of Helsinki, P.O. Box 27, 00014 Helsinki, Finland
*
Author to whom correspondence should be addressed.
Forests 2019, 10(9), 800; https://doi.org/10.3390/f10090800
Submission received: 16 August 2019 / Revised: 3 September 2019 / Accepted: 11 September 2019 / Published: 12 September 2019
(This article belongs to the Special Issue Forest Resources Assessments: Mensuration, Inventory and Planning)

Abstract

:
Forest information is needed at global, national and local scales. This review aimed at providing insights of potential of national forest inventories (NFIs) as well as challenges they have to cater to those needs. Within NFIs, the authors address the methodological challenges introduced by the multitude of scales the forest data are needed, and the challenges in acknowledging the errors due to the measurements and models in addition to sampling errors. Between NFIs, the challenges related to the different harmonization tasks were reviewed. While a design-based approach is often considered more attractive than a model-based approach as it is guaranteed to provide unbiased results, the model-based approach is needed for downscaling the information to smaller scales and acknowledging the measurement and model errors. However, while a model-based inference is possible in small areas, the unknown random effects introduce biased estimators. The NFIs need to cater for the national information requirements and maintain the existing time series, while at the same time providing comparable information across the countries. In upscaling the NFI information to continental and global information needs, representative samples across the area are of utmost importance. Without representative data, the model-based approaches enable provision of forest information with unknown and indeterminable biases. Both design-based and model-based approaches need to be applied to cater to all information needs. This must be accomplished in a comprehensive way In particular, a need to have standardized quality requirements has been identified, acknowledging the possibility for bias and its implications, for all data used in policy making.

1. Introduction

International agreements and processes, such as United Nations (UN) Sustainable Development Goals, UN Convention on Biological Diversity, UN Framework Convention on Climate Change, and Forest Europe require versatile monitoring of forests. International reporting processes, e.g., the Global Forest Resources Assessment (FRA) and Pan-European reporting for monitoring sustainable forest management, have been developed to meet these international information needs. These global monitoring processes are largely dependent on national forest inventories (NFIs). NFIs produce statistics based on a large, representative sample. At the same time, the availability of remote sensing material has enabled producing forest resources maps also based on smaller, experimental datasets [1]. These maps are increasingly used as an information source for policy making in addition to statistics. With a multitude of data available for decision making, it is more and more important that the decision makers have information on the quality of data used for decision making, and understand the implications of the uncertainties on the decisions.
Forest information is produced according to two different approaches, namely design-based or model-based approaches. The main difference between the two approaches is the reliance on the probability sample and model [2]. In a design-based approach, all inferences are based on the sampling design and known inclusion probabilities of the sampling units. While a model can be utilized in estimation using model-assisted estimation, the model does not need to be correct to improve the estimation efficiency. The design ensures design-unbiasedness, which means the parameter of interest on average equals the population parameter over all the possible samples obtainable with the given design. In the model-based approach, on the other hand, all inferences rely on an assumed model that describes the population. While the probability sample may be recommended, it is not the basis of inference. Instead, the validity of the inference depends solely on the validity of the model. In this context, the question is about model-unbiasedness, which means that the expected value of the parameter under the model equals the population parameter [3]. As it is never possible to state that a given model is correct, no guarantee of unbiasedness can be given.
The model-based approach enables optimizing the field data selection process, again assuming the model is correct. When it is not possible to obtain a probability sample, for instance when the plots in a probability sample are hard to access, a model-based approach may be the only option. In the model-based setting, the sampling design can be ignored, if the joint distribution of the variable of interest and the indicator of the sample inclusion do not depend on the auxiliary variable used in the model [4].
Traditional NFIs are based on field measurements using a design-based sample [5,6]. As NFIs have been initiated to respond to national needs, the sampling design and variables measured vary between countries [6]. To compare the national results between the countries or to sum up the national results to the European or global level, harmonization between countries is needed. The need for harmonization also includes the future projections of forests [7,8], especially due to the new policies and reporting obligations related to international agreements on deforestation, biodiversity, and forest carbon sinks and stocks.
The NFIs are constantly challenged by new information needs [9,10,11] resulting in an increasing number of variables that are collected in an NFI. Thus, the methods applied in NFIs need to be such that it is possible to cater for new needs when they emerge [10]. There is also an increasing demand for information in varying scales [12] and for monitoring change [13]. The challenge is that no single method can cater to all these simultaneous needs, but different approaches—both design-based and model-based [14,15]—need to be utilized. For instance, at the smallest scale, at the pixel level, the produced data are a map [16,17], which is always essentially model-based, irrespective if the field sample is collected as a probability sample or not. The use of a multitude of methods can, in turn, form a challenge in communicating the results and their accuracies [4].
The new remote sensing technologies and materials [18] have a great potential to improve the accuracy of the provided information through using models in the estimation [19,20,21]. It will also enable defining more efficient sample designs [22,23,24]. Specifically, remote sensing material enables downscaling the results to local scales [12,25]. Linking remote sensing with NFIs also calls for re-thinking the harmonization between countries.
Our aim is to review the potential of new data and methodology as well as challenges due to the increasing demands of information at varying scales within and between NFIs. Within NFIs, this review focuses on the potential of model-based and design-based estimators, challenges in error estimation and change detection. Between NFIs, potential and existing challenges of harmonization are considered. The discussion outlines the future development needs.

2. Potential and Challenges within NFIs

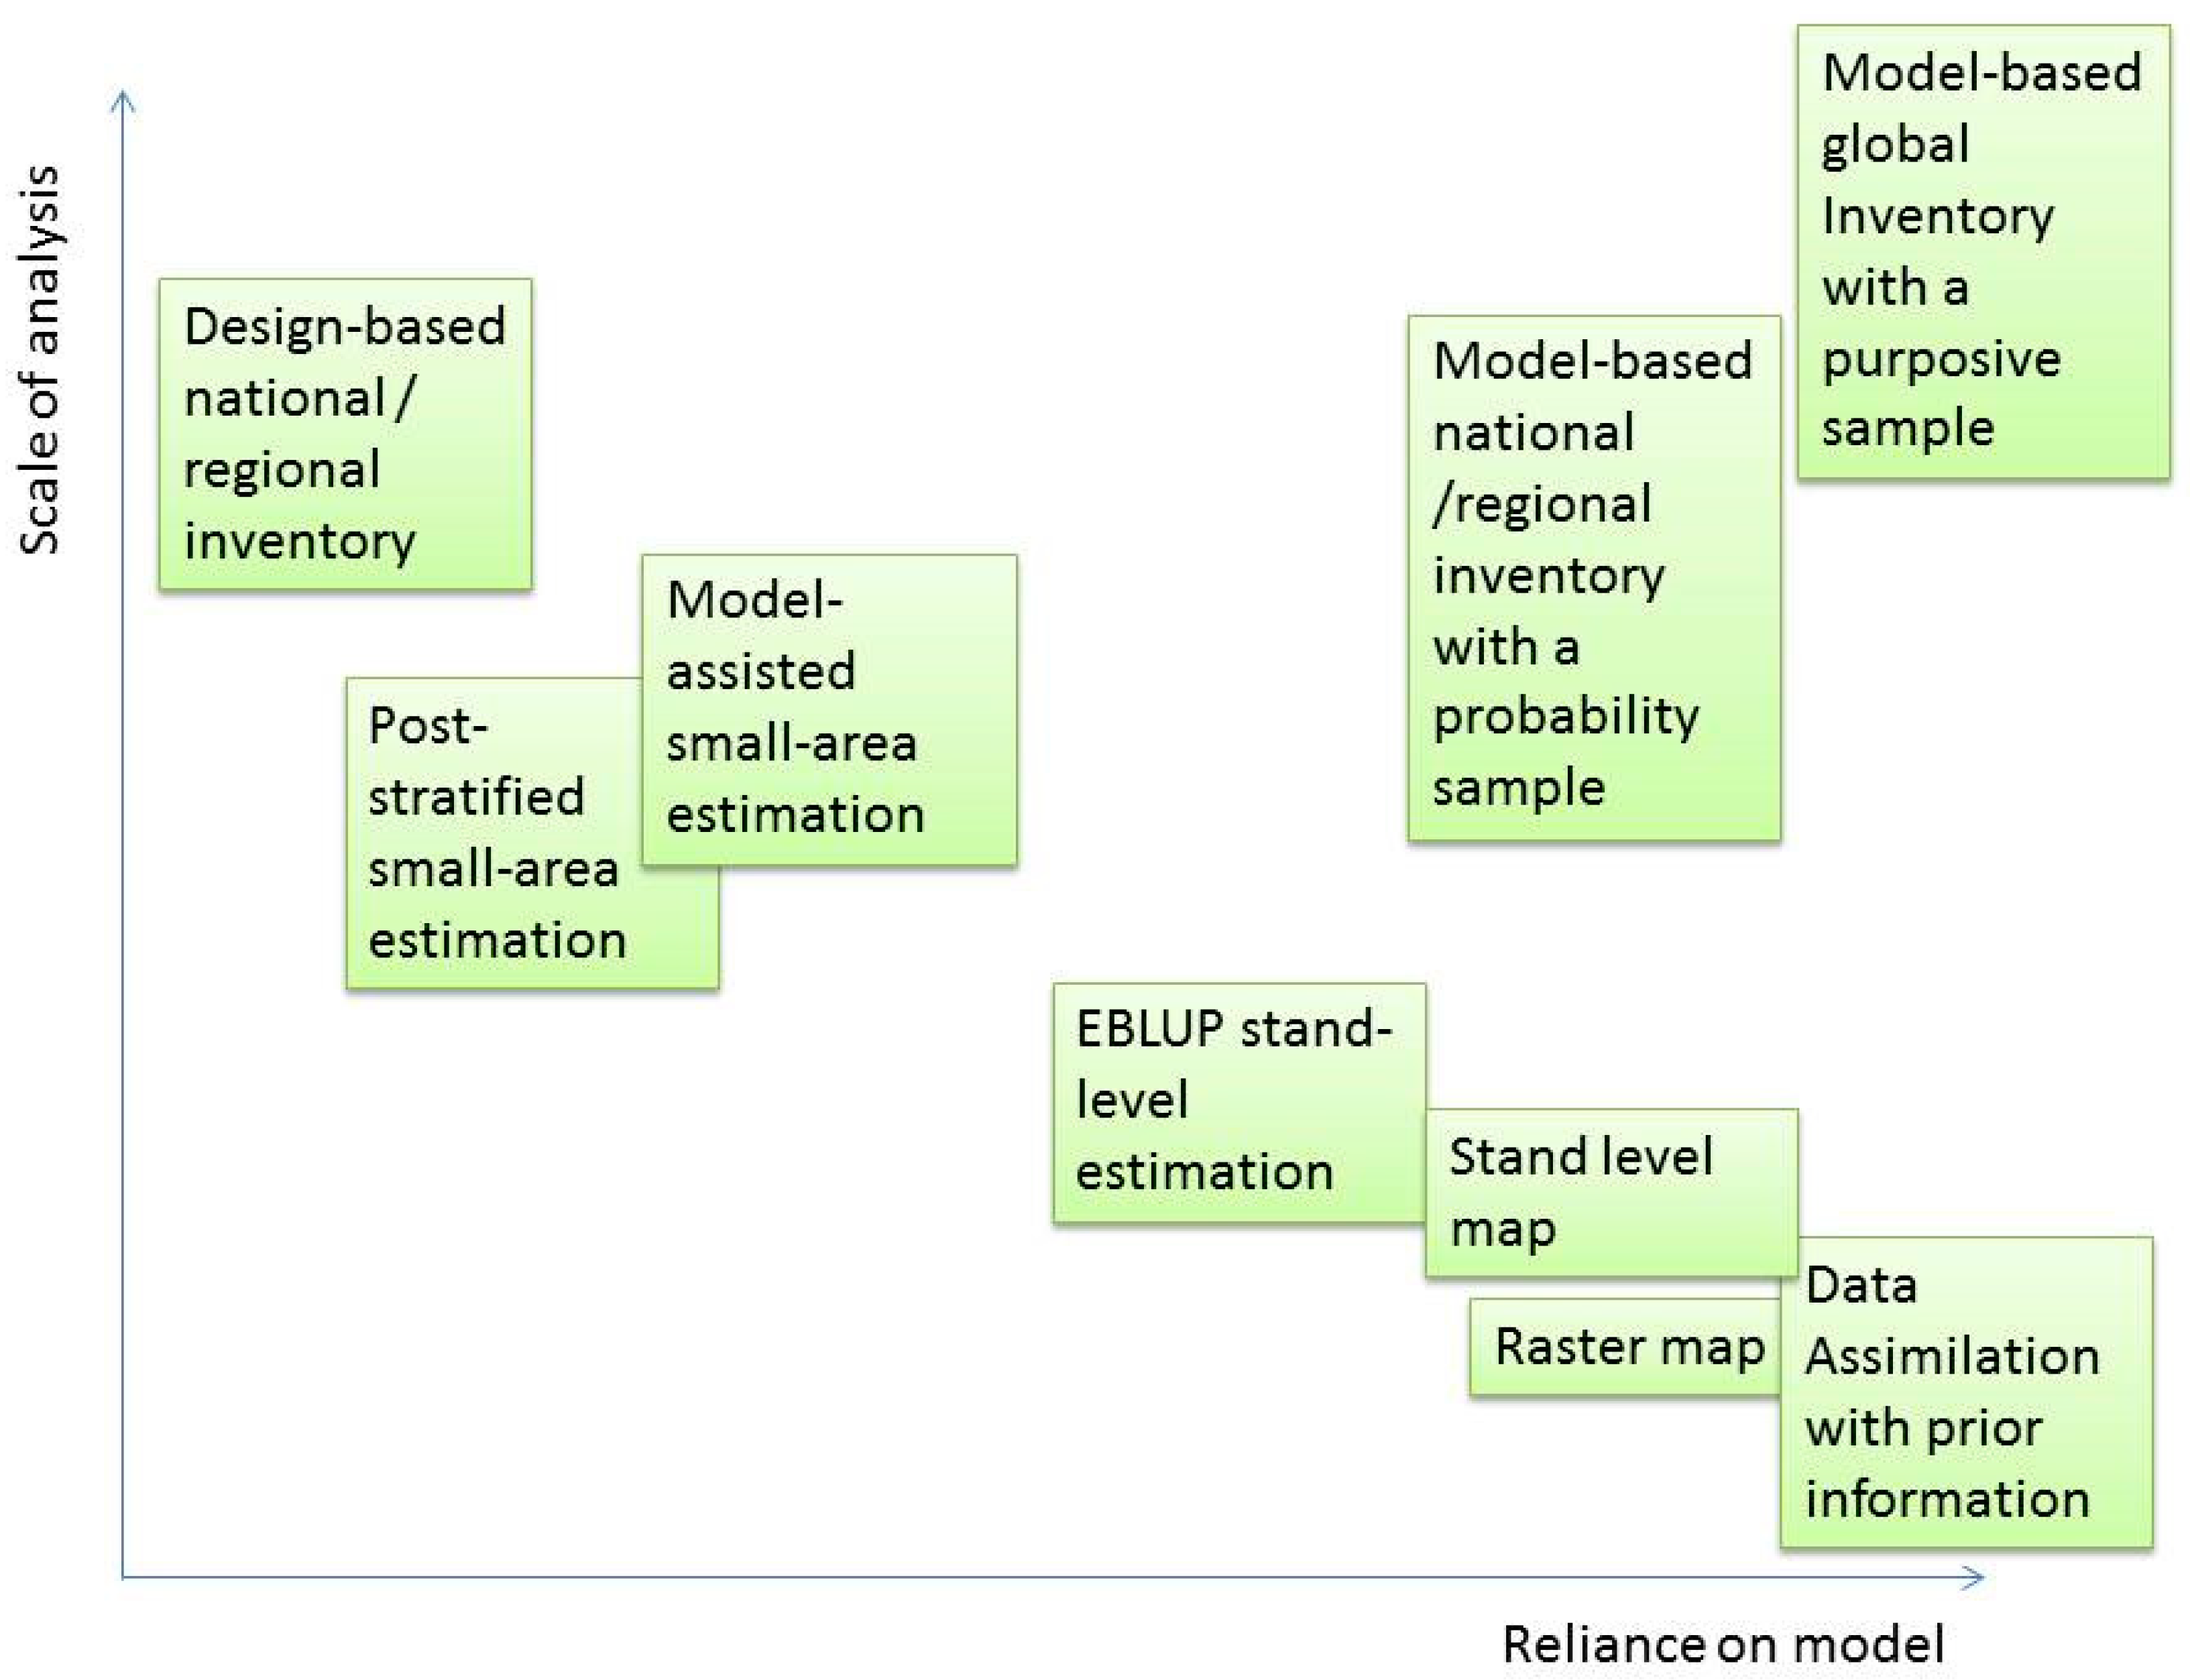
2.1. Dependence between Scale and Inference

By definition, the primary objective in an NFI in each country is to produce country-level results with known accuracy. However, in many countries, the NFI also produces information for the county level, municipality level, stand level and map information at the pixel level [26,27]. From a statistical point of view, the smaller scale estimates are small area estimators, which can be either design-based or model-based.
In the case of design-based sampling, the small area estimation requires field observations from the small area of interest. Those are used to calibrate the estimate according to the sample [28] (chapter 6). Post-stratification, for example, can be used for small-area estimation, when the small area still has reasonable amounts of plots in it [22,29,30]. Then, it is possible to have design-unbiased estimates for both the mean and variance.
When the scale goes smaller, the pressure to use plots from outside the area (i.e., to use synthetic, model-based estimators) increases [31]. A possibility in such a case is to utilize a composite of model-based and design-based estimator [32]. In the extreme case, at the stand level, most stands have zero plots and only a couple of stands have one (or more) plots. Then, a pure model-based approach is the only possibility. For instance, the area-based method used in forest management inventory is essentially a model-based method [27]. Thus, a model-based approach becomes more and more important as the scale gets smaller. The approaches relying on prior information, such as Kalman filter and/or Bayesian analysis might be used to enhance accurate results [33,34].
Using a model-based approach and borrowing strength from outside the inventory area, can also introduce a possibility of bias [4]. This is manifested in the statistically significant differences between the model-based and design-based estimators for the same small areas [35]. When the number of plots within the area of interest diminishes towards zero, the risk of area-level bias increases. Only approximate estimators of accuracy are then possible, as the true bias can never be estimated. However, many ways to approximate the possible bias exist [36,37].
If it were possible to estimate an area effect for all of the areas of interest, it could be used to estimate the bias component [29,38]. Often that is not possible, and for such a case, [28] (chapter 10.5) has proposed using a group effect for a group or similar domains or areas. It would also be possible to utilize the autocorrelation function and kriging-type estimation [31,39]. This means that instead of a constant correlation within the area of interest, a correlation depending on the distance between the plots is assumed. Both these approaches are based on a parametric model, while the predictions are often carried out using a non-parametric approach, such as the k-nearest neighbors method (k-NN) [40,41]. However, Lappi [31] (p. 1559) concluded that it is possible to use a variogram model to calculate the variance for the small area results also using a k-NN method, and Opsomer et al. [42] combine the use of a non-parametric trend to the random effects. On the other hand, Salvati et al. [43] proposed a bias-robust estimator based geographically weighted regression. The bias-robustness comes from the model giving larger weight to nearby plots.
The upscaling of design-based national forest inventories to continental or global levels are, in principle, easy. If all the countries had a design-based sample, the global results could be calculated by assuming a stratified sampling approach, where the administrational borders would serve as stratum borders. The differences in the sampling designs and intensities are not problematic, and analytical inferences are possible. Often, however, information for the large areas is obtained by aggregating pixel-level results based on remote sensing to the scale needed. As the pixel level results are model-based, so are the aggregated results. This means that the validity of the results lies solely on the validity of a used model. Estimating a valid model requires representative data across the area of interest. While it is possible to obtain such data with purposive sampling, a probability design is more likely to provide the needed data. Even with a representative data, it is a challenge to account for the differences in the conditions and forest types in a way that would provide even a near-unbiased model-based estimator in very large scales. With a purposive sample, a risk of unknown and indeterminable bias is even higher.
Thus, the dependency on the model (and/or prior information) increases as the scale gets either smaller or larger than the national level (Figure 1). The design-based approach is yet the most robust at a national or regional case, as then it is possible to guarantee design-unbiased results. Therefore, Chen et al. [44] argue that the design-based approach is a golden standard, which should be preferred.

2.2. Measurement and Model Errors

Traditionally, the information from the field plots in a probability sample has been assumed to be correct. However, the main variables of interest, such as the volume or above ground biomass, have been predicted using a model, not measured. Therefore, the model errors should be accounted for in the analyses [45,46,47], even though the contribution of such errors may be small compared to the sampling error. The model errors involved can also be due to the growth and yield models used in scenario predictions [48]. In addition, there may be measurement errors in the predictors that have a contribution [49].
Measurement errors have also been assumed to be negligible in the forest inventory, and the measurement errors in the basic variables such as diameters and heights measured with electronic devices are, indeed, small [50]. However, there is increasing interest in making the measurements using a terrestrial laser scanner TLS or mobile laser scanner MLS, and if those are used in the field data collection, the measurement errors are no more negligible. For instance, the tree heights and diameters measured with TLS or MLS can be seriously biased [51,52] and correct inclusion probabilities of trees may be difficult to obtain [53]. If such devices become common in NFI, including the measurement errors into the uncertainty analysis becomes important.
Chen et al. [54] defined model-related errors that affect the results as (1) model residual errors, (2) model parameter errors and (3) model predictor errors (see also [55]). The relative roles of these error sources depend on the scale of the analysis. For instance, while the residual errors of the models may be negligible in the large-scale estimation (national or regional level), they may well be dominant in smaller scales. Chen et al. [44] stated that in the pixel scale (13 m × 13 m), the uncertainty of the above ground biomass (AGB) estimates due to the residual errors is 55.8%, but when the scale is increased to 100, 200 and 300 m cells, this uncertainty reduces to 11%, 6.5% and 5.1%, respectively. However, this analysis is carried out assuming a zero autocorrelation between the plots, resulting from the 2700 m distance between the plots in the data used. In Finnish NFI using cluster sampling, the smallest distances between the plots are approximately 200–300 m, and a small but clear autocorrelation can be detected [56,57]. The higher the autocorrelation, the larger would be the contribution of the residual errors of the models in scales larger than the pixel level. However, McRoberts et al. [39] concluded that in scales larger than 75 km2, it is safe to ignore the autocorrelations between the pixels in the predictions in model-based estimation. When considering tree-level models, it is typical that the trees have a within-plot correlation (or plot effect [58]) with a similar effect than a short-term autocorrelation.
The estimation errors of the parameters are, in principle, due to the sampling errors in the data [15,44]. However, in reality it would be possible to interpret the parameter errors as model misspecification errors rather than as random errors. This is the case with regard to the tree level models, which are typically estimated from one specific dataset and then the same model is used in all future applications. If new models are estimated for each inventory, the interpretation of random parameter errors is more fitting. This may be the case with the pixel level models that are used to predict the AGB from selected airborne laser scanning (ALS) metrics for each campaign separately.
The errors in the predicting variables may be due to ALS points hitting birds or power lines or other obstacles [44]. Other important errors are the positional errors, which reduce the correlation between the auxiliary data and field plot data [59]. Saarela et al. [59] concluded that the model-based approach is less susceptible to the positional errors. The model-based and model-assisted estimators they compared have one term in common, namely the model predictions y ^ for each pixel. In addition, the model-assisted estimator has another term, which is designed to calibrate for the potential model errors using the observed sample, namely 1 n i = 1 n ( y i y ^ i ) . For the positional errors to have a larger effect on the model-assisted results means that the observed y i used for calibration has even larger error than the predicted y ^ i compared to the true value. This is likely an anomaly from the way the location errors are simulated.
The measurement and model errors can be introduced into the variance estimators of NFI through a so-called hybrid approach [2,60], including design-based sampling errors and model-based sampling, measurement or model errors. In the hybrid approach, the assumption is that there is a probability sample, but model-based estimation is used within the sampling units [46]. For instance, such sampling unit may be a strip of area where the laser scanning is available and the variable of interest (e.g., AGB) is estimated for the whole strip area using a model [61]. Then, both the errors due to sampling and the model need to be accounted for in the inference. It is also possible to combine a probabilistic and non-probabilistic sample [62] using the hybrid approach. However, the most obvious use of the hybrid inference would be introducing the model errors from the volume and biomass models into the analysis [58].
In a stand or small-area level, there may be random effects (stand-effect or area-effect) in the population. If those effects are ignored in the modelling phase, the resulting model is not correctly specified for the small areas of interest. This results in biased small-area estimators and introduces underestimates of variance [63]. In the studies carried out so far, the random part of the model error has been included, but the possible model misspecification bias and its importance have been mostly ignored (except for the included random effects in [63]).
Field plots are expensive, and therefore it would be tempting to use the data collected as a side product, such as data collected by logging machines instead of field plots [64]. Another option would be to utilize the data collected with very high-resolution remote sensing data, such as data collected with unmanned aerial vehicles (UAVs), instead of field plots. However, while such data may be cheap, the resulting data may be biased (due to e.g., omission of small trees or missing the tip of trees) and the uncertainty due to measurement and prediction errors is markedly higher than the actual field data. Using such data obviously introduces additional variation into the prediction models. On the other hand, the possibility to use more plots than would be possible when using sole field plots may alleviate this problem. However, if the data used as training data are biased, all the resulting forest data from the national scale to pixel scale will be biased. The importance of such bias is dependent on the application.
The most important source of error, however, may be the uncertainty concerning the model specification, i.e., the form of the function and the predictors selected to describe the relationship. For instance, [49] conclude that with the regional biomass models, the relative proportions of standard error due to the measurement, model and sampling errors were 5%, 2% and 93%, respectively. When they tested a common model for the regions, with models predicting the proportion of biomass from the bole, branches, bark and foliage, the respective proportions were 13%, 55% and 32%, i.e., the contribution of model errors was much higher. This directly reflects the uncertainty concerning the model specification. Partly, the large differences could be shown to result from extrapolation to extreme values [49].

2.3. Change Detection

One of the most important tasks of an NFI is to provide information of the change in the forests. This can be carried out using either a direct or indirect approach [13]. A direct approach means that plot-level information on the growth and drain, for instance, is available. The plot-level information can be based on re-measuring the sample plots (permanent plots) or taking increment cores for estimating the growth and measuring the stumps to estimate the harvests on temporary plots. If neither is available, the only possible approach is indirect, meaning that change is estimated from the difference between the two state estimates at given time points, t1 and t2. The indirect approach is problematic in a sense that it is not possible to separate the components of growth: Survivor growth, ingrowth, mortality, and harvest [65]. Utilizing remote sensing and model-assisted estimation is possible also in the case of change estimates, with the additional complications of the plots not shared, partially shared or completely shared between the two inventories [13].

3. Harmonization between NFIs

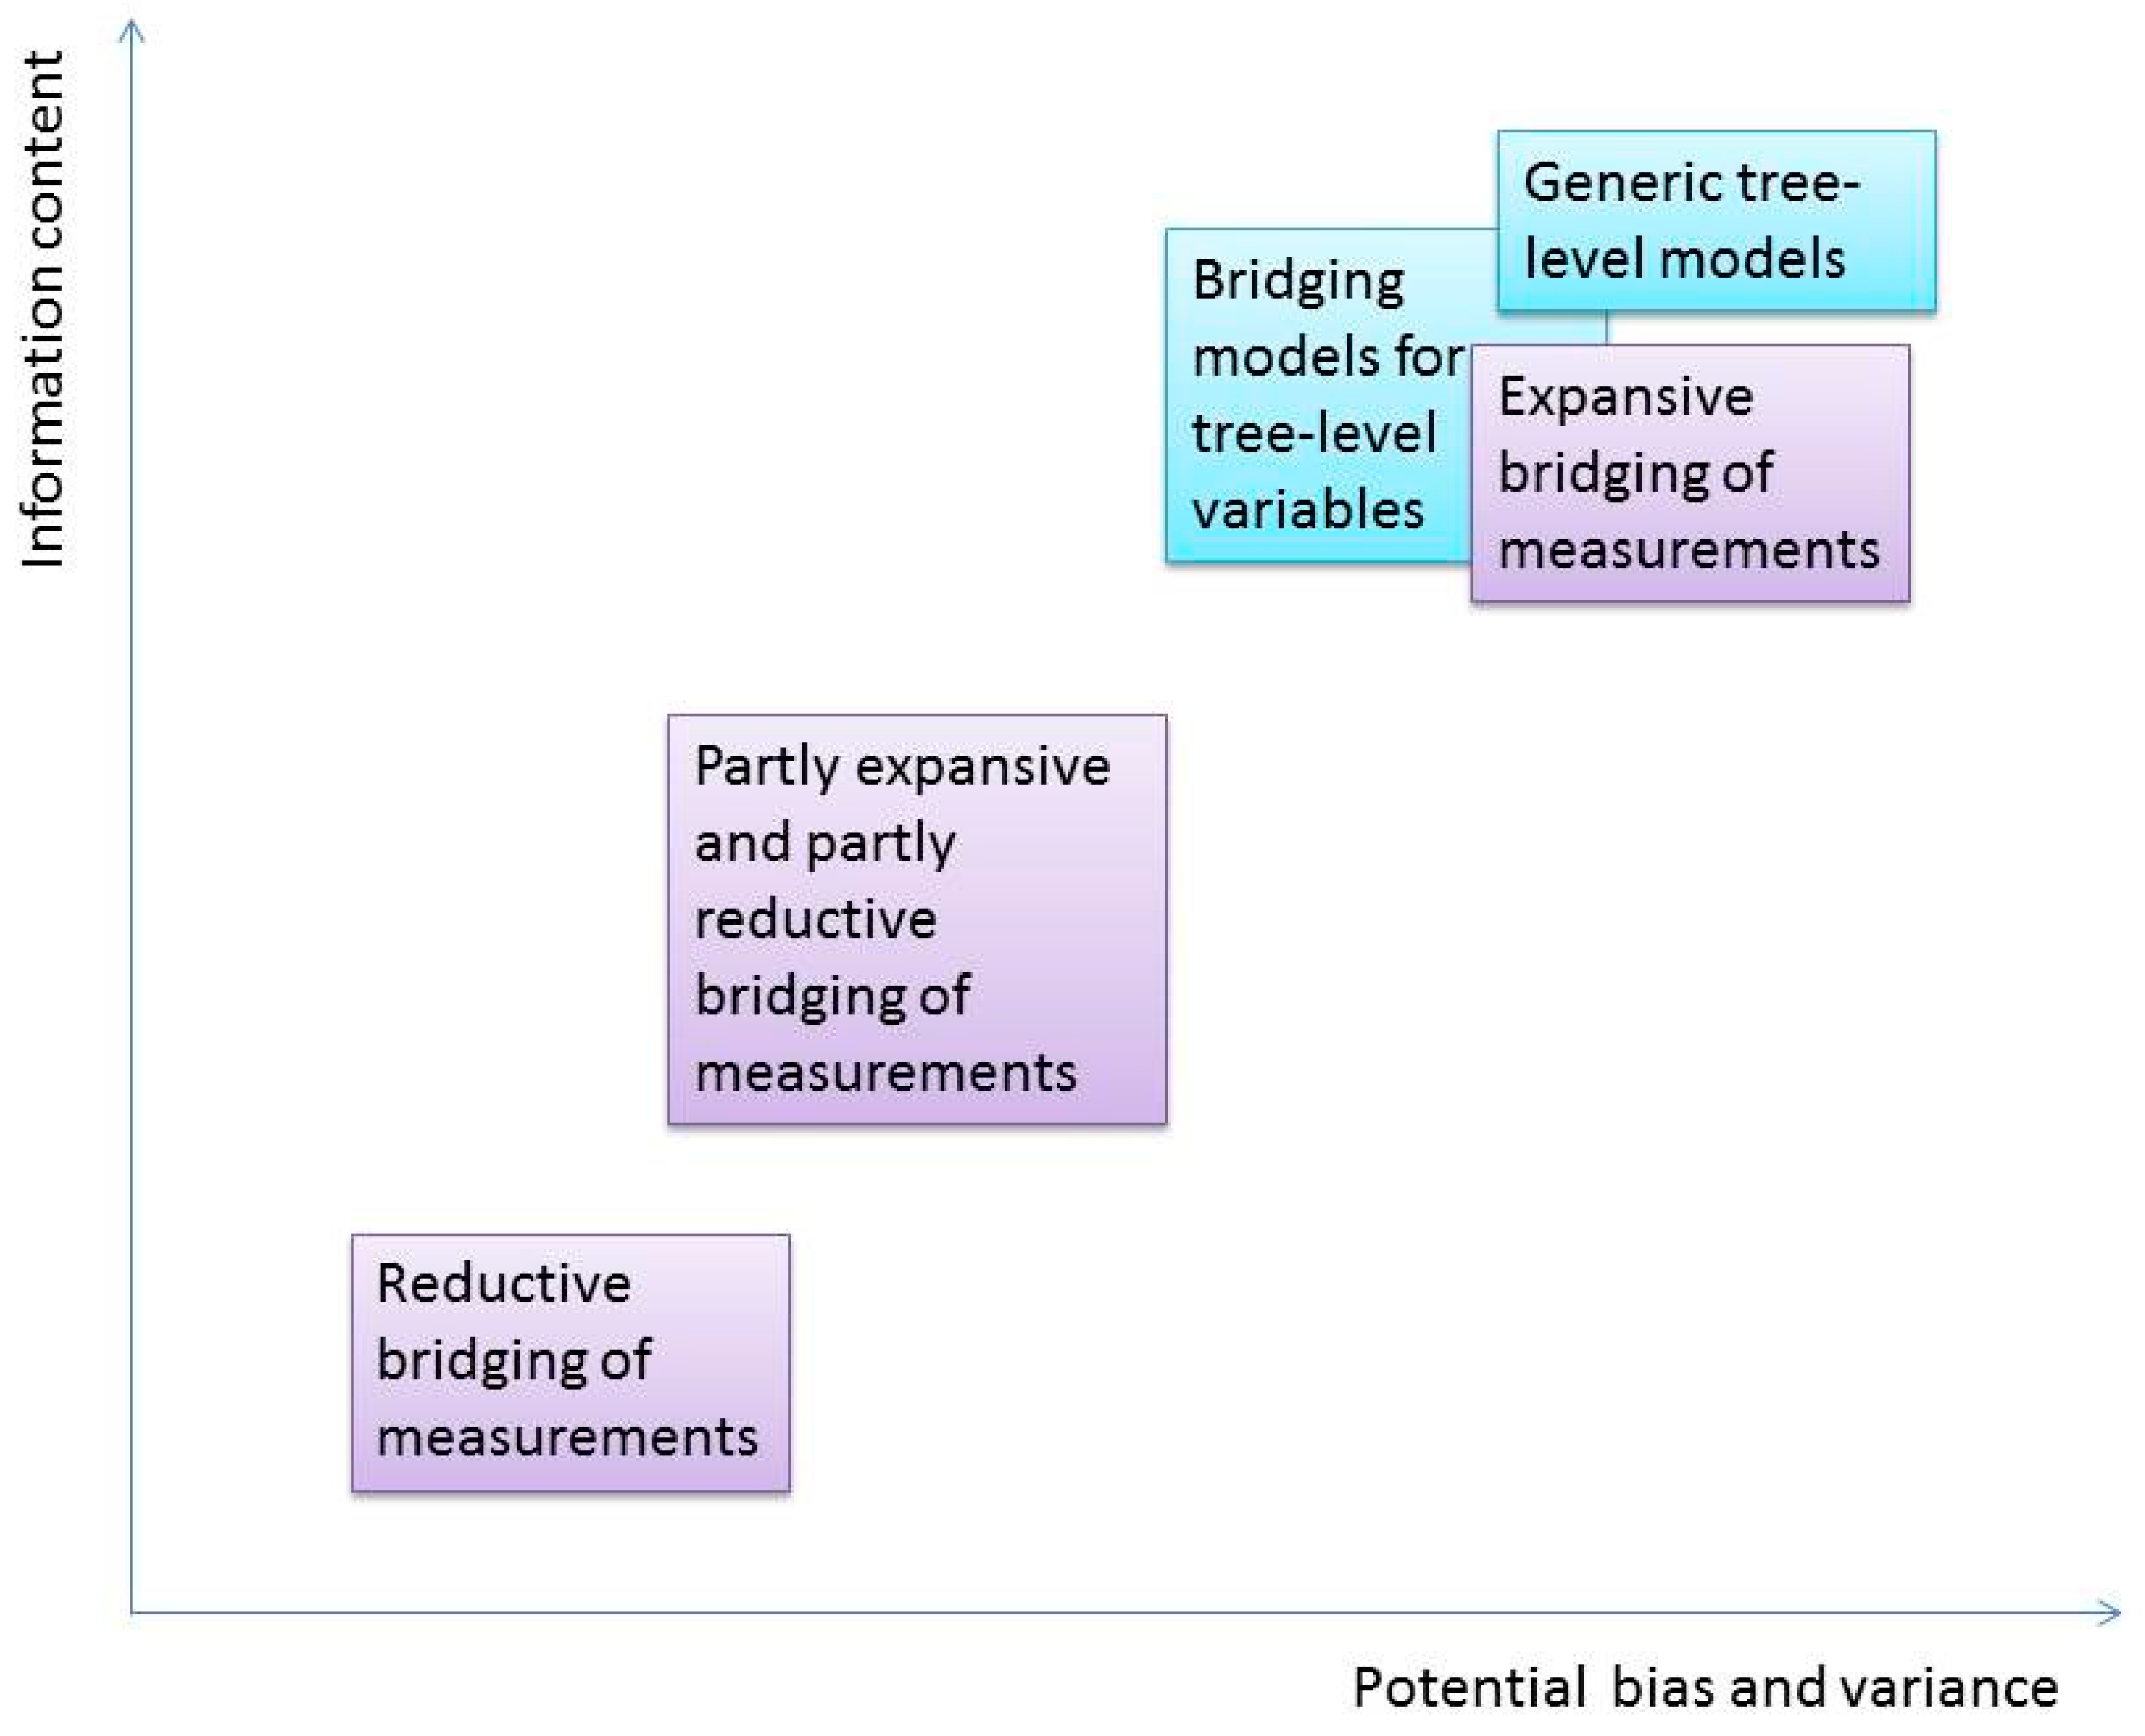
3.1. Implications on Measurements

If all countries had standardized definitions and measurements in their NFI, international reporting would be straightforward. Due to the regional differences in forests, traditions, economies and information priorities, different definitions, thresholds and measurement practices have been used in the data collection. The most critical discrepancy in harmonizing the inventory results has been due to the different definitions, like the definition of trees and forests [5,6]. As the forests and forest conditions differ, it is a challenge to introduce definitions that would suit the purposes of all countries [66]. It is already a challenge to have a common definition to a tree as opposed to a shrub [67].
The variation in the measurement thresholds is great. A well-known example of varying measuring conventions is the minimum threshold for the diameter at breat height (dbh) of trees to be included in the definition of growing stock. In Europe this varies from 0 cm in the Nordic countries to 12 cm in Switzerland [6,66]. Obviously, in each country there have been good practical reasons for selecting the minimum thresholds for measurement. In the relatively sparse northern forests, even low thresholds for trees cannot lead to an overwhelming work load in the measurements. In more dense forest ecosystems in the south, the same thresholds would lead to an impractical amount of work, and may produce irrelevant data for the original purpose of data collection. Further, a tree of a given size plays completely different role in different vegetation zones and forest types. A tree of 15 cm in diameter is a dominant tree in a mature forest in the most northern forests of Europe, where as a tree of the same size in most forest types in southern Europe is a youngster that recently passed the seedling stage.
Transferring from national definitions to common ones is not a straightforward solution. This could mean a loss of nationally important information or a national time series of forest inventories [68]. In those kinds of situations, the discrepancies need to be harmonized using a conversion of the end results rather than standardization of the original measurements [69].
In order to harmonize traditional design-based NFIs for international reporting, European NFIs have bridged national and reference definitions [68,70]. The bridging functions can be either reductive or expansive. In the case of a reductive bridging function, the original measurements are reduced to the smallest common nominator which serves as a reference definition [66,68]. It would mean that when the minimum diameter in Switzerland is highest, all other countries provide their inventory results so that all the information from trees smaller than 12 cm is used for national purposes, and only the results for the largest trees are used for international reporting. While this produces harmonized results, it also loses a considerable amount information that could potentially be important, including information from seedling stands or coppice stands.
In a case of expansive harmonization, the missing data are predicted using an auxiliary data source. For instance, instead of discarding all the measured small trees in the previous example, it would be possible to predict the number of small trees in a plot for the countries applying higher than the minimum measurement threshold, i.e., to use the smallest diameter as a reference definition. This would mean no loss of information in harmonization, but on the other hand it would mean reduced accuracy of the results, as a part of the data is based on predictions rather than measurements. It may also be difficult to obtain the additional data for such bridging functions, and using the data, for instance, from neighboring regions or countries may lead to a regional or national level bias. A compromise solution would then be to utilize a minimum threshold that is most common in the countries, which would mean the minimum amount of harmonization needed. Then, part of the countries would utilize reductive and part expansive bridging.
For biodiversity considerations, it would also be important to produce harmonized data on other plants than trees, e.g., shrubs. However, due to cultural, economic and ecological differences between the countries, there are large differences between the countries in which species are monitored, if any [71]. While differences between the measurement scales can be bridged, no bridging is possible without data. Another complicating fact is that a species may occur as a tree in one vegetation zone or forest type and as a shrub in another. In this situation, a meaningful international comparison requires also understanding of the ecosystems.

3.2. Implications on Information Contents

Even if the plot measurements were standardized, there would still be need for harmonization in the growing stock volumes. Most countries have some kind of volume models, but the models may have different explanatory variables (dbh, dbh and height, or dbh, height and upper diameter) and produce volume estimates with varying accuracy. Furthermore, the functional forms of volume models vary [72].
The tree-level volume estimates also vary in the sense that different parts of the stem are included in the estimates. The bole is included in all countries, but in some countries, the growing stock volume includes also the volume of the stump, tree top (volume from bole top diameter to the tip), and even large branches [72]. The additional challenge is introduced by different definitions for the stump height and for the bole top diameter. To overcome these differences, a reference definition needs to be defined, which can be used as a basis for bridging.
The reference definition developed for the volume included the stem volume above the stump, but not the branches [67]. Therefore, it is most useful for coniferous species with a clear stem, but might be less useful for broadleaved trees [72]. This may be a problem, as the branches can be utilized in the same way as the bole, and they may be important also from the greenhouse gas reporting point of view. Therefore, a set of reference definitions rather than just one definition, allows harmonization for different purposes while preserving the information content in the national level models (Figure 2). The bridging functions to as many as five different reference volumes have been estimated [72]. The differences between the volume models developed in each country and the reference volume defined in the harmonization process can be covered by using bridging functions or generic volume models.
Making a bridging function requires additional data in the case that an expansive bridge is used. In the case that no such auxiliary data exist, the bridging functions from similar conditions from other areas or countries may be used [68]. This, in turn, involves a risk of introducing bias into the estimators (Figure 2).

3.3. Implications on Modelling

The generic models applicable to all countries could be another solution. Even if the model form was fixed, the estimated national models can show large discrepancies [73]. In such a case, using a larger dataset across the countries might produce more stable volume and biomass models. However, the generic models may also mean less accurate results in the level of smaller areas, even if data are available from all countries. This would be the case if there is an unaccounted-for gradient (or area-effect) in the tree volume or biomass across the countries [74]. It is possible that part of such a gradient can be removed by introducing additional variables, such as the stand age, into the equations [75], but such data may not always be available. There may also be a gradient in time which would reflect the effect of changes in the forest management in time. Using models based on old data would then possibly introduce time-dependent (or forest management customs dependent) bias to the predictors across the whole area, rather than just in the country with the old data.
A H2020 project DIABOLO (Distributed, integrated and harmonized forest information for bioeconomy outlooks) has been working on the harmonization of the NFI results from different perspectives. The results show important differences between the national and generic volume models [76], which would lead to regional biases if the generic models were used instead of national models. It can be assumed that generic models are useful for those countries with no models or very poor-quality models, but may result in worse estimates for the countries with accurate and up-to-date national models. On the other hand, the misspecification of such generic models could potentially be reduced using similar approaches as in a model-based small-area estimation, for instance, the locally weighted parameters for the models [43].

3.4. Implications on Mapping

Spatially located information, i.e., a forest resources map, is useful for many applications. For instance, information on the distribution of forest ecosystems may be of importance for monitoring the provision of ecosystem services [8,77]. The problem is that the relevant indicators for one ecosystem service may well be quite different for different countries. For instance, when producing map information on the production of recreation possibilities at an EU level, while the service in itself may be the same, the indicators vary, because people in different parts of the EU appreciate different kinds of recreation areas. Then, there is an obvious trade-off between producing meaningful data at the national level and producing comparable information at the EU level. It needs to be questioned, if combining different types of land cover classes under the label “recreation area” is a better harmonization than defining it separately e.g., recreation forests, meadows and moors.
The well-established classification products, such as CORINE (coordination of information on the environment), produce harmonized land use land cover maps across Europe. However, the level of details in the product is quite low for making meaningful inferences at the regional or even national level. For instance, in general, the forests are classified to three classes: Broadleaved, mixed and coniferous forests [78]. However, CORINE maps may be useful for visualizing what is happening to the extent of the forest at a European level. In fact, the Corine Land Cover (CLC) 2018 map is already the 5th successive map since the project was initiated in 1985.
For national and regional level inferences, more details are typically needed. For instance, in Italy, a forest type map with 14 classes based on the dominant species are used instead of the classes of the CORINE product [79]. However, at the local level, a classification system of higher levels in detail still might be needed. If the bridging can be carried out by combining the more detailed classes to new ones, harmonized estimates can be obtained with a little work, as in reductive bridging. However, if the local classes have been developed for another purpose, and the new classes cannot be obtained by just combining the old classes, problems can arise [79]. For instance, the number of classes locally used may be different. Additionally, when the harmonized information is produced from the classifications made for different purposes, the resulting maps may not coincide well.

3.5. Implications on Change Estimation

In addition to the differences in measurements and information contents, NFIs have additional discrepancies that affect specifically the change estimation [65]. For instance, depending on the country, the inventory may be based on permanent plots, temporary plots or a combination of these two approaches. The inventory can be annual (plots are annually measured from the whole country) or discontinuous so that after one inventory is completed, there may be gap years without measurements. In addition, the periodicity, i.e., the time between two measurements may vary. This, in turn has an effect on the periods for which the growth estimates can be calculated. Therefore, an important issue in the harmonization is to allow for all countries to report the growth for the same periods.
If the growth estimation is based on temporary plots, it is difficult to separate the growth components. However, even though the growth components could be separated, some countries have chosen not to report the growth of the trees that died or harvested during the period considered [65].

3.6. Implications on Future Projections

The data for the projections vary from the use of NFI data sources in the countries where NFIs have been established and have run for some time, to the use of standwise forest inventory data and yield tables [7]. Due to the resulting variation in the definitions, the assumptions and modelling methods, up- or downscaling, the results obtained at a given scale may lead to biased estimators of wood supply in another scale used for evaluation. Furthermore here, common definitions are of utmost importance.
In the DIABOLO project, a forest biomass supply assessment template with associated guidelines and definitions was developed to promote the interpretation and inter-comparisons of different forest biomass supply assessments [80]. In this work, the earlier concept of “Forest Available for Wood Supply” (FAWS; [81,82] was found useful. The categories of “forest where any legal, economic, or specific environmental restrictions do not have a significant impact on the supply of wood” and “forest where legal, economic or specific environmental restrictions prevent any significant supply of wood” were distinguished as FAWS and “Forests Not Available for Wood Supply” (FNAWS), respectively [80]. In addition, “Forests with Restrictions on Availability for Wood Supply” (FRAWS) can be distinguished as forests where forestry operations are restricted but (near-natural) management and therefore also wood supply is possible [83]. While the definitions for FAWS and FNAWS are established by many NFIs [81,82], FRAWS are not standardly distinguished and the availability of wood projections for these areas may include many more uncertainties. When the categories are distinguished in the NFI data, they can be treated with different assumptions regarding forest management and, subsequently, more realistically accounted for the production possibilities of wood or other ecosystem services [83,84]. Vauhkonen and Packalen [85] additionally demonstrated that simulating shifts between these categories can be a feasible way to account for the effects of the assumed future land use policies.
The use of NFI data as an input for European-wide forest projections has been of interest for outlook studies [86,87]. Packalen et al. [88] recognized that studying actual forestry dynamics-driven effects required that the simulation tool could be more flexibly tailored with respect to country-specific forestry. The European forestry dynamics model (EFDM; [88]) that was developed to simulate forest development based on data from European NFIs was parameterized to include even-aged [88], uneven-aged [89] and, combining multiple Markov chain models, any-aged forest management [83]. In DIABOLO, the EFDM was used for the projections of 20 countries following the method described by [83] to adapt the EFDM to the forest structure prevailing and the management applied in each country [90]. The results obtained from this test were considered comparable between country groups such as those corresponding to [86] or at the European level due to the harmonized definitions, assumptions, and modelling methodology applied. However, because of maintaining country-specific forestry practices, the results retain the forestry characteristics typical to the initial countries. Further studies should consider a potential risk of over-harmonizing (see [90]). As the sustainability constraints for forest use differ between countries in Europe, their full harmonization would make sense only if the forestry policy across Europe was also harmonized.

4. Discussion

4.1. Maintaining the Time Series of NFIs in Changing Demands

With the increasing demand for data, the times series data collected for NFIs have shown their importance. For instance, in biodiversity monitoring, an important source of information concerning the changes in the environment are the NFI data. For example, in Finland, the NFI data have been available since year 1921 enabling the monitoring of some biodiversity indicators, such as large, old trees [91]. Inevitably, the importance of remote sensing data is increasing also in considerations of the time series of biodiversity [92], but the importance of field information is not diminishing. Nevertheless, the provision of meaningful data on the different ecosystem services remains as a challenge for the NFIs [77]. In the case of ecosystem services, the fact that the meaningful scale varies between the services is part of the challenge.
In Europe, forest policy is mainly decided at the national level, even though international agreements play an increasing role in outlining the policies. For the national level policies, e.g., forest programs, monitoring data harmonized over time are the most relevant. It is not enough to harmonize between countries. The results between subsequent inventories need to be harmonized if changes in the classifications, measurements or definitions are to occur. The well-established harmonization methods that can be applied without breaking the national time series exist [68].

4.2. Models as a Part of Forest Inventory

The models have an important role in calculating the inventory results. The uncertainties of models have always been acknowledged, but little has been done to include them in the uncertainty assessments. In the era of model-based and hybrid inference approaches, introducing the model uncertainties into the forest resources assessments is likely to increase in the future. However, the uncertainty due to model specification has been largely ignored until recently, but it may have a large effect on the accuracy of the harmonized inventory results [44]. The importance of the model specification, especially on the uncertainty in long run projections, suggests using a bridging function harmonizing the end result rather than the common generic models and standardized measurements. The role of bias due to model misspecification in general, and the possibilities of reducing such biases with locally weighted parametrizations should be subject to further research. In other words, the model would be generic, but the regional variation would be taken into account, and, consequently, the results would be both harmonized and accurate across the countries.
Thus far, the models utilized in the NFIs for map production and model-assisted estimation, for instance, have ranged from parametric regression to non-parametric k nearest neighbors. There is currently considerable interest in using the machine learning algorithms in remote sensing applications. The deep leaning methods, such as convolutional neural networks, are gaining more and more interest [93]. It is yet to be shown, if these methods would be applicable and/or useful in the context of forest inventory. If the new techniques enable formulating new metrics that would improve the accuracy of the models, utilizing the new methods might prove useful. For instance, utilizing remote sensing time series data, hyperspectral data or spatial neighborhood data might benefit from such new metrics.
Other methodological advancements currently under considerable interest are the Kalman filtering methods. These methods have so far mainly been utilized in estimating the pixel level or map results [34], but its application in the NFIs would involve using the plots measured in the previous inventory in addition to the current ones to improve accuracy [94]. Assumedly, the usefulness of this prior information is related to the scale of interest, sample size available and also the utilization of other auxiliary data. Moreover, the possibilities of Bayesian filtering in general, i.e., also for analyzing the past and predicting the future, are largely unacknowledged in the context of NFI.

4.3. Maintaining the Coherence of Results in Multiple Scales and Methodologies

Decision making at different regional levels benefits from the data that are harmonized over the regions. The cited literature showed that there are statistical methods that can be used for planning and implementing the data collection in such a way that the same data can serve different levels. Further, the advanced estimation methods, such as the model-supported inference, can and should be applied to improve the estimates/predictions based on the data. New remote sensing data with improved geographic and temporal resolution are available for auxiliary information.
The main challenge in the future is to be able to provide a coherent combination of results and methodologies in the various scales, so that the results are useful and trustworthy for the users of the data. There can be problems where the municipality level results do not add up to the regional level, or the regional level results do not add up to the national level results. There may be cases where some variables are calculated using one methodology such as model-assisted estimation, while others are estimated using some other method, such as post-stratification. For some variables, prior information from the previous inventory may be useful, while for others utilizing only the most recent information is the best option.
Great challenges remain in applying the advanced statistical methods in practice. The methods need to be implemented in forest information systems in such a way that utilization of the methods is possible. Examples exist at a national level (Sweden, Finland, Switzerland), and now for the first time at a European level, for instance, the nFiesta package which includes tools for imputation and updating [95].
In addition to the statistics of current forest resources, future projections are a major potential use for NFI data. Notably, the outcomes of future projections vary depending on the scenario assumptions, i.e., multiple factors that are not directly related to the current estimates of forest resources as provided by the NFIs. For example, future forest resources and the degree of them that is available for different uses, such as wood production or carbon sequestration, evolve according to the markets and climate. Further, the factors that are unknown at the moment, like future management regimes and even ownership structures, can have complex interactions with the development of forest resources.
The projections often assume that future management practices and their intensities are realized according to silvicultural instructions (also called as handbook harvesting by [96]). By comparing handbook harvests to those realized amongst the regions, owners, tree species and diameter classes, Schelhaas et al. [96] concluded that assuming a handbook type of harvesting is not feasible, if the scenarios aim at capturing realistic management patterns. Vauhkonen and Packalen [83] demonstrated the magnitude of assuming either handbook (in their study, schoolbook) or business-as-usual harvesting probabilities and different harvest allocations in their projections of future forest biomass supply in Finland. Nevertheless, the assumptions related to future forest management may be fixed in computation rules, of which the “continuation of forest management” as applied in the LULUCF Regulation (The Regulation on the inclusion of greenhouse gas emissions and removals from land use, land use change and forestry, EU, No 2018/841) is a recent example. Several studies have already considered the effects of this principle from different points of view [84,97,98].

5. Conclusions

While National Forest Inventories were designed to provide information for the regional and national scales, information is increasingly required at different scales from the pixel level to the global level. This introduces challenges, as to cater for all these needs, a toolbox of different methods needs to be adopted. The design-unbiased results at the regional and national scales can be obtained, but both upscaling and downscaling the information requires a model-based approach with possibly biased estimators. Acknowledging the potential for bias is important both in the use of forest resources maps for decision making and also in harmonizing the NFI results between the countries.

Author Contributions

Conceptualization, A.K., T.P., K.T.K.; writing—original draft preparation, A.K.; writing—review & editing, A.K., M.R., K.T.K., J.V., T.P.; funding acquisition, T.P.

Funding

This project has received funding from the European Union’s Horizon 2020 research and innovation programme, DIABOLO project “Distributed, integrated and harmonized forest information for bioeconomy outlooks”, UE Grant Agreement No 633464.

Conflicts of Interest

The authors declare no conflicts of interest.

References

  1. Ni, X.; Zhou, Y.; Cao, C.; Wang, X.; Shi, Y.; Park, T.; Choi, S.; Myneni, R.B. Mapping forest canopy height over continental China using multi-source remote sensing data. Remote Sens. 2015, 7, 8436–8452. [Google Scholar] [CrossRef]
  2. Ståhl, G.; Saarela, S.; Schnell, S.; Holm, S.; Breidenbach, J.; Healey, S.P.; Patterson, P.L.; Magnussen, S.; Næsset, E.; McRoberts, R.E.; et al. Use of models in large-area forest surveys: Comparing model-assisted, model-based and hybrid estimation. For. Ecosyst. 2016, 3, 5. [Google Scholar] [CrossRef]
  3. Nedyalkova, D.; Tillé, Y. Bias-robustness and efficiency of model-based inference in survey sampling. Stat. Sin. 2012, 22, 777–794. [Google Scholar] [CrossRef]
  4. Magnussen, S. Arguments for a model-dependent inference? Forestry 2015, 88, 317–325. [Google Scholar] [CrossRef]
  5. National Forest Inventories—Pathways for Common Reporting; Tomppo, E.; Gschwantner, T.H.; Lawrence, M.; McRoberts, R.E. (Eds.) Springer: Berlin/Heidelberg, Germany, 2010. [Google Scholar]
  6. National Forest Inventories—Assessment of Wood Availability and Use; Vidal, C.; Alberdi, I.; Hernandez, L.; Redmond, J. (Eds.) Springer: Berlin/Heidelberg, Germany, 2016; p. 845. [Google Scholar]
  7. Barreiro, S.; Schelhaas, M.-J.; Kändler, G.; Anton-Fernandez, C.; Colin, A.; Bontemps, J.-D.; Alberdi, I.; Condes, S.; Dumitru, M.; Ferezliev, A.; et al. Overview of methods and tools for evaluating future woody biomass availability in European countries. Ann. For. Sci. 2016, 73, 823–837. [Google Scholar] [CrossRef] [Green Version]
  8. Marchi, M.; Ducci, F. Some refinements on species distribution models using tree-level National Forest Inventories for supporting forest management and marginal forest population detection. iForest 2018, 11, 291–299. [Google Scholar] [CrossRef] [Green Version]
  9. Chirici, G.; McRoberts, R.E.; Winter, S.; Bertini, R.; Braendli, U.-B.; Asensio, I.A.; Bastrup-Birk, A.; Rondeux, J.; Barsoum, N.; Marchetti, M. National forest inventory contributions to forest biodiversity monitoring. For. Sci. 2012, 58, 257–268. [Google Scholar] [CrossRef]
  10. Fridman, J.; Holm, S.; Nilsson, M.; Nilsson, P.; Ringvall, A.H.; Ståhl, G. Adapting national forest inventories to changing requirements—The case of the Swedish National Forest Inventory at the turn of the 20th century. Silva Fennica 2016, 48, 1095. [Google Scholar] [CrossRef]
  11. Corona, P. Consolidating new paradigms in large-scale monitoring and assessment of forest ecosystems. Environ. Res. 2016, 144, 8–14. [Google Scholar] [CrossRef] [Green Version]
  12. Breidenbach, J.; Astrup, R. Small area estimation of forest attributes in the Norwegian National Forest Inventory. Eur. J. For. Res. 2012, 131, 1255–1267. [Google Scholar]
  13. Massey, A.; Mandallaz, D. Design-based regression estimation of net change for forest inventories. Can. J. Res. 2015, 45, 1775–1784. [Google Scholar] [CrossRef]
  14. Gregoire, T.G.; Ståhl, G.; Næsset, E.; Gobakken, T.; Nelson, R.; Holm, S. Model-assisted estimation of biomass in a LiDAR sample survey in Hedmark County, Norway. Can. J. Res. 2011, 41, 83–95. [Google Scholar] [CrossRef]
  15. Ståhl, G.; Holm, S.; Gregoire, T.G.; Gobakken, T.; Næsset, E.; Nelson, R. Model-based inference for biomass estimation in a LiDAR sample survey in Hedmark County, Norway. Can. J. Res. 2011, 41, 96–107. [Google Scholar] [CrossRef]
  16. Nord-Larsen, T.; Schumacher, J. Estimation of forest resources from a country wide laser scanning survey and national forest inventory data. Remote Sens. Environ. 2012, 119, 148–157. [Google Scholar] [CrossRef]
  17. Nilsson, M.; Nordkvist, K.; Jonzén, J.; Lindgren, N.; Axensten, P.; Wallerman, J.; Egberth, M.; Larsson, S.; Nilsson, L.; Eriksson, J.; et al. A nationwide forest attribute map of Sweden predicted using airborne laser scanning data and field data from the national forest inventory. Remote Sens. Environ. 2017, 194, 447–454. [Google Scholar] [CrossRef]
  18. Rahlf, J.; Breidenbach, J.; Solberg, S.; Næsset, E.; Astrup, R. Comparison of four types of 3D data for timber volume estimation. Remote Sens. Environ. 2014, 155, 325–333. [Google Scholar]
  19. Saarela, S.; Grafström, A.; Ståhl, G.; Kangas, A.; Holopainen, M.; Tuominen, S.; Nordkvist, K.; Hyyppä, J. Model-assisted estimation of forest resources using different combinations of LiDAR and Landsat data as auxiliary information. Remote Sens. Environ. 2015, 158, 431–440. [Google Scholar] [CrossRef]
  20. Kangas, A.; Myllymäki, M.; Gobakken, T.; Næsset, E. Model-assisted forest inventory with parametric, semi-parametric and non-parametric models. Can. J. Res. 2016, 46, 855–868. [Google Scholar] [CrossRef]
  21. Myllymäki, M.; Gobakken, T.; Næsset, E.; Kangas, A. The efficiency of post-stratification compared to model-assisted estimation. Can. J. Res. 2017, 47, 515–526. [Google Scholar] [CrossRef]
  22. Grafström, A.; Saarela, S.; Ene, L. Efficient sampling strategies for forest inventories by spreading the sample in auxiliary space. Can. J. Res. 2014, 44, 1156–1164. [Google Scholar] [CrossRef]
  23. Grafström, A.; Zhao, X.; Nylander, M.; Petersson, H. A new sampling strategy for forest inventories applied to the temporary clusters of the Swedish national forest inventory. Can. J. Res. 2017, 47, 1161–1167. [Google Scholar] [CrossRef]
  24. Räty, M.; Heikkinen, J.; Kangas, A. Assessment of sampling strategies utilizing auxiliary information in large-scale forest inventory. Can. J. Res. 2018, 48, 749–757. [Google Scholar] [CrossRef]
  25. Haakana, H.; Heikkinen, J.; Kangas, A. Efficiency of post-stratification for a large-scale forest inventory—Case Finnish NFI. Ann. For. Sci. 2019, 76, 9. [Google Scholar] [CrossRef]
  26. Corona, P. Integration of forest mapping and inventory to support forest management. Iforest Biogeosci. For. 2010, 3, 59–64. [Google Scholar] [CrossRef]
  27. Kangas, A.; Astrup, R.; Breidenbach, J.; Fridman, J.; Gobakken, T.; Korhonen, K.T.; Maltamo, M.; Nilsson, M.; Nord-Larsen, T.; Næsset, E.; et al. Remote sensing and forest inventories in Nordic countries—Roadmap for the future. Scand. J. For. Res. 2018, 33, 397–412. [Google Scholar] [CrossRef]
  28. Särndal, C.E.; Swensson, B.; Wretman, J. Model Assisted Survey Sampling; Springer: Berlin/Heidelberg, Germany, 1992; p. 694. [Google Scholar]
  29. Magnussen, S.; Mandallaz, D.; Breidenbach, J.; Lanz, A.; Ginzler, C. National forest inventories in the service of small area estimation of stem volume. Can. J. Res. 2014, 44, 1079–1090. [Google Scholar] [CrossRef]
  30. Pulkkinen, M.; Ginzler, C.; Traub, B.; Lanz, A. Stereo-imagery-based post-stratification by regression-tree modelling in Swiss National Forest Inventory. Remote Sens. Environ. 2018, 213, 182–194. [Google Scholar] [CrossRef]
  31. Lappi, J. Forest inventory of small areas combining the calibration estimator and a spatial model. Can. J. Res. 2001, 31, 1551–1560. [Google Scholar] [CrossRef]
  32. Goerndt, M.E.; Monleon, V.J.; Temesgen, H. Small-area estimation of county-level forest attributes using ground data and remote sensed auxiliary information. For. Sci. 2013, 59, 536–548. [Google Scholar] [CrossRef]
  33. Ehlers, S.; Grafström, A.; Nyström, K.; Olsson, H.; Ståhl, G. Data assimilation in stand-level forest inventories. Can. J. Res. 2013, 43, 1104–1113. [Google Scholar] [CrossRef]
  34. Nyström, M.; Lindgren, N.; Wallerman, J.; Grafström, A.; Muszta, A.; Nyström, K.; Bohlin, J.; Willén, E.; Fransson, J.E.S.; Ehlers, S.; et al. Data assimilation in forest inventory: First empirical results. Forests 2013, 6, 4540–4557. [Google Scholar] [CrossRef]
  35. Haakana, H.; Katila, M.; Heikkinen, J.; Kangas, A. Post-Stratification Based on Satellite Imagery for Downscaling Information on Forest Resources from the Finnish National Forest Inventory. Canadian J. For. Res. submitted for publication.
  36. Breidenbach, J.; McRoberts, R.E.; Astrup, R. Empirical coverage of model-based variance estimators for remote sensing assisted estimation of stand-level timber volume. Remote Sens. Environ. 2015, 173, 274–281. [Google Scholar] [CrossRef] [PubMed] [Green Version]
  37. Magnussen, S.; Frazer, G.; Penner, M. Alternative mean-squared error estimators for synthetic estimators of domain means. J. Appl. Stat. 2016, 1, 24. [Google Scholar] [CrossRef]
  38. Breidenbach, J.; Magnussen, S.; Rahlf, J.; Astrup, R. Unit-level and area-level small area estimation under heteroscedasticity using digital areal photogrammetry data. Remote Sens. Environ. 2018, 212, 199–211. [Google Scholar] [CrossRef]
  39. McRoberts, R.E.; Næsset, E.; Gobakken, T.; Chirici, G.; Condés, S.; Hou, Z.; Saarela, S.; Chen, Q.; Ståhl, G.; Walters, B.F. Assessing components of model-based mean square error estimator for remote sensing assisted forest applications. Can. J. Res. 2018, 48, 642–649. [Google Scholar] [CrossRef]
  40. Chirici, G.; Mura, M.; McInerney, D.; Py, N.; Tomppo, E.O.; Waser, L.T.; Travaglini, D.; McRoberts, R.E. A meta-analysis and review of the literature on the k-Nearest Neighbors technique for forestry applications that use remotely sensed data. Remote Sens. Environ. 2016, 176, 282–294. [Google Scholar] [CrossRef]
  41. McInerney, D.; Barrett, F.; McRoberts, R.E.; Tomppo, E. Enhancing the Irish NFI using k-nearest neighbors and a genetic algorithm. Can. J. Res. 2018, 48, 1482–1494. [Google Scholar] [CrossRef]
  42. Opsomer, J.D.; Claeskens, G.; Ranalli, M.G.; Kauermann, G.; Breidt, F.J. Non-parametric small area estimation using penalized spline regression. J. R. Stat. Soc. 2008, 70, 265–286. [Google Scholar] [CrossRef]
  43. Salvati, N.; Tzavidis, N.; Pratesi, M.; Chambers, R. Small area estimation via M-quantile geographically weighted regression. Test 2012, 21, 1–28. [Google Scholar] [CrossRef]
  44. Chen, Q.; McRoberts, R.E.; Wang, C.; Radtke, P.J. Forest aboveground biomass mapping and estimation across multiple spatial scales using model-based inference. Remote Sens. Environ. 2016, 184, 350–360. [Google Scholar] [CrossRef]
  45. Ståhl, G.; Heikkinen, J.; Petersson, H.; Repola, J.; Holm, S. Sample-based estimation of greenhouse gas emissions from forests—A new approach to account for both sampling and model errors. Forest Sci. 2014, 60, 3–13. [Google Scholar] [CrossRef]
  46. Corona, P.; Fattorini, L.; Franceschi, S.; Scrinzi, G.; Torresan, C. Estimation of standing wood volume in forest compartments by exploiting airborne laser scanning information: Model-based, design-based, and hybrid perspectives. Can. J. For. Res. 2014, 44, 1303–1311. [Google Scholar] [CrossRef]
  47. Fortin, M.; Manso, R.; Schneider, R. Parametric bootstrap estimators for hybrid inference in forest inventories. Forestry 2018, 91, 354–365. [Google Scholar] [CrossRef]
  48. Melo, L.; Schneider, R.; Fortin, M. Estimating model-and sampling-related uncertainty in large-area growth predictions. Ecol. Model. 2018, 390, 62–69. [Google Scholar] [CrossRef]
  49. Shettles, M.; Temesgen, H.; Gray, A.N.; Hilker, T. Comparison of uncertainty per unit area estimates of aboveground biomass for two selected model sets. For. Ecol. Manag. 2015, 354, 18–25. [Google Scholar] [CrossRef]
  50. Päivinen, R.; Nousiainen, M.; Korhonen, K.T. Puutunnusten mittaamisen luotettavuus summary: Accuracy of certain tree measurements. Folia For. 1992, 787, 18, (In Finnish with English summary). [Google Scholar]
  51. Liang, X.; Hyyppä, J.; Kaartinen, H.; Lehtomäki, M.; Pyörälä, J.; Pfeifer, N.; Holopainen, M.; Brolly, G.; Francesco, P.; Hackenberg, J.; et al. International benchmarking of terrestrial laser scanning approaches for forest inventories. ISPRS J. Photogramm. Remote Sens. 2018, 144, 137–179. [Google Scholar] [CrossRef]
  52. Pitkänen, T.P.; Raumonen, P.; Kangas, A. Measuring TLS-based stem diameters in boreal forests by cylinder-based complementary fitting procedure. ISPRS J. Photogramm. Remote Sens. 2019, 147, 294–306. [Google Scholar] [CrossRef]
  53. Kuronen, M.; Henttonen, H.M.; Myllymäki, M. Correcting for nondetection in estimating forest characteristics from single-scan terrestrial laser measurements. Can. J. For. Res. 2019, 49, 96–103. [Google Scholar] [CrossRef]
  54. Chen, Q.; Laurin, G.V.; Valentini, R. Uncertainty of remotely sensed aboveground biomass over an Afrian tropical forest: Propagating errors from trees to plots to pixels. Remote Sens. Environ. 2015, 160, 134–143. [Google Scholar] [CrossRef]
  55. Kangas, A. On the bias and variance of tree volume predictions due to model and measurement errors. Scand. J. For. Res. 1996, 11, 281–290. [Google Scholar] [CrossRef]
  56. Päivinen, R. Metsän Inventoinnin Suunnittelumalli. Summary: A Planning Model for Forest Inventory. Joensuun Yliopiston Luonnontieteellisiä Julkaisuja; Joensuun Yliopisto: Joensuu, Finland, 1987; pp. 11–179. [Google Scholar]
  57. Räty, M.; Heikkinen, J.; Kangas, A. Kriging with External Drift in Model Localization. Math. Comput. For. Nat. Resour. Sci. 2011, 3, 1–14. [Google Scholar]
  58. Breidenbach, J.; Antón-Fernández, C.; Petersson, H.; McRoberts, R.E.; Astrup, R. Quantifying the model-related variability of biomass stock and change estimates in the Norwegian national forest inventory. For. Sci. 2014, 60, 25–33. [Google Scholar] [CrossRef]
  59. Saarela, S.; Schnell, S.; Tuominen, S.; Balazs, A.; Hyyppä, J.; Grafström, A.; Ståhl, G. Effects of positional errors in model-assisted and model-based estimation of growing stock volume. Remote Sens. Environ. 2016, 172, 101–108. [Google Scholar] [CrossRef]
  60. Holm, S.; Nelson, R.; Ståhl, G. Hybrid three-phased estimators for large-area forest inventory using ground plots, airborne lidar and space lidar. Remote Sens. Environ. 2017, 197, 85–97. [Google Scholar] [CrossRef]
  61. Saarela, S.; Holm, S.; Grafström, A.; Schnell, S.; Næsset, E.; Gregoire, T.G.; Nelson, R.F.; Ståhl, G. Hierarchical model-based inference for forest inventory utilizing three sources of information. Ann. For. Sci. 2016, 73, 895–910. [Google Scholar] [CrossRef] [Green Version]
  62. Ene, L.; Gobakken, T.; Andersen, H.-E.; Næsset, E.; Cook, B.D.; Morton, D.C.; Babcock, C.; Nelson, R. Large-area hybrid estimation of aboveground biomass in interior Alaska using airborne laser scanning data. Remote Sens. Environ. 2018, 204, 741–755. [Google Scholar] [CrossRef]
  63. Fortin, M.; Manso, R.; Calama, R. Hybrid estimation based on mixed-effects models in forest inventories. Can. J. For. Res. 2016, 46, 1310–1319. [Google Scholar] [CrossRef]
  64. Holopainen, M.; Vastaranta, M.; Hyyppä, J. Outlook for the next generation’s precision forestry in Finland. Forests 2014, 5, 1682–1694. [Google Scholar] [CrossRef]
  65. Gschwantner, T.; Lanz, A.; Vidal, C.; Bosela, M.; Di Cosmo, L.; Fridman, J.; Gasparini, P.; Kuliešis, A.; Tomter, S.; Schadauer, K. Comparison of methods used in European National Forest Inventories for the estimation of volume increment: Towards harmonization. Ann. For. Sci. 2016, 73, 807–821. [Google Scholar] [CrossRef]
  66. Vidal, C.; Alberdi, I.; Redmond, J.; Vestman, M.; Lanz, A.; Schadauer, K. The role of European National Forest Inventories for international forestry reporting. Ann. For. 2016, 73, 793–806. [Google Scholar] [Green Version]
  67. Gschwantner, T.; Schadauer, K.; Vidal, C.; Lanz, A.; Tomppo, E.; di Cosmo, L.; Robert, N.; Englert Duursma, D.; Lawrence, M. Common tree definitions for national forest inventories in Europe. Silva. Fenn. 2009, 43, 303–321. [Google Scholar] [CrossRef]
  68. Ståhl, G.; Cienciala, E.; Chirici, G.; Lanz, A.; Vidal, C.; Winter, S.; McRoberts, R.; Rondeusx, J.; Schadauer, K.; Tomppo, E. Bridging national and reference definitions for harmonizing forest statistics. For. Sci. 2012, 58, 214–223. [Google Scholar] [CrossRef]
  69. Köhl, M.; Traub, B.; Päivinen, R. Harmonisation and standardisation in multi-national environmental statistics—Mission impossible? Environ. Monit. Assess. 2000, 63, 361–380. [Google Scholar] [CrossRef]
  70. Vidal, C.; Lanz, A.; Tomppo, E.; Schadauer, K.; Gschwantner, T.; Di Cosmo, L.; Robert, N. Establishing forest inventory reference definitions for forest and growing stock: A study towards common reporting. Silva Fennica 2008, 42, 247–266. [Google Scholar] [CrossRef]
  71. Alberdi, I.; Condés, S.; McRoberts, R.; Winter, S. Mean species cover: A harmonized indicator of schrub cover for forest inventories. Eur. J. For. Res. 2018, 137, 265–278. [Google Scholar] [CrossRef]
  72. Gschwantner, T.; Alberdi, I.; Balázs, A.; Bauwens, S.; Bender, S.; Borota, D.; Bosela, M.; Bouriaud, O.; Cañellas, I.; Donis, J.; et al. Harmonisation of stem volume estimates in European National Forest Inventories. Ann. For. Sci. 2019, 76, 24. [Google Scholar] [CrossRef] [Green Version]
  73. Neumann, M.; Moreno, A.; Mues, V.; Härkönen, S.; Mura, M.; Bouriaud, O.; Lang, M.; Wouter, M.J.A.; Thivolle-Cazat, A.; Bronisz, K.; et al. Comparison of carbon estimation methods for European forests. For. Ecol. Manag. 2016, 361, 397–420. [Google Scholar] [CrossRef]
  74. Bouriaud, O.; Saint-André, L.; Santenoise, P.; Longuetaud, F.; Hervé, J.C.; Casella, E.; Freudenschuss, A.; Gschwantner, T.; Kändler, G.; Klatt, S.; et al. Deliverable 2.2 of the European Union’s Horizon 2020 Research and Innovation Programme Project DIABOLO—Distributed, Integrated and Harmonised Forest Information for Bioeconomy Outlooks; Technical Report No. 633464; European Commission: Brussels, Belgium, 2017. [Google Scholar]
  75. Genet, A.; Wernsdorfer, H.; Jonard, M.; Pretzsch, H.; Rauch, M.; Ponette, Q.; Nys, C.; Legout, A.; Ranger, J.; Vallet, P.; et al. Ontogeny partly explains the apparent heterogeneity of published biomass equations for Fagus sylvatica in central Europe. For. Ecol. Manag. 2011, 261, 1188–1202. [Google Scholar] [CrossRef]
  76. Bouriaud, O.; Saint-André, L.; Santenoise, P.; Longuetaud, F.; Hervé, J.C.; Bauwens, S.; Casella, E.; Freudenschuss, A.; Gschwantner, T.; Kändler, G.; et al. Deliverable 2.9 of the European Union’s Horizon 2020 Research and Innovation Programme Project DIABOLO—Distributed, Integrated and Harmonised Forest Information for Bioeconomy Outlooks; Technical Report No. 633464; European Commission: Brussels, Belgium, 2018. [Google Scholar]
  77. Kangas, A.; Korhonen, K.T.; Packalen, T.; Vauhkonen, J. Assessing the sources and types of uncertainties in the information on forest-related ecosystem services. For. Ecol. Manag. 2018, 427, 7–16. [Google Scholar] [CrossRef]
  78. Kosztra, B.; Büttner, G.; Hazeu, G.; Arnold, S. Updated CLC Illustrated Nomenclature Guidelines. European Environment Agency: Copenhagen, Denmark, 2017. [Google Scholar]
  79. Vizzardi, M.; Chiavetta, U.; Chirici, G.; Garfi, V.; Bastrup-Birk, A.; Marchetti, M. Comparing multisource harmonized forest types mapping: A case study from central Italy. iForest 2015, 8, 59–66. [Google Scholar] [CrossRef]
  80. Lind, T.; Trubins, R.; Lier, M.; Packalen, T. Harmonization of Definitions for Sustainable Biomass Supply in Terms of Sustainability Constraints in Relation to Experiences and Guidelines from International Processes and Projects e.g., Forest Europe, UNECE SFM, EU projects BEE and S2BIOM, as Well as Form the European Bioeconomy Observatory (BISO)—Guidelines for Harmonization of Biomass Supply Analyses. Deliverable 5.1 of the European Union’s Horizon 2020 Research and Innovation Programme Project DIABOLO—Distributed, Integrated and Harmonised Forest Information for Bioeconomy Outlooks; Technical Report No. 633464; European Commission: Brussels, Belgium, 2016; p. 31. [Google Scholar]
  81. Alberdi, I.; Michalak, R.; Fischer, C.; Gasparini, P.; Brändli, U.B.; Tomter, S.M.; Kuliesis, A.; Snorrason, A.; Redmond, J.; Hernández, L.; et al. Towards harmonized assessment of European forest availability for wood supply in Europe. For. Policy Econ. 2016, 70, 20–29. [Google Scholar] [CrossRef] [Green Version]
  82. Fischer, C.; Gasparini, P.; Nylander, M.; Redmond, J.; Hernandez, L.; Brändli, U.B.; Pastor, A.; Rizzo, M.; Alberdi, I. Joining criteria for harmonizing European Forest available for wood supply estimates. Case studies from National Forest Inventories. Forests 2016, 7, 104. [Google Scholar] [CrossRef]
  83. Vauhkonen, J.; Packalen, T. A Markov Chain Model for simulating wood supply from any-aged forest management based on national forest inventory (NFI) data. Forests 2017, 8, 307. [Google Scholar] [CrossRef]
  84. Vauhkonen, J.; Packalen, T. Uncertainties related to climate change and forest management with implications on climate regulation in Finland. Ecosyst. Serv. 2018, 33, 213–224. [Google Scholar] [CrossRef]
  85. Vauhkonen, J.; Packalen, T. Shifting from even-aged management to less intensive forestry in varying proportions of forest land in Finland: Impacts on carbon storage, harvest removals, and harvesting costs. Eur. J. For. Res. 2019, 138, 219–238. [Google Scholar] [CrossRef]
  86. UNECE/FAO. The European Forest Sector Outlook Study II 2010–2030. United Nations Economic Commission for Europe/Food and Agriculture Organization of the United Nations. 2011. Available online: https://www.unece.org/efsos2.html (accessed on 14 June 2019).
  87. Schelhaas, M.J.; Nabuurs, G.J.; Verkerk, P.J.; Hengeveld, G.; Packalen, T.; Sallnäs, O.; Pilli, R.; Grassi, G.; Forsell, N.; Frank, S.; et al. Forest resource projection tools at the European level. In Forest Inventory-Based Projection Systems for Wood and Biomass Availability, Managing Forest Ecosystems 29; Barreiro, S., Schelhaas, M.J., McRoberts, R.E., Kändler, G., Eds.; Springer: Cham, Switzerland, 2017. [Google Scholar] [CrossRef]
  88. Packalen, T.; Sallnäs, O.; Sirkiä, S.; Korhonen, K.T.; Salminen, O.; Vidal, C.; Robert, N.; Colin, A.; Belouard, T.; Schadauer, K.; et al. The European Forestry Dynamics Model: Concept, Design and Results of First Case Studies. JRC Science and Policy Reports; Technical Report No. EUR 27004; Publications Office of the European Union: Luxembourg, 2014; Volume 93450. [Google Scholar]
  89. Sallnäs, O.; Berger, A.; Räty, M.; Trubins, R. An area-based matrix model for uneven-aged forests. Forests 2015, 6, 1500–1515. [Google Scholar] [CrossRef]
  90. Vauhkonen, J.; Berger, A.; Gschwantner, T.; Schadauer, K.; Lejeune, P.; Perin, J.; Pitchugin, M.; Adolt, R.; Zeman, M.; Johannsen, V.K.; et al. Harmonised projections of future forest resources in Europe. Ann. For. Sci. 2019, 76, 79. [Google Scholar] [CrossRef]
  91. Henttonen, H.M.; Nöjd, P.; Suvanto, S.; Heikkinen, J.; Mäkinen, H. Large trees have increased greatly in Finland during 1921–2013, but recent observations on old trees tell a different story. Ecol. Indic. 2019, 99, 118–129. [Google Scholar] [CrossRef]
  92. Rocchini, D.; Marcantonio, M.; Da Re, D.; Chirici, G.; Galluzzi, G.; Lenoir, J.; Ricotta, C.; Torresani, M.; Ziv, G. Time-lapsing biodiversity: An open source method for measuring diversity changes by remote sensing. Remote Sens. Environ. 2019, 231, 111192. [Google Scholar] [CrossRef] [Green Version]
  93. Ayrey, E.; Hayes, D.J. The use of three-dimensional convolutional neural networks to interpret LiDAR for forest inventory. Remote Sens. 2018, 10, 649. [Google Scholar] [CrossRef]
  94. Massey, A.; Mandallaz, D.; Lanz, A. Integrating remote sensing and past inventory data under the new annual design of the Swiss National Forest Inventory using three-phase design-based regression estimation. Can. J. Res. 2014, 44, 1177–1186. [Google Scholar] [CrossRef]
  95. Ene, L.T.; Lanz, A.; Adolt, A.; Fejfar, J.; Kohn, I.; Riedel, T.; Morneau, F.; Pesty, B. Report on the Development of Imputations Techniques and Updating Algorithms, Including Concept and Implementation and Demonstration on Case Studies at Various Time Points and Spatial Scales. Deliverable 2.10 of the European Union’s Horizon 2020 Research and Innovation Programme Project DIABOLO—Distributed, Integrated and Harmonised Forest Information for Bioeconomy Outlooks; Technical Report No. 633464; European Commission: Brussels, Belgium, 2018. [Google Scholar]
  96. Schelhaas, M.J.; Fridman, J.; Hengeveld, G.M.; Henttonen, H.M.; Lehtonen, A.; Kies, U.; Krajnc, N.; Lerink, B.; Dhubháin, A.N.; Polley, H.; et al. Actual European forest management by region, tree species and owner based on 714,000 re-measured trees in national forest inventories. PLoS ONE 2018, 13, e0207151. [Google Scholar] [CrossRef] [PubMed] [Green Version]
  97. Grassi, G.; Pilli, R.; House, J.; Federici, S.; Kurz, W.A. Science-based approach for credible accounting of mitigation in managed forests. Carbon Balance Manag. 2018, 13, 8. [Google Scholar] [CrossRef] [PubMed] [Green Version]
  98. Nabuurs, G.J.; Arets, E.J.; Schelhaas, M.J. Understanding the implications of the EU-LULUCF regulation for the wood supply from EU forests to the EU. Carbon Balance Manag. 2018, 13, 18. [Google Scholar] [CrossRef] [PubMed]
Figure 1. The usefulness of the design-based and model-based approaches on different scales.
Forests 10 00800 g001
Figure 2. Relation between information the content and harmonization efforts.
Forests 10 00800 g002

