Article

Chinese Fir Breeding in the High-Throughput Sequencing Era: Insights from SNPs

Guangdong Provincial Key Laboratory of Silviculture, Protection and Utilization, Guangdong Academy of Forestry, Guangzhou 510520, China
*
Authors to whom correspondence should be addressed.
Forests 2019, 10(8), 681; https://doi.org/10.3390/f10080681
Submission received: 16 July 2019 / Revised: 7 August 2019 / Accepted: 9 August 2019 / Published: 12 August 2019
(This article belongs to the Special Issue Forest Genetics and Tree Improvement)

Abstract

:
Knowledge on population diversity and structure is of fundamental importance for conifer breeding programs. In this study, we concentrated on the development and application of high-density single nucleotide polymorphism (SNP) markers through a high-throughput sequencing technique termed as specific-locus amplified fragment sequencing (SLAF-seq) for the economically important conifer tree species, Chinese fir (Cunninghamia lanceolata). Based on the SLAF-seq, we successfully established a high-density SNP panel consisting of 108,753 genomic SNPs from Chinese fir. This SNP panel facilitated us in gaining insight into the genetic base of the Chinese fir advance breeding population with 221 genotypes for its genetic variation, relationship and diversity, and population structure status. Overall, the present population appears to have considerable genetic variability. Most (94.15%) of the variability was attributed to the genetic differentiation of genotypes, very limited (5.85%) variation occurred on the population (sub-origin set) level. Correspondingly, low FST (0.0285–0.0990) values were seen for the sub-origin sets. When viewing the genetic structure of the population regardless of its sub-origin set feature, the present SNP data opened a new population picture where the advanced Chinese fir breeding population could be divided into four genetic sets, as evidenced by phylogenetic tree and population structure analysis results, albeit some difference in membership of the corresponding set (cluster vs. group). It also suggested that all the genetic sets were admixed clades revealing a complex relationship of the genotypes of this population. With a step wise pruning procedure, we captured a core collection (core 0.650) harboring 143 genotypes that maintains all the allele, diversity, and specific genetic structure of the whole population. This generalist core is valuable for the Chinese fir advanced breeding program and further genetic/genomic studies.

1. Introduction

Over the last seven decades, tree breeders have attained impressive genetic gains for the key economic and ecological traits of their target tree species through conventional breeding schemes [1,2]. However, the breeding process has appeared to be slow and still in its infancy compared to many commercial crop and animal species [3]. One major hurdle is the phenotyping need for capturing genetic varieties from a large number of large size candidates at different sites with longtime intervals (e.g., 15 years or more for conifers per breeding cycle) [4,5,6]. Phenotype-inferred causative genetic variation knowledge will definitely continue to be used, but the situation seems to be changing. Tree breeders have now turned their attentions to frontier molecular breeding approaches as an alternative. Molecular marker technique is particularly promising because it offers an avenue to rapidly identify the genome-wide variation underlying phenotype regardless of growth, differentiation, development, or environmental effects [7]. Furthermore, it is stable and informative, allowing the breeder to address the population genetic architecture (genetic structure, diversity and relationship, etc.) and facilitate the accurate mating designs with parental analysis to accelerate the breeding progress [8]. The accessible molecular marker includes: (1) hybridization-based type such as restriction fragment length polymorphism (RFLP) and its modified forms, (2) PCR and electrophoresis-based type including random amplified polymorphic DNA (RAPD), amplified fragment length polymorphism (AFLP), sequence-related amplified polymorphism (SRAP), inter simple sequence repeat (ISSR), and simple sequence repeat (SSR) etc., and (3) sequencing-based type dominated by single nucleotide polymorphism (SNP) [9,10,11]. Of these, SNPs have proved to be the most abundant form of variation within a species at genome level that provides more detailed insights into the genetic base of a population [10]. They have become more and more popular because they can be high-throughput detected through next-generation sequencing (NGS) at a moderate cost. Notably, the NGS-based SNP genotyping approach, common known as genotyping by sequencing (GBS), has been readily used in the forestry tree species on population genetic studies, even for conifers that have very large (16–35 Gbp or more) and complex genomes [12,13,14,15,16,17]. For conifers, an advantage of the application of GBS is that it permits high-density SNP discovery and genotyping of a population without prior knowledge of their giga-genomes and has a power to reduce the genome complexity typically by the elimination of large set of repetitive sequences that greatly reduce the next analysis effect [12,16,18]. This feature makes it more attractive for conifer tree breeders to adopt the high-throughput sequencing (HTS) platform as a straightforward tool in their molecular breeding program.
Chinese fir (Cunninghamia lanceolata) is one of the major commercial conifer species in China. It covers ~21.4% of man-made plantations and supplies up to 20%–30% of the total commercial timber production of China [19,20]. Highly valued for timber and essential ecosystem services this conifer has been used as a major breeding subject of the tree improvement programs of China for over 50 years [21]. Thanks to the great application of breeders, considerable genetic gain in growth and wood quality traits for this species has been made through the advanced-generation scheme (conventional breeding scheme). Recently, Chinese fir breeders have attempted to employ molecular marker techniques to accelerate their breeding. PCR and electrophoresis-based molecular markers including RAPD, AFLP, SRAP, ISSR, and SSR have been used for Chinese fir population genetic studies [18], while HTS technologies (e.g., NGS) open up a new perspective for genome-wide screening of single nucleotide variations (SNPs) for this species.
Previously, we reported a high-throughput GBS technique, named as specific-locus amplified fragment sequencing (SLAF-seq), as being suitable for large-scale SNP exploitation in Chinese fir [18]. In this work, we extended the initial development of genome-wide SNPs in a Chinese fir advanced breeding population with 221 genotypes by using SLAF-seq, and performed a genetic analysis on this population based on the exploited SNP set. This enabled us to: (1) develop a qualified SNP resource available for the Chinese fir advanced breeding program, (2) better understand the genetic diversity and population structure of the breeding population, and (3) capture a represented core collection for further breeding use and genetic/genomic studies.

2. Materials and Methods

2.1. Plant Materials

This study was based on an advanced breeding population of the third-cycle Chinese fir (C. lanceolata) breeding program of Guangdong, China. The whole population comprised 221 elite genotypes. According to breeding generation and pedigree, these genotypes were separated into three categories: first (n = 161), second (n = 25; 2nd germplasm), and third generation germplasm (n = 35; 3rd germplasm). The first generation germplasms had divergent geographical origins covering the main breeding regions of China, including Guangdong (n = 106; Guangdong 1st), Guizhou (n = 16; Guizhou 1st), Guangxi (n = 13; Guangxi 1st), Fujian (n = 12; Fujian 1st), Hunan (n = 7; Hunan 1st), and Jiangxi (n = 7; Jiangxi 1st). The genotypes were notable for their rapid growth rate, qualified wood (high density, red-heart wood, or long tracheid length) or other superior traits (high production of female strobili, narrow tree crown, or thin-bark). They were grafted for the breeding program with 5–10 repeats (5–10 ramets per genotype) and a 4 × 4 m spacing since 2014 in Xiaokeng State Forest Farm (Guangdong, China, 24°42′ N, 113°48′ E, 300–306 m above sea level). The trees were maintained using standard commercial practices.

2.2. DNA Extraction, Genotyping-by-Sequencing and SNP Identification

Total genomic DNA was extracted from the leaf tissue of each genotype with a DNAsecure Plant Kit (TIANGEN, Beijing, China) according to the manufacturer’s instructions. The DNA quality and concentration were assessed and evaluated by agarose gel electrophoresis (1%) and NanoDrop (NanoDrop-2000 Spectrophotometer, Wilmington, DE, USA). The DNA panel was then subjected to genotyping-by-sequencing (GBS) using the specific-locus amplified fragment sequencing (SLAF-seq) strategy [18,22]. In brief, the accessible restriction enzymes and generated DNA sizes for SLAF-seq were evaluated using Picea abies genomic sequence (http://congenie.org/) as training data because P. abies represented a high-coverage draft genome assembly that could be used as a reference in conifer [18]. Based on this, each DNA sample was digested with EcoR V (5′-GAT/ATC-3′) and Sca I (5′-AGT/ACT-3′) to generate restriction fragments (digestion efficiency = 97.79%). These fragments were used for the SLAF library construction according to the procedure described by Sun et al. [22]. DNA fragments (SLAFs) ranging from 264–294 bp (with indexes and adaptors) in size were selected for pair-end sequencing (2 × 100 bp) using Illumina High-seqTM2500 system (Illumina, San Diego, CA, USA) at Biomarker Technologies Corporation in Beijing. High-throughput sequencing reads were processed according to Sun et al. [22]. Low quality reads (quality score <30) were definitely filtered out. Quality reads with clear index information and over 90% identity were grouped in one SLAF locus. Polymorphic SLAFs were identified by an aligning analysis across genotypes using the BLAST-like alignment tool (BLAT) [23]. Meanwhile, all the parallel SLAF reads were aligned to the most authentic reference sequence (the most depth read) using the Burrows– Wheeler Alignment tool (BWA) [24], and then the SNPs were developed with the Genome Analysis Toolkit (GATK) [25] and SAM tools [26]. The identified SNP from both GATK and SAM tools was regarded as the authentic SNP.

2.3. Statistical Analyses

A total of 108,753 SNPs with an integrity >0.8 and minor allele frequency (MAF) >0.05 was finally used for the genetic analysis in this study. Genetic diversity of the whole population was assessed according to the mean value of the following parameters at each nucleotide site: MAF, observed allele number, expected allele number, observed heterozygous number, expected heterozygous number, Nei diversity index, Shannon–Wiener index, and polymorphic information content. These parameters were calculated by the Perl programming-based method. AMOVA (analysis of molecular variance) procedure and principal coordinate analysis (PCoA) were performed under R environment with the poppr [27] and VEGAN [28] package respectively. To quantify the polymorphism levels (θπ, pairwise nucleotide variation as a measure of variability) and genetic differentiation (FST) between the different sub-origin sets of Chinese fir (3rd germplasm, 2nd germplasm, Guangdong 1st, Guizhou 1st, Guangxi 1st, Fujian 1st, Hunan 1st, and Jiangxi 1st), the PopGen module within Bioperl software (Stajich J, Dept Molecular Genetics and Microbiology, Duke University) was employed. Linkage disequilibrium analyses between SNPs were carried out using PLINK 1.9 software with an r2 cutoff of <0.10 [29]. We applied MEGA5 to measure the pairwise genetic distance of the genotypes and constructed the phylogenetic tree using the neighbor-joining method with 1000 bootstrap replicates [30]. Population structure assessment was conducted with the ADMIXTURE program by a predefined K (group number) from 1 to 10 [31]. For core collection selection, a step wise pruning procedure was implemented and evaluated by Core Hunter II [32]. Venn diagrams were generated by Venny 2.1 (http://bioinfogp.cnb.csic.es/tools/venny/index.html).

3. Results

3.1. Genome-Wide SNP Mining

As summarized in Table 1, over 261 million EcoR V-Sca I specific reads (each read approximately 200-bp in length) were generated from the Chinese fir breeding population genomes through high-throughput paired-end SLAF-seq, with an average of 1,183,321 (~1.2 million) sequence reads per genotype (average read depth 7.32×). These reads were finally assigned to 748,509 unique genomic loci specified as EcoR V-Sca I specific-locus amplified fragment (SLAFs). Notably, 263,099 (35.15%) SLAFs had SNP variation. This allowed an identification of 1,396,279 SNPs from the genotypes (n = 221). Of these SNPs, 1,368,439 represented simple nucleotide substitution classified as transitions (A/G and C/T) and transversions (A/C, A/T, C/G and G/T) respectively. Transitions dominated most of the cases of substitution (75.89%). Only 24.11% of the variations were transversions. Overall, the transition:transversion ratio (Ts:Tv) was 3.15. To establish an informative SNP panel, the identified SNPs were then subjected to a filtering step with integrity >0.8 and MAF >0.05 as thresholds. As a result, a total of 108,753 SNPs (7.79%) were retained and used for further genetic analysis. Linkage disequilibrium (LD) analyses further revealed that 773,679,501 pairwise SNP comparisons had a relatively high LD value (r2 ≥ 0.10) (Figure 1). Most of the LD (98.00%) ranged from 0.10 to 0.50; only 2.00% (15,519,918) displayed very high values (0.51–1.00).

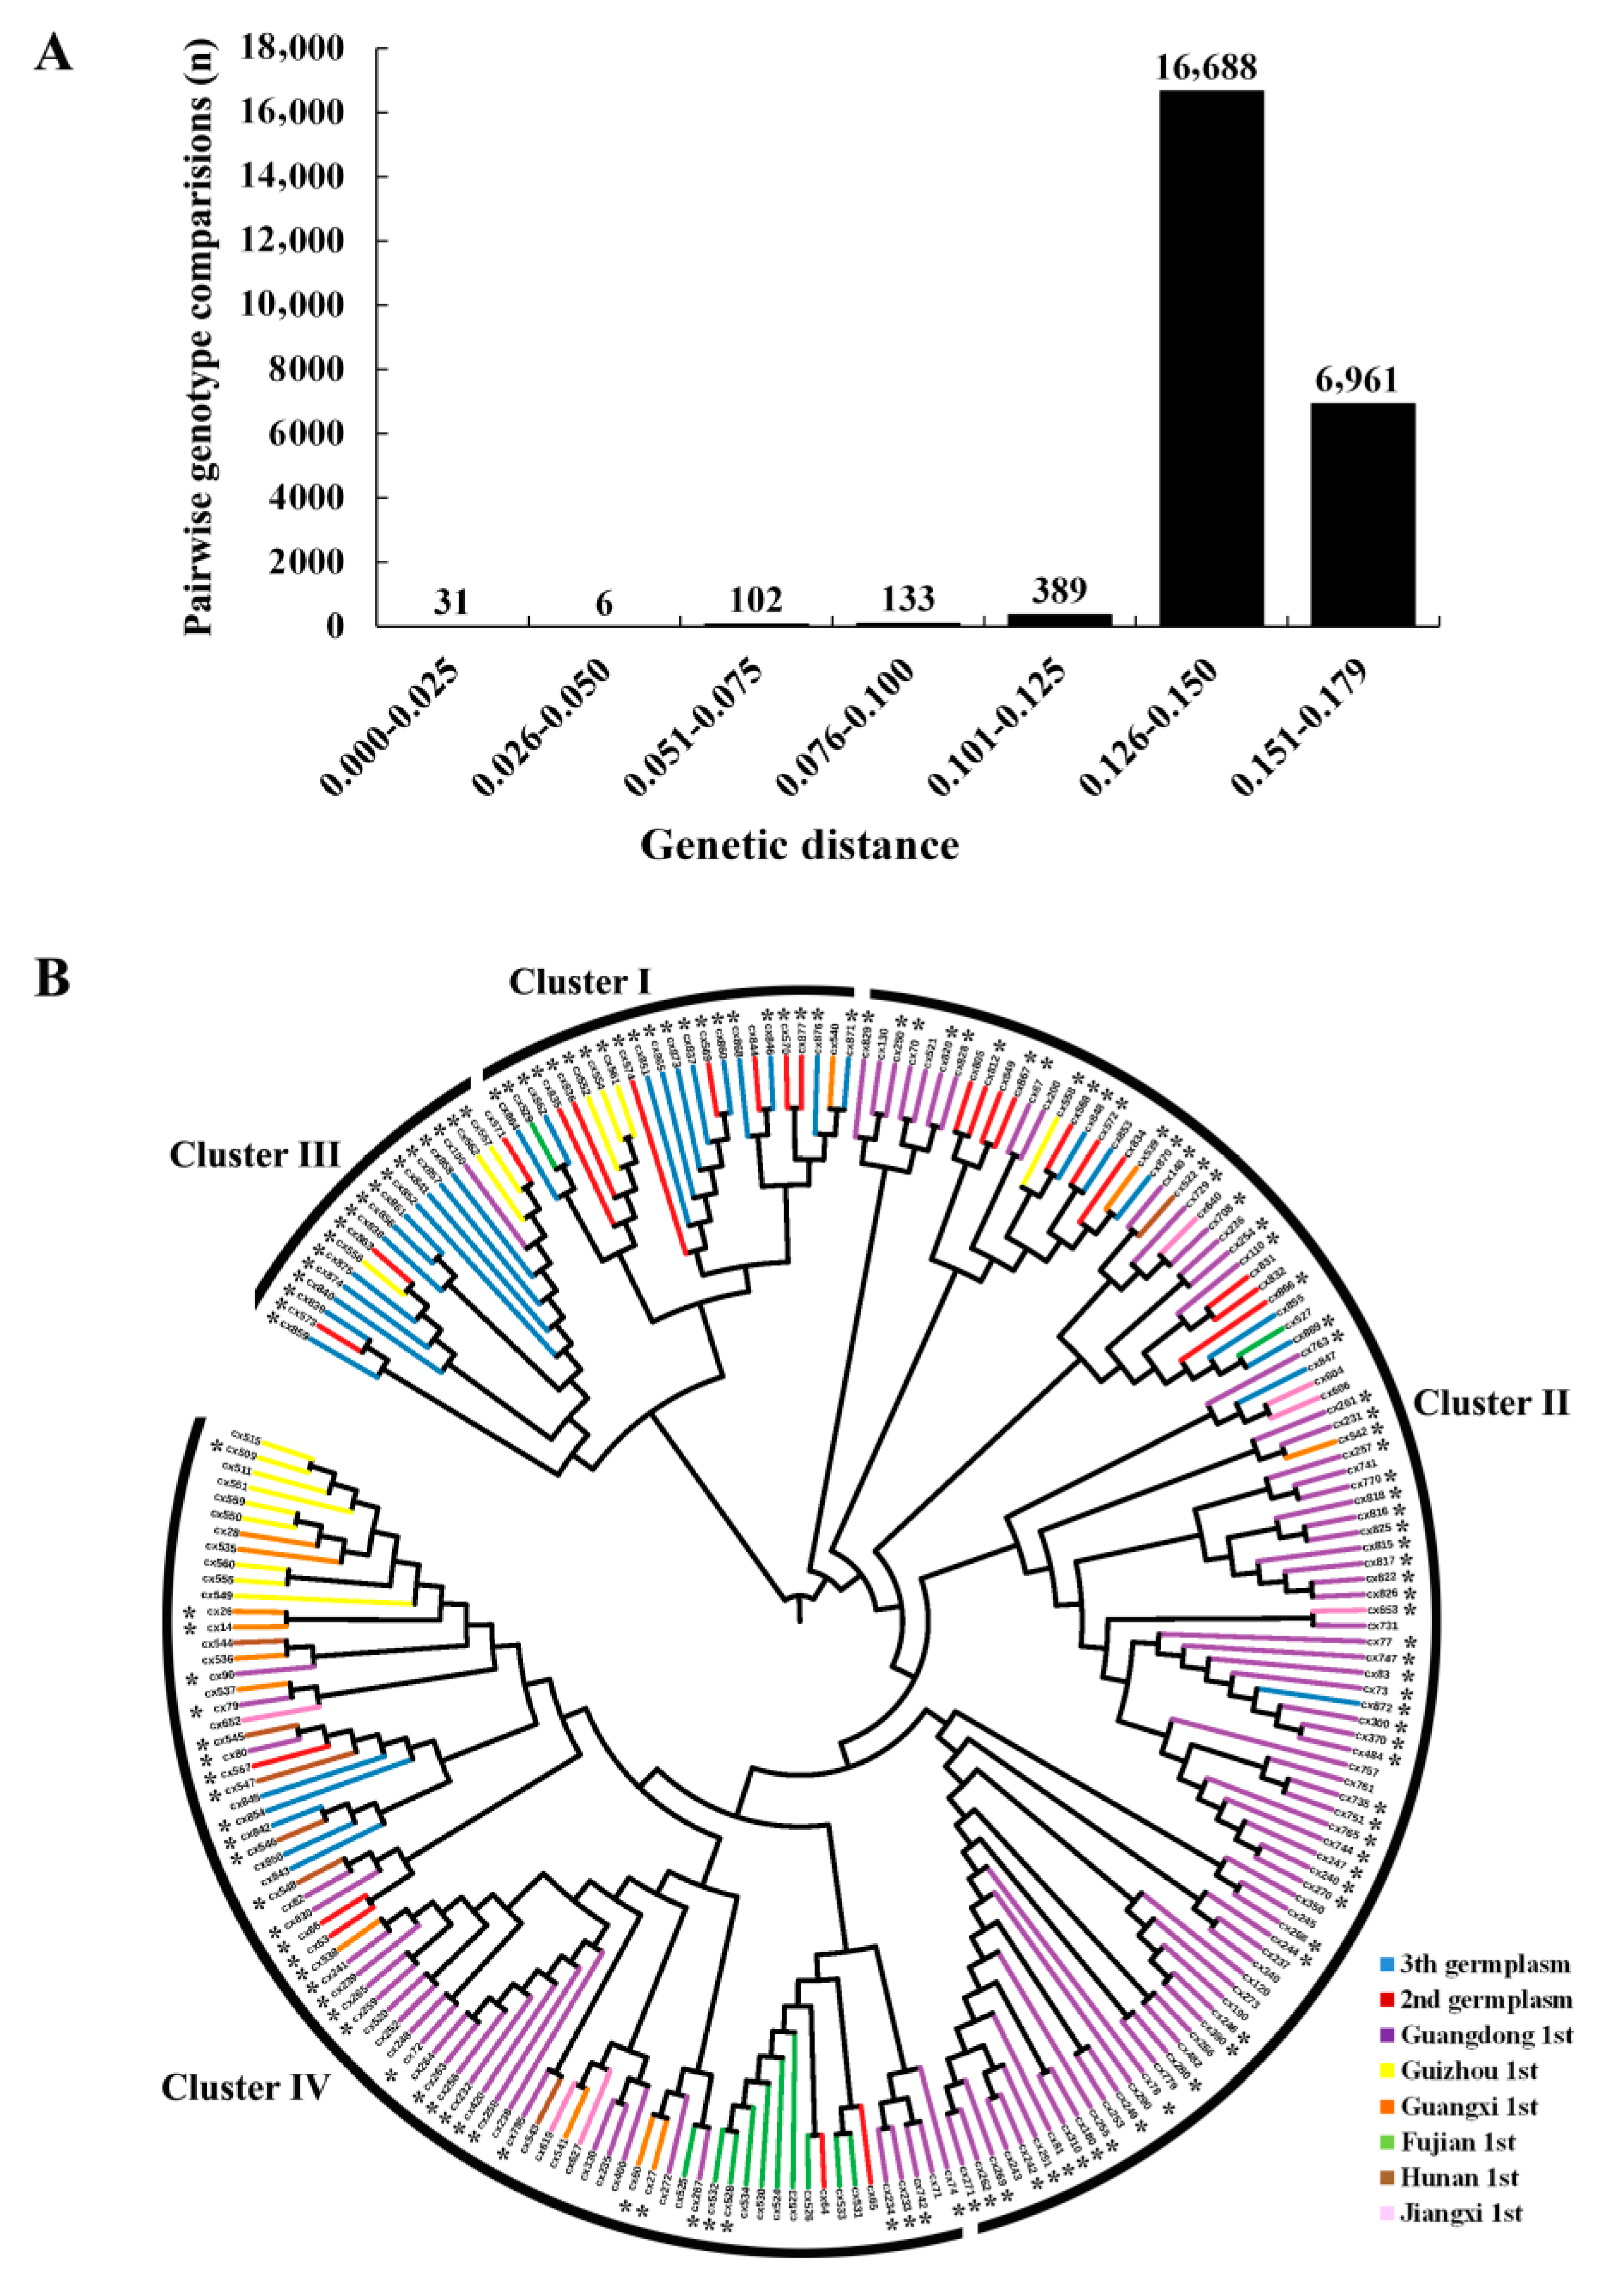
3.2. Genetic Diversity Assessment

The present study included analysis of 221 Chinese fir genotypes from an advanced breeding population that consisted of the first (n = 161), second (n = 25; 2nd germplasm) and third generation germplasm (n = 35; 3rd germplasm) supposed to have a wide genetic basis in breeding status, geographical origins, and morphological characteristics. Using the above SNP panel (108,753 SNPs), we were able to assess the spectrum of genetic diversity of these genotypes at genomic level. Overall, the average minor allele frequency (MAF), observed and expected allele number were 0.1669, 2.0000, 1.3791 respectively, and the observed and expected heterozygous number equaled 0.1629, 0.2495, respectively. The average polymorphic information content, Nei diversity index and Shannon–Wiener index presented as 0.2100, 0.2501, 0.4036 respectively. These estimations indicated that there is a considerable amount of genetic variation among genotypes. When all sub-origin sets (3rd germplasm, 2nd germplasm, Guangdong 1st, Guizhou 1st, Guangxi 1st, Fujian 1st, Hunan 1st, and Jiangxi 1st) were compared (Table 2), a low level of genetic differentiation was detected (FST < 0.1000). Analysis of molecular variance (AMOVA) provided further evidence that 94.15% of the variance was due to the genetic differentiation of the genotypes and only 5.85% of the variance was attributed to the differences of sub-origin sets (Table 3).
Divergence and relatedness of the genotypes were then evaluated by the pairwise genetic distance values (Figure 2A). Overall, the present 221 Chinese fir genotypes differed from each other with a genetic distance ranging from 0.003 (cx27:cx60) to 0.179 (cx243:cx860). The average genetic distance equaled 0.145 and with most (68.65%) of the pairs of genotypes the genetic distance fell between 0.126–0.150; 28.60% (6961) of the pairs of genotypes had a genetic distance higher than 0.151. Based on the pairwise distance matrix, a phylogenetic tree was constructed which directly shows the relationship (Figure 2B). In general, the genotypes could be divided into four major clusters (Cluster I–IV). All clusters were admixed clades. Cluster I harbors 23 genotypes from the 3rd germplasm (n = 11), 2nd germplasm (n = 7), Guizhou 1st (n = 3), Guangxi 1st (n = 1), and Fujian 1st (n = 1) set respectively. Cluster II has the largest number of members (n = 100) covering all the sub-origin sets and represents most (69.81%) of the Guangdong 1st-derived genotypes. Cluster III comprises only 19 genotypes but has four sub-origin components (3rd germplasm, 2nd germplasm, Guangdong 1st and Guizhou 1st). The rest genotypes (n = 80) were consistently assigned to cluster IV also having a full spectrum origin.

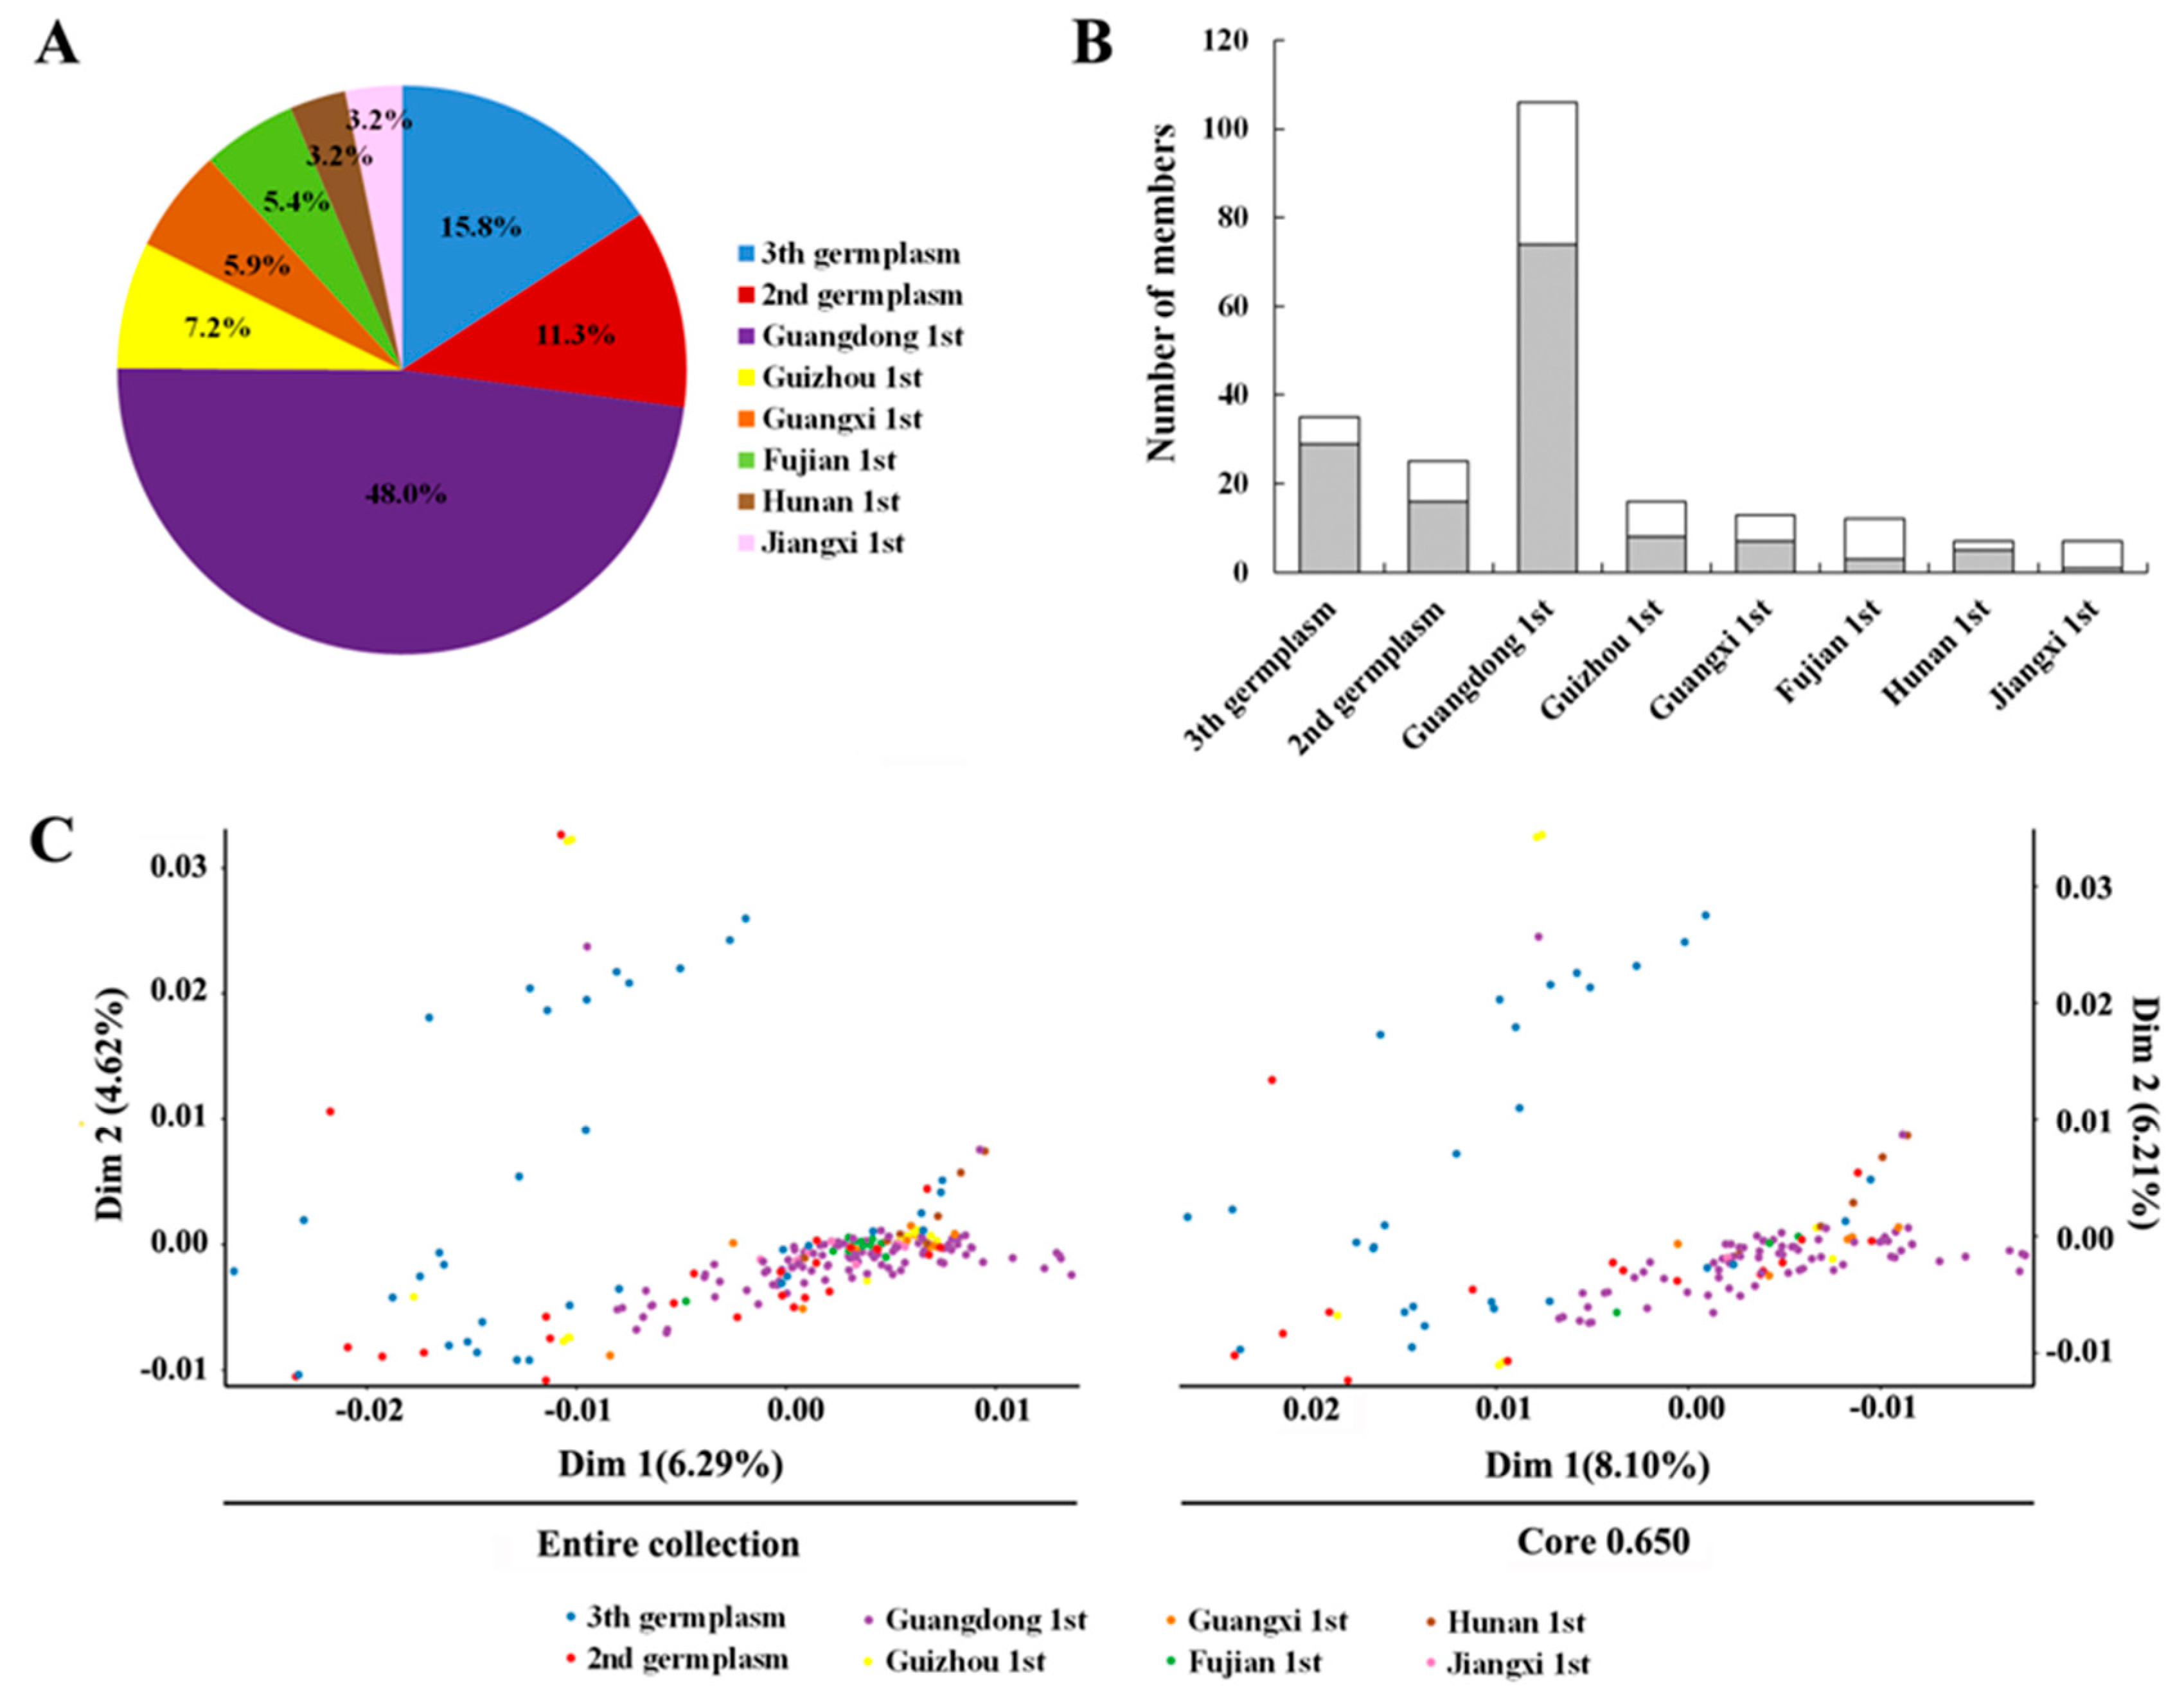
3.3. Population Structure Inferring

In the next step, we employed the ADMIXTURE program to estimate the Chinese fir genetic structure (221 genotypes) with a testing K value of 1–10 (Figure 3A). As shown in Figure 3B, K = 4, 7 or 8 presented a relatively low cross-validation (CV) error and seemed to be the most feasible model for the population structure. K = 7 or 8 may be overestimated because the population K values for the step wise pruning core set (Core 0.900–Core 0.700) were consistently equal to 4 (Table 4). Therefore, we excluded K of 7 and 8, and supposed K = 4 was the best model for our population. Strikingly, this ADMIXTURE-inferred grouping result (group 1–4) largely overlapped with the clustering branch (Cluster I–IV) of the phylogenetic tree (Figure 2B). Group 1 harbored all the members of Cluster I. Group 2 occupied 62.00% of members of Cluster II. All the Group 3 genotypes could be found in Cluster III. Group 4 and Cluster IV have an overlapping of >60.00% in genotypes (Figure 4).

3.4. Core Collection Development

To optimize the management and utilization of the genotypes we applied the above SNP panel (108,753 SNPs) to develop a core collection representing the whole of the Chinese fir breeding population with maximum diversity and minimum redundancy. Genetic parameters were calculated for each pruning (10.00% interval) set and it was observed that core 0.400 (n = 88)–core 0.900 (n = 198) consistently had 100.00% allele coverage (CV) on the entire collection and retained all the diversity (Table 4). When referring to population structure, only core 0.7000 (n = 154)–core 0.900 (n = 198) displayed a parallel structure (K = 4) to the whole. Further pruning (2.50% interval) revealed that core 0.650 (n = 143) is the most possible core collection maintaining all the allele, diversity, and specific genetic structure of our breeding population (Table 4 and Figure 2B). Notably, this core contained a genetic component from all the sub-origin sets of the whole population (Figure 5A,B). Members of this core are also representative of genotypes with different useful traits in our breeding population (data not shown). The comparison of principal coordinate analysis results between the defined core (core 0.650) and the entire collection further demonstrated that the present core collection is highly representative of the whole population (Figure 5C).

4. Discussion

Early studies largely depended on re-sequencing specific candidate genes for SNP discovery and utilization, but rapid progress of HTS technologies has made SNP mining more accessible than ever before, even at a genome-wide scale. With HTS, several economically and ecologically important conifer tree species including Norway spruce (Picea abies (L.) Karst.) [33], white spruce (P. glauca (Moench) Voss) [34], loblolly pine (Pinus taeda L.) [35,36], sugar pine (P. lambertiana Dougl.) [37], Douglas-fir (Pseudotsuga menziesii var. menziesii (Mirb.) Franco) [38], and Siberian larch (Larix sibirica Ledeb) [39] have had their giga-genomes sequenced. These genome sequences offer an opportunity to identify millions of qualified SNPs through resequencing projects, and recently this has been initiated in loblolly pine by resequencing 10 different individual genomes [40]. However, it was still hard to implement resequencing projects for most of the conifers because of the lack of whole genome reference sequences. Moreover, resequencing numerous conifer individuals with large and complex genomes for population studies is still rather cost prohibitive and challenging. Herein, for an alternative, we employed an HTS-based reduced representation method (SLAF-seq, an improved GBS technique) to obtain genome-wide SNPs. A qualified SNP resource (108,753 SNPs) was developed, and its usefulness was demonstrated by further genetic analysis results. Compared to the whole-genome resequencing approach, the SLAF-seq may not be the ideal method for population genetic and genomic studies, but it provided a rapid and affordable way to produce genome-wide SNPs making us able to decipher the genetic architecture of the breeding population of non-model conifers (e.g., Chinese fir).
In comparison to a previous EcoR V-based SLAF-seq experiment on Chinese fir, we captured more SNPs (Total SNPs, 1,396,279 vs. 147,376; high-qualified SNPs, 108,753 vs. 48,406) herein [18]. This may be due to an increased samples size (221 vs. 18) while using a double digest strategy (EcoR V and Sca I) that produced more reads allowing more variant estimation. However, notwithstanding their differences, we consistently found that the Chinese fir genome tended to have more transition substitutions than transversions on SNPs. This observation could be explained as transition bias [41]. Transition bias seems to be a common phenomenon in molecular evolution but is rarely mentioned with conifers. Based on RAD-seq and RNA-seq, Karam et al. [13] unraveled a significant SNP transition bias in conifer Cedrus atlantica with a Ts:Tv ratio of 1.52 and 1.60 respectively; while, for Cryptomeria japonica, the Ts:Tv was presented as 2.56 and 1.59 respectively [17]. In this report, as inferred by the genome-wide SNPs data, the estimated Ts:Tv ratio appeared to be high (3.15), reflecting a more profound transition bias in Chinese fir.
Knowledge on population diversity and structure is of fundamental importance for conifer breeding programs. Normal passport (geography and/or pedigree) and phenotype data, traditionally used for the assessment of genetic architecture of the population, has been recently paralleled by the use of molecular markers [7]. This is because the molecular markers allowed researchers to distinguish closely related samples and give more precise variation information among genotypes. In this investigation, the high-density SNP panel (108,753 SNPs) facilitated us to gain insight into the genetic base of the Chinese fir breeding population for its genetic variation, relationship and diversity and population structure status. Overall, the present advanced breeding population appeared to have considerable genetic variability. Most (94.15%) of the variability was attributed to the genetic differentiation of genotypes, very limited (5.85%) variation occurred on the population (sub-origin set) level. Correspondingly, low FST (0.0285–0.0990) values were seen for the sub-origin sets. These results agreed with the argument that outcrossing woody plants displayed profound diversity but with less genetic differentiation among populations [42]. Taking the FST values into account we further found that the advanced breeding scheme blurred the genetic stratification of the sub-origin sets with generations, as shown by Guangdong 1st–2nd germplasms (FST = 0.0305) and 2nd–3rd germplasm (FST = 0.0285). This is in accordance with the fact that the 2nd germplasms inherit a large set of genetic component of the first germplasms (Guangdong 1st) and the case was the same for 3rd germplasms with 2nd germplasms. When viewing the genetic structure of the population regardless of its sub-origin set feature, the present SNP data opened a new population picture where the advanced Chinese fir breeding population could be divided into four genetic sets, as shown by the phylogenetic tree and population structure analysis result, albeit with some difference in membership of the corresponding set (cluster vs. group) (Figure 4). It also suggested that all the genetic sets were admixed clades revealing a complex relationship of the genotypes of this population. These results certainly help us to clarify the relationships of the genotypes at the molecular level and permit us to make a more precise crossing design regarding their genetic distance.
Constructing core collections to represent the genetic spectrum of the whole population with maximum diversity and minimum redundancy appears to be an attractive choice for tree breeders and basic science researchers because a large-size collection can thereby be handled more efficiently and effectively for conservation and breeding purposes and other research objectives [43,44,45,46]. Many efforts have been invested in constructing core collections from fruit trees, such as grape (Vitis vinifera L. subsp. Sativa) [47], olive (Olea europaea L.) [48], apple (Malus × domestica Borkh) [49], and pear (Pyrus communis L.) [50]. While very few studies have been carried out to construct a representative core collection for forest species particularly the conifers. Using geographic and SSR-based genetic data, Miyamoto et al. [51] successfully identified a representative core collection with 539 individuals from 3203 plus trees in C. japonica, a dominant conifer in Japan. Recently, Duan et al. [44] combined SSR-based genetic information with phenotypic descriptors to establish a Chinese fir core collection prior to genome-wide association studies. In this work, core collections were built based on high-throughput SNP data. The identified core collection defined as core 0.650 with 143 genotypes represented well the genetic variability of our breeding population containing all the allele, diversity, genetic structure, and reprehensive components. However, the sampling percentage (~65.00%) is much higher than the popular view (≤30.00%). Wang et al. [52] argued that there did not exist a perfect ratio or fixed size for all core collections, and different plant or different constructing goals required a different sampling percentage. The present sampling percentage was also acceptable because it ensured 100.00% variation and equal population structure to the entire collection when the core was established. Such occupation also reflected a low genetic redundancy within our breeding population. It should be mentioned that core 0.650 can serve as a generalist core collection valuable for the Chinese fir advanced breeding program and further genetic/genomic studies. On considering the operational breeding scheme, clear goals and strictly objective criteria are required. Furthermore, additional phenotypic information and expert knowledge (popularity, prestige, role in breeding history, or presence of phenotypic features of interest) have to be taken into account [50]. In this sense, the generalist core collection (core 0.650) can evolve into sets towards different breeding purposes with Chinese fir.

5. Conclusions

The present work concentrated on the development and application of high-density SNP markers in Chinese fir. Using an HTS-based reduced representation method (SLAF-seq), we successfully established a high-density SNP panel consisting of 108,753 genomic SNPs from Chinese fir. This SNP panel permitted us to gain insight into the genetic diversity, population structure, and core collection of the Chinese fir advanced breeding population and contributed to our knowledge about the genetic basis of this population at the molecular level. The obtained results will certainly help us to promote the advanced breeding program of Chinese fir in the near further.

Author Contributions

H.Z. is the lead author. He directed the estimation of the breeding population and most of the experimental and analytical work and wrote the manuscript. D.H. designed the analytical workflow. R.W., S.Y., and R.W. participated in the experimental and analytical work.

Funding

This research was supported by the Specific Programs in Forestry Science and Technology Innovation of Guangdong (No. 2017KJCX026 and 2019KJCX008), the Special Plan for the Cultivation of High-level Talents of Guangdong (No. 2014TQ01N140), the Special Fund for Forest Scientific Research in the Public Welfare (No. 201404127), and the National Natural Sciences Foundation of China (No. 31200506).

Conflicts of Interest

The authors declare no conflict of interest.

References

  1. Hodge, G.R.; Dvorak, W.S. Breeding southern US and Mexican pines for increased value in a changing world. New For. 2014, 45, 295–300. [Google Scholar] [CrossRef]
  2. Wu, H.X.; Hallingbäck, H.R.; Sánchez, L. Performance of seven tree breeding strategies under conditions of inbreeding depression. G3 Genes Genomes Genet. 2016, 6, 529–540. [Google Scholar] [CrossRef] [PubMed]
  3. Isik, F. Genomic selection in forest tree breeding: The concept and an outlook to the future. New For. 2014, 45, 379–401. [Google Scholar] [CrossRef]
  4. Zapata-Valenzuela, J.; Whetten, R.W.; Neale, D.; McKeand, S.; Isik, F. Genomic estimated breeding values using genomic relationship matrices in a cloned population of loblolly pine. G3 Genes Genomes Genet. 2013, 3, 909–916. [Google Scholar] [CrossRef] [PubMed]
  5. Thistlethwaite, F.R.; Ratcliffe, B.; Klápště, J.; Porth, I.; Chen, C.; Stoehr, M.U.; El-Kassaby, Y.A. Genomic prediction accuracies in space and time for height and wood density of Douglas-fir using exome capture as the genotyping platform. BMC Genom. 2017, 18, 930. [Google Scholar] [CrossRef] [PubMed]
  6. Grattapaglia, D.; Silva-Junior, O.B.; Resende, R.T.; Cappa, E.P.; Müller, B.S.F.; Tan, B.; Isik, F.; Ratcliffe, B.; El-Kassaby, Y.A. Quantitative genetics and genomics converge to accelerate forest tree breeding. Front. Plant Sci. 2018, 9, 1693. [Google Scholar] [CrossRef] [PubMed]
  7. Zheng, H.Q.; Duan, H.J.; Hu, D.H.; Li, Y.; Hao, Y.B. Genotypic variation of Cunninghamia lanceolata revealed by phenotypic traits and SRAP markers. Dendrobiology 2015, 74, 85–94. [Google Scholar] [CrossRef]
  8. Howe, G.T.; Yu, J.; Knaus, B.; Cronn, R.; Kolpak, S.; Dolan, P.; Lorenz, W.W.; Dean, J.F. A SNP resource for Douglas-fir: De novo transcriptome assembly and SNP detection and validation. BMC Genom. 2013, 14, 137. [Google Scholar] [CrossRef]
  9. Mammadov, J.; Aggarwal, R.; Buyyarapu, R.; Kumpatla, S. SNP markers and their impact on plant breeding. Int. J. Plant Genom. 2012, 2012, 728398. [Google Scholar] [CrossRef]
  10. Zheng, H.Q.; Duan, H.J.; Hu, D.H.; Wei, R.P.; Li, Y. Sequence-related amplified polymorphism primer screening on Chinese fir (Cunninghamia lanceolata (Lamb.) Hook). J. For. Res. 2015, 26, 101–106. [Google Scholar] [CrossRef]
  11. Taheri, S.; Lee Abdullah, T.; Yusop, M.R.; Hanafi, M.M.; Sahebi, M.; Azizi, P.; Shamshiri, R.R. Mining and development of novel SSR markers using next generation sequencing (NGS) data in plants. Molecules 2018, 23, 399. [Google Scholar] [CrossRef] [PubMed]
  12. Chen, C.; Mitchell, S.E.; Elshire, R.J.; Buckler, E.S.; El-Kassaby, Y.A. Mining conifers’mega-genome using rapid and efficient multiplexed high-throughput genotyping-by-sequencing (GBS) SNP discovery platform. Tree Genet. Genomes 2013, 9, 1537–1544. [Google Scholar] [CrossRef]
  13. Karam, M.J.; Lefèvre, F.; Dagher-Kharrat, M.B.; Pinosio, S.; Vendramin, G.G. Genomic exploration and molecular marker development in a large and complex conifer genome using RADseq and mRNAseq. Mol. Ecol. Resour. 2015, 15, 601–612. [Google Scholar] [CrossRef] [PubMed]
  14. Prunier, J.; Verta, J.P.; MacKay, J.J. Conifer genomics and adaptation: At the crossroads of genetic diversity and genome function. New Phytol. 2016, 209, 44–62. [Google Scholar] [CrossRef] [PubMed]
  15. Fuentes-Utrilla, P.; Goswami, C.; Cottrell, J.E.; Pong-Wong, R.; Law, A.; A’Hara, S.W.; Lee, S.J.; Woolliams, J.A. QTL analysis and genomic selection using RADseq derived markers in Sitka spruce: The potential utility of within family data. Tree Genet. Genomes 2017, 13, 33. [Google Scholar] [CrossRef]
  16. Parchman, T.L.; Jahner, J.P.; Uckele, K.A.; Galland, L.M.; Eckert, A.J. RADseq approaches and applications for forest tree genetics. Tree Genet. Genomes 2018, 14, 39. [Google Scholar] [CrossRef]
  17. Ueno, S.; Uchiyama, K.; Moriguchi, Y.; Ujino-Ihara, T.; Matsumoto, A.; Wei, F.J.; Saito, M.; Higuchi, Y.; Futamura, N.; Kanamori, H.; et al. Scanning RNA-Seq and RAD-Seq approach to develop SNP markers closely linked to MALE STERILITY 1 (MS1) in Cryptomeria japonica D. Don. Breed. Sci. 2019, 69, 19–29. [Google Scholar] [CrossRef]
  18. Su, Y.; Hu, D.H.; Zheng, H.Q. Detection of SNPs based on DNA specific-locus amplified fragment sequencing in Chinese fir (Cunninghamia lanceolata (Lamb.) Hook). Dendrobiology 2016, 76, 73–79. [Google Scholar] [CrossRef]
  19. Zhang, Y.X.; Han, X.J.; Sang, J.; He, X.L.; Liu, M.Y.; Qiao, G.R.; Zhuo, R.Y.; He, G.P.; Hu, J.J. Transcriptome analysis of immature xylem in the Chinese fir at different developmental phases. PeerJ 2016, 4, e2097. [Google Scholar] [CrossRef] [Green Version]
  20. Hu, D.H.; Su, Y.; Wu, S.J.; Wu, J.Z.; Wang, R.H.; Yan, S.; Wei, R.P.; Zheng, H.Q. Association of SRAP markers with juvenile wood basic density and growth traits in Cunninghamia lanceolata (Lamb.) Hook. Dendrobiology 2018, 79, 111–118. [Google Scholar] [CrossRef]
  21. Zheng, H.Q.; Hu, D.H.; Wang, R.H.; Wei, R.P.; Yan, S. Assessing 62 Chinese fir (Cunninghamia lanceolata) breeding parents in a 12-year grafted clone test. Forests 2015, 6, 3799–3808. [Google Scholar] [CrossRef]
  22. Sun, X.; Liu, D.; Zhang, X.; Li, W.; Liu, H.; Hong, W.; Jiang, C.; Guan, N.; Ma, C.; Zeng, H.; et al. SLAF-seq: An efficient method of large-scale de novo SNP discovery and genotyping using high-throughput sequencing. PLoS ONE 2013, 8, e58700. [Google Scholar] [CrossRef] [PubMed]
  23. Kent, W.J. BLAT—The BLAST-like alignment tool. Genome Res. 2002, 12, 656–664. [Google Scholar] [CrossRef] [PubMed]
  24. Li, H.; Durbin, R. Fast and accurate short read alignment with Burrows-Wheeler transform. Bioinformatics 2009, 25, 1754–1760. [Google Scholar] [CrossRef] [PubMed] [Green Version]
  25. Mckenna, A.; Hanna, M.; Banks, E.; Sivachenko, A.; Cibulskis, K.; Kernytsky, A.; Garimella, K.; Altshuler, D.; Gabriel, S.; Daly, M.; et al. The Genome Analysis Toolkit: A MapReduce framework for analyzing next-generation DNA sequencing data. Genome Res. 2010, 20, 1297–1303. [Google Scholar] [CrossRef] [PubMed] [Green Version]
  26. Li, H.; Handsaker, B.; Wysoker, A.; Fennell, T.; Ruan, J.; Homer, N.; Marth, G.; Abecasis, G.; Durbin, R. 1000 Genome Project Data Processing Subgroup. The Sequence Alignment/Map format and SAMtools. Bioinformatics 2009, 25, 2078–2079. [Google Scholar] [CrossRef] [PubMed]
  27. Kamvar, Z.N.; Tabima, J.F.; Grünwald, N.J. Poppr: An R package for genetic analysis of populations with clonal, partially clonal, and/or sexual reproduction. PeerJ 2014, 2, e281. [Google Scholar] [CrossRef] [PubMed]
  28. Dixon, P. VEGAN, a package of R functions for community ecology. J. Veg. Sci. 2003, 14, 927–930. [Google Scholar] [CrossRef]
  29. Chang, C.C.; Chow, C.C.; Tellier, L.C.; Vattikuti, S.; Purcell, S.M.; Lee, J.J. Second-generation PLINK: Rising to the challenge of larger and richer datasets. GigaScience 2015, 4, 7. [Google Scholar] [CrossRef]
  30. Tamura, K.; Peterson, D.; Peterson, N.; Stecher, G.; Nei, M.; Kumar, S. MEGA5: Molecular evolutionary genetics analysis using maximum likelihood, evolutionary distance, and maximum parsimony methods. Mol. Biol. Evol. 2011, 28, 2731–2739. [Google Scholar] [CrossRef]
  31. Alexander, D.H.; Novembre, J.; Lange, K. Fast model-based estimation of ancestry in unrelated individuals. Genome Res. 2009, 19, 1655–1664. [Google Scholar] [CrossRef] [PubMed] [Green Version]
  32. De Beukelaer, H.; Smýkal, P.; Davenport, G.F.; Fack, V. Core Hunter II: Fast core subset selection based on multiple genetic diversity measures using Mixed Replica search. BMC Bioinform. 2012, 13, 312. [Google Scholar] [CrossRef] [PubMed]
  33. Nystedt, B.; Street, N.R.; Wetterbom, A.; Zuccolo, A.; Lin, Y.C.; Scofield, D.G.; Vezzi, F.; Delhomme, N.; Giacomello, S.; Alexeyenko, A.; et al. The Norway spruce genome sequence and conifer genome evolution. Nature 2013, 497, 579–584. [Google Scholar] [CrossRef] [PubMed] [Green Version]
  34. Birol, I.; Raymond, A.; Jackman, S.D.; Pleasance, S.; Coope, R.; Taylor, G.A.; Yuen, M.M.; Keeling, C.I.; Brand, D.; Vandervalk, B.P.; et al. Assembling the 20 Gb white spruce (Picea glauca) genome from whole-genome shotgun sequencing data. Bioinformatics 2013, 29, 1492–1497. [Google Scholar] [CrossRef] [PubMed]
  35. Neale, D.B.; Wegrzyn, J.L.; Stevens, K.A.; Zimin, A.V.; Puiu, D.; Crepeau, M.W.; Cardeno, C.; Koriabine, M.; Holtz-Morris, A.E.; Liechty, J.D.; et al. Decoding the massive genome of loblolly pine using haploid DNA and novel assembly strategies. Genome Biol. 2014, 15, R59. [Google Scholar] [CrossRef] [PubMed]
  36. Zimin, A.V.; Stevens, K.A.; Crepeau, M.W.; Puiu, D.; Wegrzyn, J.L.; Yorke, J.A.; Langley, C.H.; Neale, D.B.; Salzberg, S.L. An improved assembly of the loblolly pine mega-genome using long-read single-molecule sequencing. GigaScience 2017, 6, 1–4. [Google Scholar] [PubMed]
  37. Stevens, K.A.; Wegrzyn, J.L.; Zimin, A.; Puiu, D.; Crepeau, M.; Cardeno, C.; Paul, R.; Gonzalez-Ibeas, D.; Koriabine, M.; Holtz-Morris, A.E.; et al. Sequence of the sugar pine megagenome. Genetics 2016, 204, 1613–1626. [Google Scholar] [CrossRef] [PubMed]
  38. Neale, D.B.; McGuire, P.E.; Wheeler, N.C.; Stevens, K.A.; Crepeau, M.W.; Cardeno, C.; Zimin, A.V.; Puiu, D.; Pertea, G.M.; Sezen, U.U.; et al. The Douglas-fir genome sequence reveals specialization of the photosynthetic apparatus in Pinaceae. 2017. G3 Genes Genomes Genet. 2017, 7, 3157–3167. [Google Scholar]
  39. Kuzmin, D.A.; Feranchuk, S.I.; Sharov, V.V.; Cybin, A.N.; Makolov, S.V.; Putintseva, Y.A.; Oreshkova, N.V.; Krutovsky, K.V. Stepwise large genome assembly approach: A case of Siberian larch (Larix sibirica Ledeb). BMC Bioinform. 2019, 20 (Suppl. 1), 37. [Google Scholar] [CrossRef]
  40. De La Torre, A.R.; Puiu, D.; Crepeau, M.W.; Stevens, K.; Salzberg, S.L.; Langley, C.H.; Neale, D.B. Genomic architecture of complex traits in loblolly pine. New Phytol. 2019, 221, 1789–1801. [Google Scholar] [CrossRef]
  41. Wakeley, J. The excess of transitions among nucleotide substitutions: New methods of estimating transition bias underscore its significance. Trends Ecol. Evol. 1996, 11, 158–162. [Google Scholar] [CrossRef]
  42. Hamrick, J.L.; Godt, M.J.W. Effects of life history traits on genetic diversity in plant species. Philos. Trans. R. Soc. Lond. Ser. B Biol. Sci. 1996, 351, 1291–1298. [Google Scholar]
  43. Frankel, O.H.; Brown, A.H.D. Plant genetic resources today: A critical appraisal. In Crop Genetic Resources: Conservation and Evaluation; Holden, J.H.W., Williams, J.T., Eds.; Georges Allen & Unwin Ltd.: London, UK, 1984; pp. 249–257. [Google Scholar]
  44. Duan, H.J.; Cao, S.; Zheng, H.Q.; Hu, D.H.; Lin, J.; Cui, B.B.; Lin, H.Z.; Hu, R.Y.; Wu, B.; Sun, Y.H.; et al. Genetic characterization of Chinese fir from six provinces in southern China and construction of a core collection. Sci. Rep. 2017, 7, 13814. [Google Scholar] [CrossRef]
  45. Liu, F.M.; Zhang, N.N.; Liu, X.J.; Yang, Z.J.; Jia, H.Y.; Xu, D.P. Genetic diversity and population structure analysis of Dalbergia odorifera germplasm and development of a core collection using microsatellite markers. Genes 2019, 10, 281. [Google Scholar] [CrossRef] [PubMed]
  46. Guardo, M.D.; Scollo, F.; Ninot, A.; Rovira, M.; Hermoso, J.F.; Distefano, G.; Malfa, S.L.; Batlle, I. Genetic structure analysis and selection of a core collection for carob tree germplasm conservation and management. Tree Genet. Genomes 2019, 15, 41. [Google Scholar] [CrossRef]
  47. Le Cunff, L.; Fournier-Level, A.; Laucou, V.; Vezzulli, S.; Lacombe, T.; Adam-Blondon, A.F.; Boursiquot, J.M.; This, P. Construction of nested genetic core collections to optimize the exploitation of natural diversity in Vitis vinifera L. subsp. sativa. BMC Plant Biol. 2008, 8, 31. [Google Scholar] [CrossRef]
  48. Haouane, H.; El Bakkali, A.; Moukhli, A.; Tollon, C.; Santoni, S.; Oukabli, A.; El Modafar, C.; Khadari, B. Genetic structure and core collection of the World Olive Germplasm Bank of Marrakech: Towards the optimised management and use of Mediterranean olive genetic resources. Genetica 2011, 139, 1083–1094. [Google Scholar] [CrossRef] [PubMed]
  49. Lassois, L.; Denancé, C.; Ravon, E.; Guyader, A.; Guisnel, R.; Hibrand-Saint-Oyant, L.; Poncet, C.; Lasserre-Zuber, P.; Feugey, L.; Durel, C.E. Genetic diversity, population structure, parentage analysis, and construction of core collections in the French apple germplasm based on SSR markers. Plant Mol. Biol. Rep. 2016, 34, 827–844. [Google Scholar] [CrossRef]
  50. Urrestarazu, J.; Kägi, C.; Bühlmann, A.; Gassmann, J.; Santesteban, L.G.; Frey, J.E.; Kellerhals, M.; Miranda, C. Integration of expert knowledge in the definition of Swiss pear core collection. Sci. Rep. 2019, 9, 8934. [Google Scholar] [CrossRef]
  51. Miyamoto, N.; Ono, M.; Watanabe, A. Construction of a core collection and evaluation of genetic resources for Cryptomeria japonica (Japanese cedar). J. For. Res. 2015, 20, 186–196. [Google Scholar] [CrossRef]
  52. Wang, J.; Guan, Y.; Wang, Y.; Zhu, L.; Wang, Q.; Hu, Q.; Hu, J. A strategy for finding the optimal scale of plant core collection based on Monte Carlo simulation. Sci. World J. 2014, 2014, 503473. [Google Scholar] [CrossRef] [PubMed]
Figure 1. Distribution of different levels of linkage disequilibrium (r2) of the specific-locus amplified fragment sequencing (SLAF-seq) based 108,753 single nucleotide polymorphism (SNP) markers in the present Chinese fir breeding population with 221 genotypes. Only pairwise SNP comparisons with r2 ≥ 0.10 are included.
Forests 10 00681 g001
Figure 2. Genetic relationship of the Chinese fir genotypes (n = 221) based on 108,753 informative SNPs from the SLAF-seq in the breeding population. (A) Distribution of pairwise genetic distance for the Chinese fir genotypes; (B) Neighbor-joining tree showing genetic relationships among the Chinese fir genotypes. The colors of branches indicate genotypes corresponding to different sub-origin sets. Clusters are shown with a curved line and a Roman numeral. Core genotypes are marked with asterisks.
Forests 10 00681 g002
Figure 3. Population structure analysis of the Chinese fir breeding population (221 genotypes) by ADMIXTURE program using genome-wide SNP markers (n = 108,753). (A) Groups identified in the structure analysis by a predefined K (group number) from 1 to 10. The genotypes represented by vertical bars along the horizontal axis were grouped into K color blocks. (B) The estimated cross-validation errors for different grouping results (K value). The most possible K value is indicated with a red arrow.
Forests 10 00681 g003
Figure 4. Venn diagrams depicting the number of overlapping and non-overlapping genotypes of Chinese fir in each pair of comparisons of neighbor-joining clusters (Cluster I–IV) with ADMIXTURE groups for the breeding population (221 genotypes).
Forests 10 00681 g004
Figure 5. Representativeness of the optimal Chinese fir core collection (core 0.650) for the present Chinese fir breeding population (entire collection harboring 221 genotypes). (A) Sub-origin set distribution of the genotypes (n = 221) in the entire collection. (B) Numerical distribution of the different sub-origin genotypes in the entire collection (full histogram) and optimal core collection (grey histogram). (C) Principal coordinates analysis of the Chinese fir entire collection and optimal core collection based on genome-wide SNP markers (n = 108,753).
Forests 10 00681 g005
Table 1. Paired-end specific-locus amplified fragment sequencing (SLAF-seq) statistics in this study.
FeatureValue
Number of reads261,513,887
Average Q30 percentage88.86%
Average GC percentage38.12%
Average depth7.32
Total number of SLAFs748,509
Number of polymorphic SLAFs263,099
Number of no polymorphic SLAFs485,410
Total single nucleotide polymorphisms (SNPs)1,396,279
The high-qualified SNPs (Integrity>0.8, minor allele frequency >0.05)108,753
Transition
A/G519,627 (37.97%)
C/T518,869 (37.92%)
Transversion
A/C99,065 (7.24%)
A/T64,848 (4.74%)
C/G66,144 (4.83%)
G/T99,886 (7.30%)
Table 2. Genetic differentiation (FST) of the sub-origin sets in the Chinese fir breeding population.
Sub-Origin Set3rd Germplasm2nd GermplasmGuangdong 1stGuizhou 1stGuangxi 1stFujian 1stHunan 1stJiangxi 1st
3rd germplasm-
2nd germplasm0.0285-
Guangdong 1st0.03550.0305-
Guizhou 1st0.05390.05100.0461-
Guangxi 1st0.06210.05320.0396 0.0716-
Fujian 1st0.06330.05730.0420 0.07340.0688 -
Hunan 1st0.07910.07700.06390.09580.08650.0946-
Jiangxi 1st0.07690.07170.05360.0913 0.08460.08610.0990-
Table 3. Analysis of molecular variance (AMOVA) of the Chinese fir genotypes from the breeding population.
Source of VariationdfSum of Square DifferenceMean of Square DifferenceComponents of Covariance (%)
Among sub-origin sets70.06400.00915.85
Within genotypes2130.80830.003894.15
Total2200.87230.0040100.00
Table 4. Parameter measurements for different core collection of the Chinese fir breeding population using genome-wide SNP markers (n = 108,753). MR, mean Modified Rogers distance; MRmin, minimum MR distance; CE, Cavalli-Sforza and Edwards distances; CEmin, minimum CE distance; SH, Shannon’s diversity index; HE, the expected proportion of heterozygous loci; NE, the number of effective alleles; PN, the proportion of non-informative alleles; CV, allele coverage. The most feasible K value represents the number of groups inferred by ADMIXTURE in each core collection.
Core CollectionSize (n)MRMRminCECEminSHHENEPNCVThe Most Feasible K Value
Core 0.200440.38190.28180.39450.296211.99850.25151.38550.00130.99871
Core 0.300660.38060.11860.39310.125711.99920.25131.38390.00020.99991
Core 0.400880.37960.11380.39210.120312.00020.25171.38450.00001.00002
Core 0.5001100.37900.11380.39150.120312.00010.25131.38330.00001.00002
Core 0.6001320.37840.09950.39090.105812.00020.25131.38290.00001.00003
Core 0.6251380.37890.09950.39140.105812.00100.25181.38390.00001.00003
Core 0.6501430.37880.09950.39130.105812.00090.25181.38370.00001.00004
Core 0.6751490.37870.09950.39120.105812.00080.25161.38330.00001.00004
Core 0.7001540.37800.10830.39040.114911.99990.25101.38200.00001.00004
Core 0.8001760.37740.09950.38980.105811.99950.25051.38110.00001.00004
Core 0.9001980.37710.09950.38940.105811.99890.25001.38010.00001.00004
Entire collection2210.37600.09950.38830.105811.99820.24951.37910.00001.00004

