Complete Chloroplast Genome Sequence and Phylogenetic Analysis of Quercus bawanglingensis Huang, Li et Xing, a Vulnerable Oak Tree in China

 , ,
, ,
Abstract
:1. Introduction
2. Materials and Methods
2.1. Chloroplast DNA Extraction, Illumina Sequencing, Assembly, Annotation and Sequence Analyses
2.2. Genome Comparison
2.3. Phylogenetic Analysis
3. Results
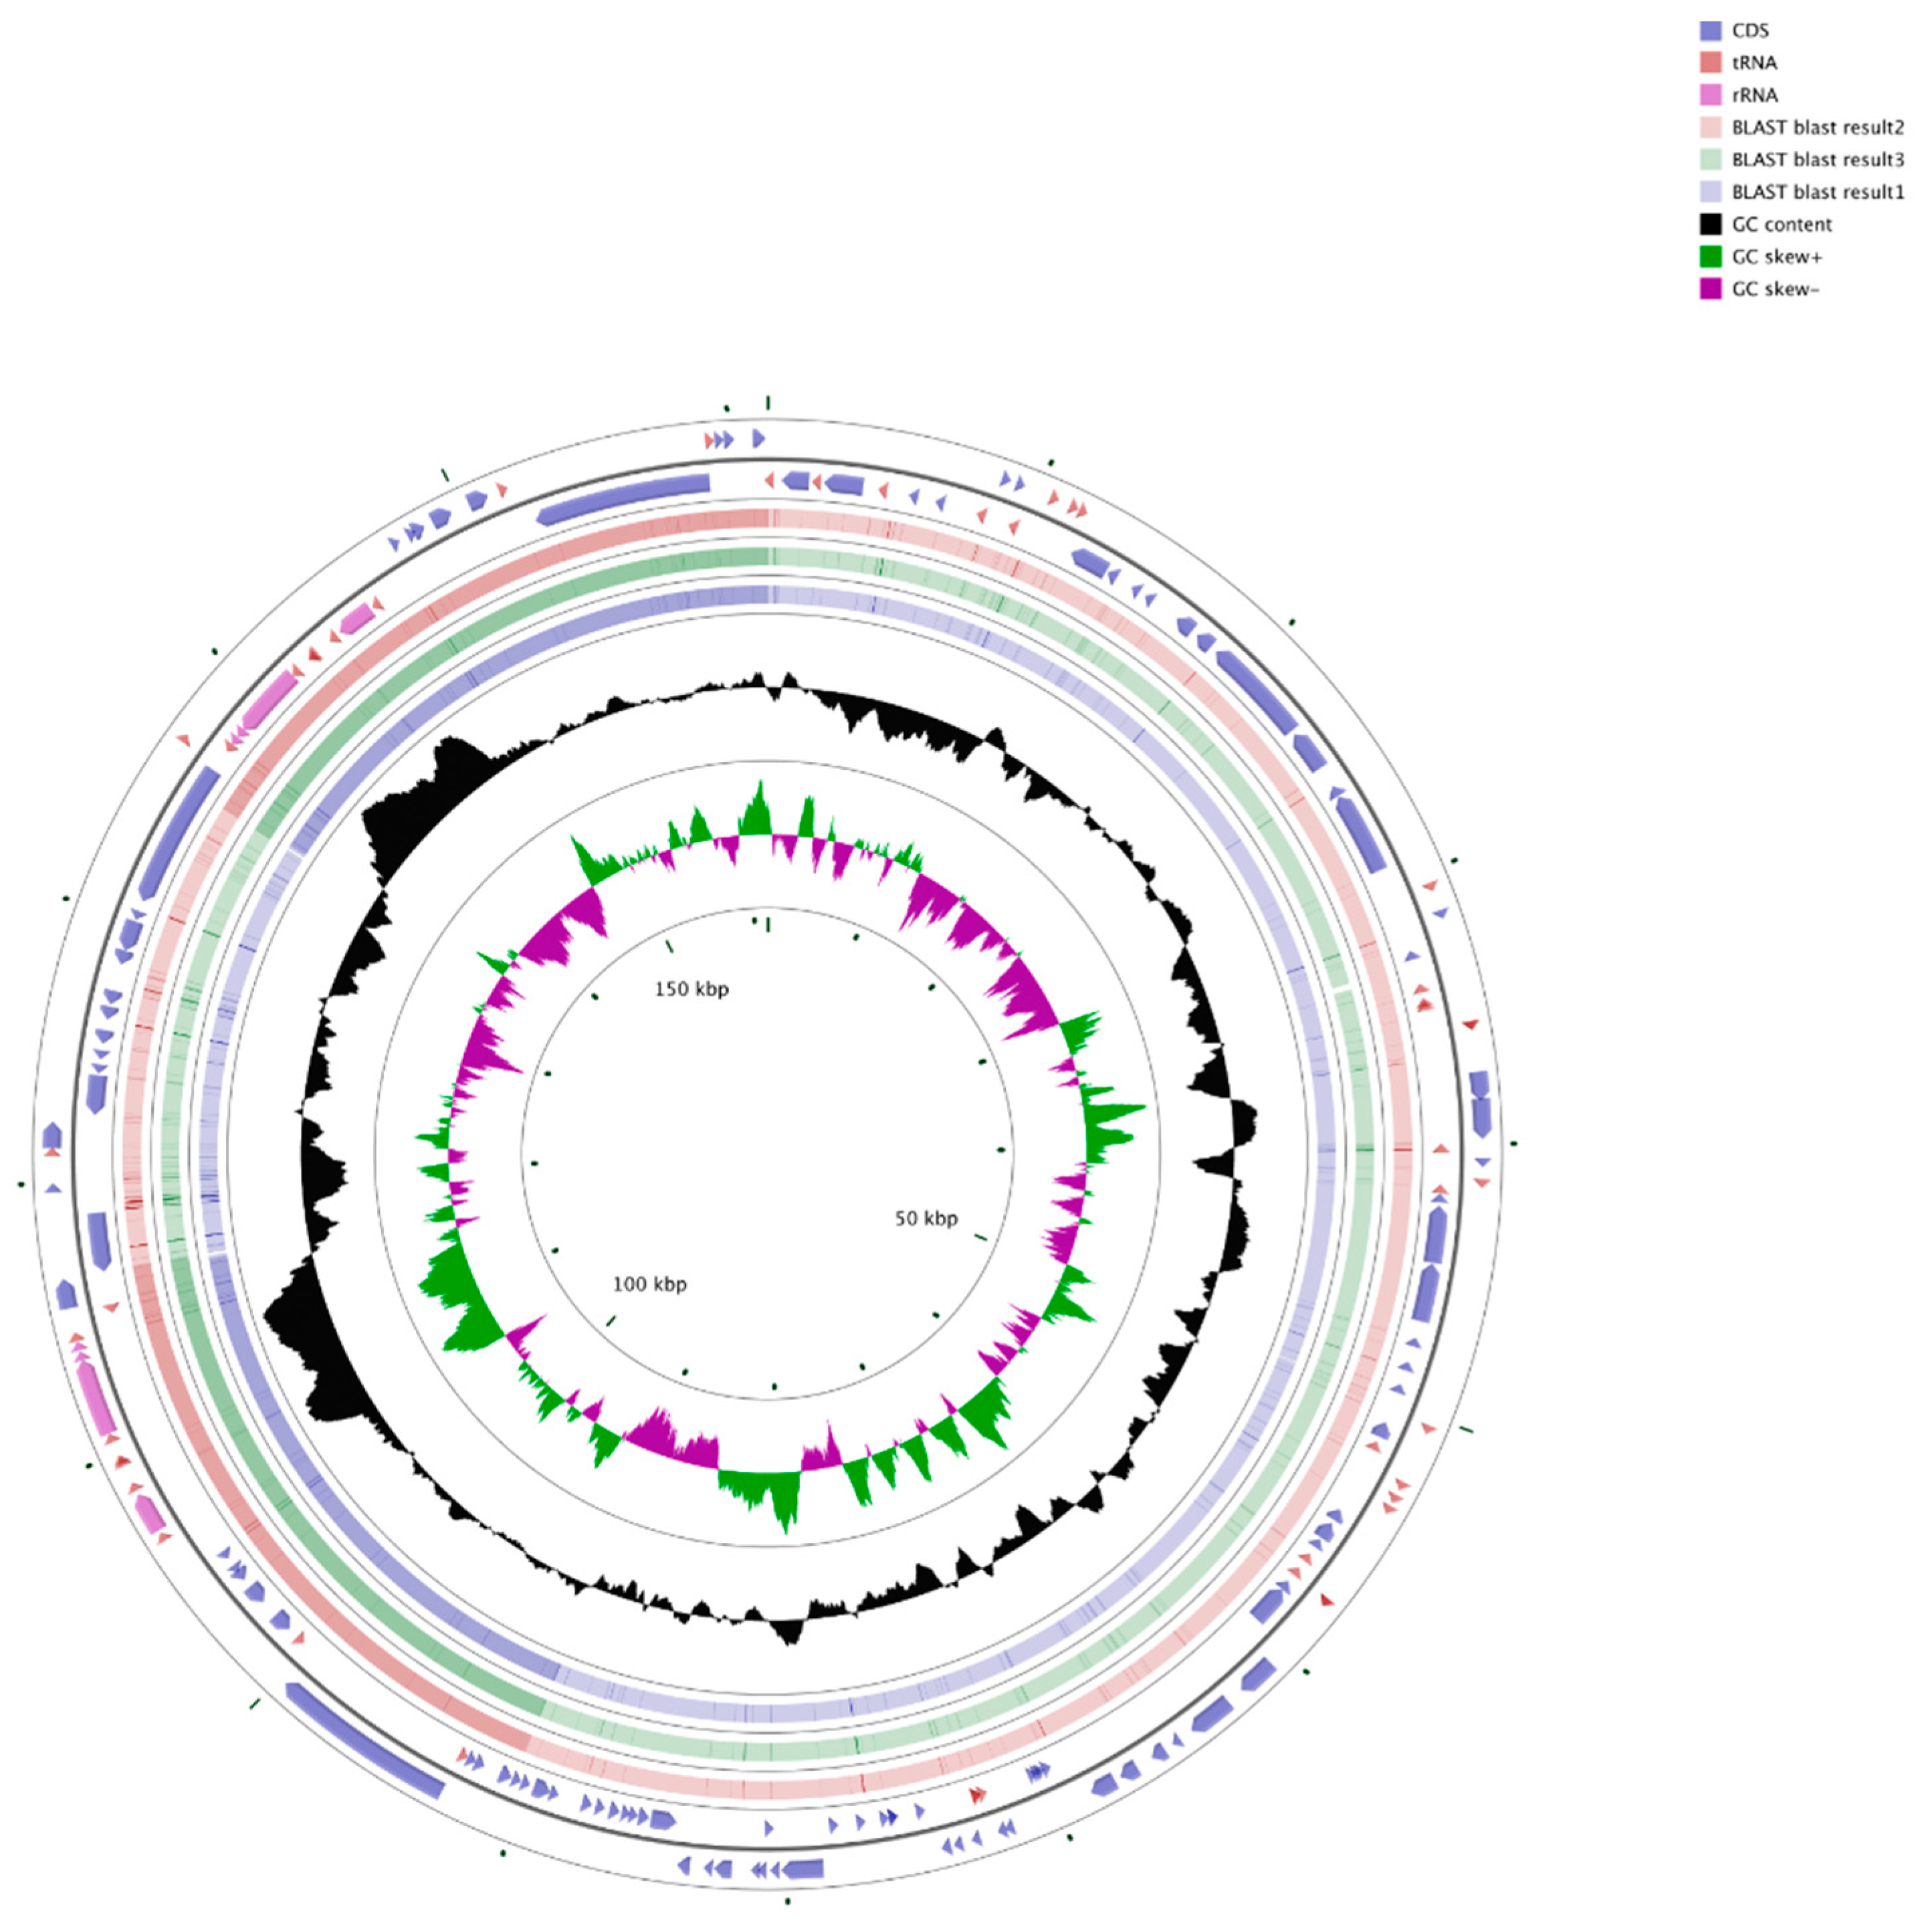
3.1. Features of the Chloroplast Genome of Q. bawanglingensis
3.2. Analysis of Long Repeats and SSRs
3.3. Comparison of Complete Chloroplast Genomes among Fagaceae Species
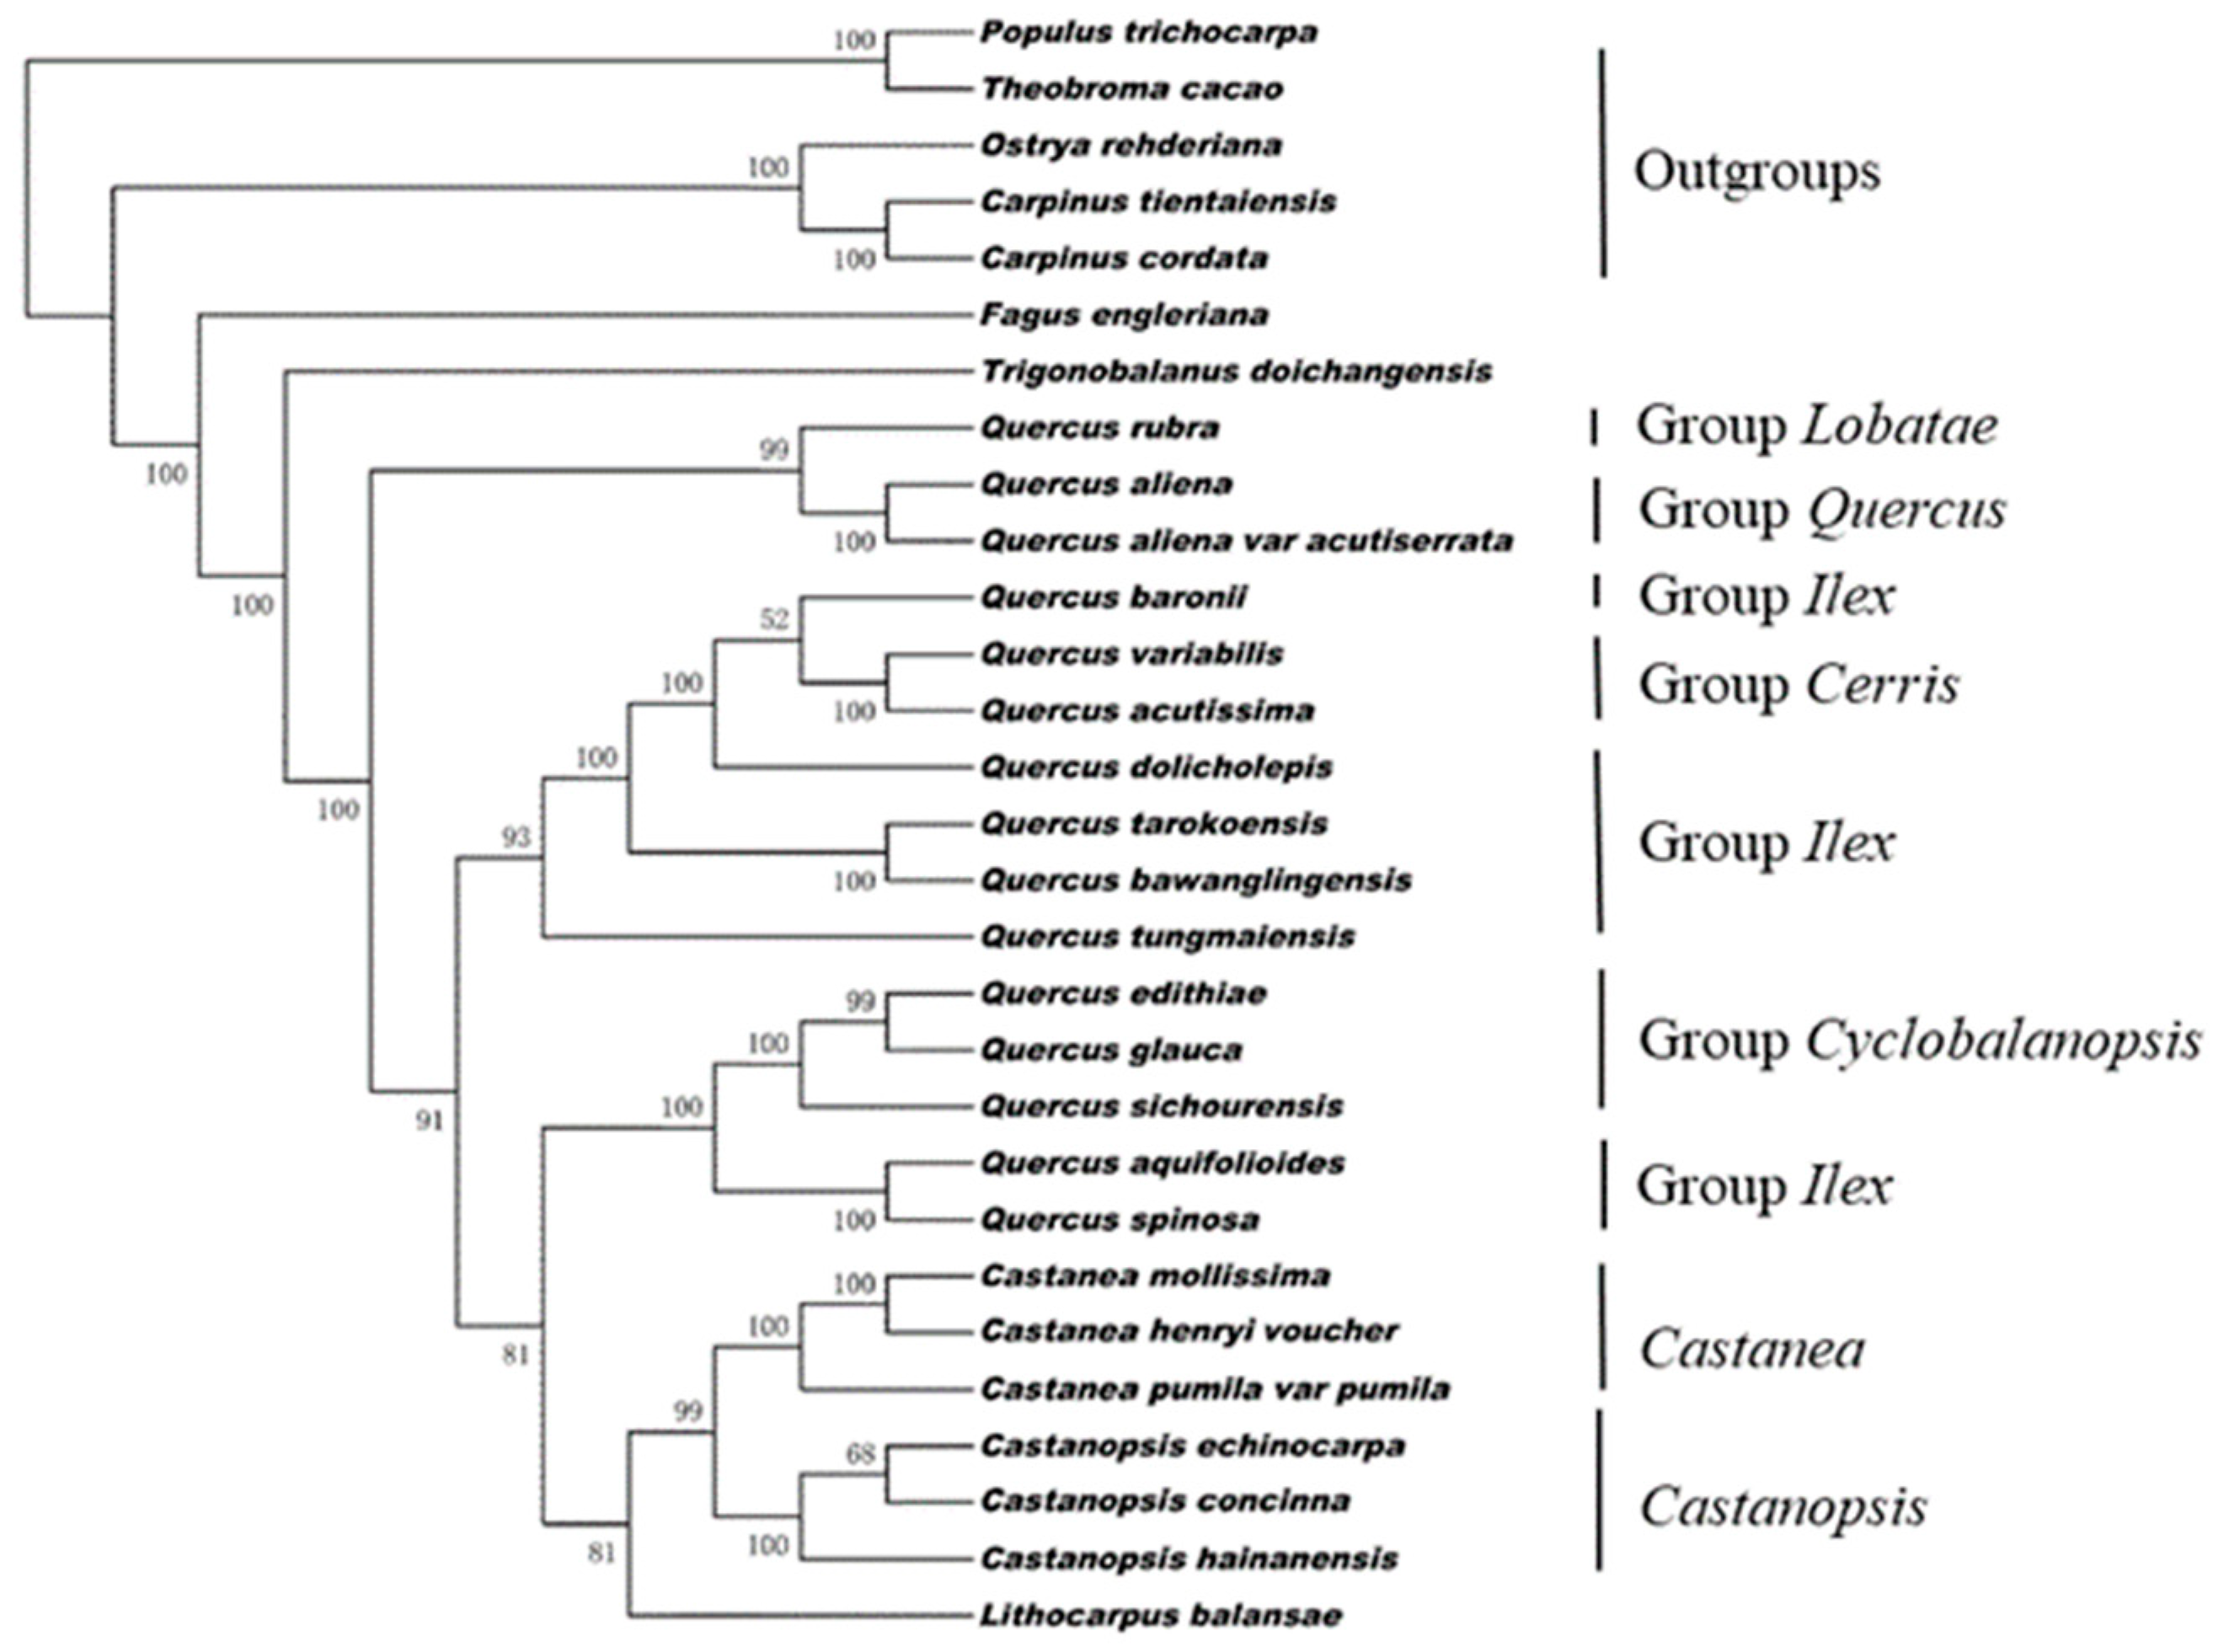
3.4. Phylogenetic Analysis
4. Discussion
5. Conclusions
Author Contributions
Funding
Acknowledgments
Conflicts of Interest
Appendix A


| Region | CDS | tRNA Genes | rRNA Genes | A (%) | T (U) (%) | C (%) | G (%) | G + C (%) |
|---|---|---|---|---|---|---|---|---|
| LSC | 61 | 25 | 32.00 | 33.40 | 17.70 | 16.90 | 34.60 | |
| SSC | 12 | 1 | 34.40 | 34.70 | 16.30 | 14.60 | 30.90 | |
| IRs | 13 | 14 | 8 | 28.60 | 28.60 | 21.40 | 21.40 | 42.70 |
| Total | 86 | 40 | 8 | 31.20 | 32.00 | 18.70 | 18.10 | 36.80 |
| Amino Acid | Codon | No. | RSCU | tRNA | Amino Acid | Codon | No. | RSCU | tRNA |
|---|---|---|---|---|---|---|---|---|---|
| Phe | UUU | 986 | 1.29 | Glu | GAG | 354 | 0.5 | ||
| Phe | UUC | 537 | 0.71 | trnF-GAA | Ser | UCU | 559 | 1.66 | |
| Leu | UUA | 896 | 1.9 | trnL-UAA | Ser | UCC | 350 | 1.04 | Trns-GGA |
| Leu | UUG | 570 | 1.21 | trnL-CAA | Ser | UCA | 404 | 1.20 | trnS-UGA |
| Leu | CUU | 590 | 1.25 | Ser | UCG | 192 | 0.57 | ||
| Leu | CUC | 203 | 0.43 | Ser | AGU | 394 | 1.17 | ||
| Leu | CUA | 373 | 0.79 | trnL-UAG | Ser | AGC | 127 | 0.38 | trnS-GCU |
| Leu | CUG | 196 | 0.42 | Pro | CCU | 408 | 1.47 | ||
| Ile | AUU | 1137 | 1.45 | Pro | CCC | 225 | 0.81 | trnP-GGG | |
| Ile | AUC | 455 | 0.58 | trnI-GAU | Pro | CCA | 313 | 1.13 | trnP-UGG |
| Ile | AUA | 758 | 0.97 | Pro | CCG | 163 | 0.59 | ||
| Met | AUG | 618 | 1.00 | trnM-CAU trnI-CAU | Thr | ACU | 535 | 1.59 | |
| Val | GUU | 509 | 1.42 | Thr | ACC | 247 | 0.73 | ||
| Val | GUC | 180 | 0.50 | trnV-GAC | Thr | ACA | 403 | 1.20 | trnT-UGU |
| Val | GUA | 545 | 1.52 | trnV-UAC | Thr | ACG | 162 | 0.48 | |
| Val | GUG | 204 | 0.57 | Ala | GCU | 632 | 1.80 | ||
| Tyr | UAU | 798 | 1.58 | Ala | GCC | 221 | 0.63 | ||
| Tyr | UAC | 212 | 0.42 | trnY-GUA | Ala | GCA | 384 | 1.09 | trnA-UGC |
| Ter | UAA | 47 | 1.64 | Ala | GCG | 169 | 0.48 | ||
| Ter | UAG | 21 | 0.73 | Cys | UGU | 222 | 1.44 | ||
| Ter | UGA | 18 | 0.63 | Cys | UGC | 86 | 0.56 | trnC-GCA | |
| His | CAU | 486 | 1.54 | Try | UGG | 463 | 1.00 | trnW-CCA | |
| His | CAC | 146 | 0.46 | trnH-GUG | Arg | CGU | 336 | 1.25 | |
| Gln | CAA | 735 | 1.55 | trnQ-UUG | Arg | CGC | 109 | 0.41 | |
| Gln | CAG | 215 | 0.45 | Arg | CGA | 354 | 1.32 | trnR-ACG | |
| Asn | AAU | 1012 | 1.54 | Arg | CGG | 122 | 0.45 | ||
| Asn | AAC | 302 | 0.46 | Arg | AGA | 505 | 1.88 | trnR-UCU | |
| Lys | AAA | 1070 | 1.47 | Arg | AGG | 186 | 0.69 | ||
| Lys | AAC | 383 | 0.53 | trnN-GUU | Gly | GGU | 582 | 1.28 | |
| Asp | GAU | 872 | 1.61 | Gly | GGC | 208 | 0.46 | trnG-GCC | |
| Asp | GAC | 208 | 0.39 | trnD-GUC | Gly | GGA | 707 | 1.55 | trnG-CCC |
| Glu | GAA | 1069 | 1.5 | trnE-UUC | Gly | GGG | 328 | 0.72 |
| Category for Genes | Group of Gene | Name of Gene |
|---|---|---|
| Photosynthesis related genes | Photosystem I | psaA, psaB, psaC, psaI, psaJ, |
| Photosystem II | psbA, psbB, psbC, psbD, psbE, psbF, psbH, psbI, psbJ, psbK, psbL, psbM, psbN, psbT, psbZ | |
| Cytochrome b/f complex | petA, petB1, petD1, petL, petG, petN | |
| ATP synthase | atpA, atpB, atpE, atpF1, atPH, atpI | |
| Cytochrome c synthesis | ccsA | |
| Assembly/stability of photosystem | ycf32, ycf4 | |
| NADPH dehydrogenase | ndhA1, ndhB1d, ndhC, ndhD, ndhE, ndhF, ndhG, ndhH, ndhI, ndhJ, ndhK | |
| Rubisco | rbcL | |
| Transcription and translation related genes | Transcription | rpoC11, rpoC2, rpoA, rpoB |
| Ribosomal proteins | rps2, rps3, rps4, rps7d, rps8, rps11, rps12d, rps14, rps15, rps161, rps18, rps19, | |
| Large subunit | rpl21, rpl14, rpl161, rpl20, rpl22, rpl23d, rpl32, rpl33, rpl36 | |
| RNA genes | Ribosomal RNA | 4.5S rRNAd, 5S rRNAd, 16S rRNAd, 23S rRNA d |
| Transfer RNA | trnH-GUG, trnK-UUU1, trnQ-UUG, trnS-GCU, trnG-GCC1, trnR-UCU, trnC-GCA, trnD-GUC, trnY-GUA, trnE-UUC, trnT-GGUd, trnM-CAU, trnS-UGA, trnG-UCC, trnfM-CAU, trnS-GGA, trnT-UGU, trnL-UAA1, trnF-GAA, trnV-UAC1, trnW-CCA, trnP-UGG, trnP-GGG, trnL-CAAd, trnV-GACd, trnI-GAU1d , trnR-ACGd, trnL-UAG, trnN-GUUd , trnA-UGC1d , trnI-CAUd | |
| Other genes | RNA processing | matK |
| Carbon metabolism | cemA | |
| Fatty acid synthesis | accD | |
| Proteolysis | clpP2 | |
| Translational initiation factor | infA | |
| Genes of unknown function | Conserved reading frames | ycf1d, ycf2 d |
| Gene | Strands | Location | Exon1 (bp) | Exon2 (bp) | Intron1 (bp) | Exon3 (bp) | Intron2 (bp) |
|---|---|---|---|---|---|---|---|
| trnK-UUU | – | LSC | 37 | 35 | 2511 | ||
| trnI-GAU | + | IRA | 37 | 35 | 955 | ||
| trnI-GAU | - | IRB | 42 | 35 | 950 | ||
| trnA-UGC | + | IRA | 38 | 35 | 800 | ||
| trnA-UGC | IRB | 38 | 35 | 800 | |||
| trnG-GCC | + | IRA | 23 | 37 | 736 | ||
| trnV-UAC | - | LSC | 38 | 35 | 630 | ||
| trnL-UAA | + | LSC | 35 | 50 | 483 | ||
| rps12 | + | IRB | 232 | 536 | 26 | ||
| rps12 | - | IRA | 231 | 537 | 30 | ||
| rpoC1 | - | LSC | 432 | 1626 | 833 | ||
| ndhB | + | IRB | 777 | 756 | 680 | ||
| ndhB | - | IRA | 777 | 756 | 680 | ||
| ndhA | - | SSC | 552 | 540 | 1037 | ||
| clpP | - | LSC | 69 | 294 | 862 | 228 | 653 |
| ycf3 | - | LSC | 126 | 228 | 721 | 153 | 768 |
| rpl16 | - | LSC | 9 | 399 | 1102 | ||
| rpl2 | - | IRA | 390 | 471 | 648 | ||
| rpl2 | + | IRB | 393 | 471 | 645 | ||
| petB | + | LSC | 6 | 642 | 843 | ||
| atpF | - | IRB | 144 | 411 | 770 | ||
| rps16 | - | LSC | 42 | 228 | 899 | ||
| petD | + | LSC | 9 | 474 | 640 |
| ID | Size (bp) | Repeat Start I | Type | Size (bp) | Repeat Start 2 | Mismatch (bp) | E-Value | Region | Gene |
|---|---|---|---|---|---|---|---|---|---|
| 1 | 18 | 325 | F | 18 | 4926 | 0 | 1.07 × 10⁻¹ | LSC | |
| 2 | 21 | 6821 | R | 21 | 6821 | 0 | 1.67 × 10⁻³ | LSC | |
| 3 | 19 | 6835 | R | 19 | 6835 | 0 | 2.67 × 10⁻² | LSC | |
| 4 | 18 | 7431 | R | 18 | 7431 | 0 | 1.07 × 10⁻¹ | LSC | |
| 5 | 18 | 8884 | R | 18 | 8884 | 0 | 1.07 × 10⁻¹ | LSC | |
| 6 | 18 | 9988 | R | 18 | 9988 | 0 | 1.07 × 10⁻¹ | LSC | |
| 7 | 31 | 11,852 | R | 31 | 11,852 | 0 | 1.59 × 10⁻⁹ | LSC | |
| 8 | 22 | 30,370 | F | 22 | 30,388 | 0 | 4.16 × 10⁻⁴ | LSC | |
| 9 | 20 | 10,290 | F | 20 | 31,747 | 0 | 6.66 × 10⁻³ | LSC | |
| 10 | 19 | 8557 | R | 19 | 35,014 | 0 | 2.67 × 10⁻² | LSC | |
| 11 | 20 | 4925 | F | 20 | 36,722 | 0 | 6.66 × 10⁻³ | LSC | |
| 12 | 18 | 325 | F | 18 | 36,723 | 0 | 1.07 × 10⁻¹ | LSC | |
| 13 | 21 | 9531 | F | 21 | 40,098 | 0 | 1.67 × 10⁻³ | LSC | trnS-GCU, trnS-UGA |
| 14 | 20 | 40,206 | R | 20 | 40,206 | 0 | 6.66 × 10⁻³ | LSC | |
| 15 | 22 | 11,376 | F | 22 | 41,438 | 0 | 4.16 × 10⁻⁴ | LSC | trnG-GCC (exon), trnG-GCC |
| 16 | 18 | 43,688 | F | 18 | 45,912 | 0 | 1.07 × 10⁻¹ | LSC | psaB, psaA |
| 17 | 19 | 21,298 | R | 19 | 54,384 | 0 | 2.67 × 10⁻² | LSC | |
| 18 | 21 | 54,575 | F | 21 | 54,594 | 0 | 1.67 × 10⁻³ | LSC | |
| 19 | 20 | 56,125 | R | 20 | 56,125 | 0 | 6.66 × 10⁻³ | LSC | ndhC |
| 20 | 21 | 62,263 | R | 21 | 62,263 | 0 | 1.67 × 10⁻³ | LSC | |
| 21 | 19 | 64,976 | R | 19 | 64,976 | 0 | 2.67 × 10⁻² | LSC | |
| 22 | 21 | 69,245 | R | 21 | 69,245 | 0 | 1.67 × 10⁻³ | LSC | |
| 23 | 18 | 69,246 | R | 18 | 69,246 | 0 | 1.07 × 10⁻¹ | LSC | |
| 24 | 18 | 69,246 | F | 18 | 69,247 | 0 | 1.07 × 10⁻¹ | LSC | |
| 25 | 18 | 69,247 | R | 18 | 69,247 | 0 | 1.07 × 10⁻¹ | LSC | |
| 26 | 19 | 71,499 | R | 19 | 71,499 | 0 | 2.67 × 10⁻² | LSC | |
| 27 | 19 | 72,775 | R | 19 | 72,775 | 0 | 2.67 × 10⁻² | LSC | |
| 28 | 18 | 18,660 | F | 18 | 76,843 | 0 | 1.07 × 10⁻¹ | LSC | clpP |
| 29 | 18 | 52,390 | F | 18 | 87,369 | 0 | 1.07 × 10⁻¹ | LSC | |
| 30 | 20 | 91,234 | F | 20 | 91,254 | 0 | 6.66 × 10⁻³ | IRB | rpl2 |
| 31 | 20 | 105,557 | F | 20 | 105,575 | 0 | 6.66 × 10⁻³ | IRB | |
| 32 | 23 | 113,771 | F | 23 | 113,802 | 0 | 1.04 × 10⁻⁴ | IRB | |
| 33 | 18 | 69,461 | F | 18 | 116,760 | 0 | 1.07 × 10⁻¹ | LSC, SSC | ndhF |
| 34 | 21 | 117,268 | R | 21 | 117,268 | 0 | 1.67 × 10⁻³ | SSC | ndhF |
| 35 | 18 | 66,388 | F | 18 | 118,801 | 0 | 1.07 × 10-01 | LSC, SSC | |
| 36 | 18 | 4934 | F | 18 | 118,916 | 0 | 1.07 × 10⁻¹ | LSC, SSC | |
| 37 | 19 | 18,660 | R | 19 | 119,064 | 0 | 2.67 × 10⁻² | LSC, SSC | |
| 38 | 23 | 119,066 | R | 23 | 119,066 | 0 | 1.04 × 10⁻⁴ | SSC | |
| 39 | 19 | 10,289 | F | 19 | 126,141 | 0 | 2.67 × 10⁻² | LSC, SSC | |
| 40 | 18 | 31,747 | F | 18 | 126,142 | 0 | 1.07 × 10⁻¹ | LSC, SSC | |
| 41 | 19 | 73,588 | F | 19 | 127,650 | 0 | 2.67 × 10⁻² | LSC, SSC | ndhA |
| 42 | 25 | 127,669 | F | 25 | 127,693 | 0 | 6.51 × 10⁻⁶ | SSC | ndhA (intron) |
| 43 | 20 | 119,064 | R | 20 | 130,690 | 0 | 6.66 × 10⁻³ | SSC | |
| 44 | 19 | 18,660 | F | 19 | 130,691 | 0 | 2.67 × 10⁻² | LSC, SSC | |
| 45 | 18 | 10,551 | F | 18 | 133,570 | 0 | 1.07 × 10⁻¹ | LSC, SSC | ycf1 |
| 46 | 24 | 116,026 | F | 24 | 135,972 | 0 | 2.60 × 10⁻⁵ | IRB, IRA | ycf1 |
| 47 | 23 | 138,197 | F | 23 | 138,228 | 0 | 1.04 × 10⁻⁴ | IRA | |
| 48 | 20 | 57,490 | F | 20 | 142,313 | 0 | 6.66 × 10⁻³ | LSC, IRA | trnV-UAC, trnA-UGC |
| 49 | 20 | 146,427 | F | 20 | 146,445 | 0 | 6.66 × 10⁻³ | IRA | |
| 50 | 20 | 160,748 | F | 20 | 160,768 | 0 | 6.66 × 10⁻³ | IRA | rpl2 |
| ID | SSR | Size | Start | End | Region | Gene | ID | SSR | Size | Start | End | Region | Gene |
|---|---|---|---|---|---|---|---|---|---|---|---|---|---|
| 1 | (A)11 | 11 | 333 | 343 | LSC | 42 | (T)10 | 10 | 59,813 | 59,822 | LSC | atpB | |
| 2 | (A)10 | 10 | 1796 | 1805 | LSC | 43 | (T)11 | 11 | 60,285 | 60,295 | LSC | ||
| 3 | (T)15 | 15 | 4116 | 4130 | LSC | trnK-UUU | 44 | (AT)6 | 12 | 62,268 | 62,279 | LSC | |
| 4 | (C)12(A)11 | 23 | 4426 | 4448 | LSC | 45 | (T)11 | 11 | 64,317 | 64,327 | LSC | accD | |
| 5 | (T)13 | 13 | 4690 | 4702 | LSC | 46 | (A)10 | 10 | 64,492 | 64,501 | LSC | ||
| 6 | (A)11 | 11 | 4934 | 4944 | LSC | 47 | (AT)7 | 14 | 64,795 | 64,808 | LSC | ||
| 7 | (A)11 | 11 | 5134 | 5144 | LSC | 48 | (T)11 | 11 | 65,170 | 65,180 | LSC | ||
| 8 | (T)11 | 11 | 6967 | 6977 | LSC | 49 | (T)10 | 10 | 66,211 | 66,220 | LSC | ||
| 9 | (A)10 | 10 | 8139 | 8148 | LSC | 50 | (T)14 | 14 | 66,389 | 66,402 | LSC | ||
| 10 | (A)16 | 16 | 8555 | 8570 | LSC | 51 | (T)10 | 10 | 68,836 | 68,845 | LSC | ||
| 11 | (A)10 | 10 | 8889 | 8898 | LSC | 52 | (A)19(AT)6 | 86 | 69,247 | 69,332 | LSC | ||
| 12 | (A)11 | 11 | 10,153 | 10,163 | LSC | 53 | (C)11 | 11 | 70,943 | 70,953 | LSC | ||
| 13 | (T)11 | 11 | 10,293 | 10,303 | LSC | 54 | (T)13 | 13 | 73,588 | 73,600 | LSC | ||
| 14 | (T)11 | 11 | 11,217 | 11,227 | LSC | trnG-GCC | 55 | (A)10 | 10 | 75,271 | 75,280 | LSC | |
| 15 | (A)11 | 11 | 13,552 | 13,562 | LSC | 56 | (A)14(A)13 | 34 | 76,829 | 76,862 | LSC | clpP | |
| 16 | (T)10(A)13(T)11 | 163 | 14,125 | 14,287 | LSC | atpF | 57 | (A)11 | 11 | 81,665 | 81,675 | LSC | PETB |
| 17 | (T)10 | 10 | 15,319 | 15,328 | LSC | 58 | (TA)7 | 14 | 83,134 | 83,147 | LSC | petD | |
| 18 | (A)12 | 12 | 18,667 | 18,678 | LSC | 59 | (A)10 | 10 | 85,981 | 85,990 | LSC | ||
| 19 | (T)10 | 10 | 20,639 | 20,648 | LSC | rpoC2 | 60 | (T)10 | 10 | 86,299 | 86,308 | LSC | |
| 20 | (T)10 | 10 | 20,768 | 20,777 | LSC | rpoC2 | 61 | (A)10(T)10 | 36 | 87,375 | 87,410 | LSC | |
| 21 | (T)12 | 12 | 21,296 | 21,307 | LSC | rpoC2 | 62 | (T)10 | 10 | 89,017 | 89,026 | LSC | |
| 22 | (C)10(A)10(T)10 | 93 | 24,830 | 24,922 | LSC | rpoC1 | 63 | (T)10 | 10 | 90,643 | 90,652 | IRB | |
| 23 | (T)17 | 17 | 25,303 | 25,319 | LSC | rpoC1 | 64 | (T)10 | 10 | 114,296 | 114,305 | IRB | |
| 24 | (T)10 | 10 | 28,570 | 28,579 | LSC | rpoB | 65 | (T)11 | 11 | 117,274 | 117,284 | SSC | ndhF |
| 25 | (T)10 | 10 | 29,642 | 29,651 | LSC | 66 | (T)15 | 15 | 118,801 | 118,815 | SSC | ||
| 26 | (C)13 | 13 | 30,442 | 30,454 | LSC | 67 | (A)10 | 10 | 118,917 | 118,926 | SSC | ||
| 27 | (T)11 | 11 | 31,750 | 31,760 | LSC | 68 | (A)12t(A)11 | 24 | 119,066 | 119,089 | SSC | ||
| 28 | (A)10 | 10 | 32,113 | 32,122 | LSC | 69 | (T)14 | 14 | 119,222 | 119,235 | SSC | ||
| 29 | (A)12 | 12 | 34,229 | 34,240 | LSC | 70 | (A)12 | 12 | 120,003 | 120,014 | SSC | ||
| 30 | (A)13 | 13 | 35,021 | 35,033 | LSC | 71 | (T)12 | 12 | 122,398 | 122,409 | SSC | ||
| 31 | (A)11 | 11 | 36,731 | 36,741 | LSC | 72 | (A)10 | 10 | 122,745 | 122,754 | SSC | ndhD | |
| 32 | (A)11 | 11 | 39,921 | 39,931 | LSC | 73 | (A)11 | 11 | 124,071 | 124,081 | SSC | ||
| 33 | (AT)6 | 12 | 40,068 | 40,079 | LSC | 74 | (T)10 | 10 | 126,004 | 126,013 | SSC | ||
| 34 | (T)14 | 14 | 40,210 | 40,223 | LSC | 75 | (T)11 | 11 | 126,145 | 126,155 | SSC | ||
| 35 | (A)13 | 13 | 40,365 | 40,377 | LSC | 76 | (A)11(T)12(A)11 | 77 | 127,622 | 127,722 | SSC | ndhA | |
| 36 | (A)10 | 10 | 40,882 | 40,891 | LSC | 77 | (T)10 | 10 | 130,474 | 130,483 | SSC | ||
| 37 | (A)10(A)10 | 89 | 52,317 | 52,405 | LSC | 78 | (A)12 | 12 | 130,698 | 130,709 | SSC | ||
| 38 | (T)11 | 11 | 53,423 | 53,433 | LSC | 79 | (T)10 | 10 | 133,670 | 133,679 | SSC | ycf1 | |
| 39 | (A)10 | 10 | 53,932 | 53,941 | LSC | 80 | (T)13 | 13 | 134,247 | 134,259 | SSC | ycf1 | |
| 40 | (T)10 | 10 | 54,316 | 54,325 | LSC | 81 | (A)10 | 10 | 137,718 | 137,727 | IRA | ||
| 41 | (A)10 | 10 | 55,210 | 55,219 | LSC | 82 | (A)10 | 10 | 161,371 | 161,380 | IRA |
References
- Birky, C.W.; Maruyama, T.; Fuerst, P. An approach to population and evolutionary genetic theory for genes in mitochondria and chloroplasts, and some results. Genetics 1983, 103, 513–527. [Google Scholar] [PubMed]
- Sugiura, M. The chloroplast genome. In 10 Years Plant Molecular Biology; Springer: Dordrecht, The Netherlands, 1992; pp. 149–168. [Google Scholar]
- Tangphatsornruang, S.; Sangsrakru, D.; Chanprasert, J.; Uthaipaisanwong, P.; Yoocha, T.; Jomchai, N.; Tragoonrung, S. The chloroplast genome sequence of mungbean (Vigna radiata) determined by high-throughput pyrosequencing: Structural organization and phylogenetic relationships. DNA Res. 2009, 17, 11–22. [Google Scholar] [CrossRef] [PubMed]
- Shinozaki, K.; Ohme, M.; Tanaka, M.; Wakasugi, T.; Hayashida, N.; Matsubayashi, T.; Zaita, N.; Chunwongse, J.; Obokata, J.; Yamaguchi-Shinozaki, K. The complete nucleotide sequence of the tobacco chloroplast genome: Its gene organization and expression. EMBO J. 1986, 5, 2043–2049. [Google Scholar] [CrossRef]
- Zhang, T.; Fang, Y.; Wang, X.; Deng, X.; Zhang, X.; Hu, S.; Yu, J. The complete chloroplast and mitochondrial genome sequences of Boea hygrometrica: Insights into the evolution of plant organellar genomes. PLoS ONE 2012, 7, e30531. [Google Scholar] [CrossRef] [PubMed]
- Cosner, M.E.; Raubeson, L.A.; Jansen, R.K. Chloroplast DNA rearrangements in Campanulaceae: Phylogenetic utility of highly rearranged genomes. BMC Evol. Biol. 2004, 4, 27. [Google Scholar] [CrossRef] [PubMed]
- Nock, C.J.; Waters, D.L.; Edwards, M.A.; Bowen, S.G.; Rice, N.; Cordeiro, G.M.; Henry, R.J. Chloroplast genome sequences from total DNA for plant identification. Plant Biotechnol. J. 2011, 9, 328–333. [Google Scholar] [CrossRef]
- Reith, M. Complete uncleotide sequence of the Porphyra purpurea chloroplast genome. Plant Mol. Biol. Rep. 1995, 13, 327–332. [Google Scholar] [CrossRef]
- Wicke, S.; Schneeweiss, G.M.; Müller, K.F.; Quandt, D. The evolution of the plastid chromosome in land plants: Gene content, gene order, gene function. Plant Mol. Biol. 2011, 76, 273–297. [Google Scholar] [CrossRef]
- Samson, N.; Bausher, M.G.; Lee, S.B.; Jansen, R.K.; Daniell, H. The complete nucleotide sequence of the coffee (Coffea arabica L.) chloroplast genome: Organization and implications for biotechnology and phylogenetic relationships amongst angiosperms. Plant Biotechnol. J. 2007, 5, 339–353. [Google Scholar] [CrossRef]
- Moore, M.J.; Bell, C.D.; Soltis, P.S.; Soltis, D.E. Using plastid genome-scale data to resolve enigmatic relationships among basal angiosperms. Proc. Natl. Acad. Sci. USA 2007, 104, 19363–19368. [Google Scholar] [CrossRef] [Green Version]
- Jansen, R.K.; Cai, Z.; Raubeson, L.A.; Daniell, H.; Depamphilis, C.W.; Leebens-Mack, J.; Müller, K.F.; Guisinger-Bellian, M.; Haberle, R.C.; Hansen, A.K. Analysis of 81 genes from 64 plastid genomes resolves relationships in angiosperms and identifies genome-scale evolutionary patterns. Proc. Natl. Acad. Sci. USA 2007, 104, 19369–19374. [Google Scholar] [CrossRef] [PubMed] [Green Version]
- Lin, C.-P.; Huang, J.-P.; Wu, C.-S.; Hsu, C.-Y.; Chaw, S.-M. Comparative chloroplast genomics reveals the evolution of Pinaceae genera and subfamilies. Genome Biol. Evol. 2010, 2, 504–517. [Google Scholar] [CrossRef] [PubMed]
- Parks, M.; Cronn, R.; Liston, A. Increasing phylogenetic resolution at low taxonomic levels using massively parallel sequencing of chloroplast genomes. BMC Biol. 2009, 7, 84. [Google Scholar] [CrossRef] [PubMed]
- Liu, L.; Wang, Y.; He, P.; Li, P.; Lee, J.; Soltis, D.E.; Fu, C. Chloroplast genome analyses and genomic resource development for epilithic sister genera Oresitrophe and Mukdenia (Saxifragaceae), using genome skimming data. BMC Genom. 2018, 19, 235. [Google Scholar] [CrossRef] [PubMed]
- Li, Z.-H.; Ma, X.; Wang, D.-Y.; Li, Y.-X.; Wang, C.-W.; Jin, X.-H. Evolution of plastid genomes of Holcoglossum (Orchidaceae) with recent radiation. BMC Evol. Biol. 2019, 19, 63. [Google Scholar] [CrossRef]
- Haig, S.M. Molecular contributions to conservation. Ecology 1998, 79, 413–425. [Google Scholar] [CrossRef]
- Juchum, F.; Leal, J.; Santos, L.; Almeida, M.; Ahnert, D.; Corrêa, R. Evaluation of genetic diversity in a natural rosewood population (Dalbergia nigra Vell. Allemão ex Benth.) using RAPD markers. Genet. Mol. Res. 2007, 6, 543–553. [Google Scholar]
- Lira, C.F.; Cardoso, S.R.S.; Ferreira, P.C.G.; Cardoso, M.A.; Provan, J. Long-term population isolation in the endangered tropical tree species Caesalpinia echinata Lam. revealed by chloroplast microsatellites. Mol. Ecol. 2003, 12, 3219–3225. [Google Scholar] [CrossRef]
- McCauley, D.E. The use of chloroplast DNA polymorphism in studies of gene flow in plants. Trends Ecol. Evol. 1995, 10, 198–202. [Google Scholar] [CrossRef]
- Ennos, R.A. Using organelle markers to elucidate the history, ecology and evolution of plant populations. Mol. Syst. Plant Evol. 1999, 1–19. [Google Scholar] [CrossRef]
- Gregory, T.R. DNA barcoding does not compete with taxonomy. Nature 2005, 434, 1067. [Google Scholar] [CrossRef] [PubMed]
- Qian, W.; Qiu-Shi, Y.; Jian-Quan, L. Are nuclear loci ideal for barcoding plants? A case study of genetic delimitation of two sister species using multiple loci and multiple intraspecific individuals. J. Syst. Evol. 2011, 49, 182–188. [Google Scholar]
- Barrett, C.F.; Davis, J.I.; Leebens-Mack, J.; Conran, J.G.; Stevenson, D.W. Plastid genomes and deep relationships among the commelinid monocot angiosperms. Cladistics 2013, 29, 65–87. [Google Scholar] [CrossRef]
- Li, X.; Yang, Y.; Henry, R.J.; Rossetto, M.; Wang, Y.; Chen, S. Plant DNA barcoding: From gene to genome. Biol. Rev. 2015, 90, 157–166. [Google Scholar] [CrossRef] [PubMed]
- Nixon, K.C.; Crepet, W.L. Trigonobalanus (Fagaceae): Taxonomic status and phylogenetic relationships. Am. J. Bot. 1989, 76, 828–841. [Google Scholar] [CrossRef]
- Nixon, K.C. Infrageneric classification of Quercus (Fagaceae) and typification of sectional names. In Annales des Sciences Forestières; EDP Sciences: Les Ulis, France, 1993. [Google Scholar]
- Hubert, F.; Grimm, G.W.; Jousselin, E.; Berry, V.; Franc, A.; Kremer, A. Multiple nuclear genes stabilize the phylogenetic backbone of the genus Quercus. Syst. Biodivers. 2014, 12, 405–423. [Google Scholar] [CrossRef]
- Ørsted, A.S. Bidrag til kundskab om Egefamilien i Nutid og Fortid; Mathematisk-naturvidenskabelig Klass: Skrifter Udgivne af Videnskabs-Selskabet i Christiana; Bianco Lunos Bogtr.: Copenhagen, Denmark, 1871. [Google Scholar]
- Denk, T.; Grimm, G.W.; Manos, P.S.; Deng, M.; Hipp, A.L. An updated infrageneric classification of the oaks: Review of previous taxonomic schemes and synthesis of evolutionary patterns. In Oaks Physiological Ecology. Exploring the Functional Diversity of Genus Quercus L.; Springer: Cham, Switzerland, 2017. [Google Scholar]
- Kim, K.; Lee, S.-C.; Lee, J.; Yu, Y.; Yang, K.; Choi, B.-S.; Koh, H.-J.; Waminal, N.E.; Choi, H.-I.; Kim, N.-H. Complete chloroplast and ribosomal sequences for 30 accessions elucidate evolution of Oryza AA genome species. Sci. Rep. 2015, 5, 15655. [Google Scholar] [CrossRef] [PubMed]
- Yang, J.; Yue, M.; Niu, C.; Ma, X.-F.; Li, Z.-H. Comparative analysis of the complete chloroplast genome of four endangered herbals of Notopterygium. Genes 2017, 8, 124. [Google Scholar] [CrossRef] [PubMed]
- Oh, S.-H.; Manos, P.S. Molecular phylogenetics and cupule evolution in Fagaceae as inferred from nuclear CRABS CLAW sequences. Taxon 2008, 57, 434–451. [Google Scholar]
- Pelser, P.B.; Kennedy, A.H.; Tepe, E.J.; Shidler, J.B.; Nordenstam, B.; Kadereit, J.W.; Watson, L.E. Patterns and causes of incongruence between plastid and nuclear Senecioneae (Asteraceae) phylogenies. Am. J. Bot. 2010, 97, 856–873. [Google Scholar] [CrossRef] [PubMed] [Green Version]
- Pérez-Escobar, O.A.; Balbuena, J.A.; Gottschling, M. Rumbling orchids: How to assess divergent evolution between chloroplast endosymbionts and the nuclear host. Syst. Biol. 2015, 65, 51–65. [Google Scholar] [CrossRef] [PubMed]
- Hipp, A.L.; Eaton, D.A.; Cavender-Bares, J.; Fitzek, E.; Nipper, R.; Manos, P.S. A framework phylogeny of the American oak clade based on sequenced RAD data. PLoS ONE 2014, 9, e93975. [Google Scholar] [CrossRef] [PubMed]
- McVay, J.D.; Hipp, A.L.; Manos, P.S. A genetic legacy of introgression confounds phylogeny and biogeography in oaks. Proc. R. Soc. B Biol. Sci. 2017, 284, 20170300. [Google Scholar] [CrossRef] [PubMed] [Green Version]
- Pham, K.K.; Hipp, A.L.; Manos, P.S.; Cronn, R.C. A time and a place for everything: Phylogenetic history and geography as joint predictors of oak plastome phylogeny. Genome 2017, 60, 720–732. [Google Scholar] [CrossRef] [PubMed]
- Simeone, M.C.; Cardoni, S.; Piredda, R.; Imperatori, F.; Avishai, M.; Grimm, G.W.; Denk, T. Comparative systematics and phylogeography of Quercus Section Cerris in western Eurasia: Inferences from plastid and nuclear DNA variation. PeerJ 2018, 6, e5793. [Google Scholar] [CrossRef] [PubMed]
- Yang, J.; Vázquez, L.; Chen, X.; Li, H.; Zhang, H.; Liu, Z.; Zhao, G. Development of chloroplast and nuclear DNA markers for Chinese oaks (Quercus subgenus Quercus) and assessment of their utility as DNA barcodes. Front. Plant Sci. 2017, 8, 816. [Google Scholar] [CrossRef]
- Qin, H.; Yang, Y.; Dong, S.; He, Q.; Jia, Y.; Zhao, L.; Yu, S.; Liu, H.; Liu, B.; Yan, Y. Threatened species list of China’s higher plants. Biodivers. Sci. 2017, 25, 744. [Google Scholar] [CrossRef]
- Deng, M.; Jiang, X.-L.; Song, Y.-G.; Coombes, A.; Yang, X.-R.; Xiong, Y.-S.; Li, Q.-S. Leaf epidermal features of Quercus Group Ilex (Fagaceae) and their application to species identification. Rev. Palaeobot. Palynol. 2017, 237, 10–36. [Google Scholar] [CrossRef]
- Yang, Y.; Hu, Y.; Ren, T.; Sun, J.; Zhao, G. Remarkably conserved plastid genomes of Quercus group Cerris in China: Comparative and phylogenetic analyses. Nord. J. Bot. 2018, 36, e01921. [Google Scholar] [CrossRef]
- Yang, Y.; Zhou, T.; Duan, D.; Yang, J.; Feng, L.; Zhao, G. Comparative analysis of the complete chloroplast genomes of five Quercus species. Front. Plant Sci. 2016, 7, 959. [Google Scholar] [CrossRef]
- Yang, Y.; Zhu, J.; Feng, L.; Zhou, T.; Bai, G.; Yang, J.; Zhao, G. Plastid genome comparative and phylogenetic analyses of the key genera in Fagaceae: Highlighting the effect of codon composition bias in phylogenetic inference. Front. Plant Sci. 2018, 9, 82. [Google Scholar] [CrossRef] [PubMed]
- Li, X.; Li, Y.; Zang, M.; Li, M.; Fang, Y. Complete chloroplast genome sequence and phylogenetic analysis of Quercus acutissima. Int. J. Mol. Sci. 2018, 19, 2443. [Google Scholar] [CrossRef] [PubMed]
- Zhang, R.; Qin, X.; Chen, H.; Chan, B.P.L.; Xing, F.; Xu, Z. Phytogeography and floristic affinities of the limestone flora of Mt. Exianling, Hainan Island, China. Bot. Rev. 2017, 83, 38–58. [Google Scholar] [CrossRef]
- Doyle, J.J. A rapid DNA isolation procedure for small quantities of fresh leaf tissue. Phytochem. Bull. 1987, 19, 11–15. [Google Scholar]
- Dierckxsens, N.; Mardulyn, P.; Smits, G. NOVOPlasty: De novo assembly of organelle genomes from whole genome data. Nucleic Acids Res. 2016, 45, e18. [Google Scholar]
- Liu, C.; Shi, L.; Zhu, Y.; Chen, H.; Zhang, J.; Lin, X.; Guan, X. CpGAVAS, an integrated web server for the annotation, visualization, analysis, and GenBank submission of completely sequenced chloroplast genome sequences. BMC Genom. 2012, 13, 715. [Google Scholar] [CrossRef]
- Wyman, S.K.; Jansen, R.K.; Boore, J.L. Automatic annotation of organellar genomes with DOGMA. Bioinformatics 2004, 20, 3252–3255. [Google Scholar] [CrossRef] [Green Version]
- Schattner, P.; Brooks, A.N.; Lowe, T.M. The tRNAscan-SE, snoscan and snoGPS web servers for the detection of tRNAs and snoRNAs. Nucleic Acids Res. 2005, 33, W686–W689. [Google Scholar] [CrossRef]
- Lohse, M.; Drechsel, O.; Bock, R. Organellar Genome DRAW (OGDRAW): A tool for the easy generation of high-quality custom graphical maps of plastid and mitochondrial genomes. Curr. Genet. 2007, 52, 267–274. [Google Scholar] [CrossRef]
- Mudunuri, S.B.; Nagarajaram, H.A. IMEx: Imperfect microsatellite extractor. Bioinformatics 2007, 23, 1181–1187. [Google Scholar] [CrossRef]
- Kurtz, S.; Choudhuri, J.V.; Ohlebusch, E.; Schleiermacher, C.; Stoye, J.; Giegerich, R. REPuter: The manifold applications of repeat analysis on a genomic scale. Nucleic Acids Res. 2001, 29, 4633–4642. [Google Scholar] [CrossRef] [PubMed]
- Katoh, K.; Kuma, K.-I.; Toh, H.; Miyata, T. MAFFT version 5: Improvement in accuracy of multiple sequence alignment. Nucleic Acids Res. 2005, 33, 511–518. [Google Scholar] [CrossRef] [PubMed]
- Mayor, C.; Brudno, M.; Schwartz, J.R.; Poliakov, A.; Rubin, E.M.; Frazer, K.A.; Pachter, L.S.; Dubchak, I. VISTA: Visualizing global DNA sequence alignments of arbitrary length. Bioinformatics 2000, 16, 1046–1047. [Google Scholar] [CrossRef] [PubMed]
- Frazer, K.A.; Pachter, L.; Poliakov, A.; Rubin, E.M.; Dubchak, I. VISTA: Computational tools for comparative genomics. Nucleic Acids Res. 2004, 32, W273–W279. [Google Scholar] [CrossRef] [PubMed]
- Librado, P.; Rozas, J. DnaSP v5: A software for comprehensive analysis of DNA polymorphism data. Bioinformatics 2009, 25, 1451–1452. [Google Scholar] [CrossRef] [PubMed]
- Hall, T.A. BioEdit: A user-friendly biological sequence alignment editor and analysis program for Windows 95/98/NT. Nucleic Acids Symp. Ser. 1999, 41, 95–98. [Google Scholar]
- Price, M.N.; Dehal, P.S.; Arkin, A.P. FastTree 2-approximately maximum-likelihood trees for large alignments. PLoS ONE 2010, 5, e9490. [Google Scholar] [CrossRef]
- Hu, H.-L.; Zhang, J.-Y.; Li, Y.-P.; Xie, L.; Chen, D.-B.; Li, Q.; Liu, Y.-Q.; Hui, S.-R.; Qin, L. The complete chloroplast genome of the daimyo oak, Quercus dentata Thunb. Conserv. Genet. Resour. 2018, 1–3. [Google Scholar] [CrossRef]
- Zhang, X.; Hu, Y.; Liu, M.; Lang, T. Optimization of Assembly Pipeline may Improve the Sequence of the Chloroplast Genome in Quercus spinosa. Sci. Rep. 2018, 8, 8906. [Google Scholar] [CrossRef]
- Wang, R.-J.; Cheng, C.-L.; Chang, C.-C.; Wu, C.-L.; Su, T.-M.; Chaw, S.-M. Dynamics and evolution of the inverted repeat-large single copy junctions in the chloroplast genomes of monocots. BMC Evol. Biol. 2008, 8, 36. [Google Scholar] [CrossRef]
- Yao, X.; Tang, P.; Li, Z.; Li, D.; Liu, Y.; Huang, H. The first complete chloroplast genome sequences in Actinidiaceae: Genome structure and comparative analysis. PLoS ONE 2015, 10, e0129347. [Google Scholar] [CrossRef] [PubMed]
- Raubeson, L.A.; Peery, R.; Chumley, T.W.; Dziubek, C.; Fourcade, H.M.; Boore, J.L.; Jansen, R.K. Comparative chloroplast genomics: Analyses including new sequences from the angiosperms Nuphar advena and Ranunculus macranthus. BMC Genom. 2007, 8, 174. [Google Scholar] [CrossRef] [PubMed]
- Kode, V.; Mudd, E.A.; Iamtham, S.; Day, A. The tobacco plastid accD gene is essential and is required for leaf development. Plant J. 2005, 44, 237–244. [Google Scholar] [CrossRef] [PubMed]
- Nguyen, P.A.T.; Kim, J.S.; Kim, J.-H. The complete chloroplast genome of colchicine plants (Colchicum autumnale L. and Gloriosa superba L.) and its application for identifying the genus. Planta 2015, 242, 223–237. [Google Scholar] [CrossRef] [PubMed]
- Firetti, F.; Zuntini, A.R.; Gaiarsa, J.W.; Oliveira, R.S.; Lohmann, L.G.; Van Sluys, M.A. Complete chloroplast genome sequences contribute to plant species delimitation: A case study of the Anemopaegma species complex. Am. J. Bot. 2017, 104, 1493–1509. [Google Scholar] [CrossRef] [PubMed]
- Perry, A.S.; Wolfe, K.H. Nucleotide substitution rates in legume chloroplast DNA depend on the presence of the inverted repeat. J. Mol. Evol. 2002, 55, 501–508. [Google Scholar] [CrossRef]
- Khakhlova, O.; Bock, R. Elimination of deleterious mutations in plastid genomes by gene conversion. Plant J. 2006, 46, 85–94. [Google Scholar] [CrossRef] [PubMed]
- Shaw, J.; Lickey, E.B.; Schilling, E.E.; Small, R.L. Comparison of whole chloroplast genome sequences to choose noncoding regions for phylogenetic studies in angiosperms: The tortoise and the hare III. Am. J. Bot. 2007, 94, 275–288. [Google Scholar] [CrossRef] [PubMed]
- Hollingsworth, P.M.; Forrest, L.L.; Spouge, J.L.; Hajibabaei, M.; Ratnasingham, S.; van der Bank, M.; Chase, M.W.; Cowan, R.S.; Erickson, D.L.; Fazekas, A.J.; et al. A DNA barcode for land plants. Proc. Natl. Acad. Sci. USA 2009, 106, 12794–12797. [Google Scholar] [CrossRef] [Green Version]
- Shaw, J.; Shafer, H.L.; Leonard, O.R.; Kovach, M.J.; Schorr, M.; Morris, A.B. Chloroplast DNA sequence utility for the lowest phylogenetic and phylogeographic inferences in angiosperms: The tortoise and the hare IV. Am. J. Bot. 2014, 101, 1987–2004. [Google Scholar] [CrossRef] [PubMed] [Green Version]
- Yang, Z.; Zhao, T.; Ma, Q.; Liang, L.; Wang, G. Comparative genomics and phylogenetic analysis revealed the chloroplast genome variation and interspecific relationships of Corylus (Betulaceae) Species. Front. Plant Sci. 2018, 9, 927. [Google Scholar] [CrossRef]
- Dong, W.; Xu, C.; Li, C.; Sun, J.; Zuo, Y.; Shi, S.; Cheng, T.; Guo, J.; Zhou, S. ycf1, the most promising plastid DNA barcode of land plants. Sci. Rep. 2015, 5, 8348. [Google Scholar] [CrossRef] [PubMed]
- Li, J.; Su, Y.; Wang, T. The Repeat Sequences and Elevated Substitution Rates of the Chloroplast accD Gene in Cupressophytes. Front. Plant Sci. 2018, 9, 533. [Google Scholar] [CrossRef] [PubMed]
- Nagalingum, N.S.; Schneider, H.; Pryer, K.M. Molecular phylogenetic relationships and morphological evolution in the heterosporous fern genus Marsilea. Syst. Bot. 2007, 32, 16–25. [Google Scholar] [CrossRef]
- Zecca, G.; Abbott, J.R.; Sun, W.-B.; Spada, A.; Sala, F.; Grassi, F. The timing and the mode of evolution of wild grapes (Vitis). Mol. Phylogenet. Evol. 2012, 62, 736–747. [Google Scholar] [CrossRef] [PubMed]
- Díaz, J.G.; Bauters, K.; Xanthos, M.; Larridon, I. Scleria diversity in Madagascar: Evolutionary links to mainland Africa. Royal Botanic Gardens, Kew 2017. [Google Scholar]
- Moura, M.N.; Santos-Silva, F.; Gomes-da-Silva, J.; de Almeida, J.P.P.; Forzza, R.C. Between Spines and Molecules: A Total Evidence Phylogeny of the Brazilian Endemic Genus Encholirium (Pitcairnioideae, Bromeliaceae). Syst. Bot. 2019. [Google Scholar] [CrossRef]
- Kikuchi, S.; Bédard, J.; Hirano, M.; Hirabayashi, Y.; Oishi, M.; Imai, M.; Takase, M.; Ide, T.; Nakai, M. Uncovering the protein translocon at the chloroplast inner envelope membrane. Science 2013, 339, 571–574. [Google Scholar] [CrossRef]
- De Cambiaire, J.-C.; Otis, C.; Lemieux, C.; Turmel, M. The complete chloroplast genome sequence of the chlorophycean green alga Scenedesmus obliquus reveals a compact gene organization and a biased distribution of genes on the two DNA strands. BMC Evol. Biol. 2006, 6, 37. [Google Scholar] [CrossRef]
- Clegg, M.T.; Gaut, B.S.; Learn, G.H.; Morton, B.R. Rates and patterns of chloroplast DNA evolution. Proc. Natl. Acad. Sci. USA 1994, 91, 6795–6801. [Google Scholar] [CrossRef]
- Guo, S.; Guo, L.; Zhao, W.; Xu, J.; Li, Y.; Zhang, X.; Shen, X.; Wu, M.; Hou, X. Complete chloroplast genome sequence and phylogenetic analysis of Paeonia ostii. Molecules 2018, 23, 246. [Google Scholar] [CrossRef] [PubMed]
- Kuang, D.-Y.; Wu, H.; Wang, Y.-L.; Gao, L.-M.; Zhang, S.-Z.; Lu, L. Complete chloroplast genome sequence of Magnolia kwangsiensis (Magnoliaceae): Implication for DNA barcoding and population genetics. Genome 2011, 54, 663–673. [Google Scholar] [CrossRef] [PubMed]
- Shimda, H.; Sugiuro, M. Fine structural features of the chloroplast genome: Comparison of the sequenced chloroplast genomes. Nucleic Acids Res. 1991, 19, 983–995. [Google Scholar] [CrossRef] [PubMed]
- Lobry, J.R. Asymmetric substitution patterns in the two DNA strands of bacteria. Mol. Biol. Evol. 1996, 13, 660–665. [Google Scholar] [CrossRef] [PubMed] [Green Version]
- Necşulea, A.; Lobry, J.R. A new method for assessing the effect of replication on DNA base composition asymmetry. Mol. Biol. Evol. 2007, 24, 2169–2179. [Google Scholar]
- Tillier, E.R.; Collins, R.A. The contributions of replication orientation, gene direction, and signal sequences to base-composition asymmetries in bacterial genomes. J. Mol. Evol. 2000, 50, 249–257. [Google Scholar] [CrossRef]
- Delannoy, E.; Fujii, S.; Colas des Francs-Small, C.; Brundrett, M.; Small, I. Rampant gene loss in the underground orchid Rhizanthella gardneri highlights evolutionary constraints on plastid genomes. Mol. Biol. Evol. 2011, 28, 2077–2086. [Google Scholar] [CrossRef] [PubMed]
- Flannery, M.; Mitchell, F.; Coyne, S.; Kavanagh, T.; Burke, J.; Salamin, N.; Dowding, P.; Hodkinson, T.J. Plastid genome characterisation in Brassica and Brassicaceae using a new set of nine SSRs. Theor. Appl. Genet. 2006, 113, 1221–1231. [Google Scholar] [CrossRef]
- Provan, J. Novel chloroplast microsatellites reveal cytoplasmic variation in Arabidopsis thaliana. Mol. Ecol. 2000, 9, 2183–2185. [Google Scholar] [CrossRef]
- Bryan, G.; McNicoll, J.; Ramsay, G.; Meyer, R.; De Jong, W. Polymorphic simple sequence repeat markers in chloroplast genomes of Solanaceous plants. Theor. Appl. Genet. 1999, 99, 859–867. [Google Scholar] [CrossRef]
- Asaf, S.; Khan, A.L.; Khan, M.A.; Waqas, M.; Kang, S.-M.; Yun, B.-W.; Lee, I.-J. Chloroplast genomes of Arabidopsis halleri ssp. gemmifera and Arabidopsis lyrata ssp. petraea: Structures and comparative analysis. Sci. Rep. 2017, 7, 7556. [Google Scholar] [CrossRef] [PubMed]
- Schroeder, H.; Cronn, R.; Yanbaev, Y.; Jennings, T.; Mader, M.; Degen, B.; Kersten, B. Development of molecular markers for determining continental origin of wood from white oaks (Quercus L. sect. Quercus). PLoS ONE 2016, 11, e0158221. [Google Scholar] [CrossRef] [PubMed]
- Powell, W.; Morgante, M.; Andre, C.; McNicol, J.; Machray, G.; Doyle, J.; Tingey, S.; Rafalski, J. Hypervariable microsatellites provide a general source of polymorphic DNA markers for the chloroplast genome. Curr. Biol. 1995, 5, 1023–1029. [Google Scholar] [CrossRef] [Green Version]
- Li, X.; Gao, H.; Wang, Y.; Song, J.; Henry, R.; Wu, H.; Hu, Z.; Yao, H.; Luo, H.; Luo, K.; et al. Complete chloroplast genome sequence of Magnolia grandiflora and comparative analysis with related species. Sci. China Life Sci. 2013, 56, 189–198. [Google Scholar] [CrossRef] [PubMed]
- Zhou, Z. Fossils of the Fagaceae and their implications in systematics and biogeography. Acta Phytotaxon. Sin. 1999, 37, 369–385. [Google Scholar]
- Pu, C.; Zhou, Z.; Luo, Y. A cladistic analysis of Quercus (Fagaceae) in China based on leaf epidermic and architecture. Acta Bot. Yunnanica 2002, 24, 689–698. [Google Scholar]
- Editorial Committee of Flora of China. Flora of China; Science Press: Beijing, China, 1998. [Google Scholar]
- Denk, T.; Grimm, G.W. The oaks of western Eurasia: Traditional classifications and evidence from two nuclear markers. Taxon 2010, 59, 351–366. [Google Scholar] [CrossRef]


| Genome Features | Genome Size (bp) | LSC Length (bp) | SSC Length (bp) | IRs Length (bp) | Number of Genes | Number of Protein Coding Genes | Number of tRNA Genes | Number of rRNA Genes | GC Content (%) |
|---|---|---|---|---|---|---|---|---|---|
| Q. bawanglingensis Huang, Li et Xing | 161,394 | 90,628 | 19,036 | 51,730 | 134 | 86 | 40 | 8 | 36.8 |
| Q. tarokoensis Hayata | 161,355 | 90,602 | 19,033 | 51,720 | 134 | 86 | 40 | 8 | 36.9 |
| Q. aliena var. acutiserrata Maxim. ex Wenz. | 161,153 | 90,457 | 19,044 | 51,652 | 134 | 86 | 40 | 8 | 36.8 |
| Q. variabilis Bl. | 161,077 | 90,387 | 19,056 | 51,634 | 134 | 86 | 40 | 8 | 36.8 |
| Q. baronii Skan | 161,072 | 90,341 | 19,045 | 51,686 | 134 | 86 | 40 | 8 | 36.8 |
| Q. aquifolioides Rehd. et Wils. | 161,225 | 90,535 | 19,000 | 51,690 | 134 | 86 | 40 | 8 | 36.8 |
| Fagus engleriana Seem. | 158,346 | 87,667 | 18,895 | 51,784 | 131 | 83 | 40 | 8 | 37.1 |
| Lithocarpus balansae (Drake) A. Camus | 161,020 | 90,596 | 19,160 | 51,264 | 134 | 87 | 39 | 8 | 36.7 |
| Castanea mollissima Bl. | 160,799 | 90,432 | 18,995 | 51,372 | 130 | 83 | 37 | 8 | 36.8 |
© 2019 by the authors. Licensee MDPI, Basel, Switzerland. This article is an open access article distributed under the terms and conditions of the Creative Commons Attribution (CC BY) license (http://creativecommons.org/licenses/by/4.0/).
Share and Cite
Liu, X.; Chang, E.-M.; Liu, J.-F.; Huang, Y.-N.; Wang, Y.; Yao, N.; Jiang, Z.-P. Complete Chloroplast Genome Sequence and Phylogenetic Analysis of Quercus bawanglingensis Huang, Li et Xing, a Vulnerable Oak Tree in China. Forests 2019, 10, 587. https://doi.org/10.3390/f10070587
Liu X, Chang E-M, Liu J-F, Huang Y-N, Wang Y, Yao N, Jiang Z-P. Complete Chloroplast Genome Sequence and Phylogenetic Analysis of Quercus bawanglingensis Huang, Li et Xing, a Vulnerable Oak Tree in China. Forests. 2019; 10(7):587. https://doi.org/10.3390/f10070587
Chicago/Turabian StyleLiu, Xue, Er-Mei Chang, Jian-Feng Liu, Yue-Ning Huang, Ya Wang, Ning Yao, and Ze-Ping Jiang. 2019. "Complete Chloroplast Genome Sequence and Phylogenetic Analysis of Quercus bawanglingensis Huang, Li et Xing, a Vulnerable Oak Tree in China" Forests 10, no. 7: 587. https://doi.org/10.3390/f10070587