1. Introduction
Reverse transcription quantitative polymerase chain reaction (RT-qPCR) has been extensively applied in gene expression analysis due to its high accuracy, high throughput, and high sensitivity [
1,
2,
3]. To perform relative quantification via RT-qPCR, normalization is essential to eliminate experimental errors between samples [
1], and the selection of appropriate internal genes has a significant influence on the relative quantification results [
2]. If the expression pattern of the reference gene is unstable, then the accuracy of the assay will be reduced, and small changes in the expression of the target genes will be impossible to detect [
1]. Therefore, to obtain accurate and reliable results, internal control genes must be systematically evaluated to ensure their applicability under different experimental conditions and various species [
4,
5].
Reference genes usually have basic functions in cells or organisms and are normally expressed at relatively constant rates under different experimental conditions and across different organs [
2,
6]. Many genes, such as actin, beta-tubulin, elongation factor, polyubiquitin, eukaryotic translation initiation factor, glyceraldehyde-3-phosphate dehydrogenase, histone, ribosomal protein L, cyclophilin, and 18S RNA have been used as reference genes under different experimental conditions and in different species [
2,
6,
7,
8,
9,
10,
11,
12,
13,
14,
15].
Different statistical algorithms have been developed to assess the expression stability of reference genes under certain experimental conditions for specific species; these algorithms include geNorm, BestKeeper, NormFinder, and RefFinder. These algorithms are widely employed to evaluate the expression stability of reference genes and identify reference genes that are consistent across various species such as
Populus tomentosa Carr. [
16],
Bixa orellana L. [
3] and
Betula luminifera H.J.P. Winkl. [
17]. At least two algorithms were suggested to be used for reference gene stability evaluation [
18].
Liriodendron chinense (Hemsl.) Sarg, a broad-leaved deciduous tree species belonging to the magnolia family (Magnoliaceae) that is also called the Chinese tulip tree [
19], is naturally distributed in mountainous areas of southern China and northern Vietnam at an elevation of 450–1800 m [
20,
21]. However, little molecular and gene expression data have been reported for
L. chinense. Additionally, reference genes have not been properly characterized and identified for
L. chinense, although a few studies have utilized a limited number of genes (including actin) in
L. chinense without any systematic evaluation [
22]. Therefore, the selection of suitable reference genes in
L. chinense is very necessary for RT-qPCR analysis.
In this study, to identify suitable reference genes for RT-qPCR analysis in
L. chinense, we used 15 genes,
ACT7 (
Actin 7),
ACT97 (
Actin 97),
GAPDH (
Glyceraldehyde-3-phosphate dehydrogenase),
TUB (
Tubulin beta),
HIS (
Histone H3),
EFG (
Elongation factor G),
eIF2 (
Eukaryotic translation initiation factor 2),
eIF3 (
Eukaryotic translation initiation factor 3),
BIG (
Auxin transport protein BIG),
AGD11 (
ADP-ribosylation factor GTPase-activating protein AGD11),
UBQ1(
Ubiquitin extension protein 1),
CYP (
Cyclophilin),
RPL25 (
50S ribosomal protein L25),
RPB1 (
RNA polymerase II subunit RPB1) and
UBC (
Ubiquitin conjugating enzyme ATG10), as candidate genes and tested their expression stability across multiple organs of
L. chinense using the geNorm [
23], BestKeeper [
24], NormFinder [
25], and RefFinder [
26] programs. In addition, to compare the differences between the selected reference genes and unstable candidate reference genes, the
LcPAT7 (
Liriodendron chinese protein S-acyltransferase 7) gene was chosen as a target gene, and its expression level was determined by RT-qPCR analysis. In summary, this work aimed to identify appropriate reference genes for RT-qPCR analysis across various organs in
L. chinense. 4. Discussion
As a high throughput and accurate method of gene expression level analysis, RT-qPCR has been extensively applied in studies of functional genes across various samples and under different experimental conditions [
2,
3]. However, the accuracy of RT-qPCR analyses relies on the selection of suitable genes as internal control, because if an unstable gene is chosen as the internal control, the analysis yields unreliable results [
31,
32]. However, no report exist of systematically selecting suitable reference genes for RT-qPCR analysis in
L. chinense. Therefore, suitable internal control genes for RT-qPCR analysis must be carefully identified in
L. chinense. To the best of our knowledge, this study is the first to systematically and comprehensively select internal control genes for RT-qPCR analysis in
L. chinense.
Fifteen candidate reference genes were selected for this study, and most of them had been studied previously in different plants such
Oryza sativa L. [
9],
Pinus massoniana L. [
11], citrus [
33],
Pisum sativum [
34],
Petunia hybrida [
35],
Linum usitatissimum L. [
36],
Nicotiana tabacum [
37],
Camellia sinensis [
38], and
Populus [
39]. In terms of standardization and quality, amplification efficiencies of the candidate reference gene’s primer pairs varied from 1.81 to 2.04 (
Table 1). The correlation coefficient (
R) of linear amplification was approximately 1 (0.99) (
Table 1). These results revealed that the primer pairs for the candidate reference genes were highly accurate, efficient, and sensitive.
Under any experimental conditions, an appropriate reference gene should exhibit a steady expression pattern across different samples [
38]. However, these 15 candidate reference genes had variable expression in all samples (
Figure 1). The variation (Ct
− Ct
) in the 15 candidate reference genes was between 3.52 Ct (for
ACT97) and 5.92 Ct (for
RPL25). This result strongly indicated that
ACT97 and
RPL25 were the most stably and the least stably expressed genes, respectively. The mean Ct values of candidate reference genes varied from 17.84 (for
HIS) to 26.31 (for
AGD11). In a study of the
Vigna unguiculata L. [
40],
Setaria virdis [
41],
Euscaphis konishii Hayata [
42] and
Solanum tuberosum L. [
43], candidate reference genes also had variable expression among tested materials, and the average Ct values of the candidate reference genes were between 15 and 27. These results suggested that it is necessary to evaluate the stability of reference genes systemically before selecting them as internal controls for RT-qPCR analysis [
40].
Four methods (geNorm, NormFinder, BestKeeper and RefFinder) were used to evaluate the expression stability of the 15 candidate reference genes in our study. Among all samples,
eIF3 and
ACT97 ranked third and fourth in geNorm, first and second in NormFinder, and fourth and first in BestKeeper (
Table 4). The different ranks of the candidate reference genes between geNorm and NormFinder and BestKeeper was expected because these three methods use different algorithms [
23,
24,
25]. In addition, recent studies have noted that there is no universal internal control gene applicable to all experimental conditions and that using a single reference gene as internal control could introduce errors in the results [
9,
23,
25,
44]. According to the analysis results of RefFinder and the optimal number of reference genes given by geNorm analysis, we selected
eIF3 and
ACT97 as the most suitable reference genes for RT-qPCR analysis in
L. chinense (
Figure 3,
Table 5).
In general,
eIF3 and
ACT97 showed the highest expression stability among all samples of
L. chinense (
Table 4 and
Table 5).
eIF (
Eukaryotic translation initiation factor) and
ACT (
actin) also showed good expression stability in different plants across different sample sets. For example,
eIF was chosen as the internal control gene for RT-qPCR analysis under drought stress in
Lolium multiflorum [
45], and it also showed the most stable expression pattern in
Linum usitatissimum L. stems [
36].
ACT was the most suitable internal control for RT-qPCR analysis in
Pinus massoniana L. [
11], and it was still the most stably expressed reference gene in
Daucus carota L. leaves [
7], stem segments of
Populus tomentosa [
16], and
Glycine max L. Merr. [
44]. In addition, in a study of
Gossypium hirsutum,
ACT presented a more stable expression pattern during flower development than other candidate reference genes [
31]. However, in a study of
Euscaphis konishii Hayata [
42] and
Linum usitatissimum L. [
36],
ACT was unsuitable for normalization. In contrast,
UBQ1 and
AGD11 were unstably expressed genes in
L. chinense (
Table 5). As a member of the
UBQ family,
UBQ1 did not have good expression stability in our study, and it also showed an unstable expression pattern in lettuce (
Lactuca sativa) [
8] and in leaves of
Ilex paraguariensis under drought treatment [
46]. However,
UBQ1 had better expression stability in the parasitic life cycle of
Striga hermonthica [
10]. These results can be clarified by the fact that reference genes exhibited species-specific expression.
Generally, reference genes exhibit organ-specific expression as well as species-specific expression [
12]. We classified 54 samples into two subsets: flower organs and vegetative organs. In the flower organ subset,
eIF3 and
UBC were the best choice for normalization (
Table 5). Consistent with this result,
UBC had the highest expression stability among different organs of the same development stage in
Glycine max [L.] Merr. [
44], and
UBC was identified as a suitable reference gene across all
Brachypodium distachyon samples [
5]. In the vegetative organs,
ACT97,
ACT7, and
GAPDH were the best combination for RT-qPCR analysis (
Figure 3,
Table 5). Similarly,
ACT7 had the highest expression stability under heat treatment in
Stipa grandis [
47]. However, compared to
ACT in a previous study in tea plants,
ACT7 was regarded as an unsuitable internal control [
40].
GAPDH is commonly used as a reference gene and has been chosen as an internal control gene in the cotyledons of
Cunninghamia lanceolata [
12], different samples of
Vigna unguiculata L. [
40], cold-treated and GA-treated leaves of
Daucus carota L. [
7], and cold-treated and salt-treated leaves of
Carex rigescens [
48]. However,
GAPDH was unsuitable for normalization in
Pisum sativum and
Petunia hybrida [
34,
35].
In addition,
RPL25,
CYP, and
TUB did not demonstrate high expression stability in
L. chinense (
Table 5). However,
RPL25 demonstrated the highest expression stability across stress-treated samples of
Nicotiana tabacum [
37].
CYP was identified as the most stable internal control gene in
Petunia hybrida [
35], insect-resistant leaves of
Pinus massoniana L. [
11], and GA-treated samples of
Stellera chamaejasme [
2]. In a study of
Pisum sativum,
TUB was suitable for normalization under abiotic stress and biotic stress [
34].
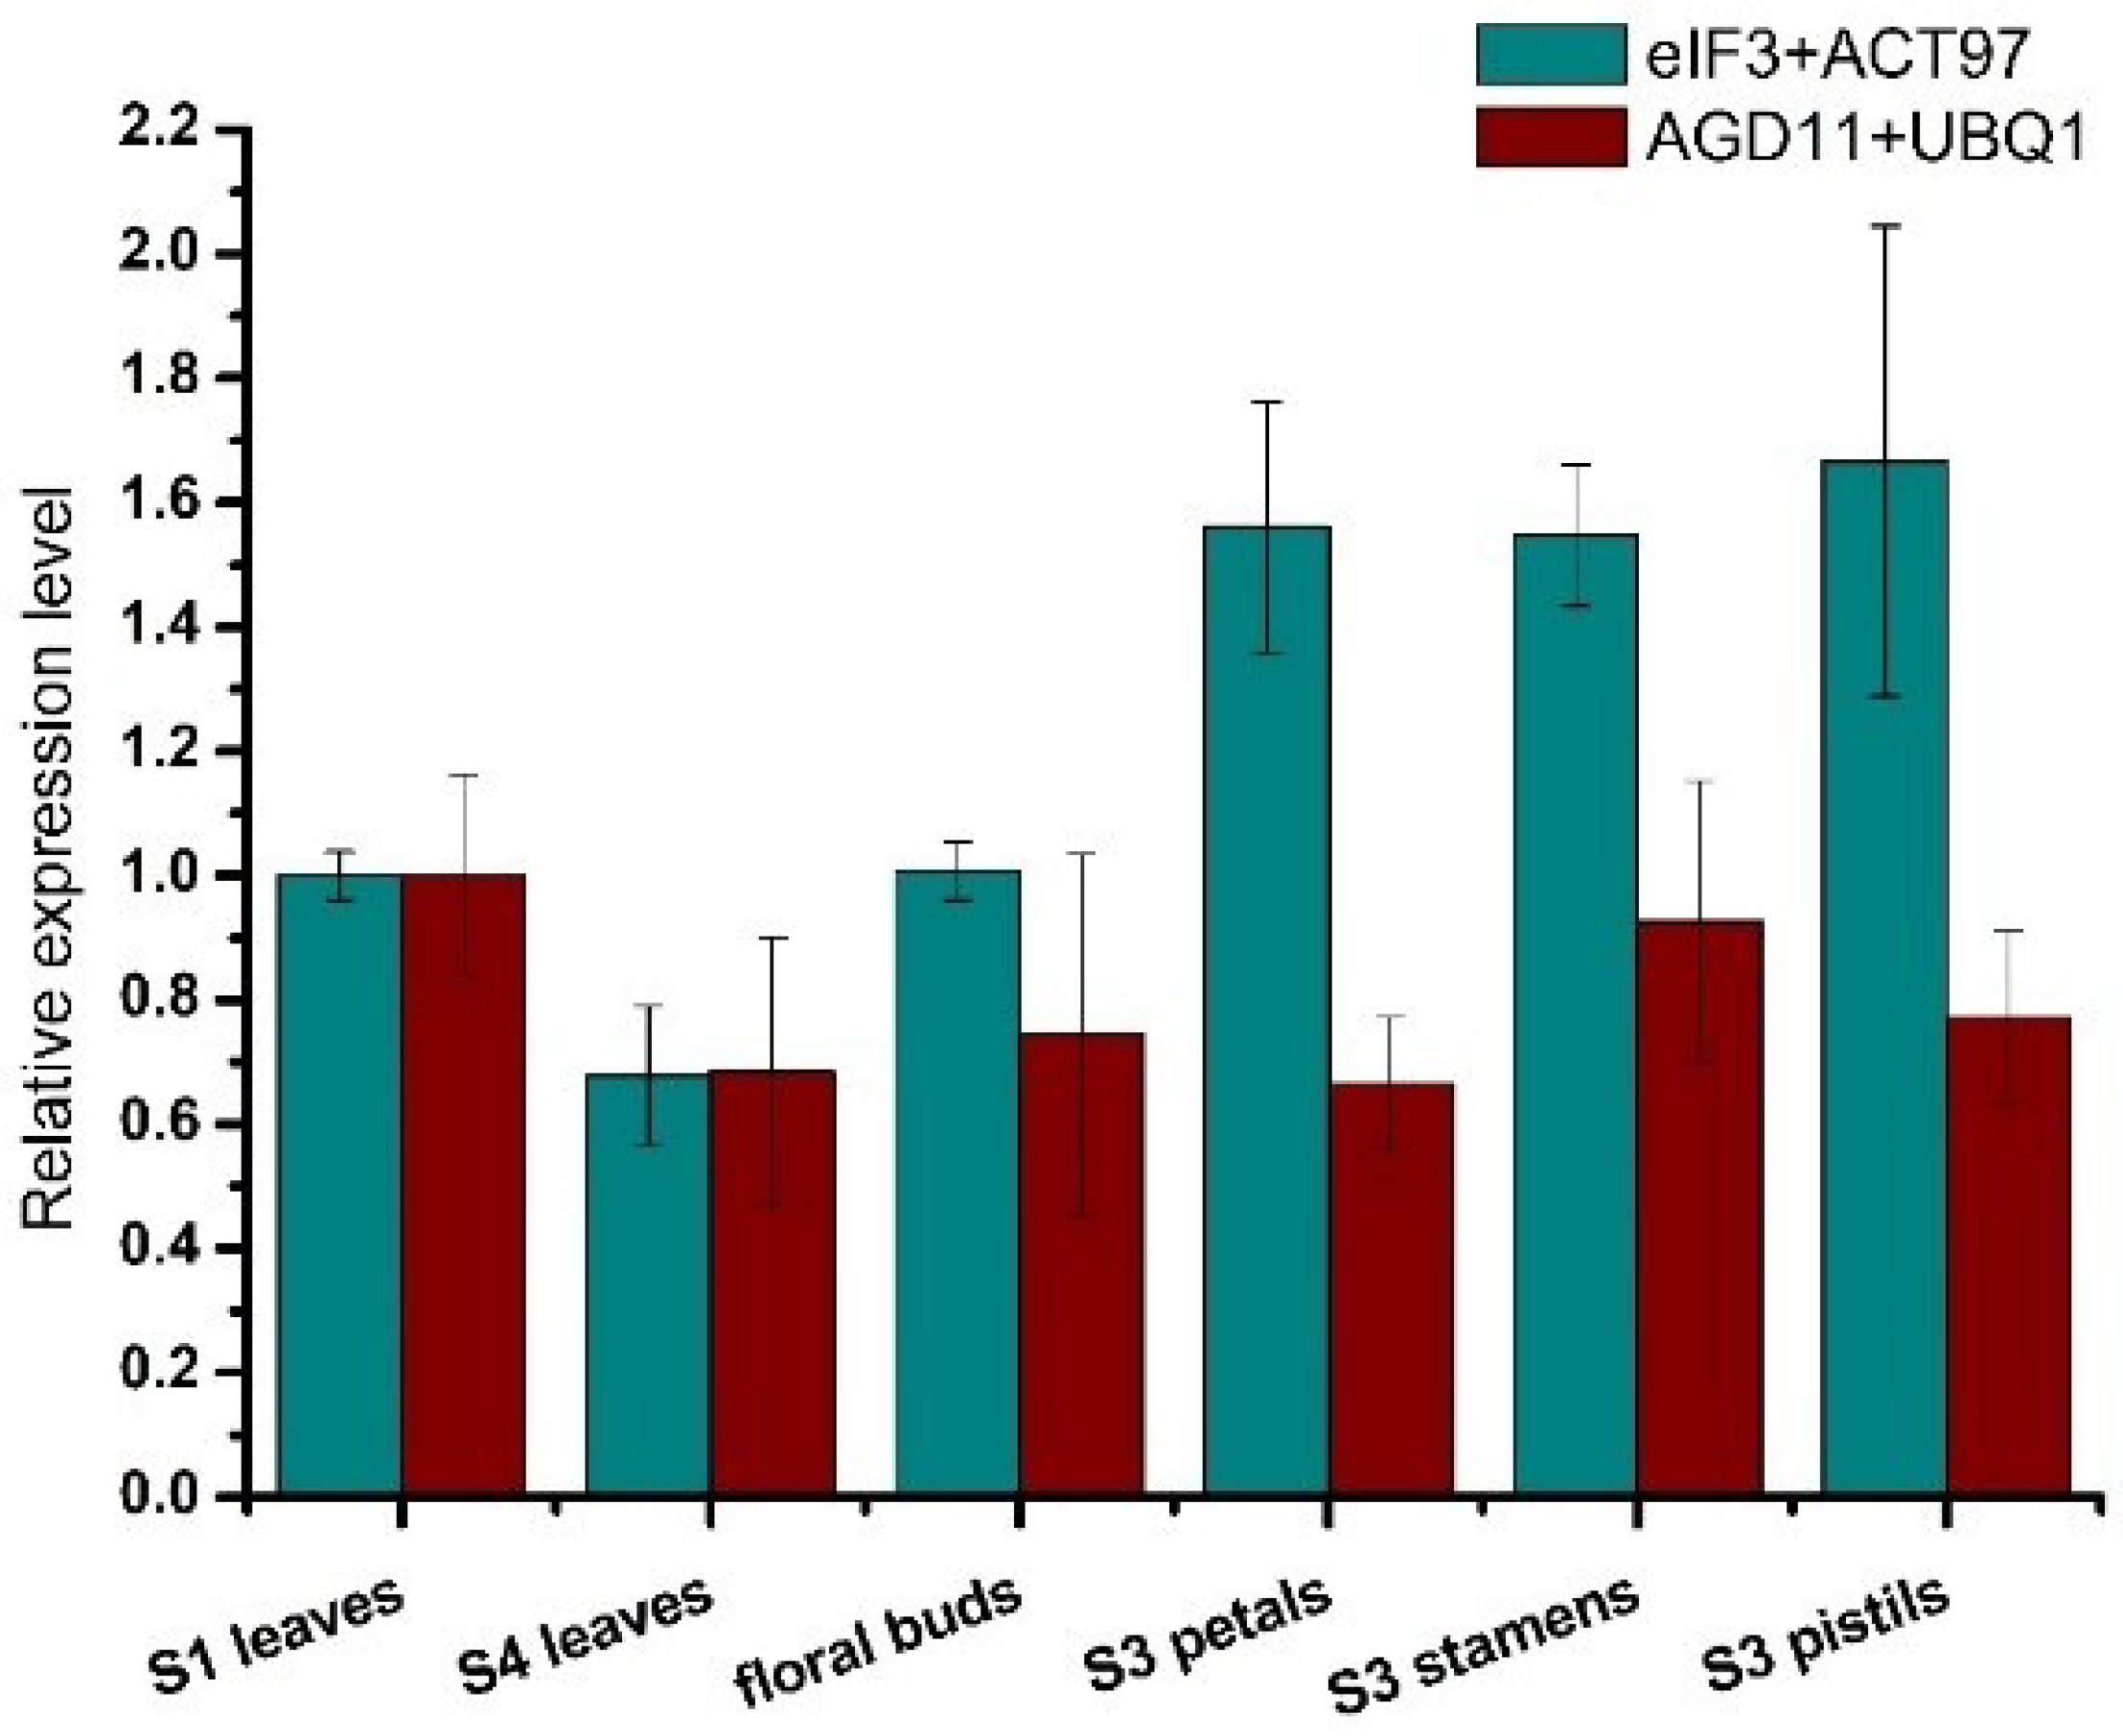
LcPAT7 in
L. chinense is a member of the Asp–His–His–Cys (DHHC) protein family, and it has a significant influence on development and morphogenesis [
49]. To compare the differences between the selected reference genes and unsuitable candidate reference gene, the expression profile of
LcPAT7 was investigated in different organs. The results showed that using unsuitable candidate reference genes as internal controls resulted in underestimates of expression(
Figure 4), which indicated that suitable reference genes must be selected for RT-qPCR analysis in
L. chinense.


