Article

Leaf Fresh Weight Versus Dry Weight: Which is Better for Describing the Scaling Relationship between Leaf Biomass and Leaf Area for Broad-Leaved Plants?

1
Co-Innovation Centre for Sustainable Forestry in Southern China, Bamboo Research Institute, College of Biology and the Environment, Nanjing Forestry University, 159 Longpan Road, Nanjing 210037, China
2
Tasmanian Institute of Agriculture, University of Tasmania, Private Bag 98, Hobart, TAS 7001, Australia
3
Centre for Invasion Biology, Department of Mathematical Sciences, Stellenbosch University, Matieland 7602, South Africa
*
Author to whom correspondence should be addressed.
Forests 2019, 10(3), 256; https://doi.org/10.3390/f10030256
Submission received: 9 February 2019 / Revised: 8 March 2019 / Accepted: 11 March 2019 / Published: 13 March 2019
(This article belongs to the Section Forest Ecophysiology and Biology)

Abstract

:
Leaf dry mass per unit area (LMA) is considered to represent the photosynthetic capacity, which actually implies a hypothesis that foliar water mass (leaf fresh weight minus leaf dry weight) is proportional to leaf dry weight during leaf growth. However, relevant studies demonstrated that foliar water mass disproportionately increases with increasing leaf dry weight. Although scaling relationships of leaf dry weight vs. leaf area for many plants were investigated, few studies compared the scaling relationship based on leaf dry weight with that based on leaf fresh weight. In this study, we used the data of three families (Lauraceae, Oleaceae, and Poaceae, subfamily Bambusoideae) with five broad-leaved species for each family to examine whether using different measures for leaf biomass (i.e., dry weight and fresh weight) can result in different fitted results for the scaling relationship between leaf biomass and area. Reduced major axis regression was used to fit the log-transformed data of leaf biomass and area, and the bootstrap percentile method was used to test the significance of the difference between the estimate of the scaling exponent of leaf dry weight vs. area and that of leaf fresh weight vs. area. We found that there were five species across three families (Phoebe sheareri (Hemsl.) Gamble, Forsythia viridissima Lindl., Osmanthus fragrans Lour., Chimonobambusa sichuanensis (T.P. Yi) T.H. Wen, and Hibanobambusa tranquillans f. shiroshima H. Okamura) whose estimates of the scaling exponent of leaf dry weight to area and that of leaf fresh weight to area were not significantly different, whereas, for the remaining ten species, both estimates were significantly different. For the species in the same family whose leaf shape is narrow (i.e., a low ratio of leaf width to length) the estimates of two scaling exponents are prone to having a significant difference. There is also an allometric relationship between leaf dry weight and fresh weight, which means that foliar water mass disproportionately increases with increased leaf dry weight. In addition, the goodness of fit for the scaling relationship of leaf fresh weight vs. area is better than that for leaf dry weight vs. area, which suggests that leaf fresh mass might be more able to reflect the physiological functions of leaves associated with photosynthesis and respiration than leaf dry mass. The above conclusions are based on 15 broad-leaved species, although we believe that those conclusions may be potentially extended to other plants with broad and flat leaves.

1. Introduction

The leaf may be the most important organ for plants to transfer solar energy to biological energy by means of photosynthesis. Leaf size, number, functional traits, and photosynthetic capacity are closely related to plant size and competitive abilities in forest communities to a large extent [1,2,3]. Leaf weight and area are different measures of leaf size, and the two measures were demonstrated to follow a power-law relationship [4,5]. When leaf dry mass increases, the increment of leaf area actually decreases, which is referred to as “diminishing returns” [5,6]. In general, under a constant investment of biomass to a leaf, a large surface will increase the contacting area to intercept the light that does undoubtedly enhance the photosynthetic potential [7]. However, a large leaf requires a complex and effective vein pattern to support the transportation of water and nutrients [8]. If leaves evolve to be too large, water evaporation may be a problem, which can lead plants to die of dehydration. In this case, large-leaved plants usually appear in tropical and subtropical areas where the moisture is sufficiently large to reduce the water loss of leaves [9]. In fact, leaf wetting caused by climatic factors including precipitation, fog, and night-time dew is closely associated with plant function [10]. Large leaves can improve the light utilization efficiency of foliar surface, but they also need more input of biomass to increase leaf area. However, foliar water content (which is equal to the difference between leaf fresh weight and dry weight) plays an important role in photosynthesis. It does not proportionally increase with increasing leaf dry weight [5]. In other words, for different individual leaves, the ratios of leaf dry weight to fresh weight are not a constant.
However, many investigators used leaf dry weight as the representative of leaf biomass when studying the scaling relationship between leaf biomass and area. The scaling of leaf mass and leaf area could directly influence the amount of light-capturing surface area, which gives an investment of dry biomass [4]. The study of Milla and Reich on 6334 leaves of 157 species found that the average scaling exponent of leaf dry weight vs. leaf surface area was significantly greater than one (1.10 with 95% confidence intervals (CIs) (1.08, 1.13)) [4]. For the study on six classes of plants (ferns, graminoids, forbs, shrubs, trees, and vines), the corresponding estimates of the scaling exponents of leaf dry weight vs. leaf surface area were 1.106, 1.071, 1.011, 1.022, 0.971, and 1.196, respectively, with 1.021 for the pooled data for these six classes [5]. Li et al. [11] studied the scaling relationships of leaf dry weight vs. leaf surface area of 93 temperate woody species, and the scaling exponents for simple-leaved deciduous species at low altitude, evergreen species at low altitude, simple-leaved deciduous species at high altitude, and compound-leaved deciduous species at low altitude were estimated to be 1.216, 1.246, 1.205, and 1.064, respectively. The scaling exponent of the pooled data for those four types of leaves was estimated to be 1.160 with 95% CIs (1.077, 1.249). Pan et al. [12] studied the scaling relationships between leaf dry weight and leaf surface area of 121 vascular plants across an altitudinal gradient in a subtropical forest and found that the scaling exponents increased with altitude. The coefficient of determination reached 0.93 for the linear regression of the scaling exponent to altitude. That study implied that the scaling exponent of leaf biomass vs. area is not independent of the environment. In addition, for the plants at low altitudes from 400 to 850 m, the scaling exponents ranged from 0.859 to 1.000.
The above studies did not consider the difference in the two measures of leaf biomass related to foliar water content, and the main reason they used leaf dry weight instead of leaf fresh weight might result from a concern about water loss during the process of measuring biomass. In order to facilitate gas exchange (CO2, O2, and H2O), leaves must be as flat and thin as possible. However, if leaves are too thin and wide, they will quickly lose water. Thus, the foliar water content could balance leaf area against thickness [13]. Hughes et al. [14] reported that leaf area of several dicotyledonous genotypes was found to be an almost linear function of absolute leaf water content. Lin et al. [15] studied the scaling relationships between leaf fresh weight and area of 11 bamboo species. Because of the similarity of leaf shapes of the bamboos, the pooled data of 11 species showed a good linear relationship between the log-transformed leaf fresh weight and the log-transformed leaf area, and the estimate of the scaling exponent was 1.147 with 95% CIs (1.143, 1.152). Because work comparing the scaling relationship between leaf dry weight and area with that between leaf fresh weight and area is lacking, we still do not know (i) whether the scaling exponents based on two different biomass measures are the same or significantly different for broad-leaved plants, and (ii) which measure could exhibit a better scaling relationship on the condition that leaf fresh weight can be accurately measured for those plants. In the current study, we attempted to solve the above two questions using the plants of 15 species from three families (Lauraceae, Oleaceae, and Poaceae, subfamily Bambusoideae) that have broad and flat leaves, with ≥290 leaves for each species.

2. Materials and Methods

2.1. Materials

Three families of plants in the same place (Nanjing Forestry University campus, Nanjing, Jiangsu Province, People’s Republic of China) were used: five species of Lauraceae (Cinnamomum camphora (L.) J. Presl, Cinnamomum chekiangense Nakai, Lindera angustifolia Cheng, Phoebe chekiangensis P.T. Li, and Phoebe sheareri (Hemsl.) Gamble), five species of Oleaceae (Forsythia viridissima Lindl., Ligustrum lucidum W.T. Aiton, Ligustrum sinense Lour., Osmanthus fragrans Lour., and Syringa oblata Lindl. var. alba Rehder), and five species of Bambusoideae (Poaceae) (Bambusa emeiensis “Viridiflavus” Hsuen et Yi, Bambusa multiplex (Lour.) Raeusch. ex Schult. & Schult.f., Chimonobambusa sichuanensis (T.P. Yi) T.H. Wen, Hibanobambusa tranquillans f. shiroshima H. Okamura, and Indosasa sinica C.D. Chu & C.S. Chao). For the first two families, ≥290 leaves were randomly collected from five to 10 plants of each species; for the third family, ≥290 leaves were randomly collected from 10 plants of each bamboo species. Table 1 lists the detailed collection information of these leaves, and Figure 1 shows examples of the leaves of these species.

2.2. Experimental Methods

The experiments were carried out from late May to early September 2018. Because Nanjing is a place where the plants can naturally grow, no additional fertilizer and water were used to maintain the growth of the plants. Fresh leaves were collected from healthy plants at 8:00–9:00 a.m. and were put into plastic self-sealing bags (28 cm × 20 cm) into a foam box (29 cm × 16 cm × 18 cm) with ice. We measured the fresh weight at 9:00 a.m. 12:00 p.m. using an electric balance (Type: ML 204; Mettler Toledo Company, Greifensee, Switzerland; measurement accuracy 0.0001 g), and we scanned the leaves to bitmap images at a 600-dpi resolution using a scanner (Type: Aficio MP 7502; Ricoh, Tokyo, Japan). After obtaining the data of fresh weight and image, we placed the leaves in Kraft paper envelopes (33 cm × 24 cm) and subsequently into an oven (Type: XMTD-8222; Jinghong Experimental Equipment Co., Ltd., Shanghai, China) at 105 °C for 2 h and then continuously at 80 °C until achieving a constant dry weight. A temperature of 105 °C was used to destroy the activity of leaf enzymes to inhibit the enzymatic oxidation of polyphenolic compounds during leaf drying and to accelerate the evaporation of foliar water. This temperature is widely used in tea processing [16]. In our past studies, this method was demonstrated to be effective in leaf drying [17,18].
The Matlab (version 2009a) procedure developed by Shi et al. [19,20] was used to extract the planar coordinates of the leaves; then, the R (version 3.2.2; R Core Team [21]) script developed by Shi et al. [20] was used to calculate the leaf area, length (i.e., the distance from leaf apex to base), and width (that is the maximum distance between two points of leaf edge perpendicular to the straight line through leaf apex and base).

2.3. Statistical Methods
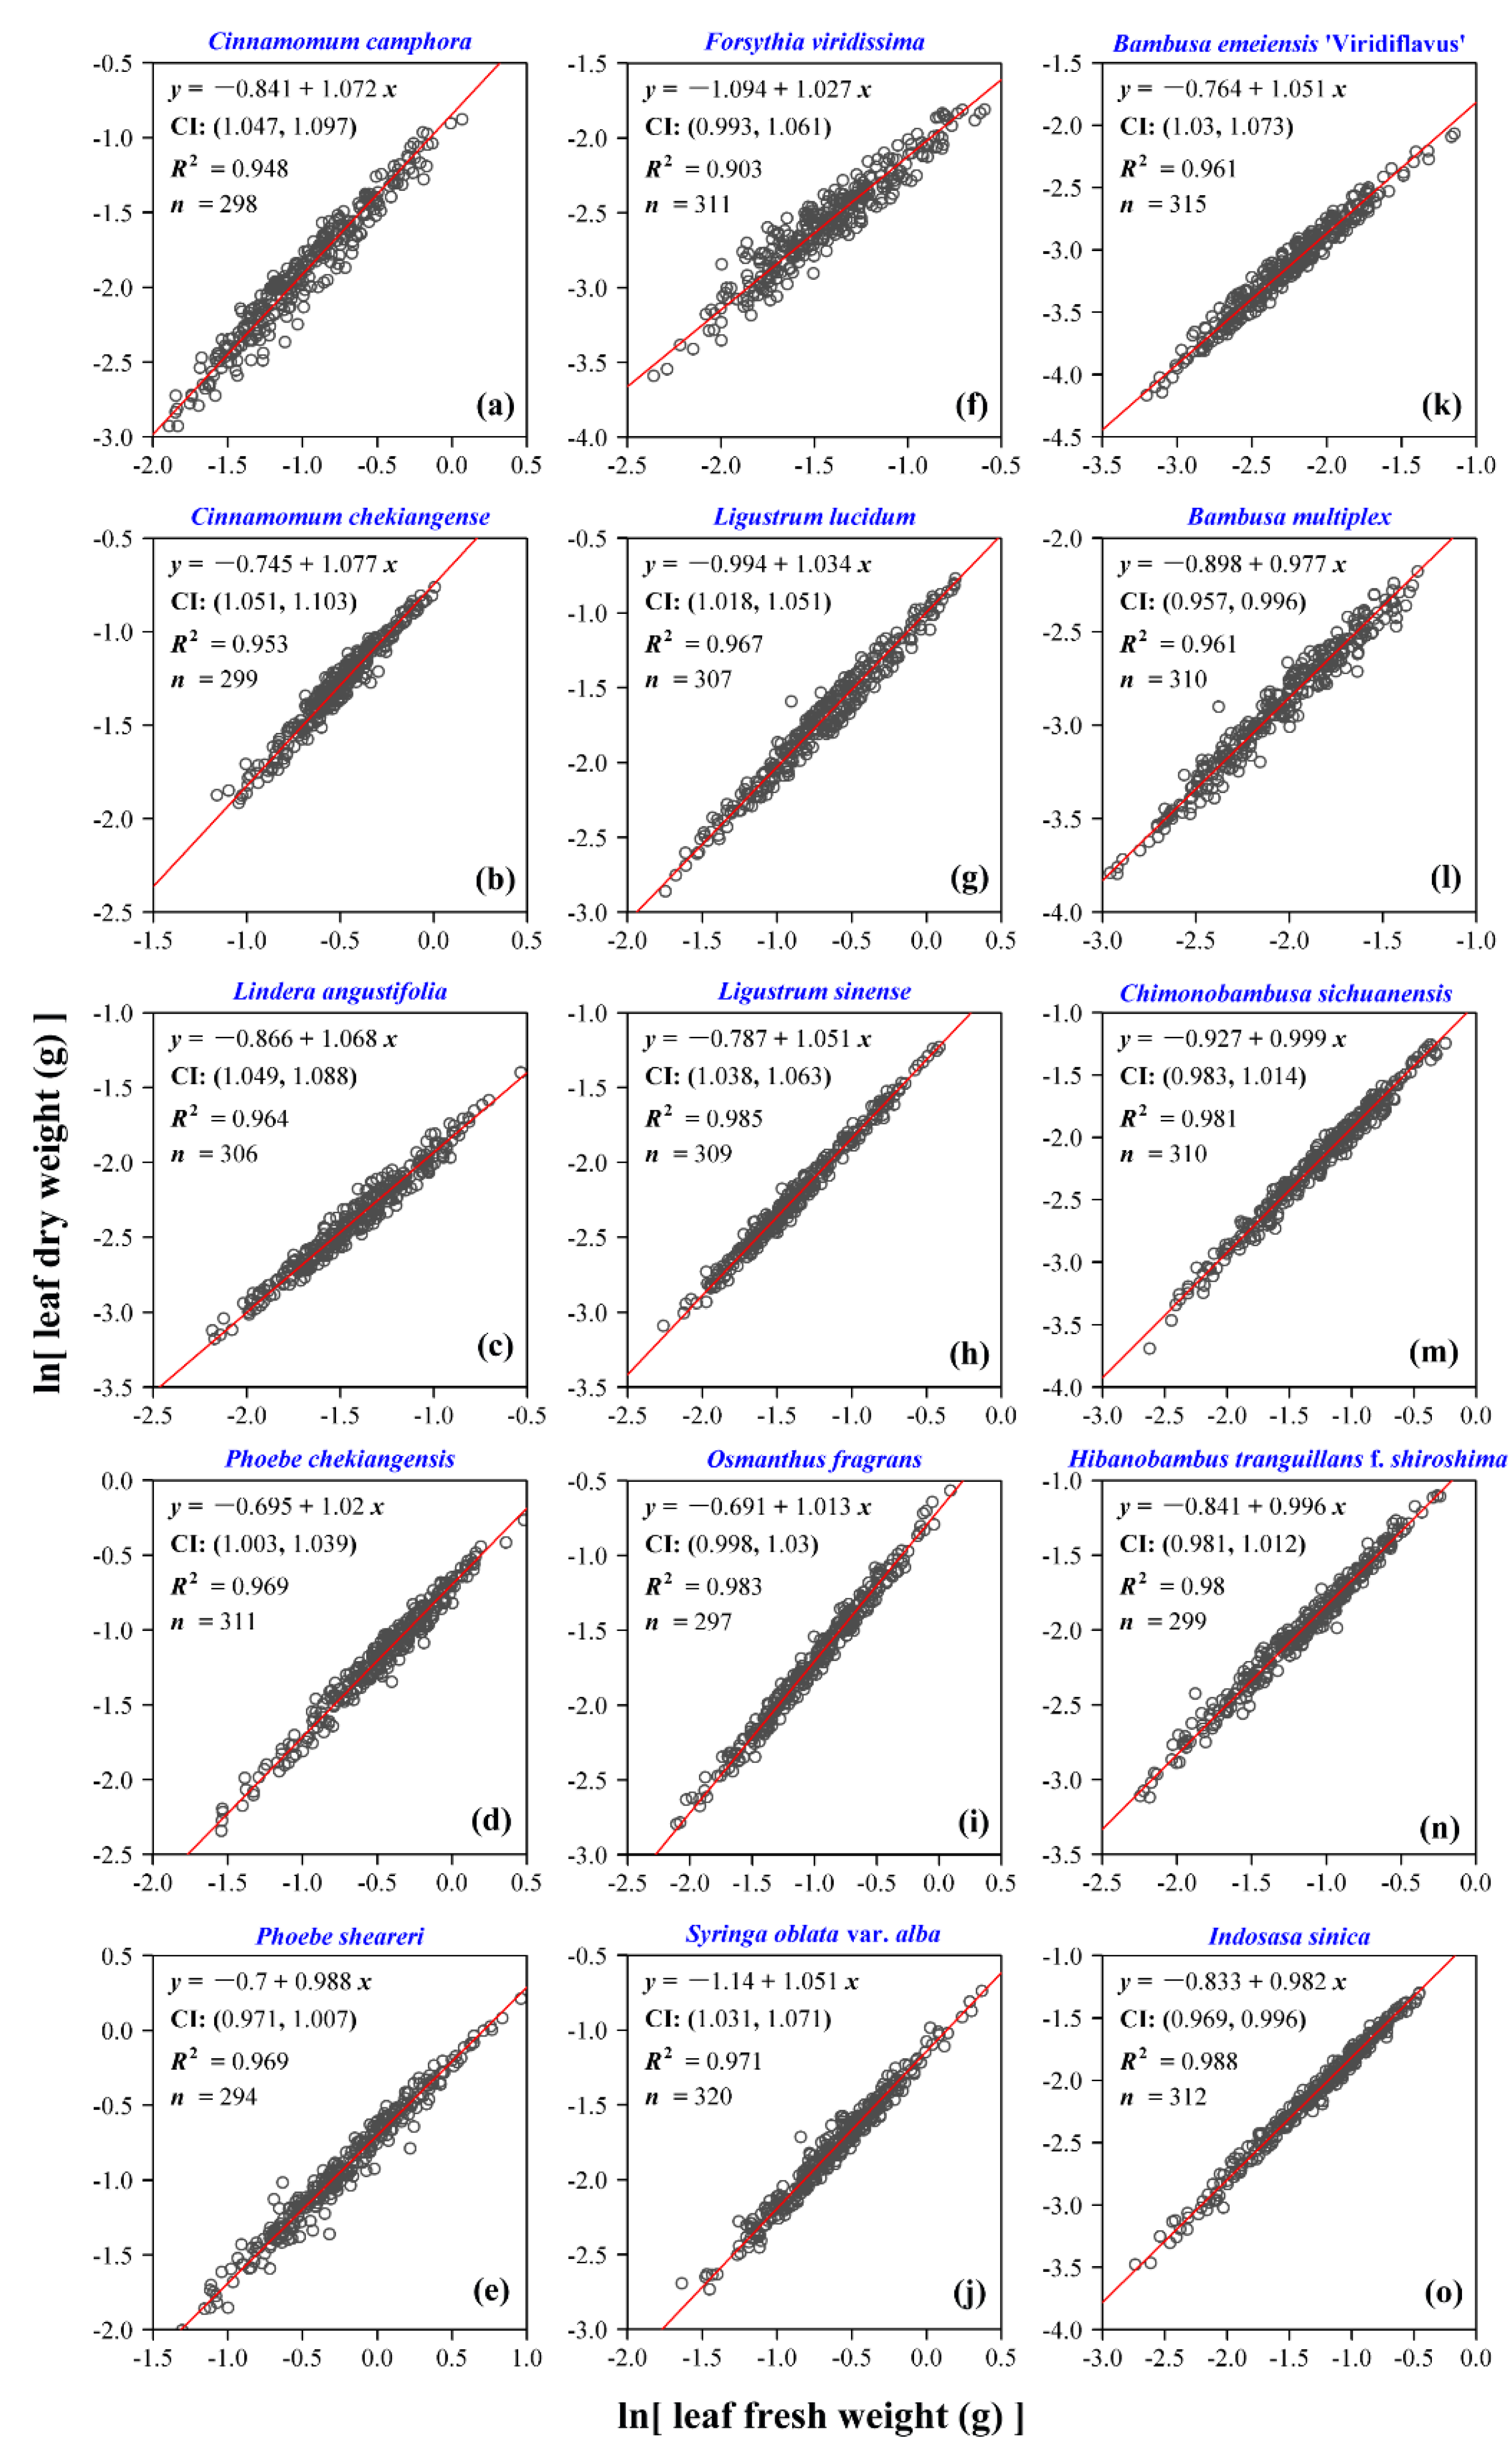
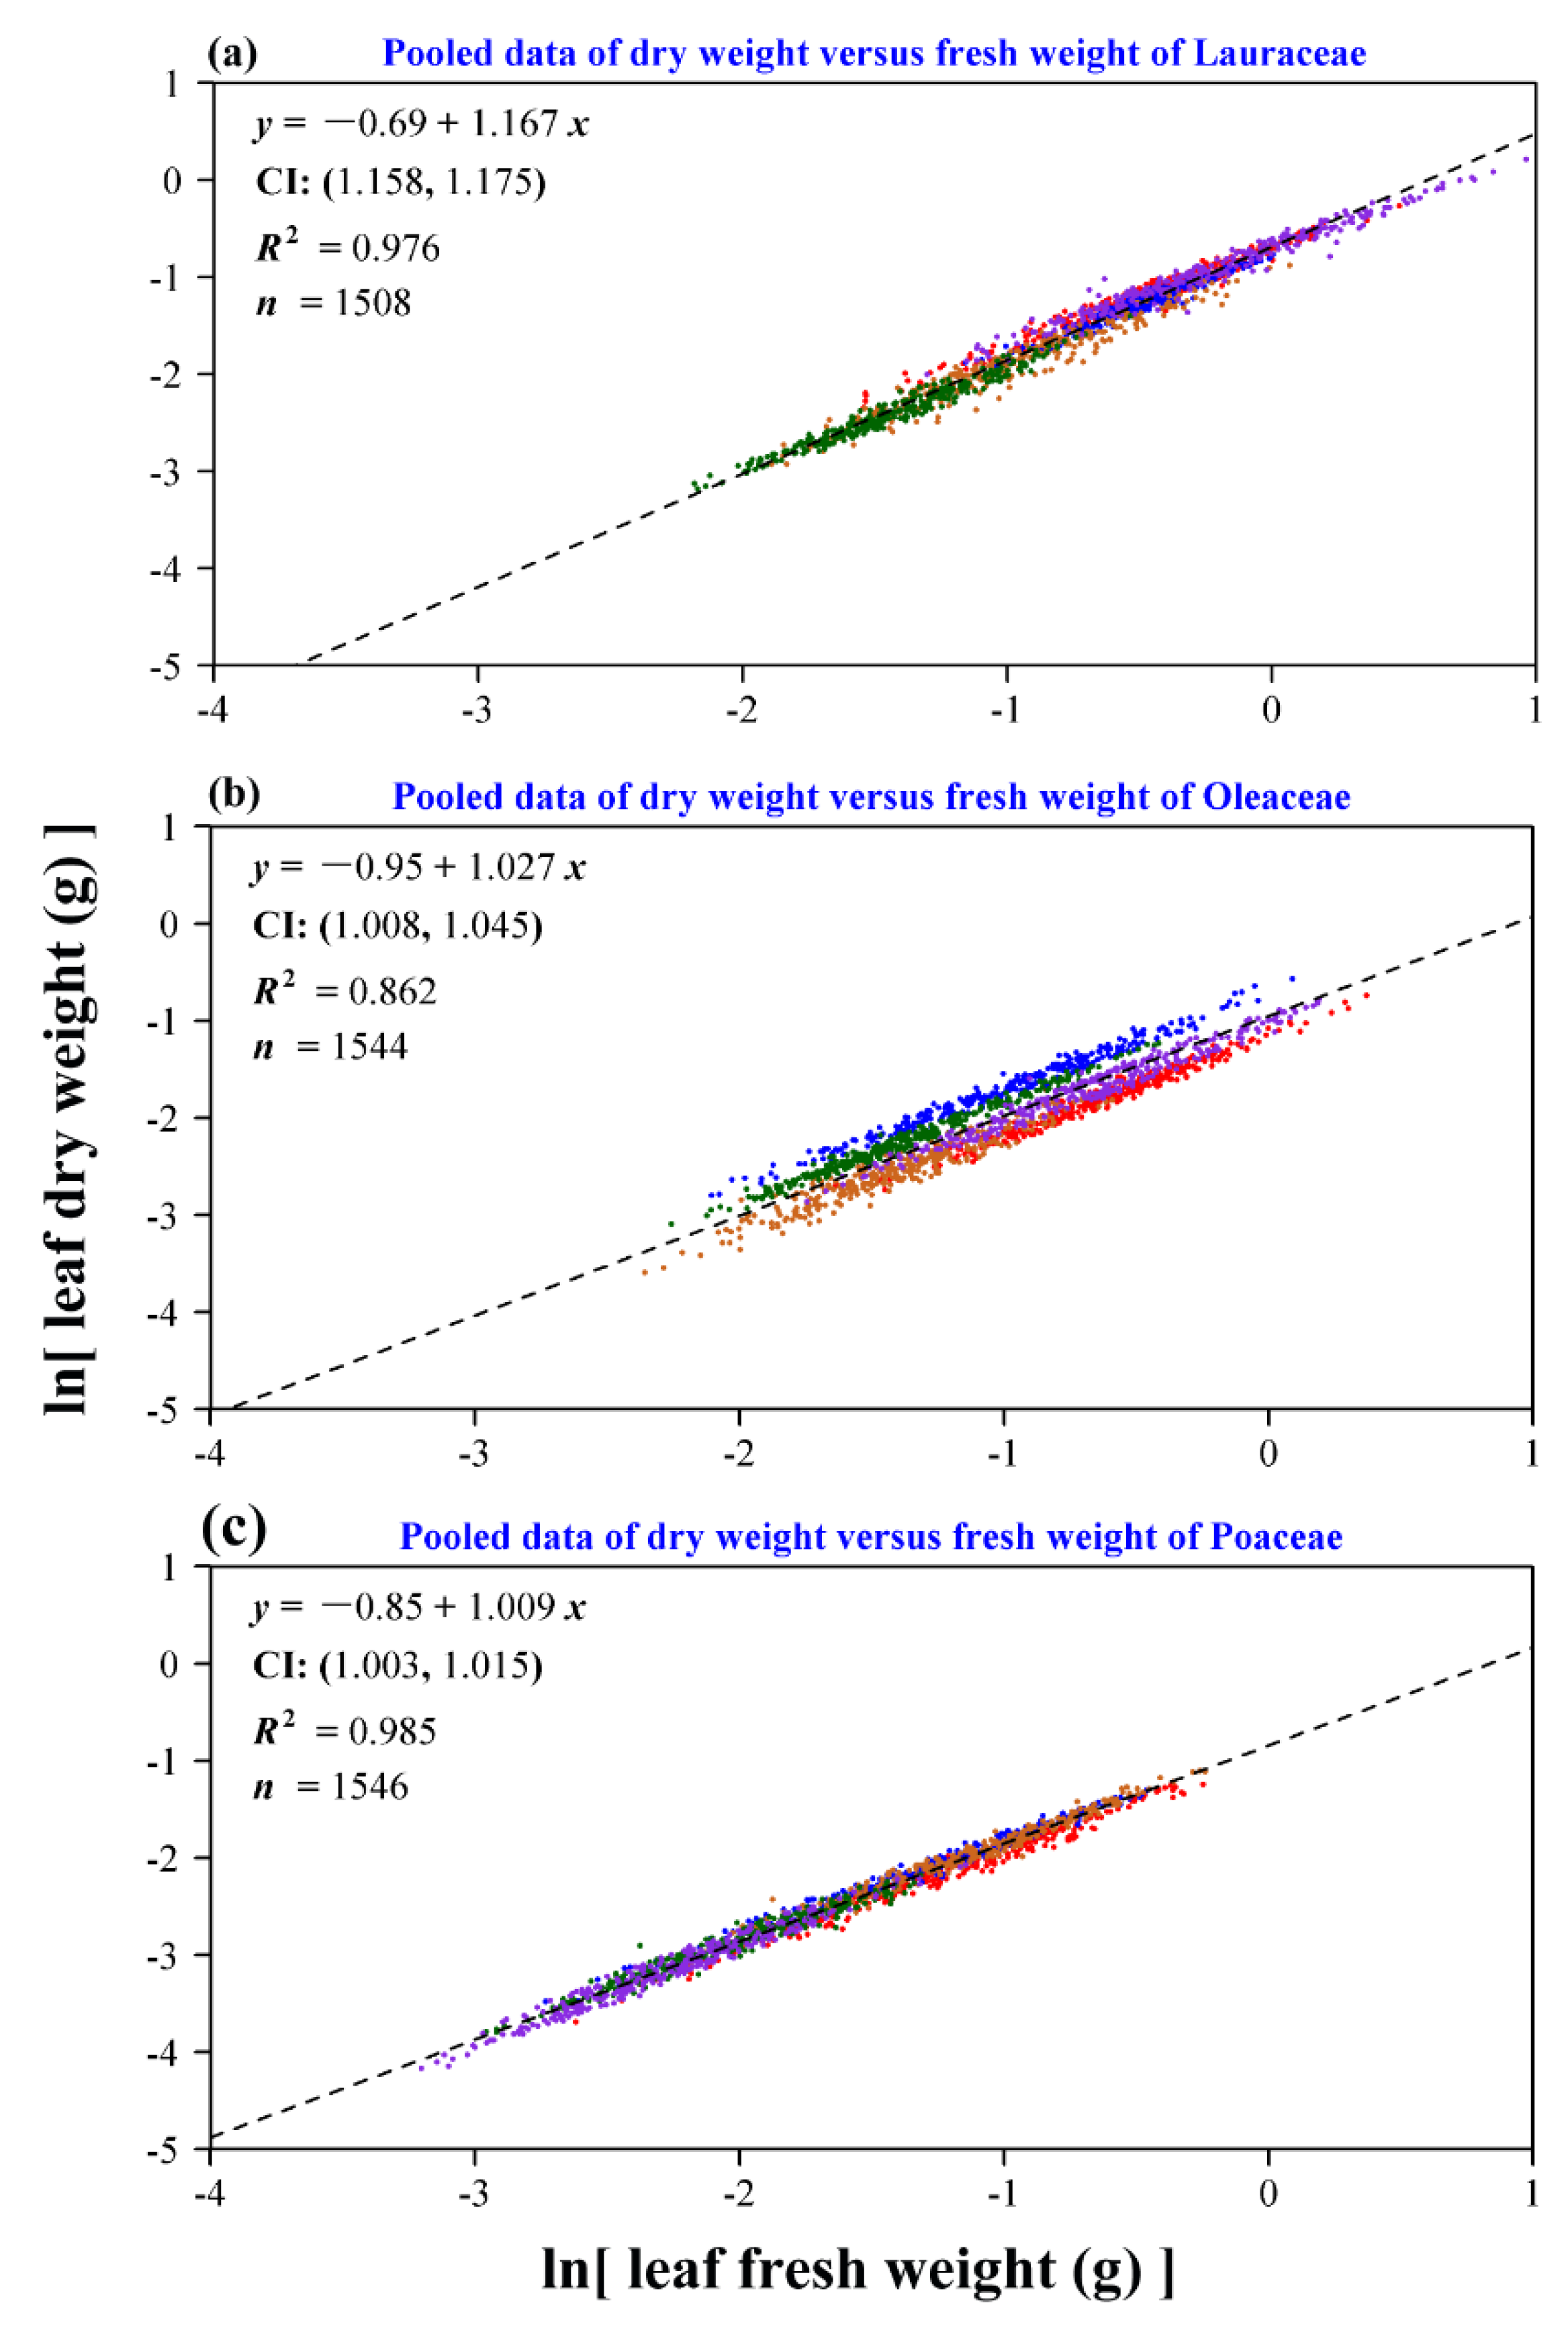
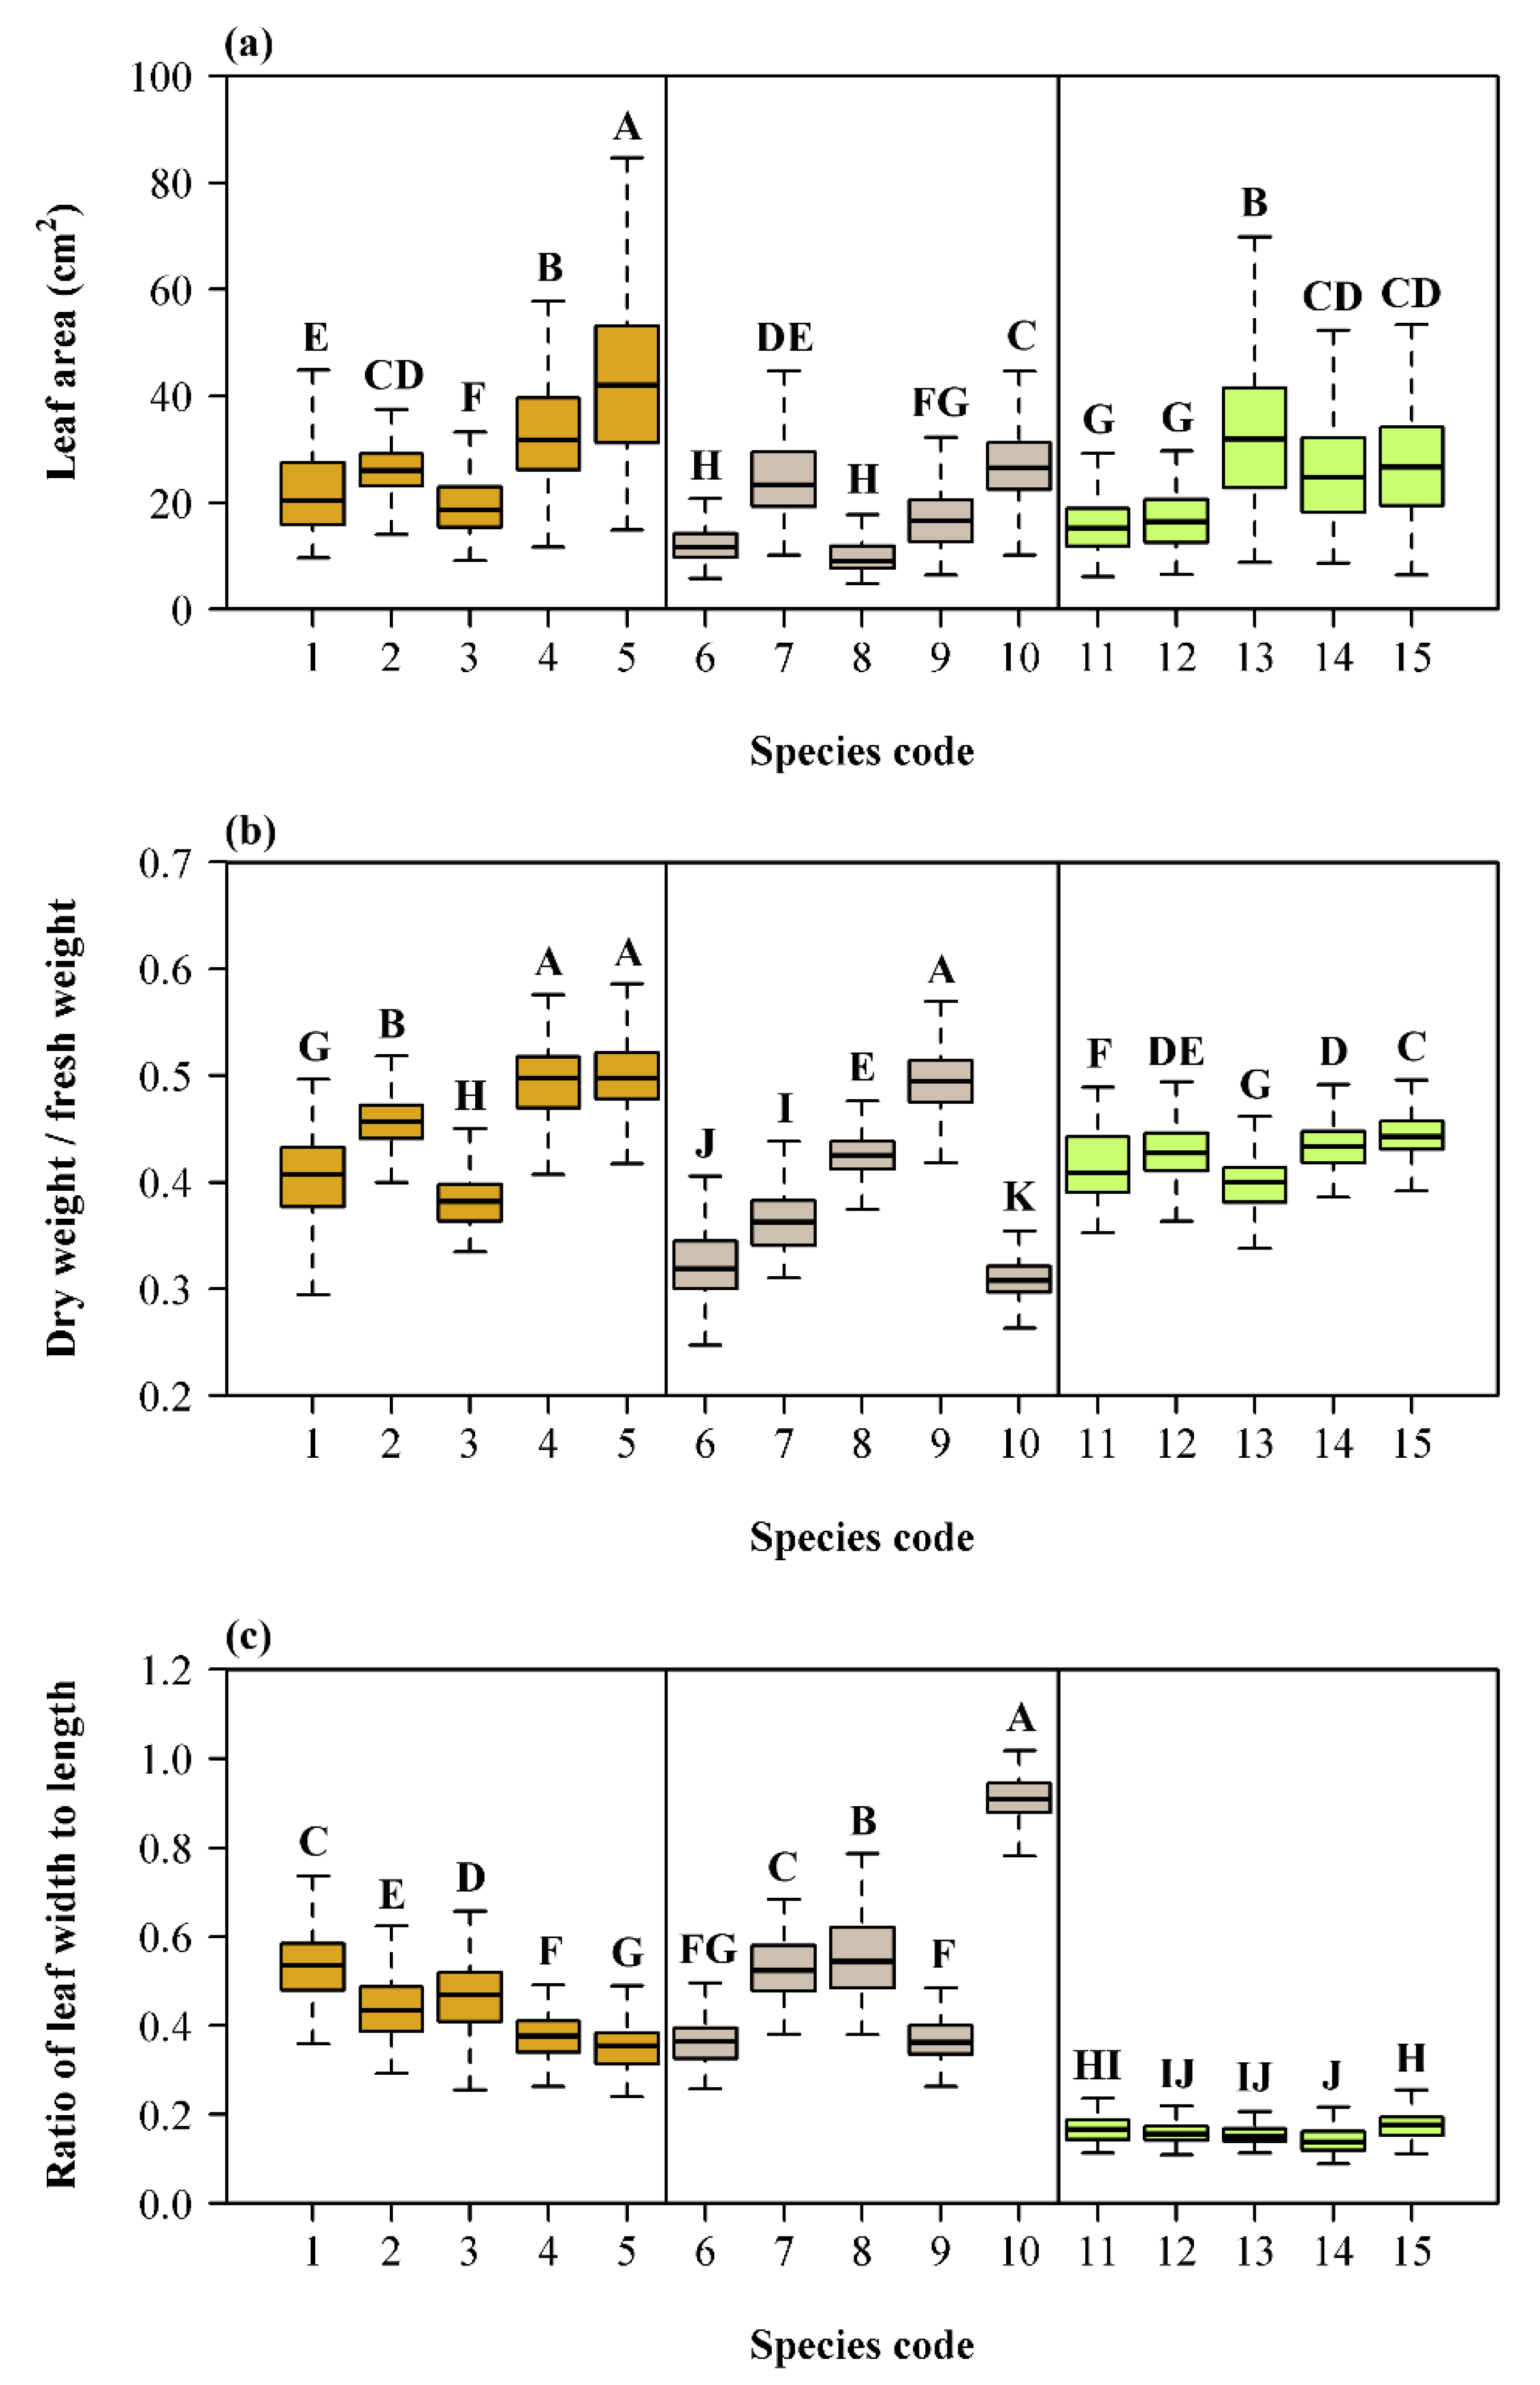
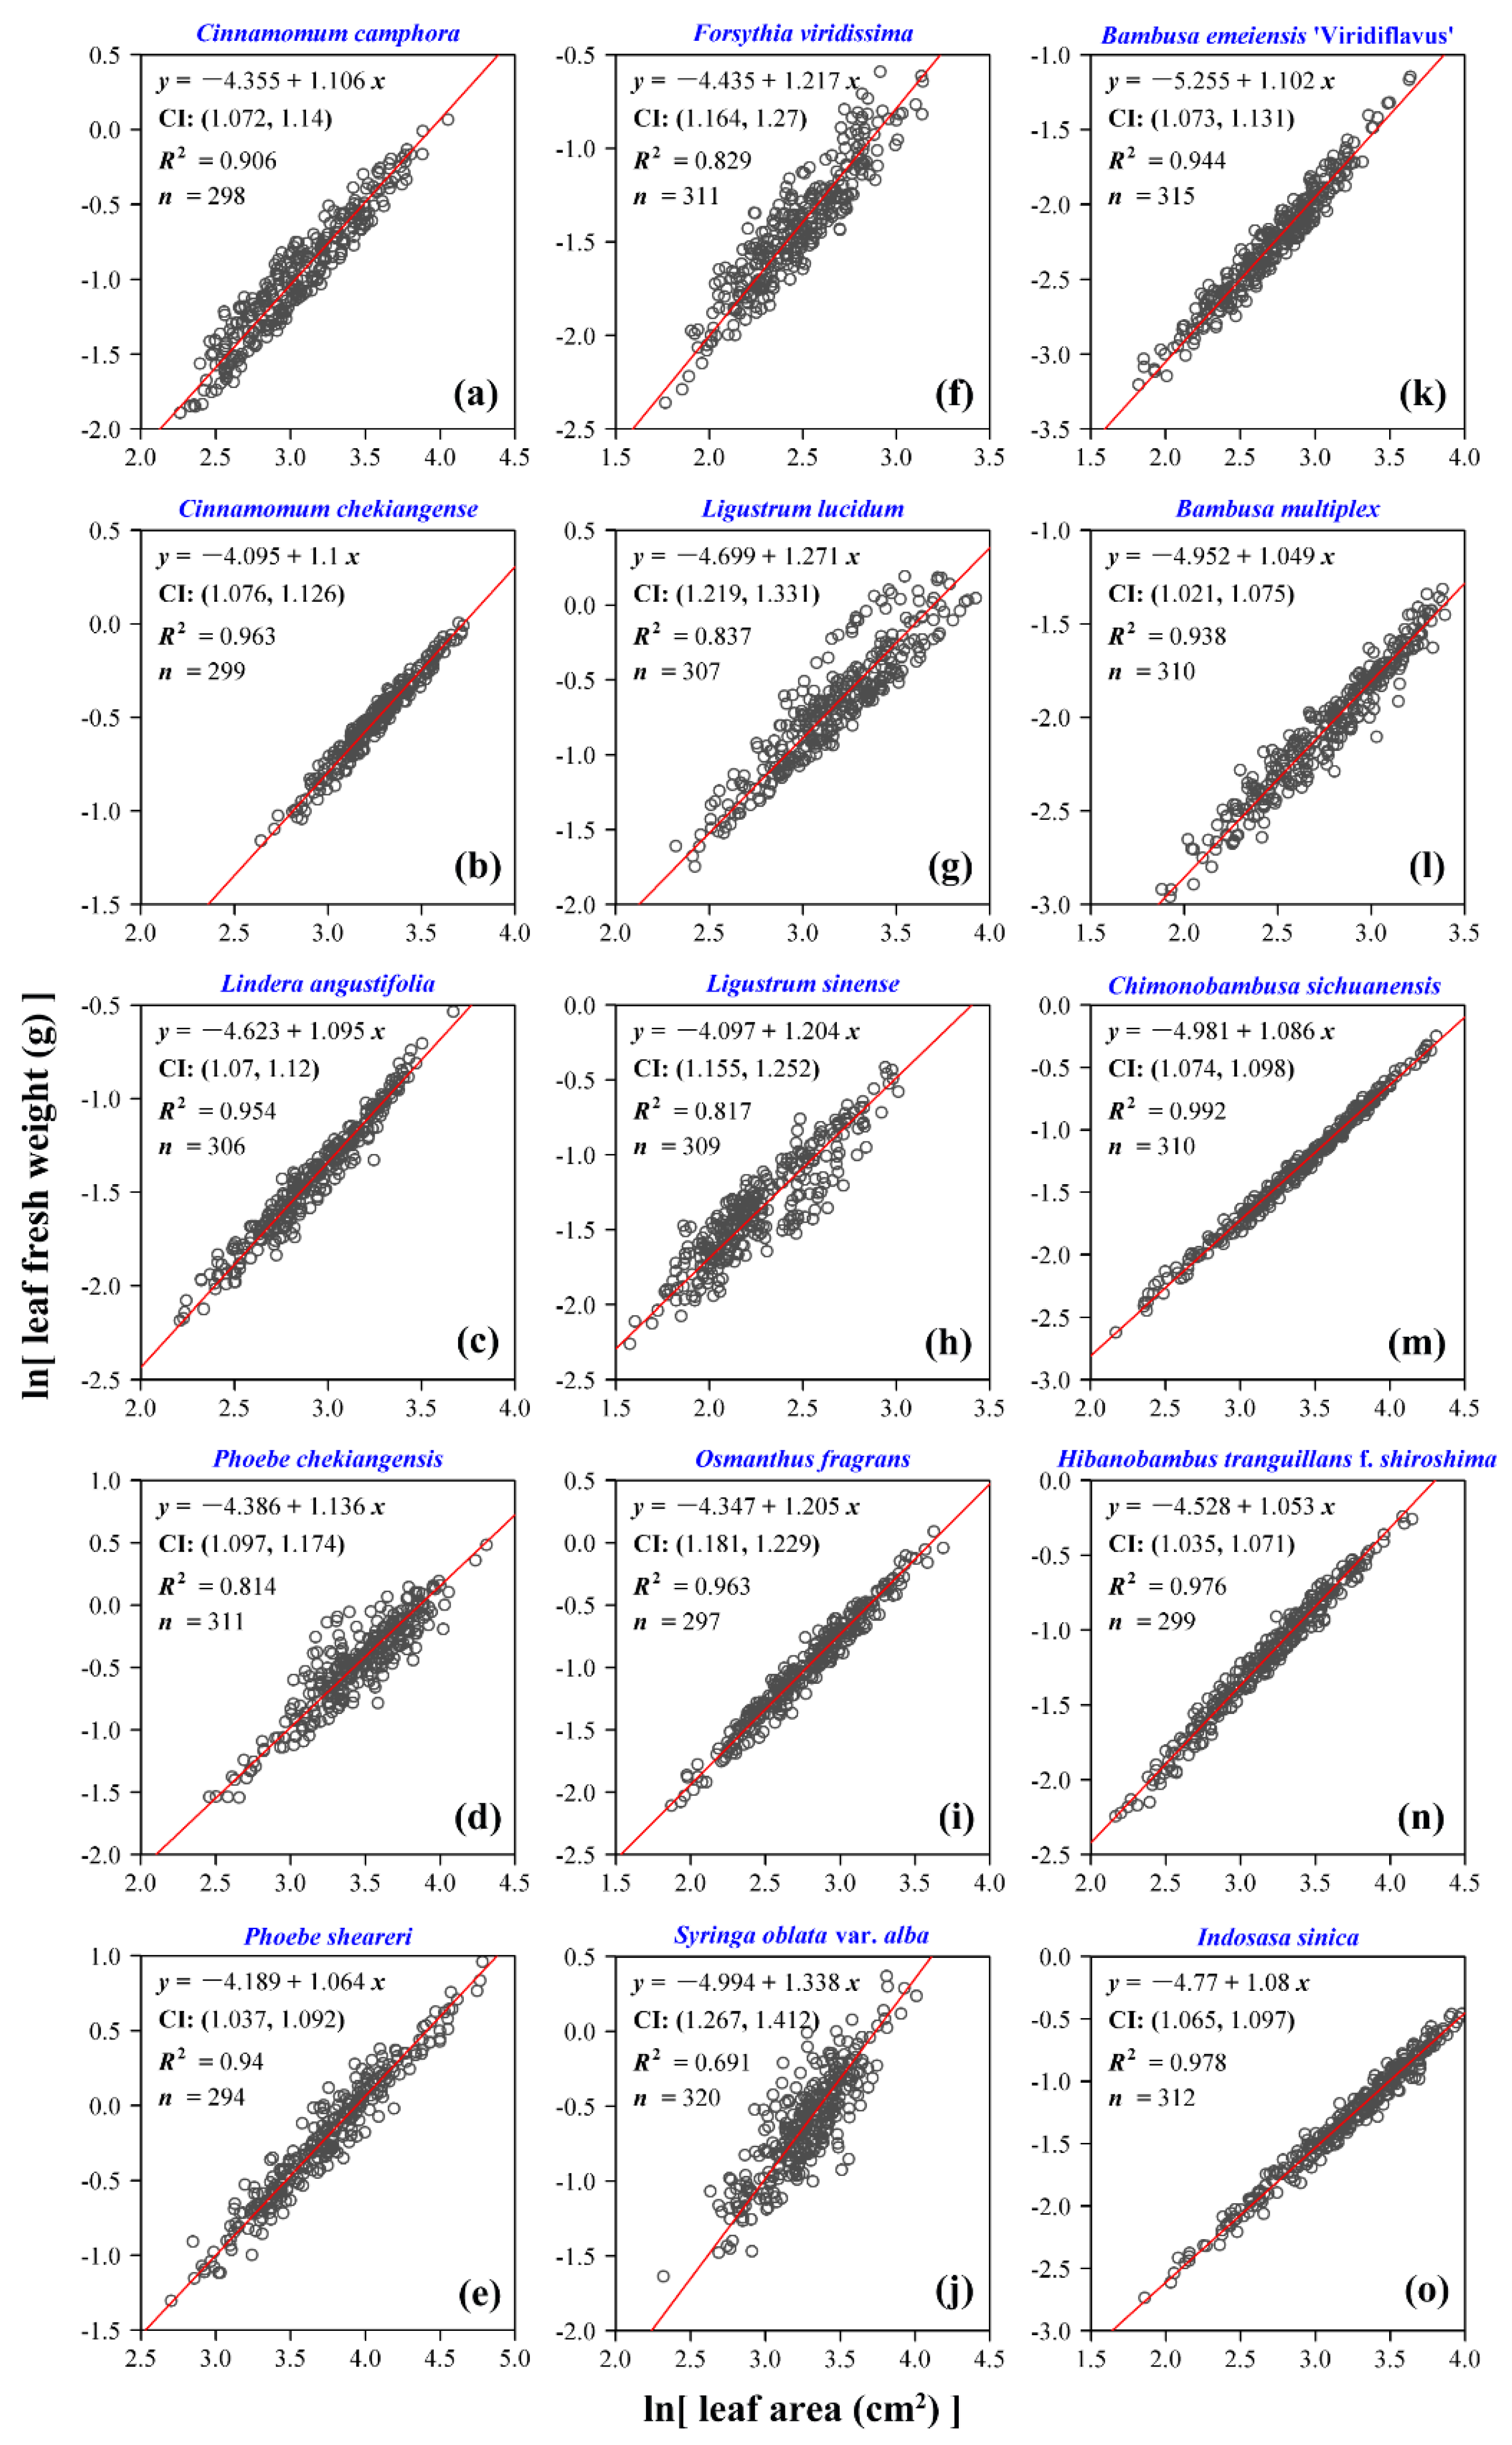
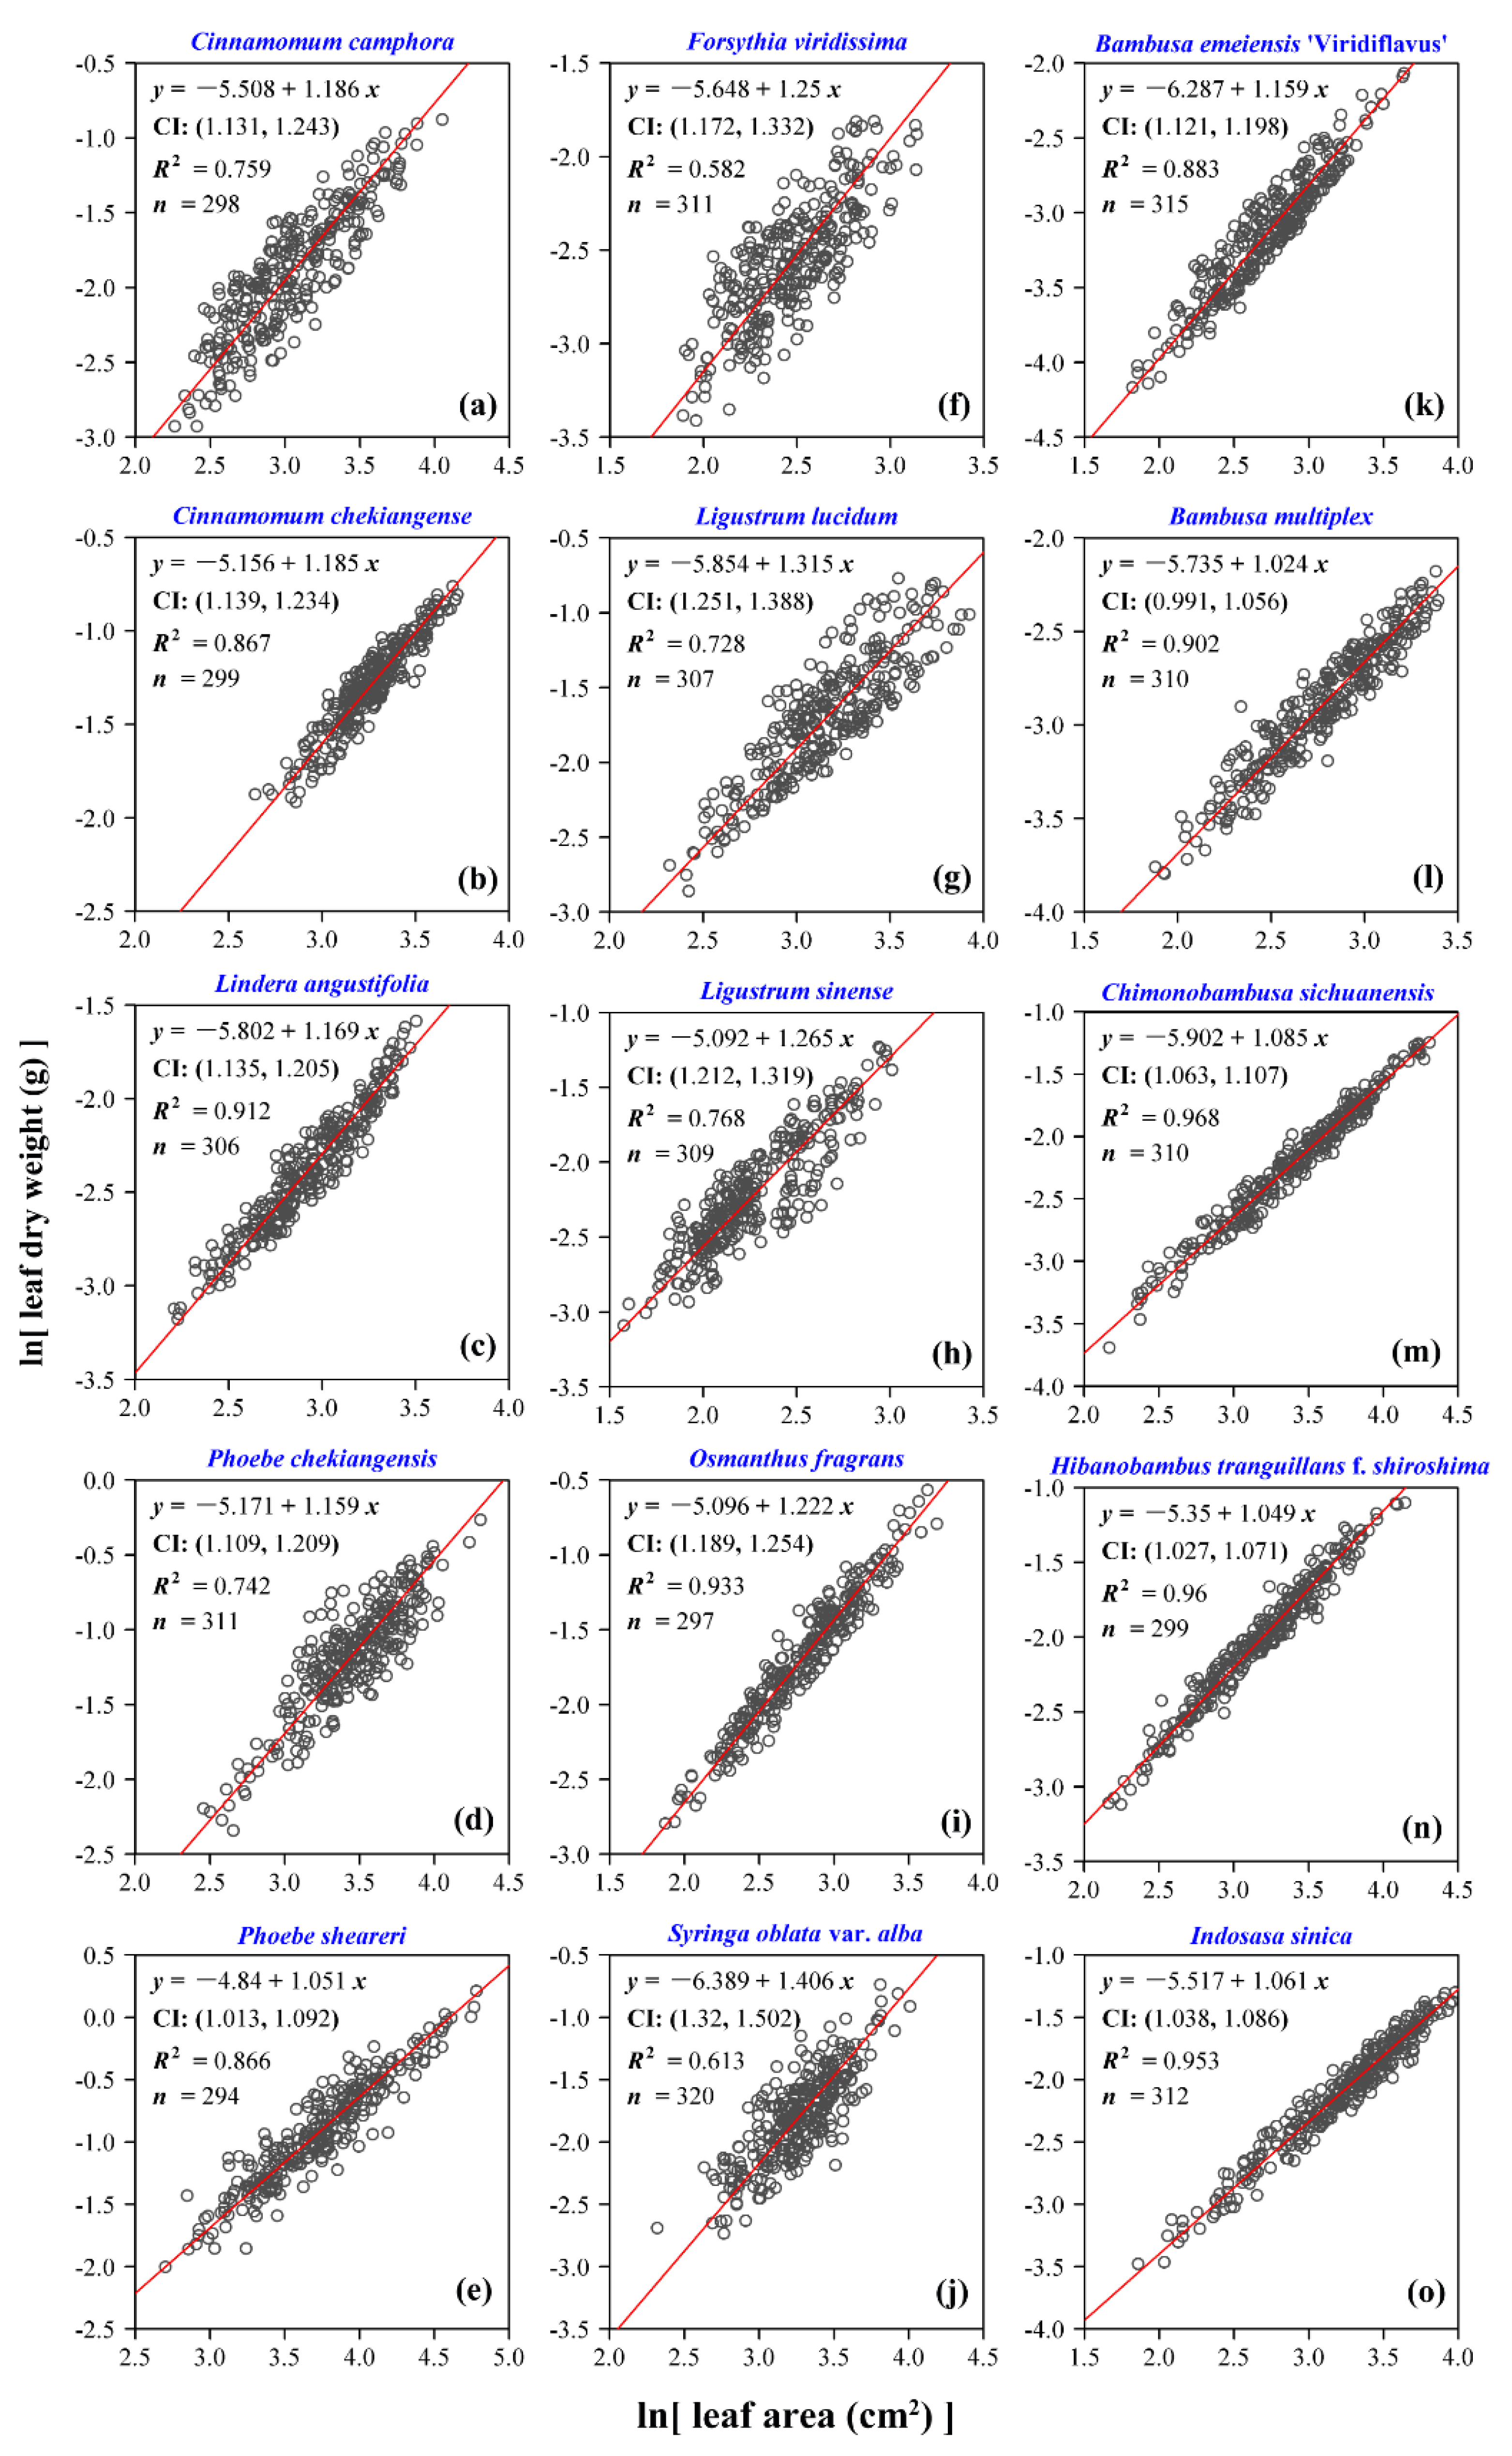
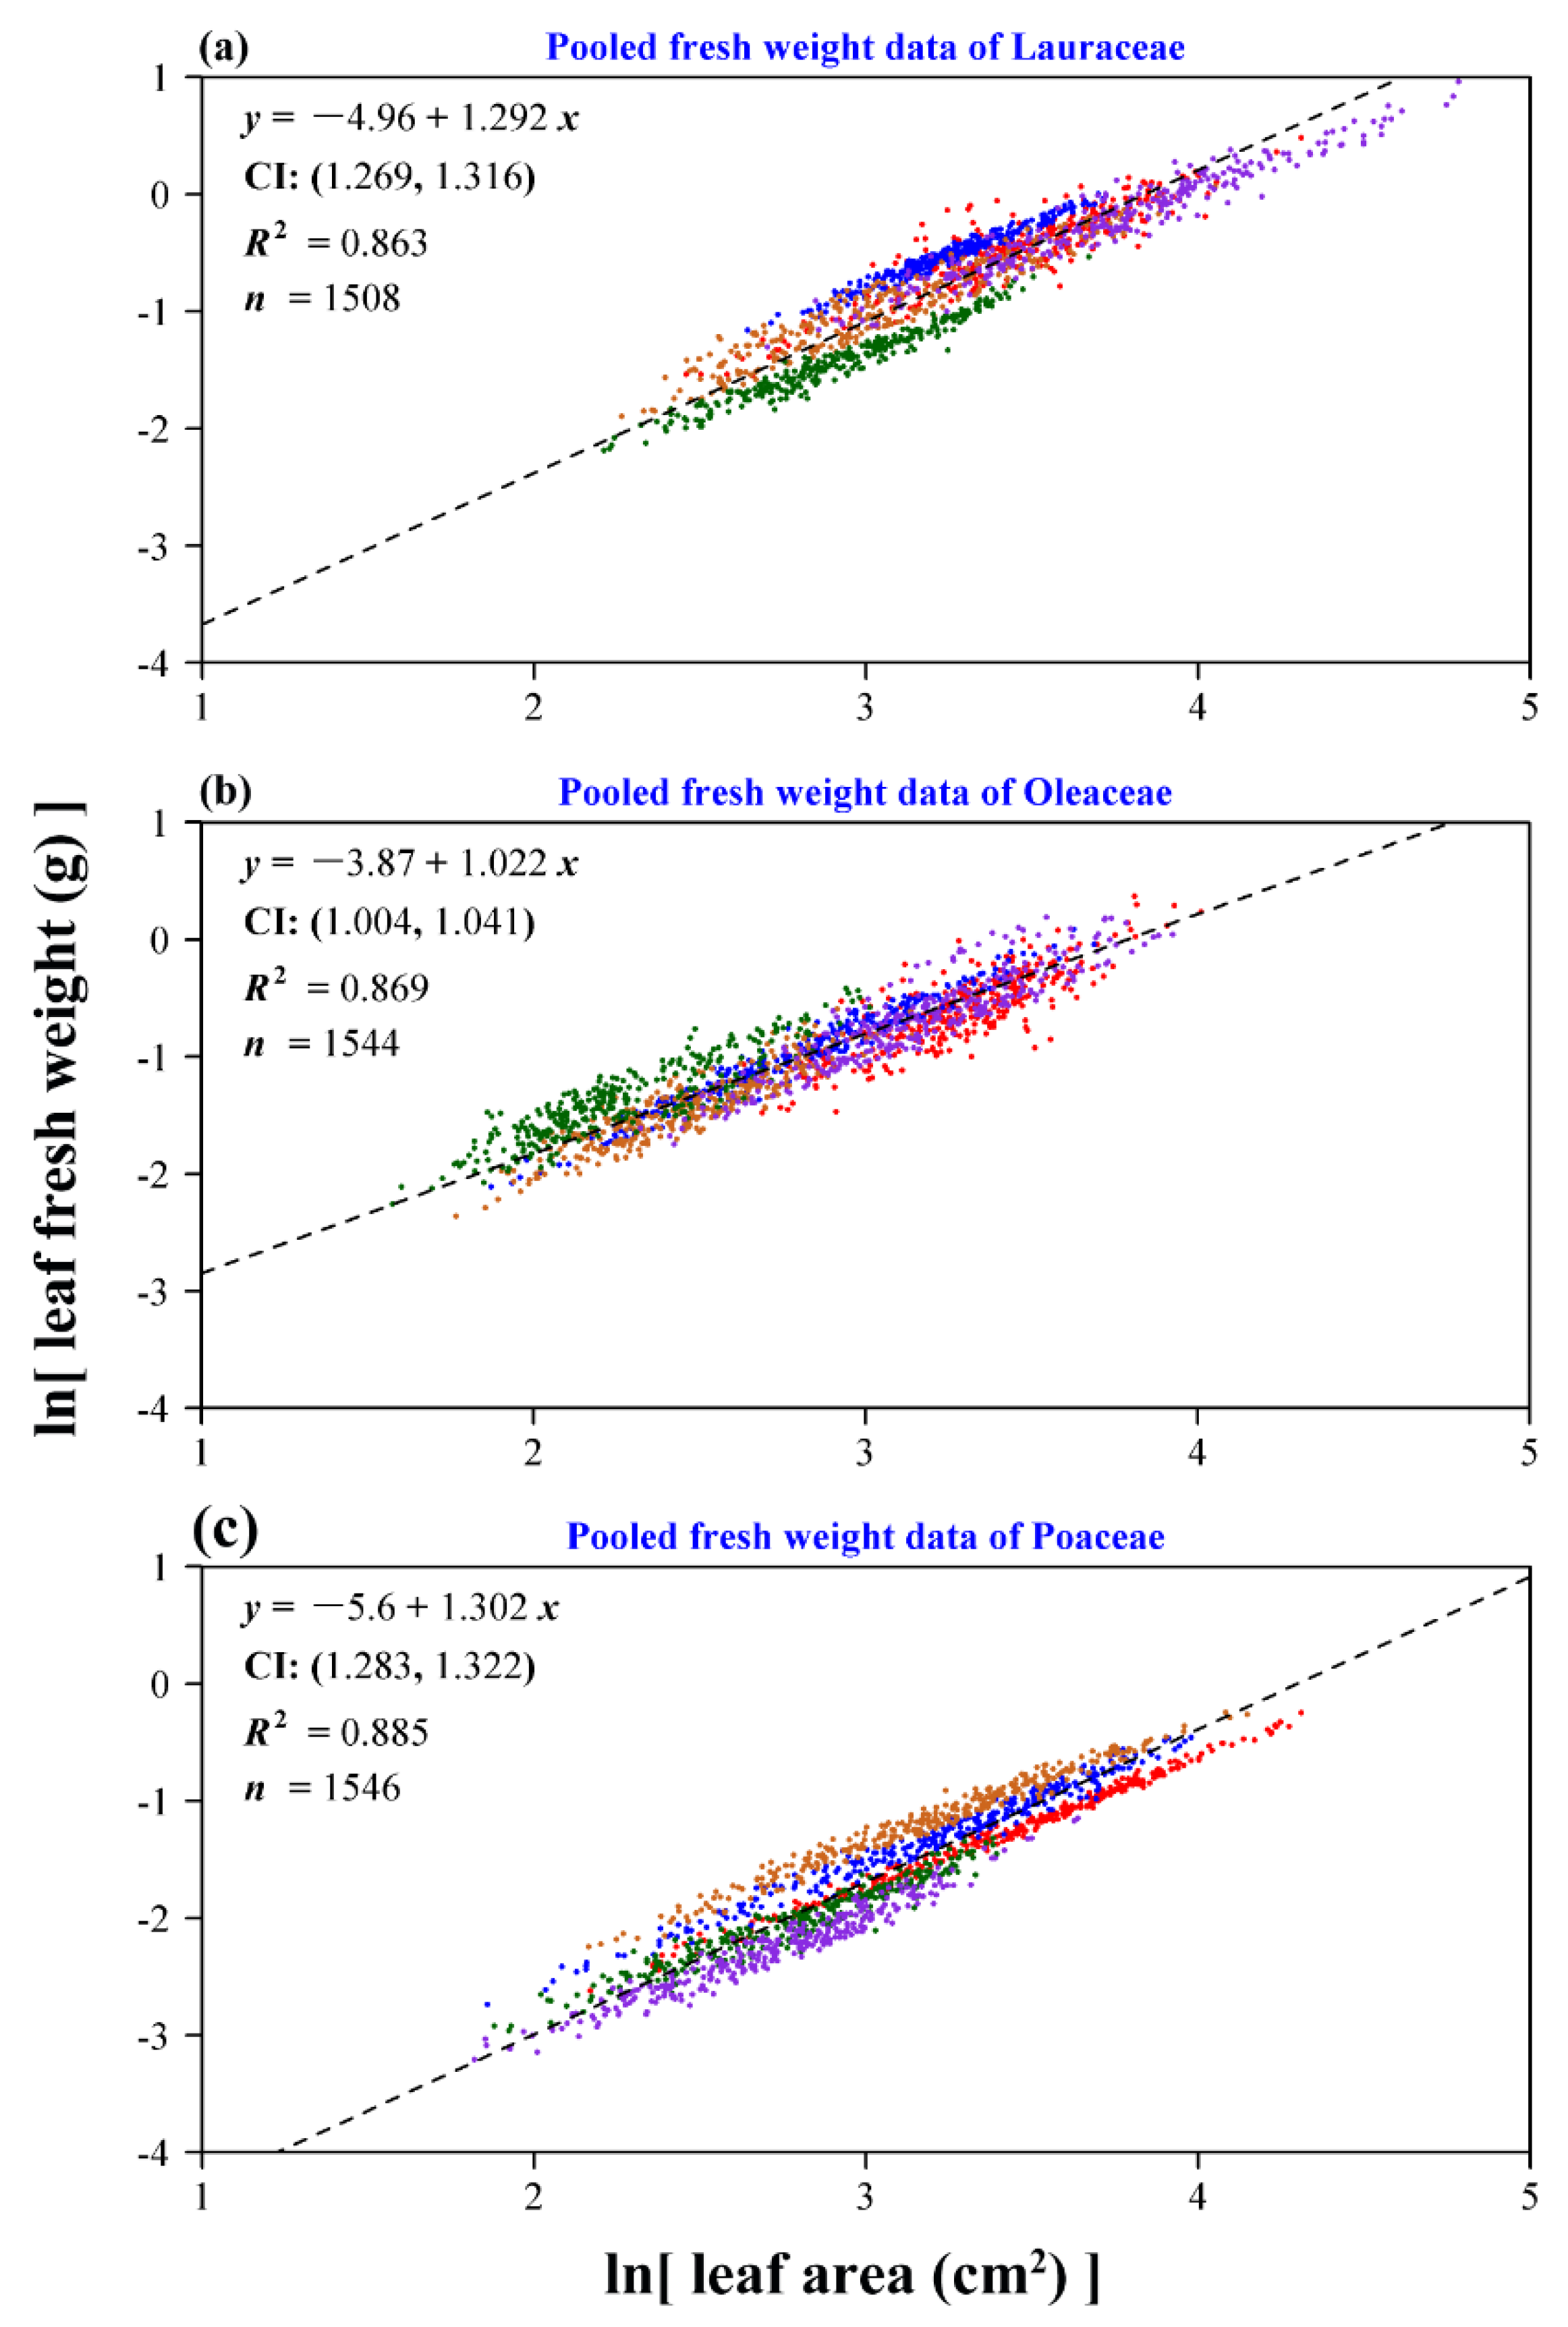
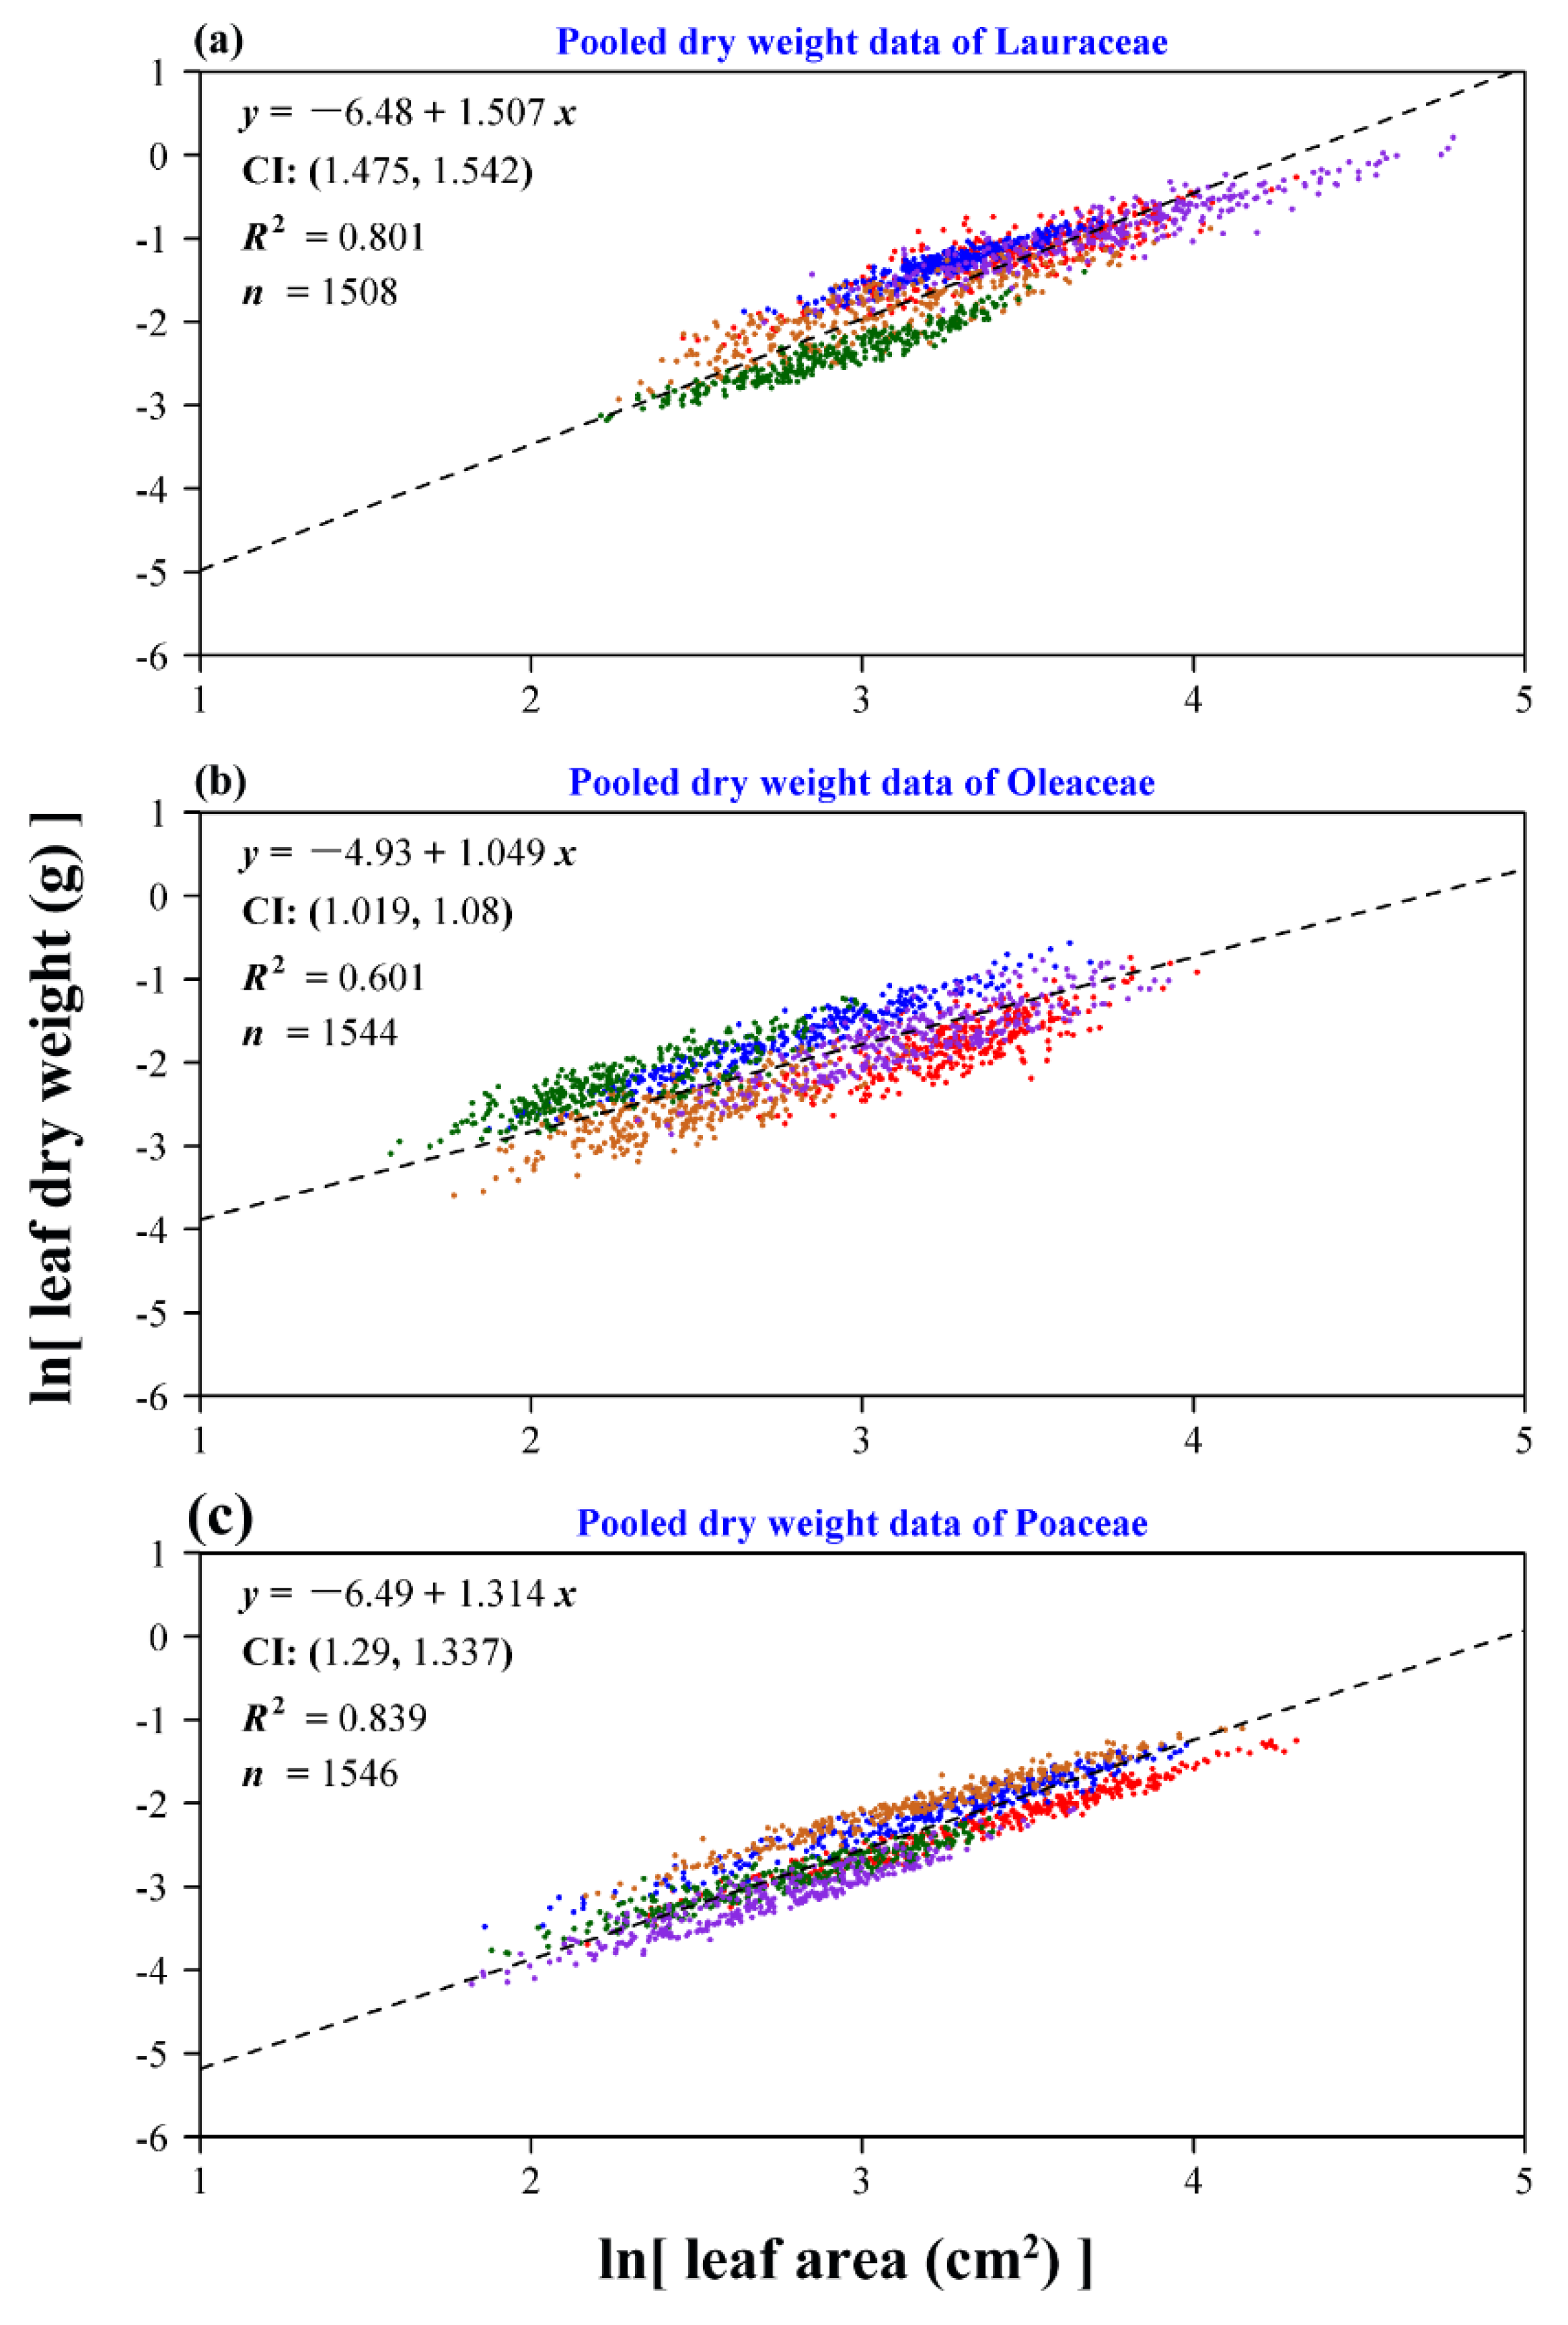
We used the power-law function to describe the scaling relationship between any two leaf measured quantities (including leaf dry weight vs. fresh weight, leaf fresh weight vs. area, and leaf dry weight vs. area).
m =   c p b ,
where m and p represent the dependent and independent variables, respectively; and c and b are parameters to be fitted. If the scaling exponent b is equal to one, then m is proportional to p; if b is not equal to one, then m does not keep pace with the increase of p. To stabilize the variance of the m and p observations, the log-transformation is usually used [4,5].
ln ( m ) = ln ( c ) + b ln ( p ) ,
which can be rewritten as
y   = a + b x ,
where y = ln(m), x = ln(p), and a = ln(c). Parameters a and b can be obtained using reduced major axis regression [22]. We exhibit the fitted results for the data of individual species, and also for the pooled data based on the same family, considering that the pooled data can also meet the scaling relationship [5]. To compare the significance of the difference of any two estimates of the scaling exponents among the 15 species of plants, the bootstrap percentile method was used [23,24].
In addition, Tukey’s honest significant difference (HSD) test with a 0.05 significance level [25] was used to determine the significance of differences in leaf area, the ratio of leaf dry weight to fresh weight, and the ratio of leaf width to length among the 15 species. All statistical analyses were carried out using R [21].

3. Results

We found that there exists a significant scaling relationship between leaf dry weight and fresh weight for each species investigated (Figure 2). Overall, most scaling exponents of leaf dry weight vs. fresh weight were not equal to one, which indicates that there are significant allometric relationships between leaf dry weight and fresh weight for most species investigated. In other words, for most species, leaf dry weight is not proportional to leaf fresh weight and the estimate of the scaling exponent of leaf fresh weight vs. area should be slightly different from that of leaf dry weight vs. area. Figure 3 exhibits the fitted results for the scaling relationships between leaf dry weight and fresh weight based on the pooled data according to the same family. All three estimates of the scaling exponents were larger than one. The goodness of fit for the pooled data of the five Bambusoideae species was the highest (R2 = 0.985), and the estimate of the scaling exponent approached one. Table S1 (Supplementary Materials) lists the detailed estimates of the parameters, the corresponding standard errors, and 95% confidence intervals. Figure 4a indicates that the leaf areas are significantly different among the 15 species with species 5 (i.e., P. sheareri) showing the largest leaves. Figure 4b provides a direct comparison of the ratio of leaf dry weight to fresh weight. We found that the intra-group difference in this ratio among the five Bambusoideae species was smaller than the inter-group differences of the family Lauraceae and especially of the family Oleaceae. Figure 4c provides a direct comparison of the ratio of leaf width to length. Here, we are mainly concerned with the intra-family difference in such a ratio. Species 5, 6, 9, 12, 13, and 14 (i.e., P. sheareri, F. viridissima, O. fragrans, B. multiplex, C. sichuanensis, and H. tranquillans, respectively) have the smallest leaf width/length ratio within the corresponding families to which those species belong.
Whether using leaf fresh weight or using leaf dry weight as the dependent variable (i.e., leaf biomass), we found that the scaling relationship between leaf biomass and area holds at an individual species level or a family level (Figure 5, Figure 6, Figure 7 and Figure 8). At the individual species level, the scaling relationship between leaf fresh weight and area is stronger than that between leaf dry weight and area for each species based on the comparison of the coefficients of determination (Figure 5 and Figure 6). The data of leaf fresh weight vs. area are more concentrated around the regression line than those of leaf dry weight vs. area for any species from the 15 investigated species. By comparing the scaling exponent of leaf dry weight vs. area with that of leaf fresh weight vs. area for any species from the 15 investigated species, we find that five estimates of the scaling exponent (P. sheareri, F. viridissima, O. fragrans, C. sichuanensis, and H. tranquillans f. shiroshima) showed an insignificant difference, and these five species have a narrower leaf shape than that of species within the same family (Figure 4b). Eight species indicate larger scaling exponents of leaf dry weight vs. area than those of leaf fresh weight vs. area, and only two species have the opposite results (Tables S2 and S3, Supplementary Materials). Even at the family level, the above conclusion still holds (Figure 7 and Figure 8). Especially for the pooled data of the family Oleaceae, the goodness of fit based on leaf fresh weight is remarkably higher than that based on leaf dry weight (R2 = 0.869 in Figure 7b vs. R2 = 0.601 in Figure 8b). The estimates of the scaling exponents of leaf fresh weight vs. leaf area for the 15 species of plants are all larger than one, which demonstrates the existence of “diminishing returns”. The derivative of leaf area to leaf fresh (or dry) weight is a decreasing function of leaf fresh (or dry) weight. However, the scaling exponent of leaf dry weight vs. leaf area might overemphasize diminishing returns.

4. Discussion

The current study shows that, for most species, the scaling exponents range from 1.00 to 1.25 except L. lucidum and S. oblata var. alba (see Table S2, Supplementary Materials). Because the leaves of S. oblata var. alba are not very flat, the values of leaf surface area might be underestimated, which will consequently overestimate the scaling exponent of leaf biomass vs. leaf surface area. However, whether using leaf fresh weight data or dry weight data, we found that the estimates of the scaling exponents are all greater than one, demonstrating the existence of diminishing returns for the 15 species of plants. Contrary to the finding of Lin et al. [15], who obtained a scaling exponent of 1.147 using 11 bamboo species, our estimate was 1.314, using the pooled data of five bamboo species. This might be the result of the smaller number of bamboo species in the current study. However, our main objective in this study was to examine whether the scaling exponent based on leaf fresh weight is the same as that based on leaf dry weight. The accuracy of estimating the scaling exponent based on the pooled data is not a big problem because, even with only five bamboo species, we still draw the conclusion that using leaf fresh weight data is better than using leaf dry weight when examining a scaling relationship with leaf area (Figure 7c vs. Figure 8c).
At an individual species level, the above conclusion still holds. This means that relevant studies of the leaf allometry have to consider the influence of foliar water content on the scaling relationship between leaf biomass and area. The study of Weraduwage et al. [26] revealed that, while photosynthesis may drive plant growth, large changes in growth of leaf area and thickening could result from small changes in partitioning of assimilated C to growth. Partitioning between leaf thickening and area enlarging is considered as a trade-off between the capacities for area based on photosynthesis and light capture [27,28]. Using the Arabidopsis Leaf Area Growth Model, the authors assumed that growth during nighttime and daytime is derived to be the same as long as C availability and partitioning are optimum [26]. Previous studies revealed that, under adequate water availability, the magnitude of nighttime transpiration rate does not affect leaf nutrient content or rosette dry weight in Arabidopsis [29]. However, the nutrient content and growth at night may be sensitive to water deficiency, under which stomatal closure can result in reduced nighttime transpiration rate and water availability [26,29,30]. Leaf water status is intimately related to several leaf physiological variables, such as leaf turgor, growth, stomatal conductance, transpiration, photosynthesis, and respiration [31]. All abovementioned physiological mechanisms are associated with leaf area growth. Longer palisade cells or an extra number of cell layers result in leaf thickening and, hence, can increase the capacity for area-based photosynthesis [32,33,34]. Leaf water potential reflects the energetic status of water inside the leaf cells [35].
Since foliar water participates in the C assimilation process, it should be considered in examining an allometry of leaf biomass vs. area. A simple approach is to measure leaf fresh weight as accurately as possible, so we can use it as the representative of leaf biomass. It is necessary to note that Niklas et al. [5] reported an estimated 0.971 for the scaling exponent for trees. We believe that such an estimate (<1) might result from the difference in leaf morphology and structural features across a series of taxa. In fact, even for the same family (e.g., Rosaceae), the leaf shapes have a large variation, which does not lead to a close scaling relationship between leaf biomass and area [36]. In this case, the estimate of the scaling exponent for the pooled data of several species within the same family cannot cover different allometric patterns among different groups in the whole family (which means that the slopes on a log–log scale for different groups even for the same taxon might vary greatly), especially when the family has a large number of members. Thus, to calculate the scaling exponent of leaf biomass vs. area for the pooled data of some species within the same family that have different leaf shapes seems to be meaningless. However, in the current study, in addition to at an individual species level, the scaling relationship between leaf fresh weight and area is stronger than that between leaf dry weight and area, even at the family level; thus, the conclusion is still the same. It shows that foliar water content is fairly important in photosynthesis, contributing significantly to leaf growth and form [37,38]; thus, there is a better scaling relationship between leaf fresh weight (leaf dry weight + foliar water content) and area.
Foliar water content is closely associated with leaf form and structure [37]. Usually, broad circular or heart-shaped leaves contain more water than narrow linear leaves because the latter has to evolve a higher density to prevent leaves from shearing off caused by physical factors like wind. This constraint causes the inner space of leaves to hold less water. The 26 genera of Oleaceae have ca. 790 species [39], and leaf shapes of species have a large variation, especially the ratio of leaf width to length (Figure 1). This might have led to a low goodness of fit for the linear regression for the pooled family data of leaf dry weight vs. area (Figure 8b). Since there exists evidence that foliar water content could restrict leaf area and thickness [13], we have grounds for believing that foliar water content may have an important influence on leaf shape, especially the ratio of leaf width to length. In fact, as mentioned above, Chaves et al. [37] reported that broad leaves hold more water than narrow linear leaves. The influence of foliar water content on leaf shape deserves further study in future investigations.
Plants with a high fitness can reasonably allocate energy (represented by dry mass) to leaves and other organs to achieve a trade-off between the growth organs and the reproduction organs. However, the individual energy allocation usually exhibits some variations that do not keep pace with the increase of mean energy. It is usually expressed by a power-law equation for the mean–variance scaling relationship, which is referred to as Taylor’s power law [40,41,42]. In other words, if Taylor’s power law holds for individual energy allocation for leaves, the leaves with larger mass will also have a larger variation in dry weight than the leaves with smaller mass. The mean and variance of dry weight for different groups of leaves should follow the above power-law relationship. We calculated the mean and variance of leaf dry weight for each species and carried out a linear regression based on ordinary least squares (Figure 9). It shows that the variation in leaf dry weight relative to the mean exhibits a power-law tendency for the 15 species of plants investigated here. However, the leaf dry weight itself does not account for the difference between the scaling exponent of leaf dry weight vs. area and that of leaf fresh weight vs. area. Because leaf anatomical structures are rather different among the three families, we believe that comparing the leaf shapes of the species within the same taxon (here, a family) is more meaningful than doing it across different taxa. It happens that, for those species with the lowest ratio of leaf width to length in the corresponding families (i.e., P. sheareri, F. viridissima, O. fragrans, C. sichuanensis and H. tranquillans f. shiroshima), there is no significant difference between the two scaling exponents. Species 8 and 10 (i.e., L. sinense and S. oblata var. alba), with larger ratios of leaf width to length, have larger significant differences in two estimates of the scaling exponents (see Tables S2 and S3, Supplementary Materials). This demonstrates that leaf shape can influence the scaling relationship between leaf biomass and area. For the narrow leaves, two scaling exponents are more similar because of the reduction in foliar water content per unit area. However, this conclusion still needs to be further confirmed by more elaborate experiments in future studies. For the 15 species of plants investigated, their leaf shapes can actually be described by the simplified Gielis equation [20,43,44]. Figure 10 shows the fitted results using the simplified Gielis equation to the 15 leaf profiles as shown in Figure 1. The simplified Gielis equation only has two parameters, which can be replaced by leaf width and length [20]. Thus, it is reasonable to use the ratio of leaf width to length to reflect the difference in leaf shape. However, for leaves such as palmate or pinnatisect, it will be a challenge to provide a good indicator to quantify such complex leaf shapes in future studies.

5. Conclusions

Comparing the scaling relationship between leaf fresh weight and area with that between leaf dry weight and area for 15 broad-leaved plants from three families, we found that, whether at an individual species level or at a family level, the former is stronger than the latter based on goodness of fit. This means that if leaf fresh weight can be accurately measured, then it is better to use leaf fresh weight to represent leaf biomass than to use leaf dry weight to exhibit a scaling relationship with leaf area for broad-leaved species. This also indicates that foliar water content does not keep pace with the increase of leaf dry weight. For most species investigated, the scaling exponents of leaf dry weight vs. area are larger than those of leaf fresh weight vs. area. If the scaling exponent obtained using leaf fresh weight is more reliable than that using leaf dry weight based on goodness of fit, then the scaling exponent of leaf dry weight vs. area might overestimate the “diminishing returns”. In this case, we suggest using leaf fresh weight to represent leaf biomass when examining the scaling relationship between leaf biomass and leaf area of broad-leaved plants. We believe that these conclusions can also be extended to other plants with broad and flat leaves. However, whether the conclusions can be applied to conifers deserves further investigation. In addition, this study implies that investigators who are interested in evaluating the primary productivity of forests have to pay more attention to the link between climate and the C assimilation potentials of plants, because climate, especially precipitation, can have a marked influence on foliar water content, which also has an allometric relationship with leaf area.

Supplementary Materials

The following are available online at https://www.mdpi.com/1999-4907/10/3/256/s1. Table S1. Fitted results for the scaling relationships between leaf dry weight and leaf fresh weight of 15 species of plants; Table S2. Fitted results for the scaling relationships between leaf dry weight and area of 15 species of plants; Table S3. Fitted results for the scaling relationships between leaf fresh weight and area of 15 species of plants.

Author Contributions

P.S. designed the experiment; P.W. and J.S. carried out the field experiment; W.H., D.A.R., C.H., and P.S. analyzed the data and wrote the manuscript; W.H., D.A.R., and P.S. revised the manuscript. All authors read and commented on this manuscript.

Funding

This research was funded by the Natural Science Foundation of the Jiangsu Higher Education Institutions of China (No. 18KJB220005) and the Priority Academic Program Development of Jiangsu Higher Education Institutions (grant number: no number).

Acknowledgments

We are thankful to Fang Li, Shuyan Lin, Xiaojing Yu, and Xiao Zheng for their useful help during the preparation of this manuscript.

Conflicts of Interest

The authors declare no conflicts of interest.

References

  1. Funk, J.L.; Cornwell, W.K. Leaf traits within communities: Context may affect the mapping of traits to function. Ecology 2013, 94, 1893–1897. [Google Scholar] [CrossRef]
  2. Onoda, Y.; Saluñga, J.B.; Akutsu, K.; Aiba, S.; Yahara, T.; Anten, N.P.R. Trade-off between light interception efficiency and light use efficiency: Implications for species coexistence in one-sided light competition. J. Ecol. 2014, 102, 167–175. [Google Scholar] [CrossRef]
  3. Puglielli, G.; Crescente, M.F.; Frattaroli, A.R.; Gratani, L. Leaf mass per area (LMA) as a possible predictor of adaptive strategies in two species of Sesleria (Poaceae): Analysis of morphological, anatomical and physiological leaf traits. Ann. Bot. Fenn. 2015, 52, 135–143. [Google Scholar] [CrossRef]
  4. Milla, R.; Reich, P.B. The scaling of leaf area and mass: The cost of light interception increases with leaf size. Proc. R. Soc. Biol. Sci. 2007, 274, 2109–2114. [Google Scholar] [CrossRef] [PubMed]
  5. Niklas, K.J.; Cobb, E.D.; Niinemets, U.; Reich, P.B.; Sellin, A.; Shipley, B.; Wright, I.J. ‘Diminishing returns’ in the scaling of functional leaf traits across and within species groups. Proc. Natl. Acad. Sci. USA 2007, 104, 8891–8896. [Google Scholar] [CrossRef] [PubMed]
  6. Sun, J.; Fan, R.; Niklas, K.J.; Zhong, Q.; Yang, F.; Li, M.; Chen, X.; Sun, M.; Cheng, D. “Diminishing returns” in the scaling of leaf area vs. dry mass in Wuyi Mountain bamboos, Southeast China. Am. J. Bot. 2017, 104, 993–998. [Google Scholar] [CrossRef] [PubMed]
  7. Smith, W.K.; Vogelmann, T.C.; DeLucia, E.H.; Bell, D.T.; Shepherd, K.A. Leaf form and photosynthesis: Do leaf structure and orientation interact to regulate internal light and carbon dioxide? BioScience 1997, 47, 785–793. [Google Scholar] [CrossRef]
  8. Runions, A.; Fuhrer, M.; Lane, B.; Federl, P.; Rolland-Lagan, A.-G.; Prusinkiewicz, P. Modeling and visualization of leaf venation patterns. ACM Trans. Graph. 2005, 24, 702–711. [Google Scholar] [CrossRef]
  9. Wright, I.J.; Dong, N.; Maire, V.; Prentice, I.C.; Westoby, M.; Díaz, S.; Gallagher, R.V.; Jacobs, B.F.; Kooyman, R.; Law, E.A.; et al. Global climatic drivers of leaf size. Nature 2017, 357, 917–921. [Google Scholar] [CrossRef] [PubMed]
  10. Dawson, T.E.; Goldsmith, G.R. The value of wet leaves. New Phytol. 2018, 219, 1156–1169. [Google Scholar] [CrossRef]
  11. Li, G.; Yang, D.; Sun, S. Allometric relationships between lamina area, lamina mass and petiole mass of 93 temperate woody species vary with leaf habit, leaf form and altitude. Funct. Ecol. 2008, 22, 557–564. [Google Scholar] [CrossRef]
  12. Pan, S.; Liu, C.; Zhang, W.; Xu, S.; Wang, N.; Li, Y.; Gao, J.; Wang, Y.; Wang, G. The scaling relationships between leaf mass and leaf area vascular plant species change with altitude. PLoS ONE 2013, 8, e76872. [Google Scholar] [CrossRef]
  13. Tsukaya, H. Leaf shape: Genetic controls and environmental factors. Int. J. Dev. Biol. 2005, 49, 547–555. [Google Scholar] [CrossRef]
  14. Hughes, A.P.; Cockshull, K.E.; Heath, O.V.S. Leaf area and absolute leaf water content. Ann. Bot. 1970, 34, 259–266. [Google Scholar] [CrossRef]
  15. Lin, S.; Shao, L.; Hui, C.; Song, Y.; Reddy, G.V.P.; Gielis, J.; Li, F.; Ding, Y.; Wei, Q.; Shi, P. Why does not the leaf weight-area allometry of bamboos follow the 3/2-power law? Front. Plant Sci. 2018, 9, 583. [Google Scholar] [CrossRef]
  16. Du, X.; Guo, Q.; Ni, H. The present research situation and prospect of China’s matcha. Chin. Wild Plant Res. 2018, 37, 29–35. [Google Scholar]
  17. Huang, W.; Hu, T.; Chen, H.; Wang, Q.; Hu, H.; Tu, L.; Jing, L. Impact of decomposing Cinnamomum septentrionale leaf litter on the growth of Eucalyptus grandis saplings. Plant Physiol. Bioch. 2013, 70, 411–417. [Google Scholar] [CrossRef]
  18. Huang, W.; Hu, H.; Hu, T.; Chen, H.; Wang, Q.; Chen, G.; Tu, L. Impact of aqueous extracts of Cinnamomum septentrionale leaf litter on the growth and photosynthetic characteristics of Eucalyptus grandis seedlings. New For. 2015, 46, 561–576. [Google Scholar] [CrossRef]
  19. Shi, P.; Huang, J.; Hui, C.; Grissino-Mayer, H.D.; Tardif, J.; Zhai, L.; Wang, F.; Li, B. Capturing spiral radial growth of conifers using the superellipse to model tree-ring geometric shape. Front. Plant Sci. 2015, 6, 856. [Google Scholar] [CrossRef]
  20. Shi, P.; Ratkowsky, D.A.; Li, Y.; Zhang, L.; Lin, S.; Gielis, J. General leaf-area geometric formula exists for plants—Evidence from the simplified Gielis equation. Forests 2018, 9, 714. [Google Scholar] [CrossRef]
  21. R Core Team. R: A Language and Environment for Statistical Computing; R Foundation for Statistical Computing: Vienna, Austria, 2015; Available online: https://www.R-project.org/ (accessed on 17 April 2018).
  22. Smith, R.J. Use and misuse of the reduced major axis for line-fitting. Am. J. Phys. Anthropol. 2009, 140, 476–786. [Google Scholar] [CrossRef]
  23. Efron, B.; Tibshirani, R.J. An Introduction to the Bootstrap; Chapman and Hall: London, UK, 1993. [Google Scholar]
  24. Sandhu, H.S.; Shi, P.; Kuang, X.; Xue, F.; Ge, F. Applications of the bootstrap to insect physiology. Fla. Entomol. 2011, 94, 1036–1041. [Google Scholar] [CrossRef]
  25. Hsu, J.C. Multiple Comparisons: Theory and Methods; Chapman and Hall/CRC: New York, NY, USA, 1996. [Google Scholar]
  26. Weraduwage, S.M.; Chen, J.; Anozie, F.C.; Morales, A.; Weise, S.E.; Sharkey, T.D. The relationship between leaf area growth and biomass accumulation in Arabidopsis thaliana. Front. Plant Sci. 2015, 6, 167. [Google Scholar] [CrossRef]
  27. White, J.W.; Montes-r, C. Variation in parameters related to leaf thickness in common bean (Phaseolus vulgaris L.). Field Crop Res. 2005, 91, 7–21. [Google Scholar] [CrossRef]
  28. Jullien, A.; Allirand, J.-M.; Mathieu, A.; Andrieu, B.; Ney, B. Variations in leaf mass per area according to N nutrition, plant age and leaf position reflect ontogenetic plasticity in winter oilseed rape (Brassica napus L.). Field Crop Res. 2009, 114, 188–197. [Google Scholar] [CrossRef]
  29. Christman, M.A.; Donovan, L.A.; Richards, J.H. Magnitude of nighttime transpiration does not affect plant growth or nutrition in well-watered Arabidopsis. Physiol. Plant. 2009, 136, 264–273. [Google Scholar] [CrossRef]
  30. Friedli, M.; Walter, A. Diel growth patterns of young soybean (Glycine max) leaflets are synchronous throughout different positions on a plant. Plant Cell Environ. 2015, 38, 514–524. [Google Scholar] [CrossRef]
  31. Kramer, P.J.; Boyer, J.S. Water Relations of Plants and Soils; Academic Press: San Diego, CA, USA, 1995; 495p. [Google Scholar]
  32. Mitchell, K.A.; Bolstad, P.V.; Vose, J.M. Interspecific and environmentally induced variation in foliar dark respiration among eighteen southeastern deciduous tree species. Tree Physiol. 1999, 19, 861–870. [Google Scholar] [CrossRef]
  33. Evans, J.R.; Pooter, H. Photosynthetic acclimation of plants to growth irradiance: The relative importance of specific leaf area and nitrogen partitioning in maximizing carbon gain. Plant Cell Environ. 2001, 24, 755–767. [Google Scholar] [CrossRef]
  34. Lambers, H.; Chapin, F.S.; Pons, T.L. Plant Physiological Ecology, 2nd ed.; Springer: New York, NY, USA, 2008. [Google Scholar]
  35. Slatyer, R.O.; Taylor, S.A. Terminology in plant- and soil-water relations. Nature 1960, 187, 922–924. [Google Scholar] [CrossRef]
  36. Yu, X.; Hui, C.; Sandhu, H.S.; Lin, Z.; Shi, P. Scaling relationships between leaf shape and area of Rosaceae. Sci. Horticul. 2019. in review. [Google Scholar]
  37. Chaves, M.M.; Pereira, J.S.; Maroco, J.; Rodrigues, M.L.; Ricardo, C.P.P.; Osório, M.L.; Carvalho, I.; Faria, T.; Pinherio, C. How plants cope with water stress in the field—Photosynthesis and growth. Ann. Bot. 2002, 89, 907–916. [Google Scholar] [CrossRef]
  38. Ullah, A.; Skidmore, A.K.; Groen, T.A.; Schlerf, M. Evaluation of three proposed indices for the retrieval of leaf water content from the mid-wave infrared (2–6 μm) spectra. Agric. For. Meteorol. 2013, 171–172, 65–71. [Google Scholar] [CrossRef]
  39. Christenhusz, M.J.M.; Byng, J.W. The number of known plants species in the world and its annual increase. Phytotaxa 2016, 261, 201–217. [Google Scholar] [CrossRef]
  40. Taylor, L.R. Aggregation, variance and the mean. Nature 1961, 189, 732–735. [Google Scholar] [CrossRef]
  41. Shi, P.J.; Sandhu, H.S.; Reddy, G.V.P. Dispersal distance determines the exponent of the spatial Taylor’s power law. Ecol. Model. 2016, 335, 48–53. [Google Scholar] [CrossRef]
  42. Shi, P.J.; Ratkowsky, D.A.; Wang, N.T.; Li, Y.; Reddy, G.V.P.; Zhao, L.; Li, B.L. Comparison of five methods for parameter estimation under Taylor’s power law. Ecol. Compl. 2017, 32, 121–130. [Google Scholar] [CrossRef]
  43. Gielis, J. A generic geometric transformation that unifies a wide range of natural and abstract shapes. Am. J. Bot. 2003, 90, 333–338. [Google Scholar] [CrossRef]
  44. Lin, S.; Zhang, L.; Reddy, G.V.P.; Hui, C.; Gielis, J.; Ding, Y.; Shi, P. A geometrical model for testing bilateral symmetry of bamboo leaf with a simplified Gielis equation. Ecol. Evol. 2016, 6, 6798–6806. [Google Scholar] [CrossRef]
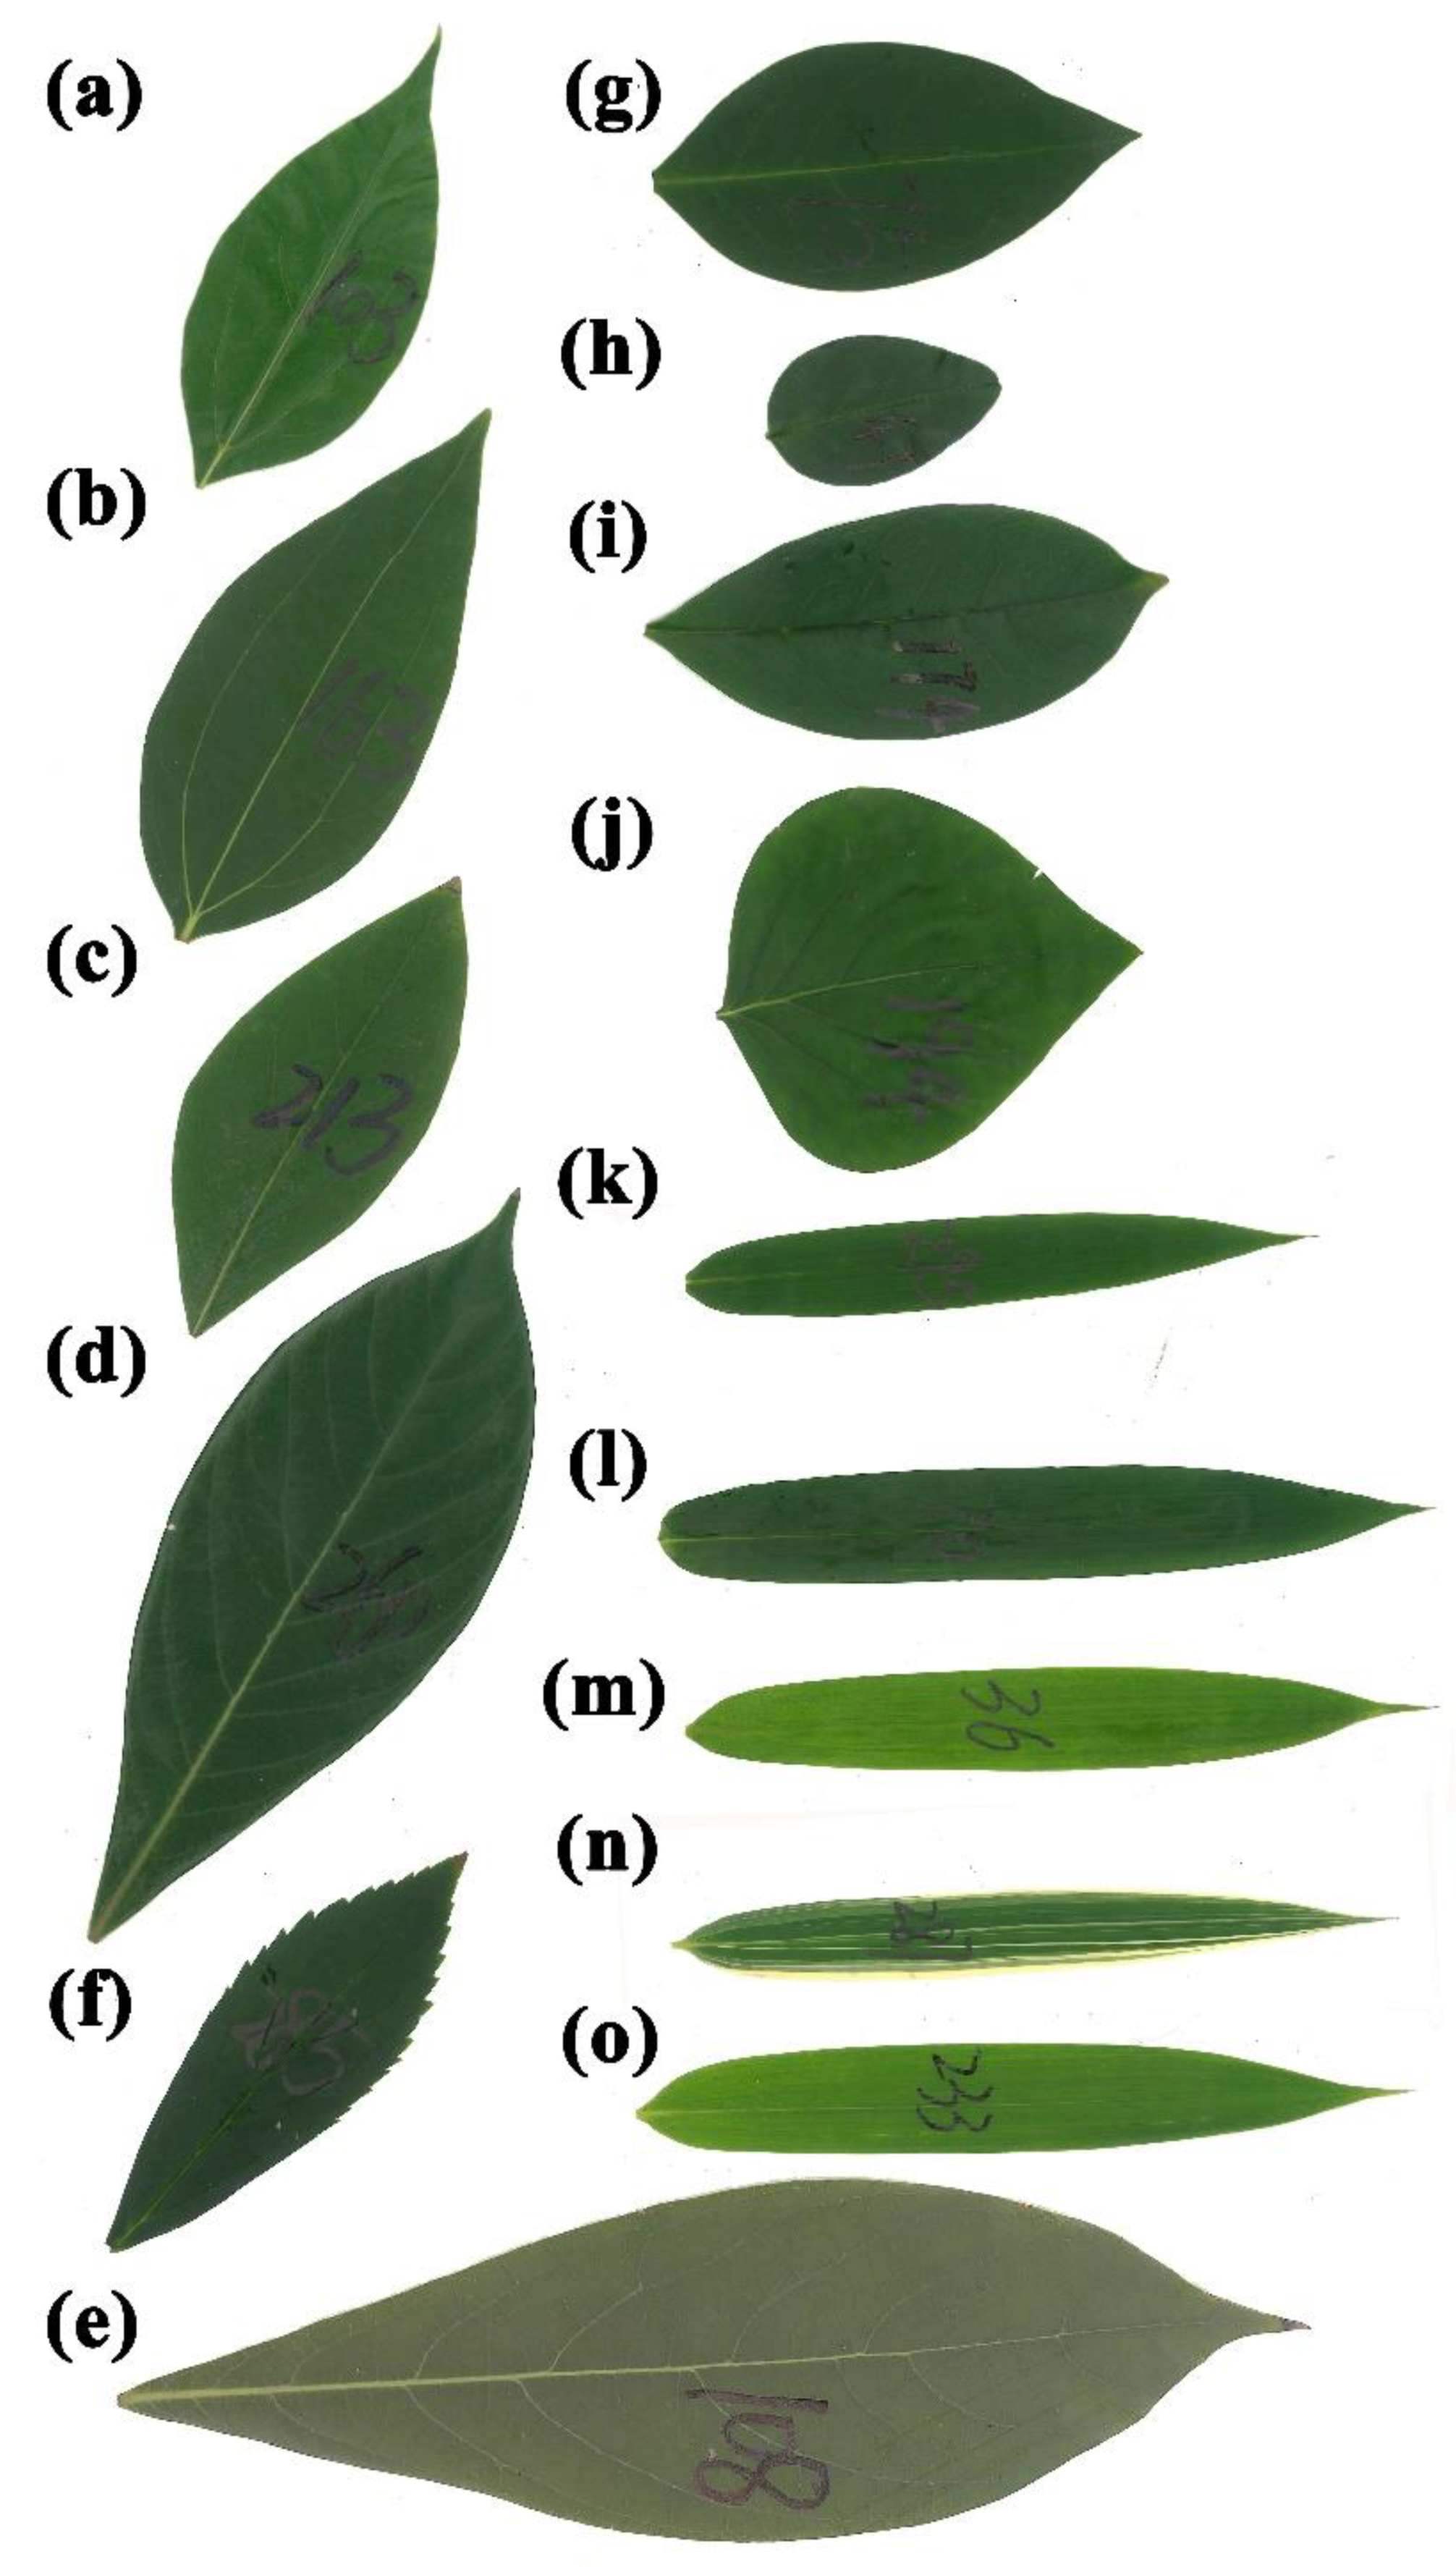
Figure 1. Leaf examples of 15 species of plants: (a) Cinnamomum camphora; (b) C. chekiangense; (c) Lindera angustifolia; (d) Phoebe chekiangensis; (e) P. sheareri; (f) Forsythia viridissima; (g) Ligustrum lucidum; (h) L. sinense; (i) Osmanthus fragrans; (j) Syringa oblata var. alba; (k) Bambusa emeiensis; (l) B. multiplex; (m) Chimonobambusa sichuanensis; (n) Hibanobambusa tranquillans f. shiroshima; (o) Indosasa sinica.
Forests 10 00256 g001
Figure 2. Scaling relationship of leaf dry weight to fresh weight at individual species level. Panels (ae) belong to Lauraceae, panels (fj) belong to Oleaceae, and panels (ko) belong to Bambusoideae. In each panel, the open circles represent the observations, and the red straight line represents the reduced major axis regression line. Furthermore, y represents the natural logarithm of leaf dry weight in g, x represents the natural logarithm of leaf fresh weight in g, CI represents the 95% confidence interval of the slope, R2 is the coefficient of determination used to measure the goodness of fit, and n represents the number of leaves sampled.
Forests 10 00256 g002
Figure 3. Scaling relationship of leaf dry weight to fresh weight for the pooled data of every family: (a) Lauraceae; (b) Oleaceae; (c) Poaceae. In each panel, the colored points represent the observations, and the black dashed line represents the reduced major axis regression line. Furthermore, y represents the natural logarithm of leaf dry weight in g, x represents the natural logarithm of leaf fresh weight in g, CI represents the 95% confidence interval of the slope, R2 is the coefficient of determination used to measure the goodness of fit, and n represents the total number of the sampled leaves for the five species of the same family. Different colored points represent different species in each panel, but points having the same color in different panels do not represent the same species.
Forests 10 00256 g003
Figure 4. Boxplots of leaf area (a), the ratio of leaf dry weight to fresh weight (b), and the ratio of leaf width to length (c). The letters above the upper whiskers are used to show the significance of the difference between any two species. Species sharing the same letter indicate that there is no significant difference in the measure of interest. The scientific names associated with the corresponding species codes can be found in Table 1. The three colors from left to right represent Lauraceae, Oleaceae, and Bambusoideae.
Forests 10 00256 g004
Figure 5. Scaling relationship of leaf fresh weight to leaf area at individual species level. Panels (ae) belong to Lauraceae, panels (fj) belong to Oleaceae, and panels (ko) belong to Bambusoideae. In each panel, the open circles represent the observations, and the red straight line represents the reduced major axis regression line. Furthermore, y represents the natural logarithm of leaf fresh weight in g, x represents the natural logarithm of leaf area in cm2, CI represents the 95% confidence interval of the slope, R2 is the coefficient of determination used to measure the goodness of fit, and n represents the number of leaves sampled.
Forests 10 00256 g005
Figure 6. Scaling relationship of leaf dry weight to leaf area at individual species level. Panels (ae) belong to Lauraceae, panels (fj) belong to Oleaceae, and panels (ko) belong to Bambusoideae. In each panel, the open circles represent the observations, and the red straight line represents the reduced major axis regression line. Furthermore, y represents the natural logarithm of leaf dry weight in g, x represents the natural logarithm of leaf area in cm2, CI represents the 95% confidence interval of the slope, R2 is the coefficient of determination used to measure the goodness of fit, and n represents the number of leaves sampled.
Forests 10 00256 g006
Figure 7. Scaling relationship of leaf fresh weight to leaf area for the pooled data of every family: (a) Lauraceae; (b) Oleaceae; (c) Poaceae. In each panel, the colored points represent the observations, and the black dashed line represents the reduced major axis regression line. Furthermore, y represents the natural logarithm of leaf fresh weight in g, x represents the natural logarithm of leaf area in cm2, CI represents the 95% confidence interval of the slope, R2 is the coefficient of determination used to measure the goodness of fit, and n represents the total number of leaves sampled for the species of the same family. Different colored points represent different species in each panel, but the same colors in different panels do not represent the same species.
Forests 10 00256 g007
Figure 8. Scaling relationship of leaf dry weight to leaf area for the pooled data of every family: (a) Lauraceae; (b) Oleaceae; (c) Poaceae. In each panel, the colored points represent the observations, and the black dashed line represents the reduced major axis regression line. Furthermore, y represents the natural logarithm of leaf dry weight in g, x represents the natural logarithm of leaf area in cm2, CI represents the 95% confidence interval of the slope, R2 is the coefficient of determination used to measure the goodness of fit, and n represents the total number of leaves sampled for the species of the same family. Different colored points represent different species in each panel, but the same colors in different panels do not represent the same species.
Forests 10 00256 g008
Figure 9. Taylor’s power law for leaf dry weight of the 15 species of plants. The colored points represent the observations, and the black dashed line represents the reduced major axis regression line. The three colors represent the three families, and each point represents one species. Furthermore, y represents the natural logarithm of the variance of leaf dry weight in g, x represents the natural logarithm of the mean of leaf dry weight in g, CI represents the 95% confidence interval of the slope, R2 is the coefficient of determination used to measure the goodness of fit, and n represents the number of data points (i.e., the pairs of means and variances of leaf dry weight for different species).
Forests 10 00256 g009
Figure 10. Gielis fit to the 15 leaf profiles: (a) C. camphora; (b) C. chekiangense; (c) L. angustifolia; (d) P. chekiangensis; (e) P. sheareri; (f) F. viridissima; (g) L. lucidum; (h) L. sinense; (i) O. fragrans; (j) S. oblata var. alba; (k) B. emeiensis; (l) B. multiplex; (m) C. sichuanensis; (n) H. tranguillans f. shiroshima; (o) I. sinica. For every panel, the gray curve represents the scanned leaf profile, and the red curve represents the leaf profile predicted by the simplified Gielis equation. The leaves correspond to those in Figure 1.
Forests 10 00256 g010
Table 1. Leaf collection information of 15 species of plants that grow in Nanjing Forestry University campus, Nanjing, People’s Republic of China (32.08° north (N), 118.82° east (E)).
Species CodeFamilyScientific NameSampling DateSample Size
1LauraceaeCinnamomum camphora (L.) J. Presl1 September 2018298
2LauraceaeCinnamomum chekiangense Nakai30 August 2018299
3LauraceaeLindera angustifolia Cheng3 September 2018306
4LauraceaePhoebe chekiangensis P.T. Li30 August, 2018311
5LauraceaePhoebe sheareri (Hemsl.) Gamble4 September 2018294
6OleaceaeForsythia viridissima Lindl.1 September 2018311
7OleaceaeLigustrum lucidum W.T. Aiton2 September 2018307
8OleaceaeLigustrum sinense Lour.2 September 2018309
9OleaceaeOsmanthus fragrans Lour.29 August 2018297
10OleaceaeSyringa oblata Lindl. var. alba Rehder28 August 2018320
11BambusoideaeBambusa emeiensis ‘Viridiflavus’ Hsuen et Yi20 June 2018315
12BambusoideaeBambusa multiplex (Lour.) Raeusch. ex Schult. & Schult.f.19 June 2018310
13BambusoideaeChimonobambusa sichuanensis (T.P. Yi) T.H. Wen31 May 2018310
14BambusoideaeHibanobambusa tranquillans f. shiroshima H. Okamura10 June 2018299
15BambusoideaeIndosasa sinica C.D. Chu & C.S. Chao7 June 2018312

