Is Phylogeny More Useful than Functional Traits for Assessing Diversity Patterns Under Community Assembly Processes?

Abstract
:1. Introduction
2. Materials and Methods
2.1. Study Site
2.2. Establishment and Sampling of Plots
2.3. Measurement of Functional Traits
2.4. Phylogenetic Analysis
2.5. Data Analyses
3. Results
3.1. α-Diversity
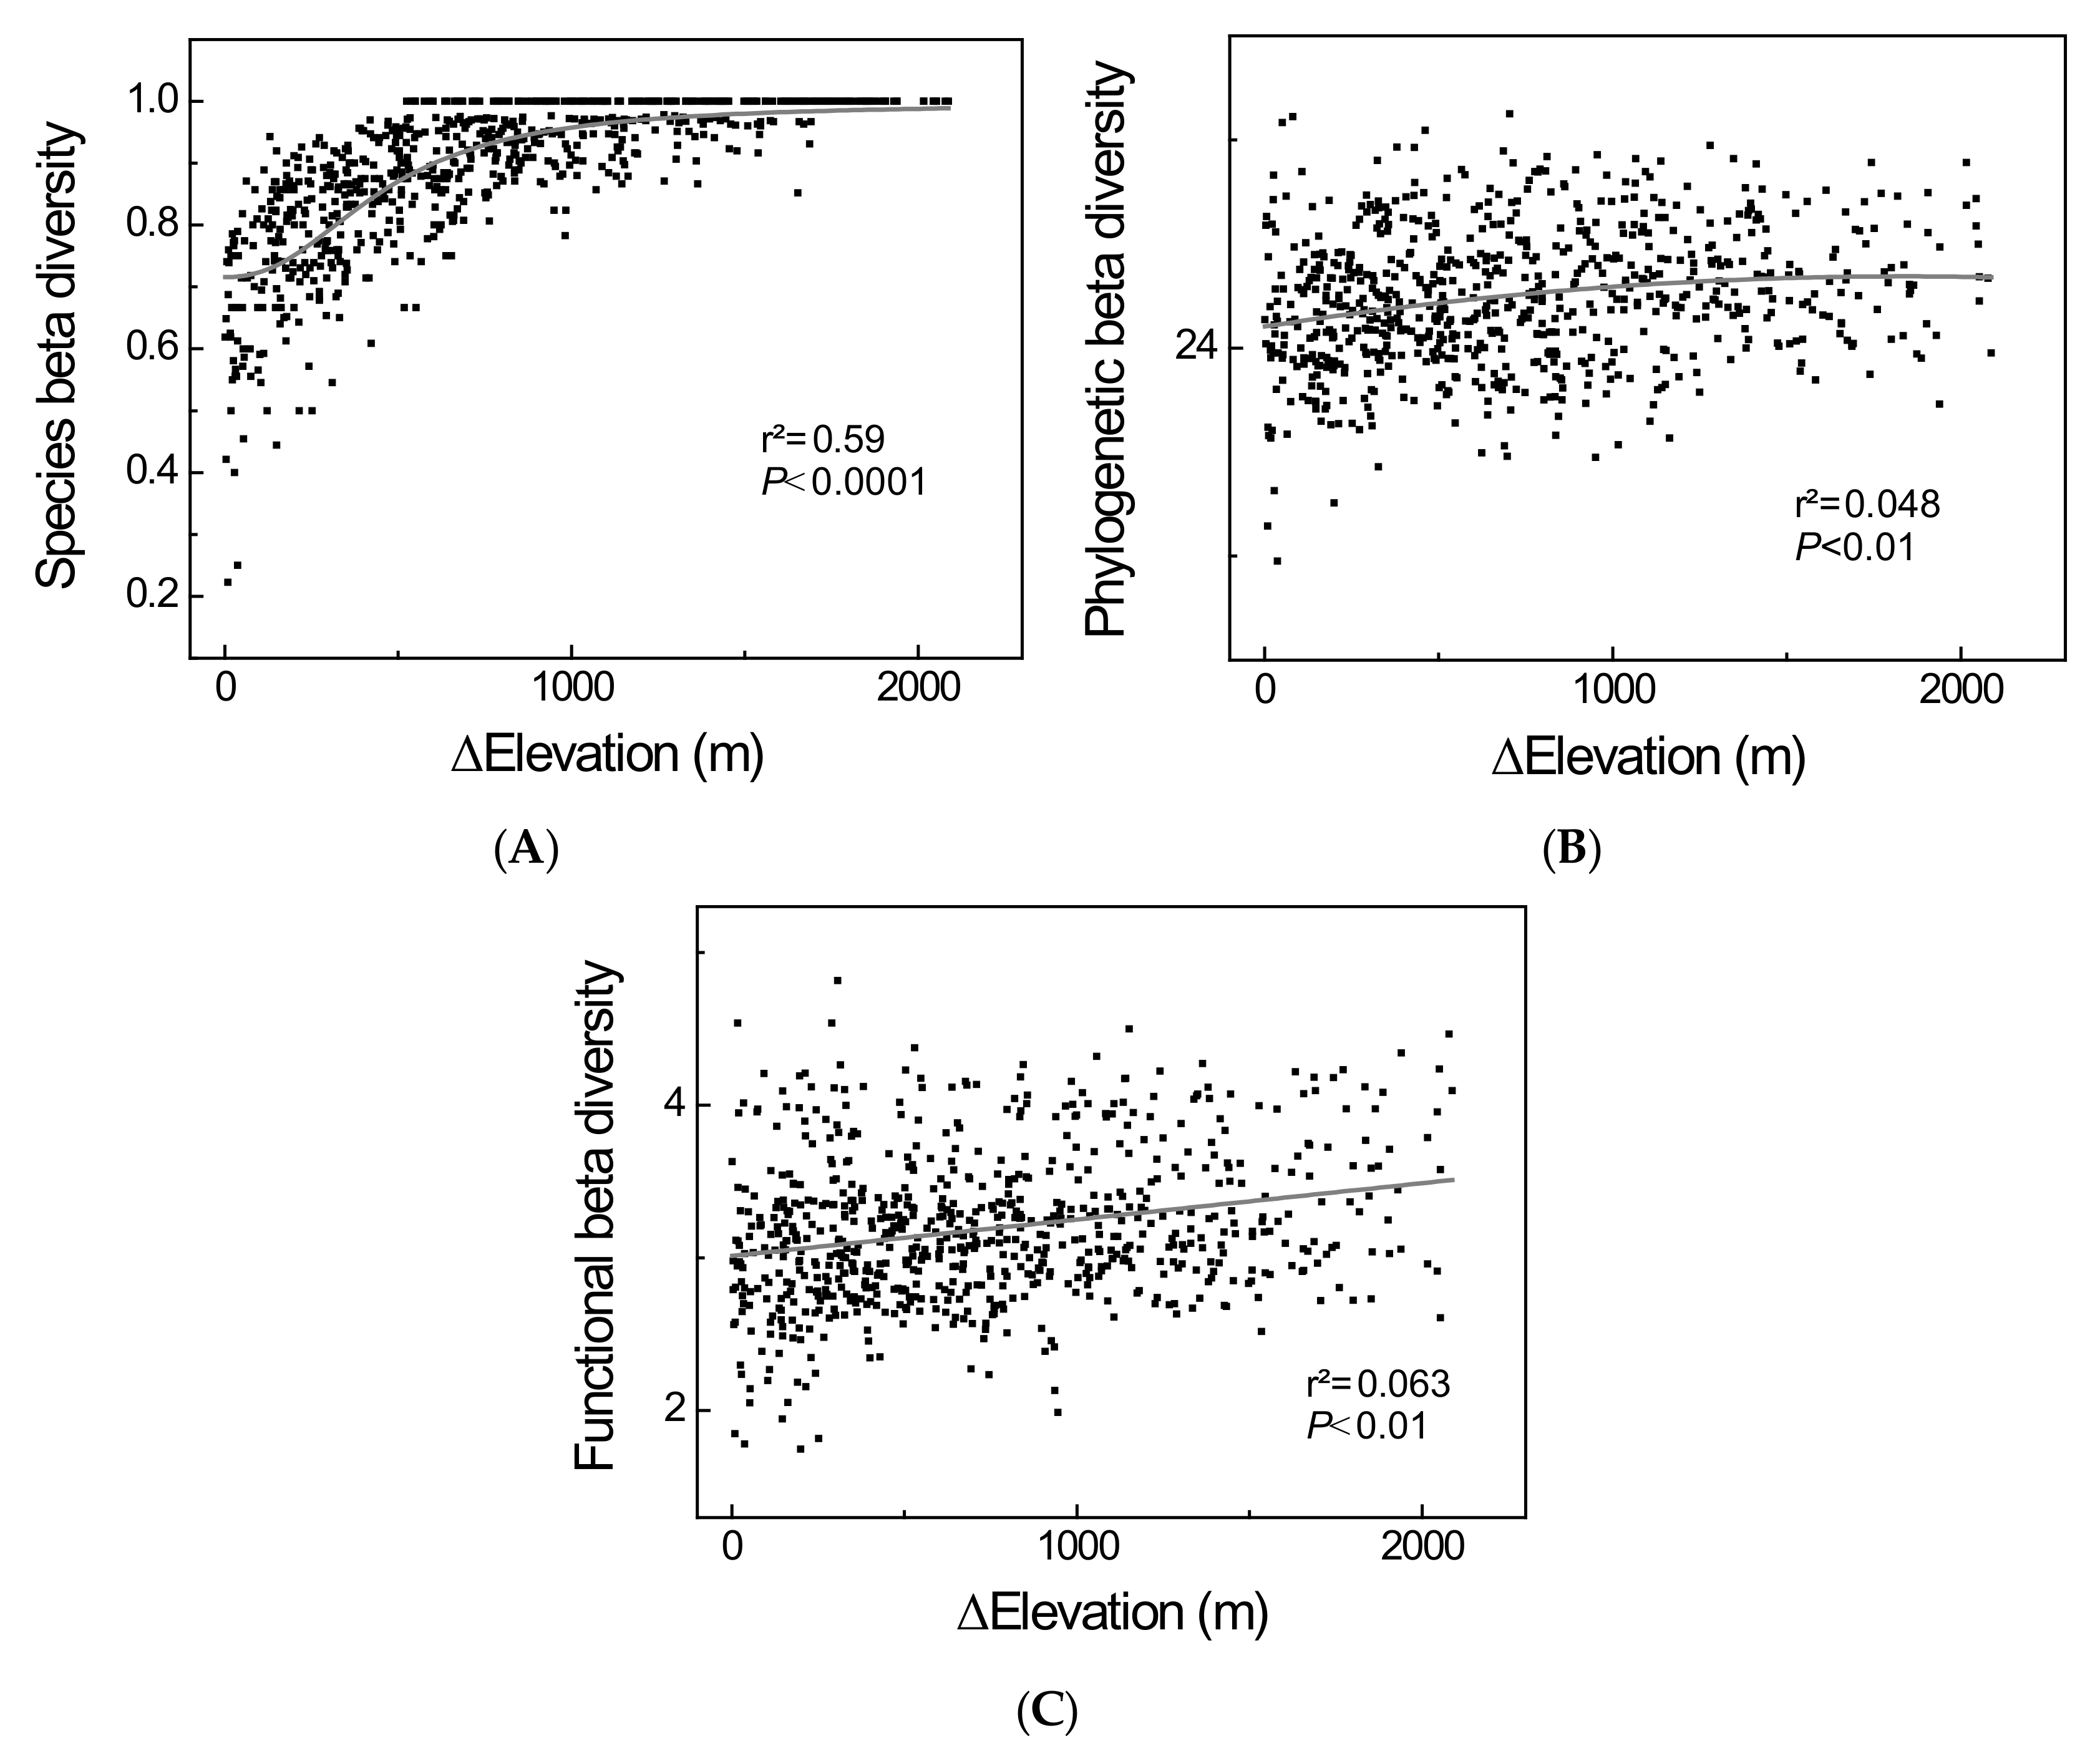
3.2. β-Diversity
3.3. Relationships between Taxonomic, Phylogenetic, and Functional Diversities
4. Discussion
Author Contributions
Funding
Acknowledgments
Conflicts of Interest
References
- Safi, K.; Cianciaruso, M.V.; Loyola, R.D.; Brito, D.; Armour-Marshall, K.; Diniz-Filho, J.A.F. Understanding global patterns of mammalian functional and phylogenetic diversity. Philos. Trans. R. Soc. B Biol. Sci. 2011, 366, 2536–2544. [Google Scholar] [CrossRef] [PubMed]
- Cadotte, M.W.; Jonathan Davies, T.; Regetz, J.; Kembel, S.W.; Cleland, E.; Oakley, T.H. Phylogenetic diversity metrics for ecological communities: Integrating species richness, abundance and evolutionary history. Ecol. Lett. 2010, 13, 96–105. [Google Scholar] [CrossRef] [PubMed]
- Swenson, N.G.; Enquist, B.J.; Thompson, J.; Zimmerman, J.K. The influence of spatial and size scale on phylogenetic relatedness in tropical forest communities. Ecology 2007, 88, 1770–1780. [Google Scholar] [CrossRef] [PubMed] [Green Version]
- Bryant, J.A.; Lamanna, C.; Morlon, H.; Kerkhoff, A.J.; Enquist, B.J.; Green, J.L. Microbes on mountainsides: Contrasting elevational patterns of bacterial and plant diversity. Proc. Natl. Acad. Sci. USA 2008, 105 (Suppl. 1), 11505–11511. [Google Scholar] [CrossRef] [PubMed] [Green Version]
- Cornwell, W.K.; Ackerly, D.D. Community assembly and shifts in plant trait distributions across an environmental gradient in coastal California. Ecol. Monogr. 2009, 79, 109–126. [Google Scholar] [CrossRef] [Green Version]
- Stagnol, D.; Bacouillard, L.; Davoult, D. Relationships between taxonomic and functional diversity: Insights into assembly processes. PeerJ PrePrints 2016, e1646v1. [Google Scholar] [CrossRef]
- Kraft, N.J.; Comita, L.S.; Chase, J.M.; Sanders, N.J.; Swenson, N.G.; Crist, T.O.; Cornell, H.V. Disentangling the drivers of β diversity along latitudinal and elevational gradients. Science 2011, 333, 1755–1758. [Google Scholar] [CrossRef] [Green Version]
- Meynard, C.N.; Devictor, V.; Mouillot, D.; Thuiller, W.; Jiguet, F.; Mouquet, N. Beyond taxonomic diversity patterns: How do α, β and γ components of bird functional and phylogenetic diversity respond to environmental gradients across France? Glob. Ecol. Biogeogr. 2011, 20, 893–903. [Google Scholar] [CrossRef]
- Langenheder, S.; Berga, M.; Östman, Ö.; Székely, A.J. Temporal variation of β-diversity and assembly mechanisms in a bacterial metacommunity. ISME J. 2012, 6, 1107–1114. [Google Scholar] [CrossRef] [Green Version]
- Graham, C.H.; Fine, P.V. Phylogenetic beta diversity: Linking ecological and evolutionary processes across space in time. Ecol. Lett. 2008, 11, 1265–1277. [Google Scholar] [CrossRef]
- Flynn, D.F.; Mirotchnick, N.; Jain, M.; Palmer, M.I.; Naeem, S. Functional and phylogenetic diversity as predictors of biodiversity–ecosystem-function relationships. Ecology 2011, 92, 1573–1581. [Google Scholar] [CrossRef] [PubMed] [Green Version]
- Mouchet, M.A.; Villéger, S.; Mason, N.W.; Mouillot, D. Functional diversity measures: An overview of their redundancy and their ability to discriminate community assembly rules. Funct. Ecol. 2010, 24, 867–876. [Google Scholar] [CrossRef]
- Cadotte, M.W.; Dinnage, R.; Tilman, D. Phylogenetic diversity promotes ecosystem stability. Ecology 2012, 93, S223–S233. [Google Scholar] [CrossRef] [Green Version]
- Vane-Wright, R.I.; Humphries, C.J.; Williams, P.H. What to protect?—Systematics and the agony of choice. Biol. Conserv. 1991, 55, 235–254. [Google Scholar] [CrossRef]
- Cavender-Bares, J.; Kozak, K.H.; Fine, P.V.; Kembel, S.W. The merging of community ecology and phylogenetic biology. Ecol. Lett. 2009, 12, 693–715. [Google Scholar] [CrossRef]
- Webb, C.O.; Ackerly, D.D.; McPeek, M.A.; Donoghue, M.J. Phylogenies and community ecology. Ann. Rev. Ecol. Syst. 2002, 33, 475–505. [Google Scholar] [CrossRef] [Green Version]
- Faith, D.P. Conservation evaluation and phylogenetic diversity. Biol. Conserv. 1991, 61, 1–10. [Google Scholar] [CrossRef]
- Petchey, O.L.; Gaston, K.J. Functional diversity: Back to basics and looking forward. Ecol. Lett. 2006, 9, 741–758. [Google Scholar] [CrossRef]
- Petchey, O.L.; Evans, K.L.; Fishburn, I.S.; Gaston, K.J. Low functional diversity and no redundancy in British avian assemblages. J. Anim. Ecol. 2007, 76, 977–985. [Google Scholar] [CrossRef]
- Pavoine, S.; Bonsall, M.B. Measuring biodiversity to explain community assembly: A unified approach. Biol. Rev. Camb. Philos. Soc. 2011, 86, 792–812. [Google Scholar] [CrossRef]
- Gentry, A.H. Patterns of neotropical plant species diversity. In Evolutionary Biology; Hecht, M.K., Wallace, B., Prance, G.T., Eds.; Springer: Boston, MA, USA, 1982; pp. 1–84. [Google Scholar]
- Kraft, N.J.; Valencia, R.; Ackerly, D.D. Functional traits and niche-based tree community assembly in an Amazonian forest. Science 2008, 322, 580–582. [Google Scholar] [CrossRef] [PubMed] [Green Version]
- Gerhold, P.; Cahill, J.F.; Winter, M.; Bartish, I.V.; Prinzing, A. Phylogenetic patterns are not proxies of community assembly mechanisms (they are far better). Funct. Ecol. 2015, 29, 600–614. [Google Scholar] [CrossRef]
- Fu, H.; Zhong, J.; Yuan, G.; Guo, C.; Ding, H.; Feng, Q.; Fu, Q. A functional-trait approach reveals community diversity and assembly processes responses to flood disturbance in a subtropical wetland. Ecol. Res. 2015, 30, 57–66. [Google Scholar] [CrossRef]
- Cardinale, B.J.; Wright, J.P.; Cadotte, M.W.; Carroll, I.T.; Hector, A.; Srivastava, D.S.; Loreau, M.; Weis, J.J. Impacts of plant diversity on biomass production increase through time because of species complementarity. Proc. Natl. Acad. Sci. USA 2007, 104, 18123–18128. [Google Scholar] [CrossRef] [PubMed] [Green Version]
- Prinzing, A.; Reiffers, R.; Braakhekke, W.G.; Hennekens, S.M.; Tackenberg, O.; Ozinga, W.A.; Schaminée, J.H.J.; Van Groenendael, J.M. Less lineages–more trait variation: Phylogenetically clustered plant communities are functionally more diverse. Ecol. Lett. 2008, 11, 809–819. [Google Scholar] [CrossRef] [PubMed]
- Theodose, T.A.; Bowman, W.D. Nutrient availability, plant abundance, and species diversity in two alpine tundra communities. Ecology 1997, 78, 1861–1872. [Google Scholar] [CrossRef]
- McKane, R.B.; Johnson, L.C.; Shaver, G.R.; Nadelhoffer, K.J.; Rastetter, E.B.; Fry, B.; Murray, G. Resource-based niches provide a basis for plant species diversity and dominance in arctic tundra. Nature 2002, 415, 68–71. [Google Scholar] [CrossRef]
- Levine, J.M. Species diversity and biological invasions: Relating local process to community pattern. Science 2000, 288, 852–854. [Google Scholar] [CrossRef] [Green Version]
- Gering, J.C.; Crist, T.O.; Veech, J.A. Additive partitioning of species diversity across multiple spatial scales: Implications for regional conservation of biodiversity. Conserv. Biol. 2003, 17, 488–499. [Google Scholar] [CrossRef]
- Summerville, K.S.; Boulware, M.J.; Veech, J.A.; Crist, T.O. Spatial variation in species diversity and composition of forest Lepidoptera in eastern deciduous forests of North America. Conserv. Biol. 2003, 17, 1045–1057. [Google Scholar] [CrossRef]
- Duffy, J.E. Why biodiversity is important to the functioning of real-world ecosystems. Front. Ecol. Environ. 2009, 7, 437–444. [Google Scholar] [CrossRef] [Green Version]
- Xu, J.; Chen, Y.; Zhang, L.; Chai, Y.; Wang, M.; Guo, Y.; Li, T.; Yue, M. Using phylogeny and functional traits for assessing community assembly along environmental gradients: A deterministic process driven by elevation. Ecol. Evol. 2017, 7, 5056–5069. [Google Scholar] [CrossRef] [PubMed] [Green Version]
- Körner, C. Why are there global gradients in species richness? Mountains might hold the answer. Trends Ecol. Evol. 2000, 15, 513–514. [Google Scholar] [CrossRef]
- Tang, Z.Y.; Fang, J.Y. Patterns of woody plant species diversity along environmental gradients on Mt. Taibai, Qinling Mountains. Chin. Biodivers. 2004, 12, 115–122, (In Chinese with English Abstract). [Google Scholar]
- Zhu, Z.C. The regulation and characteristic of dominant type of forest in Taibai Mountain, Qinling Mountains. Shaanxi For. Sci. Technol. 1981, 5, 29–39. (In Chinese) [Google Scholar]
- Maire, E.; Grenouillet, G.; Brosse, S.; Villéger, S. How many dimensions are needed to accurately assess functional diversity? A pragmatic approach for assessing the quality of functional spaces. Glob. Ecol. Biogeogr. 2015, 24, 728–740. [Google Scholar] [CrossRef]
- Laughlin, D.C. The intrinsic dimensionality of plant traits and its relevance to community assembly. J. Ecol. 2014, 102, 186–193. [Google Scholar] [CrossRef]
- Yan, B.; Zhang, J.; Liu, Y.; Li, Z.; Huang, X.; Yang, W.; Prinzing, A. Trait assembly of woody plants in communities across sub-alpine gradients: Identifying the role of limiting similarity. J. Veg. Sci. 2012, 23, 698–708. [Google Scholar] [CrossRef]
- Wright, I.J.; Reich, P.B.; Westoby, M.; Ackerly, D.D.; Baruch, Z.; Bongers, F.; Cavender-Bares, J.; Chapin, T.; Cornelissen, J.H.; Diemer, M.; et al. The worldwide leaf economics spectrum. Nature 2004, 428, 821–827. [Google Scholar] [CrossRef]
- Reich, P.B. The world-wide ‘fast–slow’ plant economics spectrum: A traits manifesto. J. Ecol. 2014, 102, 275–301. [Google Scholar] [CrossRef]
- Cornelissen, J.; Lavorel, S.; Garnier, E.B.; Diaz, S.; Buchmann, N.; Gurvich, D.; Reich, P.; ter Steege, H.; Morgan, H.D.G.; Van der Heijden, M.; et al. Handbook of protocols for standardised and easy measurement of plant functional traits worldwide. Aust. J. Bot. 2003, 51, 335–380. [Google Scholar] [CrossRef] [Green Version]
- Ren, Y. Research and Management of Biodiversity in Taibai Mountain Reserve; China Forestry Publishing House: Beijing, China, 2006. (In Chinese) [Google Scholar]
- Kraft, N.J.; Cornwell, W.K.; Webb, C.O.; Ackerly, D.D. Trait evolution, community assembly, and the phylogenetic structure of ecological communities. Am. Nat. 2007, 170, 271–283. [Google Scholar] [CrossRef] [PubMed]
- Webb, C.O.; Ackerly, D.D.; Kembel, S.W. Phylocom: Software for the analysis of phylogenetic community structure and trait evolution. Bioinformatics 2008, 24, 2098–2100. [Google Scholar] [CrossRef] [PubMed] [Green Version]
- Vellend, M. Do commonly used indices of β-diversity measure species turnover? J. Veg. Sci. 2001, 12, 545–552. [Google Scholar] [CrossRef]
- Webb, C.O. Exploring the phylogenetic structure of ecological communities: An example for rain forest trees. Am. Nat. 2000, 156, 145–155. [Google Scholar] [CrossRef]
- Xu, J.; Chai, Y.; Wang, M.; Dang, H.; Guo, Y.; Chen, Y.; Zhang, C.; Li, T.; Zhang, L.; Yue, M. Shifts in Plant Community Assembly Processes across Growth Forms along a Habitat Severity Gradient: A Test of the Plant Functional Trait Approach. Front. Plant Sci. 2018, 9, 180. [Google Scholar] [CrossRef]
- Vile, D.; Shipley, B.; Garnier, E. Ecosystem productivity can be predicted from potential relative growth rate and species abundance. Ecol. Lett. 2006, 9, 1061–1067. [Google Scholar] [CrossRef]
- Cingolani, A.M.; Cabido, M.; Gurvich, D.E.; Renison, D.; Díaz, S. Filtering processes in the assembly of plant communities: Are species presence and abundance driven by the same traits? J. Veg. Sci. 2007, 18, 911–920. [Google Scholar] [CrossRef]
- Mason, N.W.H.; MacGillivray, K.; Steel, J.B.; Wilson, J.B. An index of functional diversity. J. Veg. Sci. 2003, 14, 571–578. [Google Scholar] [CrossRef]
- Mason, N.W.H.; Mouillot, D.; Lee, W.G.; Wilson, J.B. Functional richness, functional evenness and functional divergence: The primary components of functional diversity. Oikos 2005, 111, 112–118. [Google Scholar] [CrossRef]
- Legendre, P.; Legendre, L. Chapter 7—Ecological resemblance. In Developments in Environmental Modelling; Elsevier: Amsterdam, The Netherlands, 1998; pp. 265–335. [Google Scholar]
- Lichstein, J.W. Multiple regression on distance matrices: A multivariate spatial analysis tool. Plant Ecol. 2007, 188, 117–131. [Google Scholar] [CrossRef]
- Swenson, N.G. Functional and Phylogenetic Ecology in R; Springer: New York, NY, USA, 2014. [Google Scholar]
- Forest, F.; Grenyer, R.; Rouget, M.; Davies, T.J.; Cowling, R.M.; Faith, D.P.; Balmford, A.; Manning, J.C.; Procheş, S.; van der Bank, M.; et al. Preserving the evolutionary potential of floras in biodiversity hotspots. Nature 2007, 445, 757–760. [Google Scholar] [CrossRef] [PubMed]
- Faith, D.P. Threatened species and the potential loss of phylogenetic diversity: Conservation scenarios based on estimated extinction probabilities and phylogenetic risk analysis. Conserv. Biol. 2008, 22, 1461–1470. [Google Scholar] [CrossRef] [PubMed]
- Butterfield, B.J.; Cavieres, L.A.; Callaway, R.M.; Cook, B.J.; Kikvidze, Z.; Lortie, C.J.; Michalet, R.; Pugnaire, F.I.; Schöb, C.; Xiao, S.; et al. Alpine cushion plants inhibit the loss of phylogenetic diversity in severe environments. Ecol. Lett. 2013, 16, 478–486. [Google Scholar] [CrossRef] [PubMed]
- Schöb, C.; Butterfield, B.J.; Pugnaire, F.I. Foundation species influence trait-based community assembly. New Phytol. 2012, 196, 824–834. [Google Scholar] [CrossRef]
- Zhang, W.; Huang, D.; Wang, R.; Liu, J.; Du, N. Altitudinal patterns of species diversity and phylogenetic diversity across Temperate Mountain forests of northern China. PLoS ONE 2016, 11, e0159995. [Google Scholar] [CrossRef] [Green Version]
- Gentry, A.H. Changes in plant community diversity and floristic composition on environmental and geographical gradients. Ann. Mo. Bot. Gard. 1988, 75, 1–34. [Google Scholar] [CrossRef]
- Körner, C. The use of ‘altitude’in ecological research. Trends Ecol. Evol. 2007, 22, 569–574. [Google Scholar] [CrossRef]
- Devictor, V.; Mouillot, D.; Meynard, C.; Jiguet, F.; Thuiller, W.; Mouquet, N. Spatial mismatch and congruence between taxonomic, phylogenetic and functional diversity: The need for integrative conservation strategies in a changing world. Ecol. Lett. 2010, 13, 1030–1040. [Google Scholar] [CrossRef]
- Cadotte, M.W.; Cavender-Bares, J.; Tilman, D.; Oakley, T.H. Using phylogenetic, functional and trait diversity to understand patterns of plant community productivity. PLoS ONE 2009, 4, e5695. [Google Scholar] [CrossRef]
- Petchey, O.L.; Gaston, K.G. Dendrograms and measures of functional diversity: A second instalment. Oikos 2009, 118, 1118–1120. [Google Scholar] [CrossRef]
- Griffin, J.N.; Méndez, V.; Johnson, A.F.; Jenkins, S.R.; Foggo, A. Functional diversity predicts overyielding effect of species combination on primary productivity. Oikos 2009, 118, 37–44. [Google Scholar] [CrossRef]
- Tilman, D. Resource Competition and Community Structure; Monographs in Population Biology; Princeton University Press: Princeton, NJ, USA, 1982. [Google Scholar]
- Futuyma, D.J. Evolutionary constraint and ecological consequences. Evolution 2010, 64, 1865–1884. [Google Scholar] [CrossRef] [PubMed]
- Wiens, J.J.; Ackerly, D.D.; Allen, A.P.; Anacker, B.L.; Buckley, L.B.; Cornell, H.V.; Hawkins, B.A. Niche conservatism as an emerging principle in ecology and conservation biology. Ecol. Lett. 2010, 13, 1310–1324. [Google Scholar] [CrossRef] [PubMed]
- Schweiger, O.; Klotz, S.; Durka, W.; Kühn, I. A comparative test of phylogenetic diversity indices. Oecologia 2008, 157, 485–495. [Google Scholar] [CrossRef]


| Shannon-Wiener | Species Richness | Phylogenetic Diversity | |
|---|---|---|---|
| Species richness | 0.839 ** | ||
| Phylogenetic diversity | 0.779 ** | 0.933 ** | |
| Functional diversity | 0.620 ** | 0.471 ** | 0.571 ** |
| Phylogenetic Diversity | Functional Diversity | |
|---|---|---|
| Functional diversity | −0.050 | |
| Taxonomic diversity | 0.289 ** | 0.196 * |
© 2019 by the authors. Licensee MDPI, Basel, Switzerland. This article is an open access article distributed under the terms and conditions of the Creative Commons Attribution (CC BY) license (http://creativecommons.org/licenses/by/4.0/).
Share and Cite
Xu, J.; Dang, H.; Wang, M.; Chai, Y.; Guo, Y.; Chen, Y.; Zhang, C.; Yue, M. Is Phylogeny More Useful than Functional Traits for Assessing Diversity Patterns Under Community Assembly Processes? Forests 2019, 10, 1159. https://doi.org/10.3390/f10121159
Xu J, Dang H, Wang M, Chai Y, Guo Y, Chen Y, Zhang C, Yue M. Is Phylogeny More Useful than Functional Traits for Assessing Diversity Patterns Under Community Assembly Processes? Forests. 2019; 10(12):1159. https://doi.org/10.3390/f10121159
Chicago/Turabian StyleXu, Jinshi, Han Dang, Mao Wang, Yongfu Chai, Yaoxin Guo, Yu Chen, Chenguang Zhang, and Ming Yue. 2019. "Is Phylogeny More Useful than Functional Traits for Assessing Diversity Patterns Under Community Assembly Processes?" Forests 10, no. 12: 1159. https://doi.org/10.3390/f10121159