Article

Linkages between Phosphorus and Plant Diversity in Central European Forest Ecosystems—Complementarity or Competition?

1
Department of Ecology, Ecosystem Science/Plant Ecology, Technische Universität Berlin, Rothenburgstraße 12, 12165 Berlin, Germany
2
Berlin-Brandenburg Institute of Advanced Biodiversity Research (BBIB), 14195 Berlin, Germany
3
Thünen-Institute of Forest Ecosystems, Alfred-Möller-Str. 1, 16225 Eberswalde, Germany
4
Faculty of Agriculture/Environment/Chemistry, Landscape Development/Vegetation Technology, University of Applied Science Dresden, Pillnitzer Platz 2, 01326 Dresden, Germany
*
Author to whom correspondence should be addressed.
Forests 2019, 10(12), 1156; https://doi.org/10.3390/f10121156
Submission received: 26 November 2019 / Revised: 9 December 2019 / Accepted: 14 December 2019 / Published: 17 December 2019
(This article belongs to the Section Forest Ecology and Management)

Abstract

:
The phosphorus nutrition status of European forests has decreased significantly in recent decades. For a deeper understanding of complementarity and competition in terms of P acquisition in temperate forests, we have analyzed α-diversity, organic layer and mineral soil P, P nutrition status, and different concepts of P use efficiency (PUE) in Fagus sylvatica L. (European beech) and Picea abies (L.) H. Karst. (Norway spruce). Using a subset of the Second National Soil Survey in Germany, we correlated available data on P in the organic layer and soil with α-diversity indices for beech and spruce forests overall and for individual vegetation layers (tree, shrub, herb, and moss layers). Moreover, we investigated α-diversity feedbacks on P nutrition status and PUE of both tree species. The overall diversity of both forest ecosystems was largely positively related to P content in the organic layer and soil, but there were differences among the vegetation layers. Diversity in the tree layer of both forest ecosystems was negatively related to the organic layer and soil P. By contrast, shrub diversity showed no correlation to P, while herb layer diversity was negatively related to P in the organic layer but positively to P in soil. A higher tree layer diversity was slightly related to increased P recycling efficiency (PPlant/Porganic layer) in European beech and P uptake efficiency (PPlant/Psoil) in Norway spruce. The diversity in the herb layer was negatively related to P recycling and uptake efficiency in European beech and slightly related to P uptake efficiency in Norway spruce. In spruce forests, overall and herb species richness led to significantly improved tree nutrition status. Our results confirm significant, non-universal relationships between P and diversity in temperate forests with variations among forest ecosystems, vegetation layers, and P in the organic layer or soil. In particular, tree species diversity may enhance complementarity and hence also P nutrition of dominant forest trees through higher PUE, whereas moss and herb layers seemed to show competitive relationships among each other in nutrient cycling.

1. Introduction

As phosphorus is an essential nutrient (e.g., [1,2]), plants and plant communities must adapt when facing P limitations. Responses of plants to limited P in soils include increases in the root system (biomass, lateral roots, root turnover, and root hairs) and P transporter proteins [3] or in P use efficiency (PUE; [4,5,6]), as well as decreases in leaf area index and P content of leaves [7]. In locations with extreme P limitations, as in parts of Australia, Chile, or the Cape region, some plant species form high-surface root clusters which additionally secrete acid phosphates to mobilize P and other micronutrients [3,8].
Different responses of plants to P in soil can translate to changes in biodiversity patterns [6,9,10]. Complementarity among plants generates a positive biodiversity effect on nutrient acquisition of the entire plant assemblage. For example, nutrient limitation often promotes a heterogeneous distribution of nutrients along with greater niche dimensionality [11]. Greater niche dimensionality in turn suggests a higher number of species with complementary traits and thus a more efficient use of nutrients which at the same time reduces competition for resource supplies between plant species [12,13,14,15]. In contrast, competitive exclusion is expected to be the main force responsible for reducing plant diversity as resource availability increases aboveground and belowground [16,17,18,19,20].
An increase in species or functional diversity has been proposed to be a result of low P availability in soil, as species may be complementary in terms of resource acquisition traits, which allows the exploitation of P pools at different soil depths [13,21,22]. A heterogeneous distribution of P in P-deficient ecosystems may also relate to increased beta-diversity [6] and structural diversity (e.g., in mangroves [4] and in liana species [10]). Hence, many ecosystems show higher biodiversity with decreasing soil P. However, such relationships have mainly been reported for strongly P-limited tropical and subtropical forest ecosystems (e.g., lowland forests [6,23], mountain forests [24], tropical dry forests [25,26], volcanic islands [27], Mediterranean forests [28,29], and grasslands, e.g., [30,31]). Interestingly, pronounced positive relationships between biomass and P availability have exclusively been detected in species-poor forests [7,32]. This again indicates that P limitations can be compensated for by high species richness [33,34,35,36].
In contrast to tropical forests, linkages between biodiversity and soil P in temperate forests have received much less attention, presumably because P is usually not expected to be significantly limited in temperate regions. In these regions, however, P may be present but not necessarily available for plant roots. Under acidic conditions, P is strongly bound to aluminum or iron oxides, and to calcium ions under alkaline soil conditions [2], resulting in reduced plant growth (e.g., [37]). P is also unavailable to plants when it forms compounds with organic substances such as phytinic acid. In this case, it may be more easily leached than inorganic P and thus removed from the rhizosphere [1]. Several studies have indicated a rather low P nutrition status and decreasing foliar P concentrations of Fagus sylvatica L. (European beech) [38] and Picea abies (L.) H. Karst. (Norway spruce) which have been attributed to harvesting, increased atmospheric N deposition during recent decades in Europe [39,40], P leakage into groundwater and surface water [2], and P immobilization owing to soil acidification and liming [38,41]. Thus, there are some arguments that P limitation might be an important and underestimated factor in biodiversity patterns and the PUE of trees in temperate forest ecosystems.
There is also support for this hypothesis from temperate grasslands. High P availability together with a high nitrogen supply leads to a significant decrease in plant diversity in temperate regions [42,43,44]; this is also true irrespective of atmospheric nitrogen deposition and soil acidity [31]. In particular, endangered plant species are known to persist under P-limited conditions, which suggests that P enrichment is one relevant cause of species loss [45]. On the other hand, high plant species richness allows higher P exploitation by plant communities [30,46].
Most of these findings in temperate ecosystems come from studies on grasslands (e.g., [30,31]). Studies on temperate forests are much less comprehensive and usually focus on single ecosystem components such as litter [47,48,49], or endomycorrhizal (e.g., [50]) and ectomycorrhizal fungi (e.g., [51]). A study on overall species composition in German forests indicates a relationship to P in the organic layer and topsoil [52]. Another study from warm temperate Chinese forests taking different vegetation layers into account found a higher tree diversity and a lower herb diversity with increasing P availability [53]. Still, it remains an open question whether these results generally hold for temperate forests and whether there are relationships among P nutrition, the PUE of forest trees, and diversity in different vegetation layers.
In this study, we conducted a large-scale analysis based on the second German National Forest Soil Inventory [38,41]. Our general objective was to reveal basic relationships between α-diversity of two major European forest ecosystems—dominated by either European beech or Norway spruce—with P in the organic layer and mineral soil and with PUE. We studied these relationships to reveal signs for complementarity or competition both for the total vegetation and for individual vegetation layers. Specifically, we hypothesized that (1) overall α-diversity (species richness, Shannon and Simpson indices, and evenness) is negatively related to P in the organic layer and mineral soil, that (2) relationships between α-diversity and P differ among vegetation layers (tree, shrub, herb, and moss layers), and that (3) P nutrition and PUE of European beech and Norway spruce increase with the α-diversity of forest ecosystems.

2. Materials and Methods

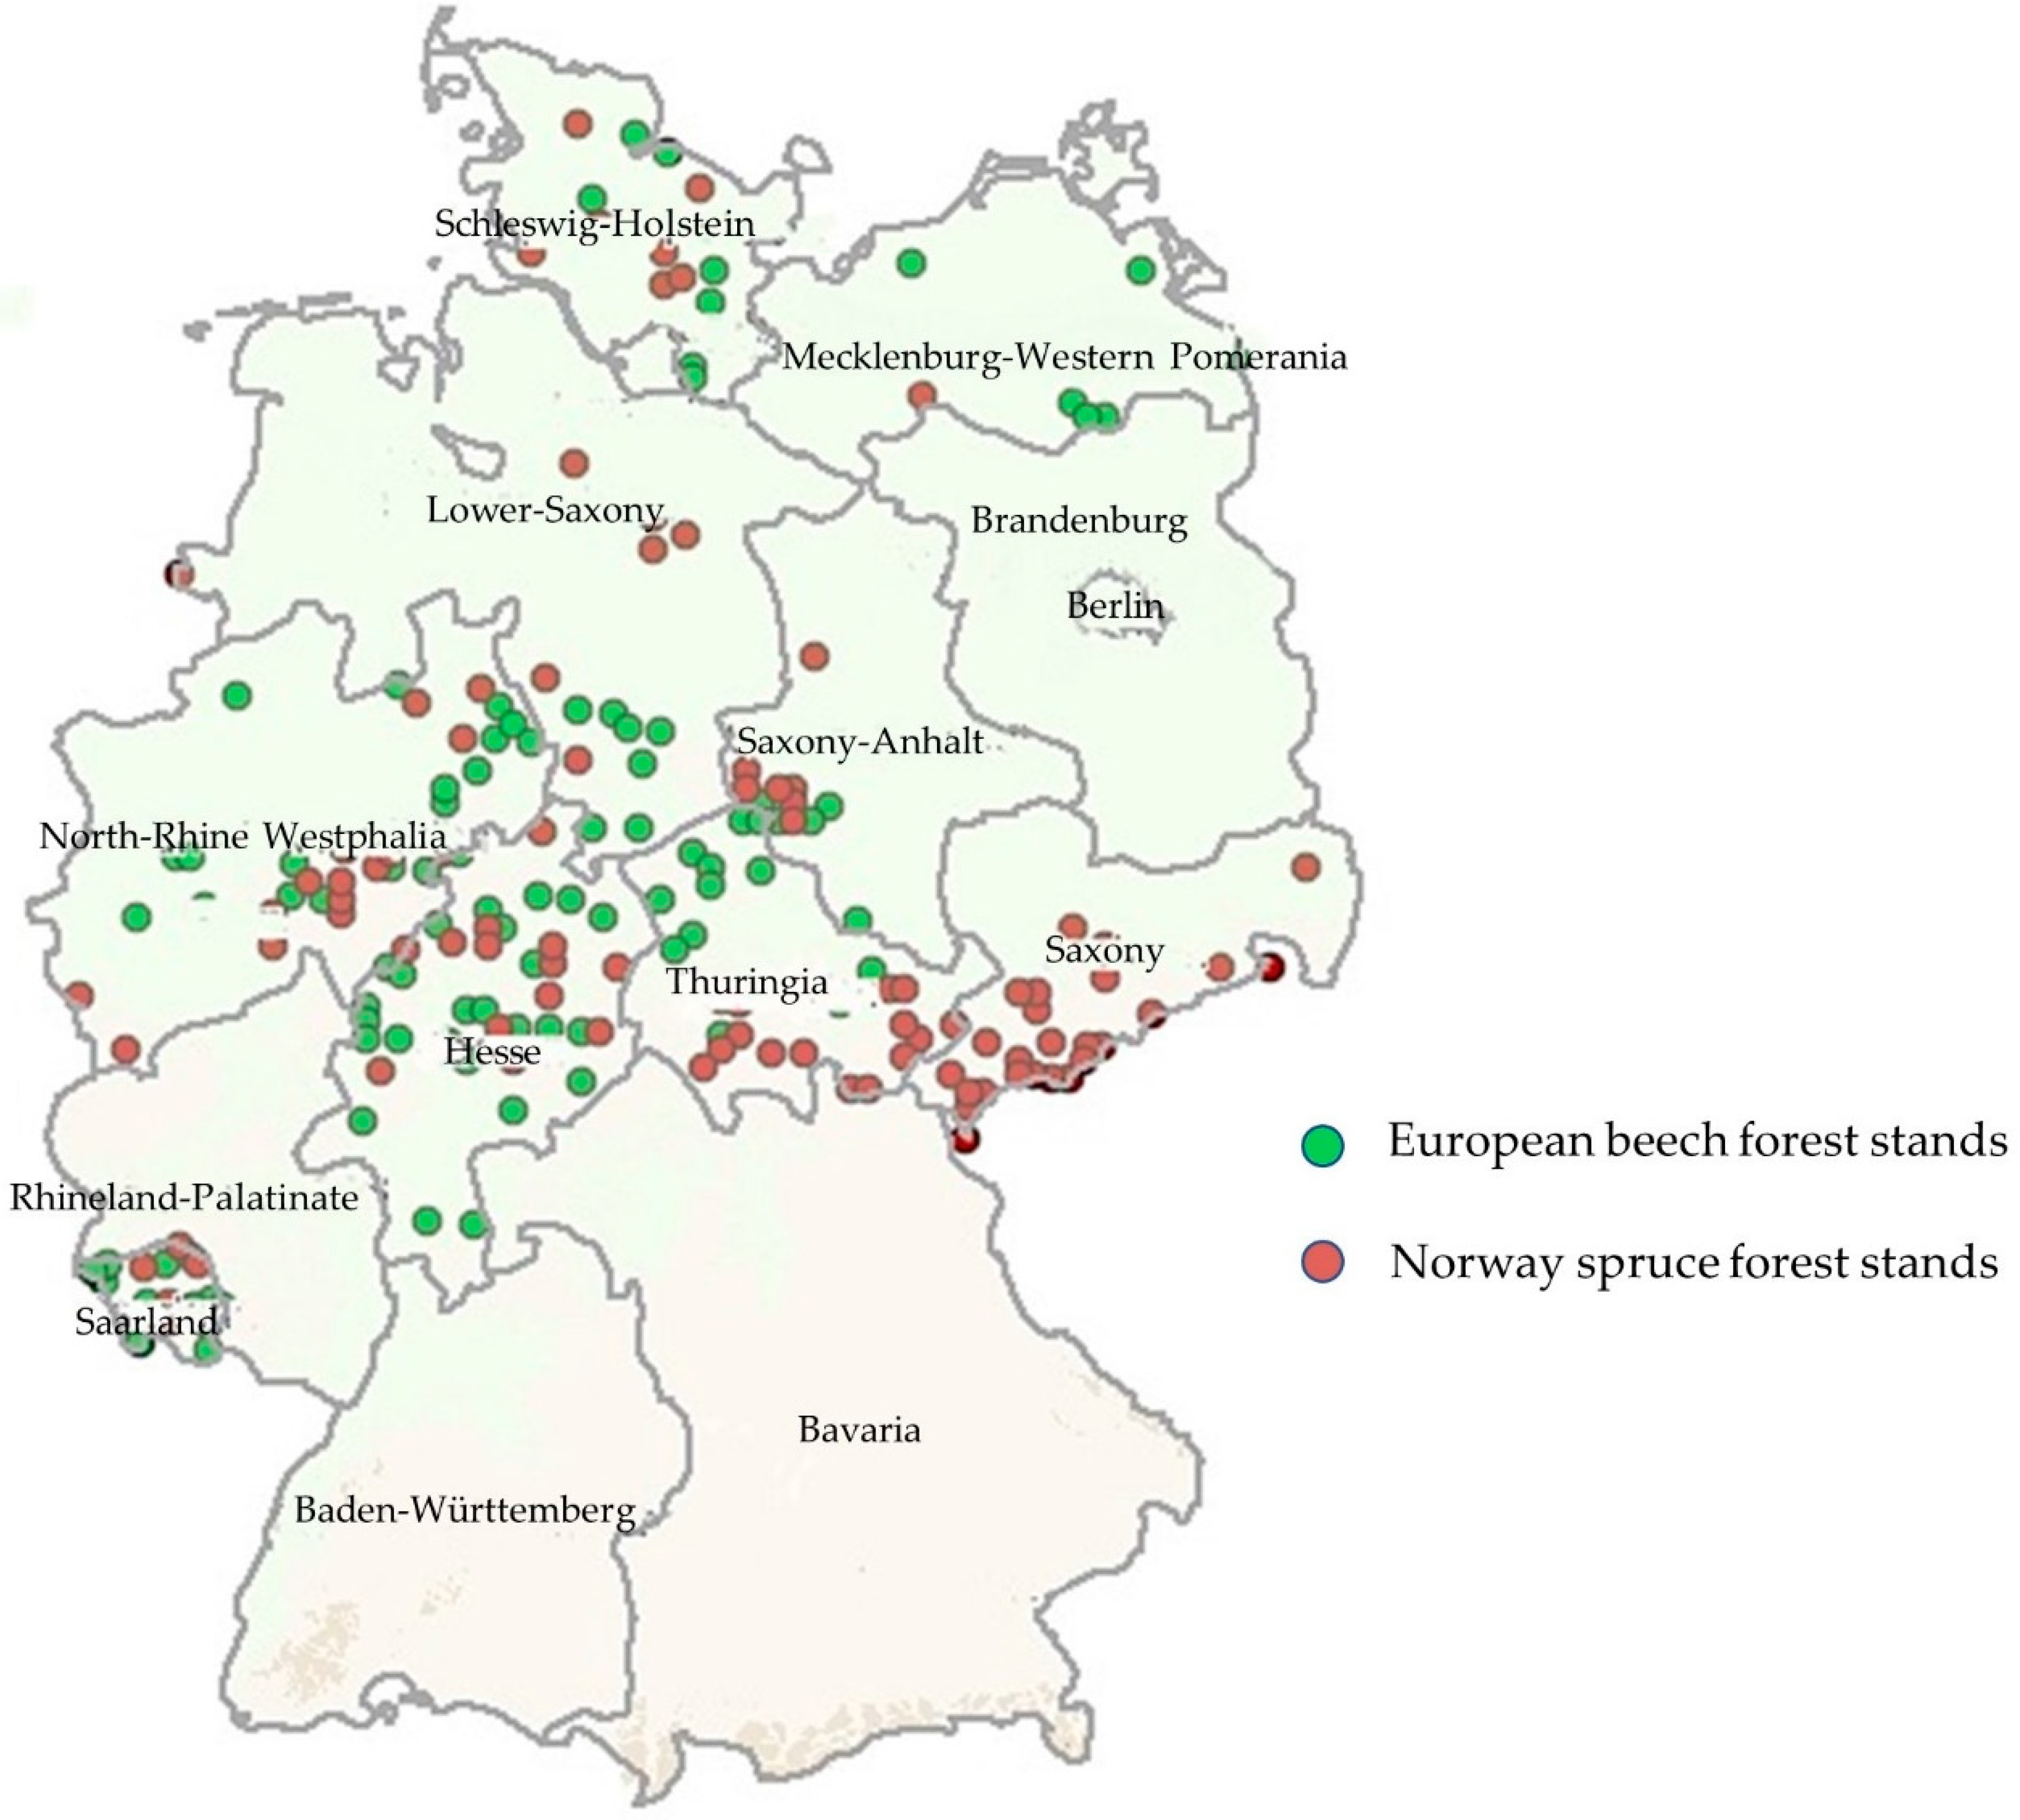
2.1. Study Area and Data Sources

Our data analysis was based on the second German National Forest Soil Inventory (NFSI II; [38,41]), which was carried out from 2006 to 2008. In comparison to the first inventory (NFSI I, 1987–1994), in which only soil conditions were surveyed, vegetation analysis was included in NFSI II. From the total forest stand pool, which included 235 stands of European beech forests and 342 Norway spruce forests, we chose study plots that met three criteria: (i) cover of ≥70% of either European beech or Norway spruce in the tree layer, (ii) data on plant species assemblages sampled in 20 × 20 m (400 m2) quadrats, and (iii) sampled stands had not been limed. Lime is applied to some forest stands in Germany to counteract soil acidification and associated nutrient immobilization. With our criteria, we aimed to ensure comparability of data and derived biodiversity indices among sites and to exclude a modified P availability in soil due to liming.
In total, 101 forest stands of European beech and 99 of Norway spruce met the selection criteria and were used for further analysis. The stands were located in middle and northern Germany between 54°35′16.8″ N and 49°10′50.6″ N (maximum north–south elongation) and between 6°14′21.0″ E and 14°39′28.6″ E (maximum west–east elongation). The beech forests were mainly found in Hesse, northwest Thuringia, southern Lower Saxony, and Saarland; the spruce forests prevailed in the mountain ranges of Harz, southeast Thuringia, and Saxony (Figure 1). In beech stands, the tree layer composition is in accordance with natural conditions while spruce stands stock mainly on natural beech sites.
The mean altitude of the beech forest stands was slightly lower than that of the spruce forests (Table 1). As precipitation and temperature were not directly measured for each study plot, we interpolated both parameters from climate stations using the geostatistical method of ordinary kriging for precipitation and regression kriging for temperature [54]. The mean annual rainfall range was similar in both forest types, but given the lower altitude of beech forest stands, the mean annual temperature was slightly higher in beech than in spruce forests. The mean pH (CaCl2) of the mineral soil in both forest types was acidic, with lower values in spruce forests than in beech forests. By contrast, the mean soil depth was lower in beech forests compared to spruce forests. Many soil types were present; notably, seven beech forests were located on Rendzic Leptosols, indicating limestone as the parent material (Table 1).

2.2. Organic Layer, Mineral Soil, and Foliar Sampling

The NFSI I was carried out according to a common sample plot protocol [55] based on the German manual of soil mapping [56]. Soils in the NFSI I grid plots were sampled at eight satellite points around a central soil profile. These points were located 10 m from the central profile in cardinal and inter-cardinal directions. To avoid disturbances from previous sampling, NFSI II sampling points were shifted by 9 degrees from the NFSI I positions. The central soil profile in each plot was used to determine soil horizons and to classify soil types according to the manual for soil sampling. The entire organic layer (including branches and cones) was collected with metal frames, combined into one mixed sample for the plot, and subsequently partitioned into a fine and a coarse fraction set at a diameter of >20 mm. The mineral soil was sampled at fixed depth increments of 0–5, 5–10, 10–30, 30–60, and 60–90 cm. Fixed volume samples were taken at the eight satellite points and mixed within depth increments, which allowed fine earth stocks and bulk densities to be estimated based on the dry weight of fine and coarse soil fractions. Total P concentrations were measured in aqua regia extracts for the organic layer and for the soil depths 0–5 and 5–10 cm. Details regarding soil sampling and analytical methods can be found in [38,41,55,57,58,59].
Within a 30 m circle around the NFSI II plot, at least three (co)-dominant and healthy European beech and Norway spruce trees were selected for foliar P analysis. Leaves and needles were sampled as entire shoots from the upper third of the sun-exposed crown. Shoots were transferred to plastic or paper bags and stored at <4 °C until examination in the laboratory. After drying, leaves were separated from shoots and samples from the three trees were combined into one composite sample. Samples were prepared (HNO3 microwave digestion) and P concentrations were measured (using, e.g., ICP, ICP-MS, and AAS) according to the recommended pre-treatment and analysis given in the ICP Forest manual (for more details, see [38,41,55,59,60]). The entire NFSI data set used in this study is available online at https://link.springer.com/book/10.1007/978-3-030-15734-0 [61] and at https://www.thuenen.de/de/wo/arbeitsbereiche/waldmonitoring/bodenzustandserhebung/.

2.3. Alpha-Diversity Indices

Ground vegetation on NFSI plots was recorded on 400 m2 plots which were located within a 30 m circle around the permanently marked and geo-referenced NFSI plot center, while avoiding major heterogeneities. Distance and direction of the vegetation sample area to the plot center as well as presence and cover of all visible vascular plant species and bryophytes were recorded.
Biodiversity was assessed for the entire vegetation and for each vegetation layer (i.e., tree layer, shrub layer, herb layer, and moss (bryophyte) layer). Because detailed data on species cover in the moss layer were missing for Hesse and Lower Saxony, diversity indices of the moss layer were calculated for only 33 European beech and 66 Norway spruce study plots. For each sampled forest stand, we calculated the total number of species (species richness S) and the total species cover in percent as the sum across each vegetation layer. Furthermore, species richness and species cover were recorded for each vegetation layer. For α-diversity, we further determined the Shannon diversity index (Hs) and the Gini-Simpson diversity index, which is less sensitive towards species richness than to abundance [62]. Calculation of both diversity indices was based on the cover of each species. The evenness was calculated as Heip’s index of evenness (EHeip). Statistical calculations on diversity indices were carried out using the packages “BiodiversityR”, “Rcmdr”, and “vegan” within R, version 3.1.2 [63]. The underlying equations implemented in BiodiversityR are given here.
Shannon diversity index:
H S = i = 1 S p i l n p i where p i = n i N
where
  • H s = Shannon diversity index: the degree of diversity in a finite forest stand
  • S = Number of different species
  • p i = Proportional cover (%) of the ith species
  • n i = Cover (%) of individuals in the ith species
  • N = Total cover (%) of individuals
Gini-Simpson diversity index:
1 D = 1 ( i = 1 S p i 2 ) where p i = n i N
where
  • 1 D = Complement Simpson diversity index, which captures the variance of the species cover distribution
  • S = Number of different species
  • p i = Proportional cover (%) of the ith species
  • n i = Cover (%) of individuals in the ith species
  • N = Total cover (%) of individuals
Heip’s index of evenness:
E H e i p = e H s S
where
  • E H e i p = Degree of evenness in species cover
  • e = Euler’s number: approximately equal to 2.71828
  • H s = Shannon diversity index: the degree of diversity in a finite forest stand
  • S = The number of different species

2.4. Phosphorus Use Efficiency Indices

Forest ecosystems occurring on P-rich and P-poor sites probably make use of different nutrition strategies. Acquiring forest ecosystems are assumed to meet their demand for P from weathering of bedrock or parent material with a high P availability in soil. By contrast, recycling forest ecosystems are forced to recycle P from aboveground plant residues—present in the organic layer—when mineral-bound P in soil is low [8]. An increase in the number of species or functional diversity, enabling access to different P pools at different soil depths, may be one way in which forest ecosystems respond to low P availability in soil. (e.g., [21,22]).
The efficiency of plants to access, uptake and use P sources can be expressed by classic PUE indicators based on the biomass produced/P uptake ratio (e.g., [6,64,65]), the ratio of annual litterfall mass to its annual P content [66], or, e.g., the ratio of nutrient concentrations in senesced and green leaves, which is known as the phosphorus resorption efficiency [67]. However, these indicators do not account for the source of P—the organic layer versus mineral soil—in plant biomass, and thus may mask important mechanisms such as uptake and recycling. Hence, we have modified and extended the set of PUE indices to reflect P uptake, P utilization, and P recycling efficiency.
Phosphorus uptake efficiency is defined as the ratio of the P content in leaves or needles to the P content in mineral soil at soil depths of 0–5 and 5–10 cm.
P   u p t a k e   e f f i c i e n c y = P F o l i a g e P s o i l
Phosphorus utilization efficiency is defined as the ratio of the constant dry weight (105 °C) of 100 beech leaves or 1000 spruce needles to the P content in leaves or needles.
P   u t i l i z a t i o n   e f f i c i e n c y = m 100   L e a v e s / 1000   N e e d l e s P F o l i a g e
P recycling efficiency is defined as the ratio of the P content in leaves or needles to the P content in the organic layer.
P   r e c y c l i n g   e f f i c i e n c y = P F o l i a g e P o r g a n i c   l a y e r
where
  • P = Phosphorus content (g P/kg) of European beech leaves and Norway spruce needles, respectively
  • m = Constant dry mass (105 °C) of 100 European beech leaves or 1000 Norway spruce needles
The phosphorus nutrition status corresponds to the P content in leaves or needles of the dominant tree species (i.e., European beech and Norway spruce).

2.5. Statistical Analysis

As a first step, we correlated the measures of α-diversity (species richness, Shannon index, Simpson index, and evenness) with P content (g P kg−1) and stock (kg P ha−1) of the organic layer and of mineral soil at two depths (0–5 cm and 5–10 cm), both for total species and for each vegetation layer of a sampled plot. In a second step, P nutrition status (P foliar concentration) and PUE (P recycling efficiency, P uptake efficiency, and P utilization efficiency) of European beech and Norway spruce served as dependent variables, and α-diversities of the overall vegetation and of each vegetation layer were independent variables.
Following Zuur et al. [68], the continuous data set was analyzed in terms of homogeneity (Fligner test), normality (Shapiro-Wilk test), outliers, and missing values to meet the preconditions of the correlation analysis. When dependent and independent variables were normally distributed (p ≥ 0.05), we performed Pearson’s product moment correlation to reveal the relationship between α-diversity indices and P-related variables; otherwise, we performed the Spearman’s rank correlation test. Differences between European beech and Norway spruce forests in terms of α-diversity and P-related variables were tested using the Kruskal-Wallis (KW) test.

3. Results

3.1. P-Related Parameters in European Beech and Norway Spruce Forests

The phosphorus nutrition status of Norway spruce was significantly higher than of European beech (Table 2). Similarly, P recycling and P uptake efficiency from the 0–5 cm soil depth group showed significantly higher values for Norway spruce than for European beech. By contrast, P utilization efficiency was higher for European beech than for Norway spruce. We found significantly higher values for P uptake efficiency than for P recycling efficiency across forest ecosystems (KW test, p < 0.001) as well as within European beech (p < 0.01) and Norway spruce (KW test, p < 0.05). In addition, P recycling efficiency was always positively related to the P uptake efficiencies of European beech (Spearman’s rho = 0.55–0.60, p < 0.001) and Norway spruce (Spearman’s rho = 0.42–0.47, p < 0.001). In the organic layer, the mean P contents of beech and spruce forest were similar, but the P stock was more than threefold higher in spruce than in beech forests. In mineral soil (0–10 cm), P contents were again approximately the same in both forest types, but the P stock of beech stands was markedly greater than in spruce forests (195 versus 160 kg P ha−1). Consequently, the C/P ratio in mineral soil of European beech forests was significantly lower than in Norway spruce forests (Table 2). Phosphorus content in the organic layer and in mineral soil (0–10 cm) were positively correlated in beech forests (0–5 cm soil depth: Spearman’s rho = 0.51, p < 0.001; 5–10 cm soil depth: Spearman’s rho = 0.52, p < 0.001) and in spruce forests (0–5 cm soil depth: Spearman’s rho = 0.68, p < 0.001; 5–10 cm soil depth: Spearman’s rho = 0.66, p < 0.001). Furthermore, P content and P stock in the organic layer (beech forests: Spearman’s rho = 0.32, p < 0.01; spruce forests: Spearman’s rho = 0.40, p < 0.001) and in the topsoil (beech forests: Spearman’s rho = 0.74, p < 0.001; spruce forests: Spearman’s rho = 0.82, p < 0.001) were positively related in both forest types.

3.2. Plant Diversity of Beech and Spruce Forests

Measures of α-diversity were similar in beech and spruce forests (Table 3). Alpha diversity in the tree and shrub layers of both forest ecosystems was generally low (Shannon index (HS) ≤ 0.56 and 1 − D ≤ 0.30). Species richness, Shannon index, and Simpson index of the tree layer of beech forests tended to be slightly but not significantly higher than in spruce forests. In contrast, the α-diversity indices of the shrub layer of beech forests were significantly lower than in spruce forests. The species richness, Shannon index, and Simpson index were highest in the herb layers, with slightly higher values in spruce forests than in beech forests. In the moss layer, species richness was significantly higher and evenness significantly lower in spruce forests than in beech forests. For detailed results of different diversity indices separated by total forest stand and individual vegetation layers, see supplementary materials Tables S1–S8.

3.3. Relation of α-Diversity with Phosphorus in the Organic Layer and Soil

Our analyses revealed significant but multidirectional relationships between P in the organic layer and mineral soil and α-diversity of forest ecosystems.

3.3.1. European Beech Forests

Overall species richness was negatively related to P stock in the organic layer but positively to P content in soil depths from 0–10 cm (Figure 2). Furthermore, the overall Shannon and Simpson indices were positively linked to P content in the 0–5 cm and 5–10 cm soil depths, respectively (Table 4). The overall evenness was not significantly related to P-related variables (Table 4).
The tree and herb layers were the only vegetation layers that showed significant correlations of α-diversity with P-related variables in the organic layer and mineral soil. The Shannon and Simpson indices of the tree layer were negatively related to P stock in the organic layer (Table 4), whereas the species richness of the herb layer had a significant negative correlation with P stock in the organic layer and a positive correlation with P content in the 0–10 cm soil depths. The evenness of the herb layer in European beech forests was negatively related to P content in the 0–10 cm soil depths (Table 4).

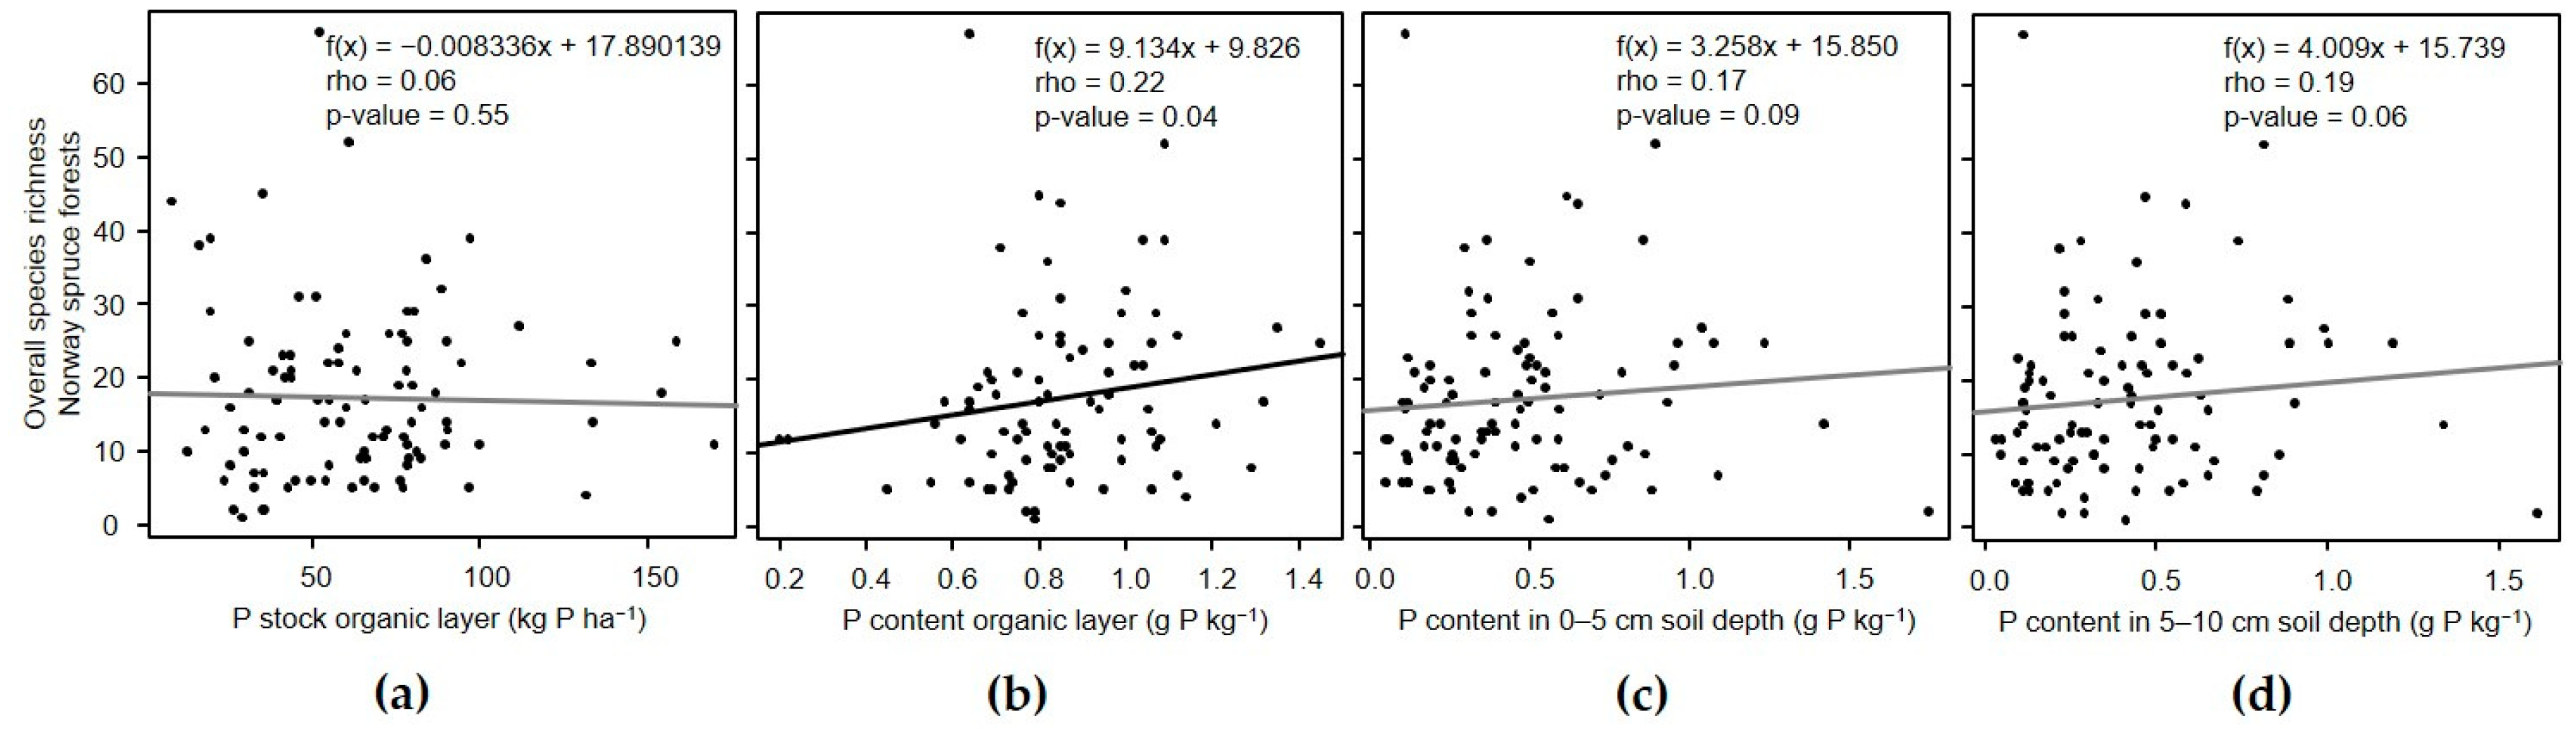
3.3.2. Norway Spruce Forests

The overall species richness of this forest type significantly increased (Figure 3), and evenness decreased, with higher P content in the organic layer (Table 5).
In contrast to beech forests, α-diversity in the tree layer (species richness and Shannon and Simpson indices) of spruce forests was significantly negatively related to P content in the 0–10 cm soil depths (Table 5). The evenness of the tree layer was negatively related to P content in the 0–5 cm soil depth but positively related to P content in the 5–10 cm soil depth. The diversity of the shrub layer showed no significant correlation to P in the organic layer or soil. The α-diversity of the herb layer showed contrasting relationships. Shannon and Simpson indices correlated negatively with P stock in the organic layer but positively with higher P contents in the 0–10 cm soil depths. In contrast, the species richness was consistently positively correlated with P content in the organic layer and P content in the 0–10 cm soil depths. The evenness of the herb layer decreased significantly with higher P stocks in the organic layer. The moss layer showed mainly positive relationships of diversity indices (species richness and Shannon index) with P stock and P content in the organic layer. The evenness of the moss layer decreased with increasing P stock in the organic layer and increased with higher P content in the 0–5 cm soil depth (Table 5).

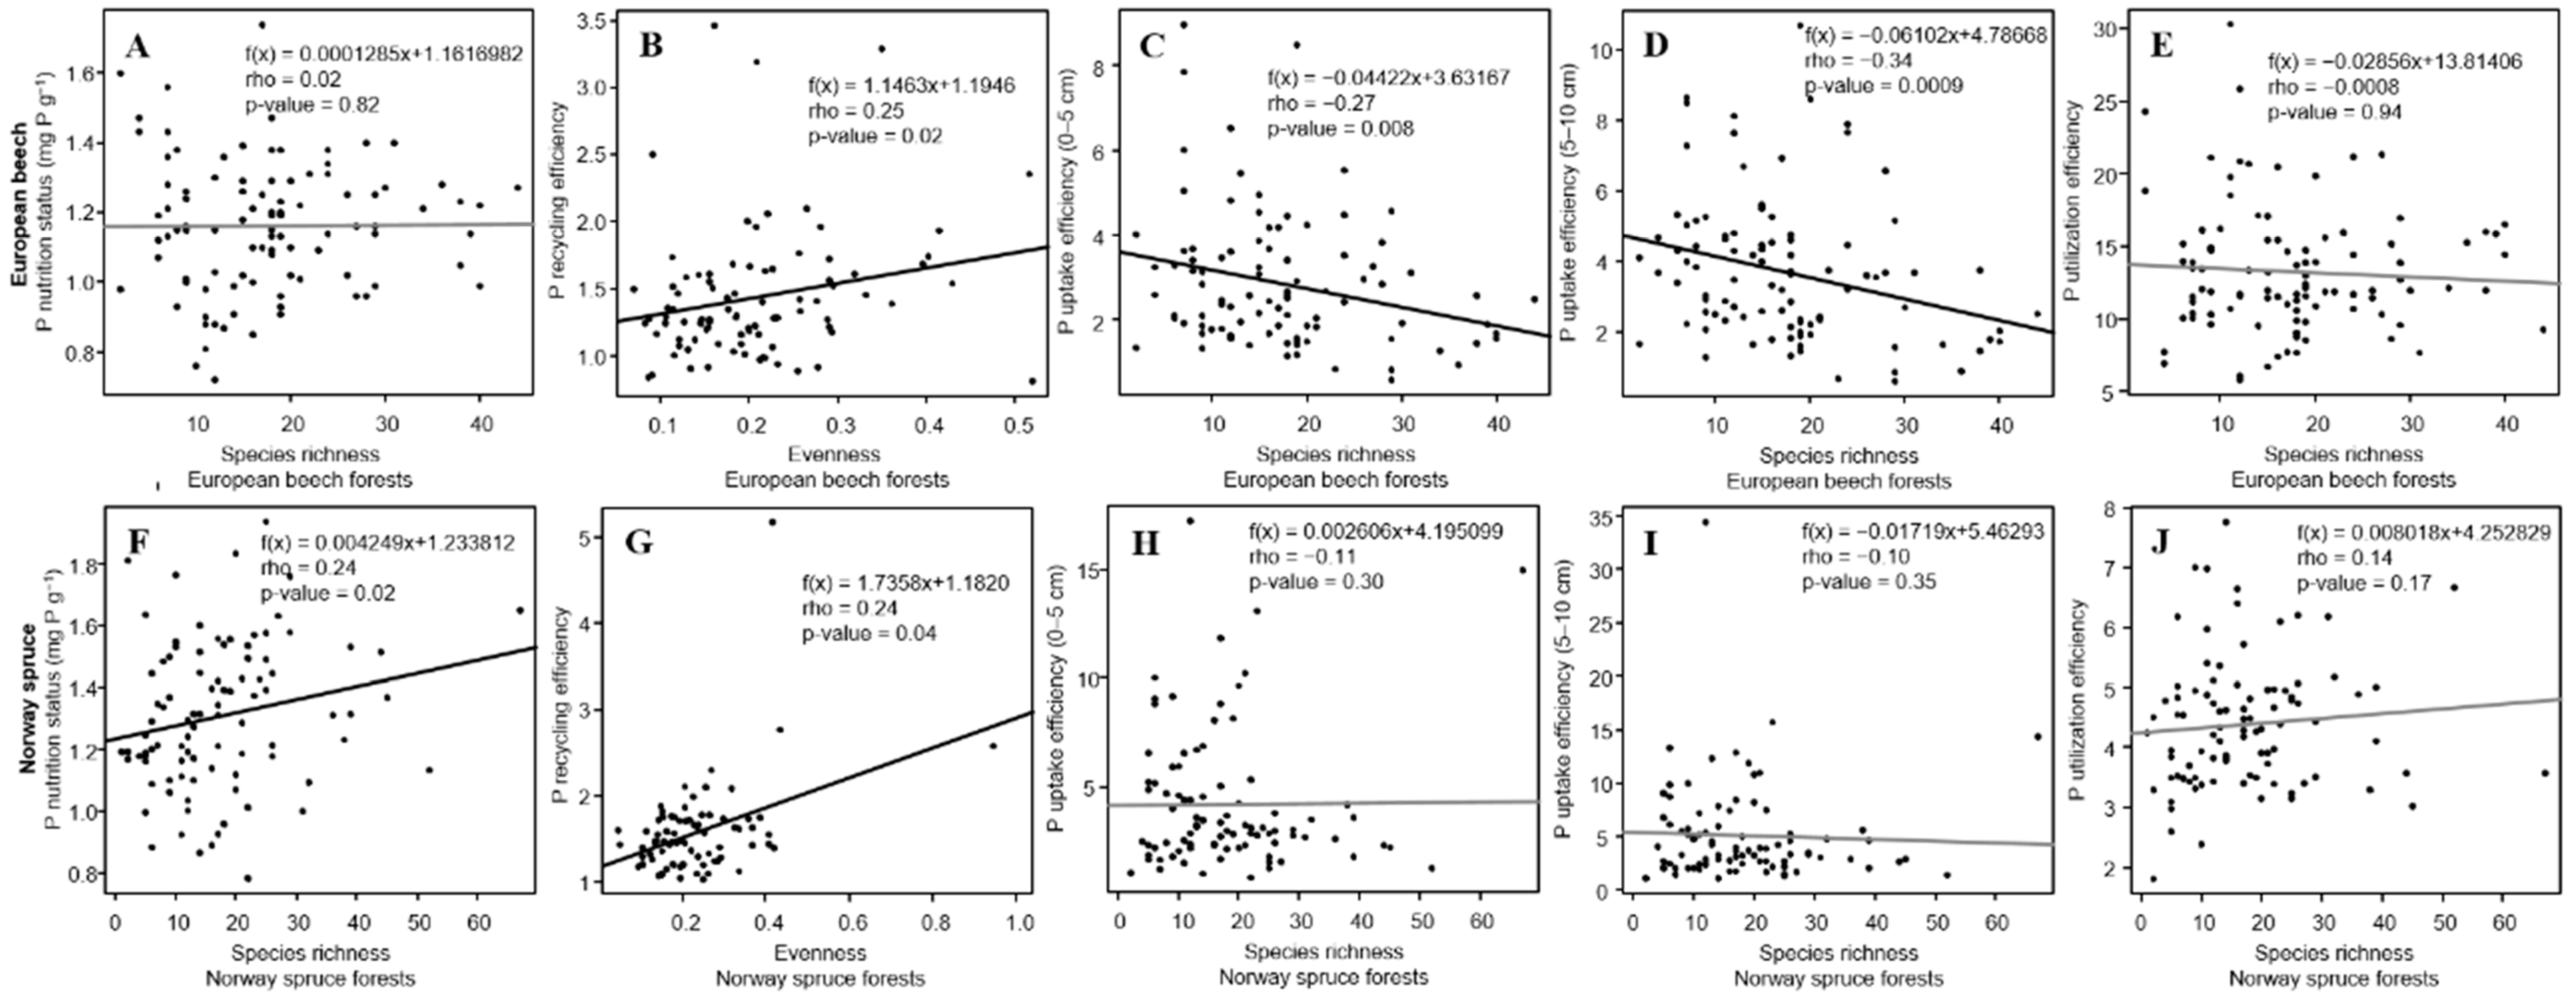
3.4. P Nutrition Status and PUE in Relation to α-Diversity

The phosphorus nutrition status of European beech was not related to the α-diversity of the overall vegetation, but P recycling efficiency increased significantly with the evenness of the overall vegetation (Figure 4b). By contrast, P uptake efficiencies of European beech decreased significantly with higher overall species richness of the forest ecosystem (Figure 4c,d). In Norway spruce forests, the P nutrition status and P recycling efficiency of Norway spruce increased significantly with overall species richness and evenness (Figure 4f,g).
A more detailed analysis of the individual vegetation layers revealed a positive relationship (Spearman’s rho = 0.18 and 0.17; p = 0.09) between the Shannon and Simpson indices in the tree layer and the P recycling efficiency of European beech (Table 6). The P nutrition status of Norway spruce was significantly negatively related to the species richness and Shannon and Simpson indices of the tree layer, whereas the P uptake efficiency of Norway spruce showed a significant positive relationship to these α-diversity indices.
A higher diversity in the shrub layer was associated with a marginally higher P nutrition of European beech. By contrast, evenness in the shrub layer showed a significant negative correlation with the P utilization efficiency of Norway spruce.
In the herb layer, the P recycling efficiency of European beech was negatively related to the Shannon and Simpson indices. In addition, decreased species richness in the herb layer was associated with higher P uptake efficiency of European beech. In the herb layer of Norway spruce forests, however, a higher species richness had a positive correlation with the P nutrition status of Norway spruce, whereas the Shannon and Simpson indices showed a marginally negative correlation with P uptake efficiency (Table 6).
The Shannon and the Simpson indices of the moss layer in beech forests were negatively related to P uptake efficiency (5–10 cm soil depth). In spruce forests, a higher species richness in the moss layer was associated with a significantly decreased P recycling efficiency but increased P utilization efficiency (Table 6).

4. Discussion

While relationships between P in soil and plant diversity have largely been established for (sub)tropical forest systems, this study illustrates that P in the organic layer and soil also matters for plant diversity and tree nutrition in important temperate forest systems, which are dominated either by European beech or Norway spruce. In contrast to a few previous studies on the role of P in temperate forests [48,69], we analyzed relationships between P and plant diversity at a larger mesoscale, considered the origin of P in more detail, and revealed feedbacks of plant diversity on the P nutrition status and PUE of dominant tree species.

4.1. Phosphorus in Foliage, Organic Layer, and Soil

The mean P nutrition status of European beech (1.16 g P kg−1) and Norway spruce (1.31 g P kg−1) were in the lower range of data from German forest stands and confirm similar findings for P nutrition status derived from a broader national scale [39,70]. These results indicate a rather low P nutrition status which probably results from a large-scale undersupply of P for European beech and Norway spruce [41,70]. Still, P nutrition status in this study covered the full gradient from very low to very high and should thus reveal potential interactions with plant diversity.
Ewald [71] assumed that low P stocks in soil were the reason for low P foliar contents in European beech. However, we did not find any correlation between P content in leaves of European beech and total P content in the organic layer or mineral soil. Similarly, Ilg et al. [39] found no correlations between P content in leaves or needles and total P contents in soil. In Norway spruce, by contrast, total P foliar content increased significantly with total P content in the organic layer (Pearson’s correlation r = 0.46, p ≤ 0.001) and mean total P content in 0–10 cm soil depth (Pearson’s correlation r = 0.49, p ≤ 0.001). This insight points to a positive relationship between total P and plant-available P in the organic layer and soil of spruce forests. The result is novel as foliar P contents have been found to vary positively with plant-available P rather than with total soil P, as demonstrated for European beech [71] and English oak (Quercus robur L.) [72].
Atmospheric N deposition and consequently total N stocks in the top mineral soil (0–10 cm) of the NFSI II showed increased values compared to the NFSI I in Germany [61]. However, foliar P was only weakly correlated to N/P ratios in soil and was not correlated to atmospheric N deposition, as verified by the NFSI II dataset [61], which implies non-collinearity between soil N and P.

4.2. Plant Diversity by Vegetation Layer

The forests in our study were relatively poor in tree species, with, on average, only two species in the tree layer of both forest ecosystems (Table 3). Mölder et al. [73] investigated 21 beech forests that covered a gradient from pure beech forest stands to mixed forests in Germany and found a mean richness in the tree layer of six species with a range of 1 to 11. The differences in mean species number can be attributed to our database selection criteria and to the greater plot size of 2500 m2 in the vegetation survey of Mölder et al. [73]. As we included exclusively European beech and Norway spruce forest stands with a minimum cover of the respective tree species of 70%, both species number and the species richness–sensitive Shannon index (0.31 for European beech and 0.22 for Norway spruce forests) were lower than in other studies, such as that carried out by Mölder et al. [73], who reported a clearly higher Shannon index (about 1.02) along with a broader range (0–1.9) in the tree layer.
In the herb layer, species richness and Shannon index were only indirectly influenced by our selection criteria. Consequently, means and ranges of species richness (mean: 32; range: 11–55) and Shannon index (mean = 2.45; range: 1.15–3.34) in the herb layer of European beech forests were comparable with those of Mölder et al. [73]. In contrast to the Shannon index, the Simpson index is much less sensitive towards species richness but heavily weights the most abundant species. Consequently, the Simpson index in the tree layer of both forest ecosystems was low in comparison to other studies [74], which again can be attributed to our selection criteria. For the shrub, herb, and moss layers, there were, to the best of our knowledge, no studies for comparison.

4.3. Linkages between Organic Layer and Soil P, Biodiversity, and PUE

Overall, our results on P nutrition status (Table 2) and on biodiversity indices in all vegetation layers (Table 3) covered a broad range of values and thus could reveal potential interactions among plant diversity, P in the organic layer and soil, and the PUE of tree species. Our analysis showed that overall diversity and diversity of individual vegetation layers were related in different ways to P in the organic layer and in mineral soil (Table 5). Alpha diversity was shown to be linked to P nutrition status and the PUEs of trees (Table 6), with P acquisition in the tree layers dominated by positive relationships between plant diversity and PUEs of trees, indicating complementarity effects and negative relationships between plant diversity and PUEs in the herb and moss layers, indicating competition effects (Table 6).
In contrast to our expectations, overall species richness was mainly positively related to P content in the organic layer and the upper soil layer of both forest ecosystems. In beech forests, P content in the 0–10 cm soil depths showed significant positive correlations with species richness, whereas in spruce forests, P content in the organic layer was significantly positively related to the overall species richness (Figure 2 and Figure 3). Accordingly, overall species richness increased with decreasing C/P ratios in 0–10 cm soil depths (p < 0.003 for European beech forests, p < 0.04 for Norway spruce forests), although P stock in the organic layer was negatively related to the overall species richness in beech forests (Figure 2). These findings regarding a positive relationship between overall species richness and P provision contrast with studies of other ecosystems. In Australia, for example, overall species diversity has been observed to increase with a decline in soil nutrients in humid forests [36], while in eucalypt woodlands a decline in native plant diversity has been attributed to elevated available P [35]. Moreover, European grassland studies have found a negative relationship between species diversity and P in soil [30,31].
However, further analyses of different vegetation layers in our study revealed that the response of the overall diversity to P in the organic layer and soil does not necessarily mirror the real nutrient cycles within the ecosystem. As expected, P in the organic layer and soil was significantly related to the diversity in the tree layers. The diversity (i.e., Simpson and Shannon) in the tree layer of European beech forests was significantly negatively correlated to P stock in the organic layer (Table 4), whereas the diversity of the tree layer in spruce forests significantly decreased with higher P content in 0–10 cm soil depth (Table 5). Given the positive relationships between P content in the organic layer and that in the mineral soil as well as between P content and P stock in the mineral soil (Section 3.1), our results imply that low P contents and stocks in the organic layer and soil promote a more diverse tree layer in temperate beech and spruce forest ecosystems. By contrast, Fu et al. [53] have reported an increasing tree diversity with increasing P availability in warm temperate forests in China. The differences in the response of the diversity in the tree layer between beech and spruce forests to P content in the organic layer and soil presumably result from lower P stocks in the organic layer and significantly higher P contents in the 0–5 cm soil depth (and P stocks in the 0–10 cm soil depths) of beech forests compared to spruce forests (Table 2). Consequently, plant-available P may be assumed to be lower in the organic layer and higher in the upper soil horizons of European beech forests compared to Norway spruce forests.
Nutrient limitation is hypothesized to promote greater spatial heterogeneity in nutrients along with greater niche dimensionality [11]. This theory suggests the co-existence of a high number of species with complementary traits which results in reduced competition among species and a more efficient use of nutrients [12,13,14,15]. Correspondingly, in our study systems, P recycling efficiency of European beech and P uptake efficiency of Norway spruce increased with diversity of the tree layer (Table 6). Further support for this result comes from a local study in Hainich National Park, Germany [69]. Here, P response efficiency of European beech, i.e., the ratio between aboveground net primary production and P in soil, was higher in mixed species stands compared to pure stands. Although diversity in the shrub layer did not relate to P in the organic layer and soil, the P content in European beech leaves tended to increase with the shrub layer diversity (Shannon: rho = 0.21, p < 0.1; Simpson: rho = 0.22, p < 0.1; Table 6). Hence, our results suggest that the positive relationship between diversity and the P nutrition status of European beech relates to woody species in general and not only to tree species.
The patterns in the herb layer clearly diverged from those of the tree and shrub layers. Herbaceous diversity seemed to depend on the localization of P in the soil versus the organic layer. Thus, diversity in the herb layer of both forest types was negatively related to P stock in the organic layer but positively to P stock and content in soil (Table 4 and Table 5). Phosphorus stocks in the organic layer were up to 10-fold lower than in the 0–10 cm soil depths (Table 2). Thus, we generally expect lower P availability in the organic layer and greater availability of P in the upper soil layer, which may explain divergent responses of diversity in the herb layer, owing to altered niche dimensionality. It may also be hypothesized that low P stocks in the organic layer indicate high P availability. However, although we did not measure plant-available P directly, a negative relationship between litter layer thickness and P stock in the organic layer (Spearman’s rho = −0.26, p = 0.0002) in this study points to high P availability at higher P stocks in the organic layer.
Our findings on a positive relationship between diversity in the herb layer and P in soil clearly contrast with other studies on non-woody vegetation, e.g., European grasslands [31], alpine meadows [43], upland grasslands [44], and agricultural ecosystems [42]. These studies have revealed negative relationships between plant diversity and soil P due to the dominance of a few competitors along with increased aboveground biomass production on P-fertile soils which hampers the growth of smaller species that are tolerant of P limitation. Accordingly, Harpole et al. [75] have attributed species loss in grasslands to soil nutrient additions. Positive relationships between diversity of the herb layer and P in soil in our study point to divergent patterns in temperate forests. One explanation may be that high P stocks in soil are not necessarily available to all species in the herb layer. Given the vertical niche differentiation, the P pool in deeper soil layers may not be reached by roots of all herbaceous plants. Those without access are forced to build up a separate P cycle. Rooting depth of herbaceous plants is generally lower compared to woody species [76]. In forest ecosystems, deep-rooting woody plants and shallow-rooting herbs co-exist. In cases where woody and herb roots share the same soil horizons, herbaceous roots may also compete with tree roots for P resources as indicated by the fact that the P recycling efficiency of European beech and the P uptake efficiency of Norway spruce were lower at higher diversities in the herb layer and P uptake efficiencies were correlated with higher evenness in the herb layer (Table 6).
Furthermore, herbaceous plants of deciduous forests are largely colonized by arbuscular mycorrhizal fungi [50,77], whereas roots of European beech and Norway spruce are exclusively colonized with ectomycorrhiza [78]. In contrast to the latter, arbuscular mycorrhizal fungi are obligate symbionts that depend on the C supply from their hosts [79] because their production of enzymes to hydrolyze nutrients from organic matter is much lower than in ectomycorrhiza [80,81]. In accordance, Rosling et al. [82] revealed that organic P was more available in soil when trees were colonized with ectomycorrhiza than with arbuscular mycorrhiza. Therefore, herbaceous plants may be less tolerant of limited P and their roots may be outcompeted when tree root density is very high in upper soil horizons. Conversely, the herb layer probably becomes more species rich at P-rich sites (Table 4 and Table 5). The competition between the herb and tree layers for hydrolyzed organic P provided by tree roots may explain our observed negative relationship between herbaceous species richness and P recycling efficiency of European beech and P uptake efficiency of Norway spruce (Table 6).
Surprisingly, diversity of the moss layer also correlated with P in the soil of spruce forests (Table 5) and PUE of European beech and Norway spruce (Table 6). We found no significant relationships between P in the organic layer and soil and the diversity in the moss layer of beech forests (Table 4), which may result from the smaller species number along with lower moss frequency in this layer in beech forests (see Section 2.3). However, α-diversity in the moss layer of Norway spruce forests increased with P stock and P content in the organic layer, i.e., the opposite of the herb layer (Table 5). Similar to grassland communities [83], divergent behavior of bryophytes and vascular plants to changes in environmental conditions has also been reported in spruce forests [84]. The just-mentioned authors showed that vascular plant species richness decreased with distance from the tree trunk, whereas bryophyte richness increased at higher distances from the tree trunk and at lower pHs of the decay horizon. Our data suggest a space-use pattern of herb and moss layers driven by P in the organic layer of spruce forests. Species richness and cover were positively related to each other in the moss layer (rho = 0.33, p < 0.01) and the herb layer (rho = 0.60, p < 0.001), which points to competition between the two layers.
Total P stock in the organic layer of spruce forests was more than threefold higher than in beech forests (Table 2), which was probably owing to lower pH values and lower mean temperatures in spruce forests (Table 1). It is the adverse environmental conditions rather than the recalcitrance of Norway spruce needles that reduces decomposition rates of Norway spruce litter compared to European beech litter [85,86,87]. As a consequence, although total P stock in the organic layer of spruce forests is higher, plant-available P released from spruce litter is lower [86]. We suggest that the reduced P supply for herbaceous plants at high P stocks in the organic layer of spruce forests may disrupt the establishment of the herb layer to the benefit of a denser moss layer. In addition, cover and species richness of bryophytes indirectly profit from P limitation in the organic layer and soil because bryophytes take up nutrients predominantly through their entire upper surface [88,89]. Bryophytes produce secondary compounds such as terpenes that are fungicidal and hinder both the uptake of P and the germination of higher plants [90]. This complex pattern of environmental conditions and bryophyte physiology may explain increased species richness and cover of the moss layer compared to the herb layer at higher P stocks in the organic layer of spruce forests. We observed a decrease in the P recycling efficiency of European beech and the P uptake efficiency of Norway spruce with an increasing diversity in the moss layer, indicating a possible feedback mechanism. The relationship revealed between the PUE of both forest tree species and the diversity in the moss layer probably results from competition between the tree-mycorrhiza association and the moss layer as demonstrated for a jack spruce forest (Picea mariana) in Alaska [91].

5. Conclusions

This study has revealed significant relationships between α-diversity and P in the organic layer and soil in two types of central European forest ecosystems. In contrast to other ecosystems, we found mainly positive relationships among overall α-diversity and P in the organic layer and soil. Further analyses revealed that the tree layer alone showed the expected negative correlation between soil P content and biodiversity, which points to complementary P acquisition strategies in this particular vegetation layer as described previously for non-forest vegetation types. Correspondingly, our results on the P use efficiency of European beech and Norway spruce suggest that an increasing number of woody species in forest ecosystems supports the acquisition of P from the organic layer and soil. P recycling efficiency was consistently lower than P uptake efficiency. We thus assume European beech and Norway spruce forest to be acquiring ecosystems owing to a sufficient P supply from mineral soil. In contrast, the findings on the herb and moss layers indicate competition effects with herbs competing belowground with tree roots and mosses competing aboveground with herbs. Consequently, understanding the complexity in species composition and vegetation structure of temperate forests required more detailed analyses compared to grasslands and tropical forests; in the latter, plant diversity is mainly driven by the tree layer. Our results further support the idea that increasing tree species richness in temperate forests will, among many other benefits, counteract increasing P limitations. Our study encourages more in-depth analyses on the underlying mechanisms of the detected diversity–P relationships. In particular, assessing the importance of plant diversity in relation to other environmental parameters in determining PUE in forests is a potential future direction.

Supplementary Materials

The following are available online at https://www.mdpi.com/1999-4907/10/12/1156/s1. Alpha diversity indices of study plots are included as supplementary material Tables S1–S8. Table S1: Diversity indices of the tree layer in beech forests, Table S2: Diversity indices of the herb layer in beech forests, Table S3: Diversity indices of the shrub layer in beech forests, Table S4: Diversity indices of the moss layer in beech forests, Table S5: Diversity indices of the tree layer in spruce forests, Table S6: Diversity indices of the herb layer in spruce forests, Table S7: Diversity indices of spruce forests in the shrub layer, Table S8: Diversity indices of the moss layer in spruce forests.

Author Contributions

Data curation, D.Z. and N.W.; formal analysis, I.R.; funding acquisition, A.C.; investigation, I.R. and A.C.; methodology, I.R. and A.C.; project administration, I.R. and A.C.; resources, D.Z. and N.W.; supervision, I.K.; writing—original draft, I.R.; writing—review and editing, I.R., I.K., D.Z., N.W., and A.C.

Funding

This research was part of the DFG project “PhosForDiv”– Phosphate availability as driver of plant biodiversity in forest ecosystems (CI 175/2-1, KO 2200/4-1) within the Priority Program “SPP 1685”, founded by the German Research Foundation.

Acknowledgments

We are grateful to the German federal states Hesse, Lower Saxony, Mecklenburg-Western Pomerania, North Rhine-Westphalia, Saarland, Saxony, Saxony-Anhalt, Schleswig-Holstein, and Thuringia for acquisition, preparation, and provision of the data within the framework of the Second German National Forest Soil Inventory. We also thank Kelaine Ravdin for the linguistic revision of our manuscript.

Conflicts of Interest

The authors declare no conflict of interest. The funders had no role in the design of the study; in the collection, analyses, or interpretation of data; in the writing of the manuscript, or in the decision to publish the results.

References

  1. Schachtman, D.P.; Reid, R.J.; Ayling, S.M. Phosphorus uptake by plants: From soil to cell. Plant Physiol. 1998, 116, 447–453. [Google Scholar] [CrossRef] [PubMed] [Green Version]
  2. Scheffer, F.; Blume, H.-P.; Thiele, S. Lehrbuch der Bodenkunde, 16th ed.; Spektrum Akad. Verl: Heidelberg, Germany, 2010; ISBN 978-3-8274-1444-1. [Google Scholar]
  3. Lambers, H. Root structure and functioning for efficient acquisition of phosphorus: Matching morphological and physiological traits. Ann. Bot. 2006, 98, 693–713. [Google Scholar] [CrossRef] [PubMed] [Green Version]
  4. Feller, I.C.; McKee, K.L.; Whigham, D.F.; O’Neill, J.P. Nitrogen vs. phosphorus limitation across an ecotonal gradient in a mangrove forest. Biogeochemistry 2003, 62, 145–175. [Google Scholar] [CrossRef]
  5. Cross, A.F.; Schlesinger, W.H. A literature review and evaluation of the Hedley fractionation: Applications to the biogeochemical cycle of soil phosphorus in natural ecosystems. Geoderma 1995, 64, 197–214. [Google Scholar] [CrossRef]
  6. Gleason, S.M.; Read, J.; Ares, A.; Metcalfe, D.J. Phosphorus economics of tropical rainforest species and stands across soil contrasts in Queensland, Australia: Understanding the effects of soil specialization and trait plasticity. Funct. Ecol. 2009, 23, 1157–1166. [Google Scholar] [CrossRef]
  7. Herbert, D.A.; Fownes, J.H. Phosphorus limitation of forest leaf area and net primary production on a highly weathered soil. Biogeochemistry 1995, 29, 223–235. [Google Scholar] [CrossRef]
  8. Lang, F.; Bauhus, J.; Frossard, E.; George, E.; Kaiser, K.; Kaupenjohann, M.; Krüger, J.; Matzner, E.; Polle, A.; Prietzel, J.; et al. Phosphorus in forest ecosystems: New insights from an ecosystem nutrition perspective. Z. Pflanzenernähr. Bodenk. 2016, 179, 129–135. [Google Scholar] [CrossRef]
  9. Gartlan, J.S.; Newbery, D.M.; Thomas, D.W.; Waterman, P.G. The influence of topography and soil phosphorus on the vegetation of Korup Forest Reserve, Cameroun. Vegetatio 1986, 65, 131–148. [Google Scholar] [CrossRef]
  10. Malizia, A.; Grau, H.R.; Lichstein, J.W. Soil phosphorus and disturbance influence liana communities in a subtropical montane forest. J. Veg. Sci. 2010, 21, 551–560. [Google Scholar] [CrossRef]
  11. Tilman, D. Plant Strategies and the Dynamics and Structure of Plant Communities; Princeton University Press: Princeton, NJ, USA, 1988; ISBN 9780691084893. [Google Scholar]
  12. Hooper, D.U. The role of complementarity and competition in ecosystem responses to variation in plant diversity. Ecology 1998, 79, 704–719. [Google Scholar] [CrossRef]
  13. Fridley, J.D. The influence of species diversity on ecosystem productivity: How, where, and why? Oikos 2001, 93, 514–526. [Google Scholar] [CrossRef]
  14. Tilman, D. The influence of functional diversity and composition on ecosystem processes. Science 1997, 277, 1300–1302. [Google Scholar] [CrossRef] [Green Version]
  15. Hooper, D.U.; Chapin, F.S.; Ewel, J.J.; Hector, A.; Inchausti, P.; Lavorel, S.; Lawton, J.H.; Lodge, D.M.; Loreau, M.; Naeem, S.; et al. Effects of biodiversity on ecosystem functioning: A consensus of current knowledge. Ecol. Monogr. 2005, 75, 3–35. [Google Scholar] [CrossRef]
  16. Grime, J.P. Competitive exclusion in herbaceous vegetation. Nature 1973, 242, 344–347. [Google Scholar] [CrossRef]
  17. Newman, E.I. Competition and diversity in herbaceous vegetation. Nature 1973, 244, 310. [Google Scholar] [CrossRef]
  18. Oksanen, J. Is the humped relationship between species richness and biomass an artefact due to plot size? J. Ecol. 1996, 84, 293–295. [Google Scholar] [CrossRef]
  19. Rajaniemi, T.K. Why does fertilization reduce plant species diversity? Testing three competition-based hypotheses. J. Ecol. 2002, 90, 316–324. [Google Scholar] [CrossRef] [Green Version]
  20. Craine, J.M.; Dybzinski, R.; Robinson, D. Mechanisms of plant competition for nutrients, water and light. Funct. Ecol. 2013, 27, 833–840. [Google Scholar] [CrossRef]
  21. Nakamura, N. Species richness and aggregation effects on the productivity of ruderal plant communities under drought perturbation. Biosci. Horiz. 2008, 1, 128–135. [Google Scholar] [CrossRef] [Green Version]
  22. Smith, R.G.; Mortensen, D.A.; Ryan, M.R. A new hypothesis for the functional role of diversity in mediating resource pools and weed−crop competition in agroecosystems. Weed Res. 2010, 50, 37–48. [Google Scholar] [CrossRef]
  23. Davidson, E.A.; Reis de Carvalho, C.J.; Vieira, I.C.G.; Figueiredo, R.d.O.; Moutinho, P.; Yoko Ishida, F.; Primo dos Santos, M.T.; Benito Guerrero, J.; Kalif, K.; Tuma Sabá, R. Nitrogen and phosphorus limitation of biomass growth in a tropical secondary forest. Ecol. Appl. 2004, 14, 150–163. [Google Scholar] [CrossRef] [Green Version]
  24. Homeier, J.; Breckle, S.-W.; Günter, S.; Rollenbeck, R.T.; Leuschner, C. Tree diversity, forest structure and productivity along altitudinal and topographical gradients in a species-rich Ecuadorian montane rain forest. Biotropica 2010, 42, 140–148. [Google Scholar] [CrossRef]
  25. Campo, J.; Maass, M.; Jaramillo, V.J.; Martínez-Yrízar, A.; Sarukhán, J. Phosphorus cycling in a Mexican tropical dry forest ecosystem. Biogeochemistry 2001, 53, 161–179. [Google Scholar] [CrossRef]
  26. Keith, H.; Raison, R.J.; Jacobson, K.L. Allocation of carbon in a mature eucalypt forest and some effects of soil phosphorus availability. Plant Soil 1997, 196, 81–99. [Google Scholar] [CrossRef]
  27. Jäger, H.; Alencastro, M.J.; Kaupenjohann, M.; Kowarik, I. Ecosystem changes in Galápagos highlands by the invasive tree Cinchona pubescens. Plant Soil 2013, 371, 629–640. [Google Scholar] [CrossRef]
  28. Romanyà i Socoró, J. Phosphorus Cycling in Fast Growing Forest Plantations: Availability, Plant Uptake and the Role of Forest Floor. Ph.D. Thesis, Universitat de Barcelona, Barcelona, Spain, 1993. [Google Scholar]
  29. Sardans, J.; Peñuelas, J. Increasing drought decreases phosphorus availability in an evergreen Mediterranean forest. Plant Soil 2004, 267, 367–377. [Google Scholar] [CrossRef]
  30. Oelmann, Y.; Richter, A.K.; Roscher, C.; Rosenkranz, S.; Temperton, V.M.; Weisser, W.W.; Wilcke, W. Does plant diversity influence phosphorus cycling in experimental grasslands? Geoderma 2011, 167–168, 178–187. [Google Scholar] [CrossRef]
  31. Ceulemans, T.; Stevens, C.J.; Duchateau, L.; Jacquemyn, H.; Gowing, D.J.G.; Merckx, R.; Wallace, H.; van Rooijen, N.; Goethem, T.; Bobbink, R.; et al. Soil phosphorus constrains biodiversity across European grasslands. Glob. Chang. Biol. 2014, 20, 3814–3822. [Google Scholar] [CrossRef]
  32. Lovelock, C.E.; Ball, M.C.; Choat, B.; Engelbrecht, B.M.; Holbrook, N.M.; Feller, I.C. Linking physiological processes with mangrove forest structure: Phosphorus deficiency limits canopy development, hydraulic conductivity and photosynthetic carbon gain in dwarf Rhizophora mangle. Plant Cell Environ. 2006, 29, 793–802. [Google Scholar] [CrossRef] [Green Version]
  33. Bustamante, M.M.C.; de Brito, D.Q.; Kozovits, A.R.; Luedemann, G.; de Mello, T.R.B.; de Siqueira Pinto, A.; Munhoz, C.B.R.; Takahashi, F.S.C. Effects of nutrient additions on plant biomass and diversity of the herbaceous-subshrub layer of a Brazilian savanna (Cerrado). Plant Ecol. 2012, 213, 795–808. [Google Scholar] [CrossRef]
  34. Lannes, L.S.; Bustamante, M.M.C.; Edwards, P.J.; Venterink, H.O. Alien and endangered plants in the Brazilian Cerrado exhibit contrasting relationships with vegetation biomass and N:P stoichiometry. New Phytol. 2012, 196, 816–823. [Google Scholar] [CrossRef] [PubMed]
  35. Prober, S.M.; Wiehl, G. Relationships among soil fertility, native plant diversity and exotic plant abundance inform restoration of forb-rich eucalypt woodlands. Divers. Distrib. 2012, 18, 795–807. [Google Scholar] [CrossRef]
  36. Sander, J.; Wardell-Johnson, G. Impacts of soil fertility on species and phylogenetic turnover in the high-rainfall zone of the Southwest Australian global biodiversity hotspot. Plant Soil 2011, 345, 103–124. [Google Scholar] [CrossRef]
  37. Tyler, G. Soil chemical limitations to growth and development of Veronica officinalis L. and Carex pilulifera L. Plant Soil 1996, 184, 281–289. [Google Scholar] [CrossRef]
  38. Wellbrock, N.; Eickenscheidt, N.; Grüneberg, E.; Bögelein, R. Environmental settings and their changes in the last decades. In Status and Dynamics of Forests in Germany: Results of the National Forest Monitoring Ecological Studies (Analysis and Synthesis), 1st ed.; Wellbrock, N., Bolte, A., Eds.; Springer: Berlin/Heidelberg, Germany, 2019; ISBN 978-3-030-15734-0. [Google Scholar]
  39. Ilg, K.; Wellbrock, N.; Lux, W. Phosphorus supply and cycling at long-term forest monitoring sites in Germany. Eur. J. For. Res. 2009, 128, 483–492. [Google Scholar] [CrossRef]
  40. Talkner, U.; Meiwes, K.J.; Potočić, N.; Seletković, I.; Cools, N.; de Vos, B.; Rautio, P. Phosphorus nutrition of beech (Fagus sylvatica L.) is decreasing in Europe. Ann. For. Sci. 2015, 72, 919–928. [Google Scholar] [CrossRef]
  41. Wellbrock, N.; Bolte, A.; Flessa, H. (Eds.) Dynamik und räumliche Muster Forstlicher Standorte in Deutschland. Ergebnisse der Bodenzustandserhebung im Wald 2006 bis 2008; Johann Heinrich von Thünen-Institut: Braunschweig, Germany, 2016; ISBN 978-3-86576-161-3. [Google Scholar]
  42. Ma, M. Species richness vs evenness: Independent relationship and different responses to edaphic factors. Oikos 2005, 111, 192–198. [Google Scholar] [CrossRef]
  43. Marini, L.; Scotton, M.; Klimek, S.; Isselstein, J.; Pecile, A. Effects of local factors on plant species richness and composition of Alpine meadows. Agric. Ecosyst. Environ. 2007, 119, 281–288. [Google Scholar] [CrossRef]
  44. Merunková, K.; Chytrý, M. Environmental control of species richness and composition in upland grasslands of the southern Czech Republic. Plant Ecol. 2012, 213, 591–602. [Google Scholar] [CrossRef]
  45. Wassen, M.J.; Venterink, H.O.; Lapshina, E.D.; Tanneberger, F. Endangered plants persist under phosphorus limitation. Nature 2005, 437, 547–550. [Google Scholar] [CrossRef]
  46. Karanika, E.D.; Alifragis, D.A.; Mamolos, A.P.; Veresoglou, D.S. Differentiation between responses of primary productivity and phosphorus exploitation to species richness. Plant Soil 2007, 297, 69–81. [Google Scholar] [CrossRef]
  47. Ball, B.A.; Bradford, M.A.; Hunter, M.D. Nitrogen and phosphorus release from mixed litter layers is lower than predicted from single species decay. Ecosystems 2009, 12, 87–100. [Google Scholar] [CrossRef]
  48. Talkner, U.; Jansen, M.; Beese, F.O. Soil phosphorus status and turnover in central-European beech forest ecosystems with differing tree species diversity. Eur. J. Soil Sci. 2009, 60, 338–346. [Google Scholar] [CrossRef]
  49. Jacob, M.; Viedenz, K.; Polle, A.; Thomas, F.M. Leaf litter decomposition in temperate deciduous forest stands with a decreasing fraction of beech (Fagus sylvatica). Oecologia 2010, 164, 1083–1094. [Google Scholar] [CrossRef] [PubMed] [Green Version]
  50. Helgason, T.; Merryweather, J.W.; Denison, J.; Wilson, P.; Young, J.P.W.; Fitter, A.H. Selectivity and functional diversity in arbuscular mycorrhizas of co-occurring fungi and plants from a temperate deciduous woodland. J. Ecol. 2002, 90, 371–384. [Google Scholar] [CrossRef] [Green Version]
  51. Baxter, J.W.; Dighton, J. Phosphorus source alters host plant response to ectomycorrhizal diversity. Mycorrhiza 2005, 15, 513–523. [Google Scholar] [CrossRef] [PubMed]
  52. Ewald, J.; Ziche, D. Giving meaning to Ellenberg nutrient values: National Forest Soil Inventory yields frequency-based scaling. Appl. Veg. Sci. 2017, 20, 115–123. [Google Scholar] [CrossRef] [Green Version]
  53. Fu, B.J.; Liu, S.L.; Ma, K.M.; Zhu, Y.G. Relationships between soil characteristics, topography and plant diversity in a heterogeneous deciduous broad-leaved forest near Beijing, China. Plant Soil 2004, 261, 47–54. [Google Scholar] [CrossRef]
  54. Ziche, D.; Seidling, W. Homogenisation of climate time series from ICP Forests Level II monitoring sites in Germany based on interpolated climate data. Ann. For. Sci. 2010, 67, 804. [Google Scholar] [CrossRef] [Green Version]
  55. Wellbrock, N.; Ahrends, B.; Bögelein, R.; Bolte, A.; Eickenscheidt, N.; Grüneberg, E.; König, N.; Schmitz, A.; Fleck, S.; Ziche, D. Concept and Methodology of the National Forest Soil Inventory. In Status and Dynamics of Forests in Germany: Results of the National Forest Monitoring Ecological Studies (Analysis and Synthesis), 1st ed.; Wellbrock, N., Bolte, A., Eds.; Springer: Berlin/Heidelberg, Germany, 2019; ISBN 978-3-030-15734-0. [Google Scholar]
  56. Ad-hoc-AG Boden. Bodenkundliche Kartieranleitung. 5.; Verbesserte und erweiterte Auflage: Hannover, Germany, 2005. [Google Scholar]
  57. Grüneberg, E.; Ziche, D.; Wellbrock, N. Organic carbon stocks and sequestration rates of forest soils in Germany. Glob. Chang. Biol. 2014, 20, 2644–2662. [Google Scholar] [CrossRef]
  58. Handbuch Forstliche Analytik. Eine Loseblatt-Sammlung der Analysemethoden im Forstbereich, Gutachterausschuss Forstliche Analytik; Bundesministerium für Ernährung und Landwirtschaft, Ed.; HFA: Berlin, Germany, 2006. [Google Scholar]
  59. Wellbrock, N.G.; Aydin, C.-T.; Block, J.; Bussian, B.; Deckert, M.; Diekmann, O.; Evers, J.G.; Fetzer, K.D.; Gauer, J.; Gehrmann, J.; et al. Bodenzustandserhebung im Wald (BZE II). Arbeitsanleitung für die Außenaufnahmen; BEML: Bonn, Germany, 2006. [Google Scholar]
  60. Rautio, P.; Fürst, A.; Stefan, K.; Raitio, H.; Bartels, U. Part XII: Sampling and analysis of needles and leaves. In Manual on Methods and Criteria for Harmonized Sampling, Assessment, Monitoring and Analysis of the Effects of Air Pollution on Forests; UNECE ICP Forests Programme Co-ordinating Centre, Ed.; Thünen Institute: Eberswalde, Germany, 2016; p. 19. [Google Scholar]
  61. Wellbrock, N.; Bolte, A. Status and Dynamics of Forests in Germany. Available online: https://link.springer.com/book/10.1007/978-3-030-15734-0 (accessed on 18 November 2019).
  62. Magurran, A.E. Measuring Biological Diversity; Blackwell Pub: Middlesex, MA, USA, 2004; ISBN 978-0-632-05633-0. [Google Scholar]
  63. R Core Team. A Language and Environment for Statistical Computing; R Foundation for Statistical Computing: Vienna, Austria, 2016. [Google Scholar]
  64. Grundon, N.J. Mineral nutrition of some Queensland heath plants. J. Ecol. 1972, 60, 171. [Google Scholar] [CrossRef]
  65. Shaver, G.R.; Melillo, J.M. Nutrient budgets of marsh plants: Efficiency concepts and relation to availability. Ecology 1984, 65, 1491–1510. [Google Scholar] [CrossRef]
  66. Vitousek, P. Nutrient cycling and nutrient use efficiency. Am. Nat. 1982, 119, 553–572. [Google Scholar] [CrossRef]
  67. Jiang, D.; Geng, Q.; Li, Q.; Luo, Y.; Vogel, J.; Shi, Z.; Ruan, H.; Xu, X. Nitrogen and phosphorus resorption in planted forests worldwide. Forests 2019, 10, 201. [Google Scholar] [CrossRef] [Green Version]
  68. Zuur, A.F.; Ieno, E.N.; Elphick, C.S. A protocol for data exploration to avoid common statistical problems. Method. Ecol. Evol. 2010, 1, 3–14. [Google Scholar] [CrossRef]
  69. Schmidt, M.; Veldkamp, E.; Corre, M.D. Tree species diversity effects on productivity, soil nutrient availability and nutrient response efficiency in a temperate deciduous forest. For. Ecol. Manag. 2015, 338, 114–123. [Google Scholar] [CrossRef]
  70. Wolff, B.; Riek, W. Deutscher Waldbodenbericht 1996. Ergebnisse der Bundesweiten Bodenzustandserhebung im Wald von 1987–1993 (BZE). Band 1, Bonn. 1997. Available online: http://bfh-web.fh-eberswalde.de/bze/upload/BZE_I_Bericht/band1.pdf (accessed on 24 November 2015).
  71. Ewald, J. Ist Phosphormangel für die geringe Vitalität von Buchen (Fagus sylvatica L.) in den Bayerischen Alpen verantwortlich? Forstw. Cbl. 2000, 119, 276–296. [Google Scholar] [CrossRef]
  72. Gallardo, A.; Covelo, F. Spatial pattern and scale of leaf N and P concentration in a Quercus robur population. Plant Soil 2005, 273, 269–277. [Google Scholar] [CrossRef]
  73. Mölder, A.; Bernhardt-Römermann, M.; Schmidt, W. Herb-layer diversity in deciduous forests: Raised by tree richness or beaten by beech? For. Ecol. Manag. 2008, 256, 272–281. [Google Scholar] [CrossRef]
  74. Zhang, Y.; Zhang, S.; Ma, K.; Fu, B.; Anand, M. Woody species diversity in forest plantations in a mountainous region of Beijing, China: Effects of sampling scale and species selection. PLoS ONE 2014, 9, e115038. [Google Scholar] [CrossRef]
  75. Harpole, W.S.; Sullivan, L.L.; Lind, E.M.; Firn, J.; Adler, P.B.; Borer, E.T.; Chase, J.; Fay, P.A.; Hautier, Y.; Hillebrand, H.; et al. Addition of multiple limiting resources reduces grassland diversity. Nature 2016, 537, 93–96. [Google Scholar] [CrossRef]
  76. Canadell, J.; Jackson, R.B.; Ehleringer, J.R.; Mooney, H.A.; Sala, O.E.; Schulze, E.-D. Maximum rooting depth of vegetation types at the global scale. Oecologia 1996, 108, 583–595. [Google Scholar] [CrossRef] [PubMed]
  77. Jansa, J.; Finlay, R.; Wallander, H.; Smith, F.A.; Smith, S.E. Role of mycorrhizal symbiosis in phosphorus cycling. In Phosphorus in Action; Varma, A., Bünemann, E., Oberson, A., Frossard, E., Eds.; Springer: Berlin/Heidelberg, Germany, 2011; pp. 137–168. ISBN 978-3-642-15270-2. [Google Scholar]
  78. Akhmetzhanova, A.A.; Soudzilovskaia, N.A.; Onipchenko, V.G.; Cornwell, W.K.; Agafonov, V.A.; Selivanov, I.A.; Cornelissen, J.H.C. A rediscovered treasure: Mycorrhizal intensity database for 3000 vascular plant species across the former Soviet Union. Ecology 2012, 93, 689–690. [Google Scholar] [CrossRef] [Green Version]
  79. Harley, J.L.; Smith, S.E. Mycorrhizal Symbiosis; Academic Press: London, UK, 1983. [Google Scholar]
  80. Bodeker, I.T.M.; Clemmensen, K.E.; Boer, W.d.; Martin, F.; Olson, A.; Lindahl, B.D. Ectomycorrhizal Cortinarius species participate in enzymatic oxidation of humus in northern forest ecosystems. New Phytol. 2014, 203, 245–256. [Google Scholar] [CrossRef] [PubMed]
  81. Soudzilovskaia, N.A.; van der Heijden, M.G.A.; Cornelissen, J.H.C.; Makarov, M.I.; Onipchenko, V.G.; Maslov, M.N.; Akhmetzhanova, A.A.; van Bodegom, P.M. Quantitative assessment of the differential impacts of arbuscular and ectomycorrhiza on soil carbon cycling. New Phytol. 2015, 208, 280–293. [Google Scholar] [CrossRef] [PubMed]
  82. Rosling, A.; Midgley, M.G.; Cheeke, T.; Urbina, H.; Fransson, P.; Phillips, R.P. Phosphorus cycling in deciduous forest soil differs between stands dominated by ecto- and arbuscular mycorrhizal trees. New Phytol. 2016, 209, 1184–1195. [Google Scholar] [CrossRef] [PubMed] [Green Version]
  83. Herben, T. Bryophytes in grassland vegetation sample plots: What is their correlation with vascular plants? Folia Geobot. Phytotax. 1987, 22, 35–41. [Google Scholar] [CrossRef]
  84. Vellak, K.; Paal, J.; Liira, J. Diversity and distribution pattern of bryophytes and vascular plants in a boreal spruce forest. Silva Fenn. 2003, 37. [Google Scholar] [CrossRef] [Green Version]
  85. Albers, D. Decomposition of beech leaves (Fagus sylvatica) and spruce needles (Picea abies) in pure and mixed stands of beech and spruce. Soil. Biol. Biochem. 2004, 36, 155–164. [Google Scholar] [CrossRef]
  86. Berger, T.W.; Berger, P. Greater accumulation of litter in spruce (Picea abies) compared to beech (Fagus sylvatica) stands is not a consequence of the inherent recalcitrance of needles. Plant Soil 2012, 358, 349–369. [Google Scholar] [CrossRef] [Green Version]
  87. Berger, T.W.; Berger, P. Does mixing of beech (Fagus sylvatica) and spruce (Picea abies) litter hasten decomposition? Plant Soil 2014, 377, 217–234. [Google Scholar] [CrossRef] [PubMed] [Green Version]
  88. Brown, D.H. Mineral nutrition. In Bryophyte Ecology; Smith, A.J.E., Ed.; Chapman & Hall: London, UK, 1982; pp. 383–444. [Google Scholar]
  89. Frahm, J.-P. Moose als Bioindikatoren; Quelle und Meyer: Wiesbaden, Germany, 1998; ISBN 3-494-01271-7. [Google Scholar]
  90. Beike, A.K.; Decker, E.L.; Frank, W.; Lang, D.; Vervliet-Scheebaum, M.; Zimmer, A.D.; Reski, R. Applied Bryology—Bryotechnology. Trop. Bryol. 2010, 31, 22–32. [Google Scholar]
  91. Chapin, F.S.; Oechel, W.C.; van Cleve, K.; Lawrence, W. The role of mosses in the phosphorus cycling of an Alaskan black spruce forest. Oecologia 1987, 74, 310–315. [Google Scholar] [CrossRef] [PubMed]
Figure 1. European beech (n = 101) and Norway spruce forest stands (n = 99) in Germany included in our analysis on linkages between α-diversity, organic/soil layer P variables, and phosphorus use efficiency indices.
Forests 10 01156 g001
Figure 2. Correlations of overall species richness with P-related variables in the (a,b) organic layer and (c,d) different soil depths in European beech forest ecosystems.
Forests 10 01156 g002
Figure 3. Relationship between overall species richness and P-related variables in the (a,b) organic layer and (c,d) different soil depths in Norway forest ecosystems.
Forests 10 01156 g003
Figure 4. P nutrition status and phosphorus use efficiencies of (AE) European beech and (FJ) Norway spruce and diversity in relation to the overall α-diversity in both forest types (for reasons of clarity we have presented one diversity index per graph).
Forests 10 01156 g004
Table 1. Mean (range) site conditions of the studied European beech and Norway spruce plots. Temperature and precipitation are for the period 1961–2006.
ParameterEuropean Beech (n = 101)Norway Spruce (n = 99)
Tree age (years)87 (14–200)61 (21–129)
Altitude (m above sea level)300 (9–660)390 (18–935)
Temperature (°C)8.3 (6.3–10.5)7.7 (4.8–9.7)
Precipitation (mm)824 (337–1783)727 (359–1782)
pH (CaCl2, mineral soil 0–90 cm)4.5 (3.5–7.6)3.9 (3.2–7.4)
Soil depth (cm)61 (0–230)97 (0–210)
Soil types
Cambisol5661
Gleysol12
Leptosol70
Luvisol218
Podzol011
Stagnosol1616
Table 2. Phosphorus-related parameters for forest types and dominant tree species. Mean, standard error (SE) and range of P nutrition status, phosphorus use efficiency indices, and P-related parameters in the organic layer and mineral soil of European beech and Norway spruce forests are shown. Values in bold indicate significant differences (p < 0.05) between forest types according to the Kruskal-Wallis test (NAs = missing values).
ParametersEuropean BeechNorway Spruce
Mean (SE)RangeNAsMean (SE)RangeNAs
P nutrition status (g P kg−1)1.16 (0.02)0.72–1.7431.31 (0.02)0.78–1.947
P recycling efficiency (g P kg−1)1.4 (0.05)0.8–3.5121.6 (0.07)0.0–5.221
P uptake efficiency 0–5 cm (g P kg−1)2.9 (0.16)(0.6–9.0)54.2 (0.33)(0.0–17.3)9
P uptake efficiency 5−10 cm (g P kg−1)3.7 (0.21)0.6–10.755.1 (0.46)0.0–34.59
P utilization efficiency13.3 (0.44)5.8–30.334.3 (0.11)1.8–7.87
P stock organic layer (kg P ha−1)22.0 (2.2)2.0–27.0071.9 (9.7)7.8–969.00
P content organic layer (g P kg−1)0.86 (0.02)0.38–1.3890.86 (0.02)0.20–1.4513
P stock mineral soil 0–5 cm (kg P ha−1)194.0 (12.3)29.7–919.52159.2 (11.1)10.9–762.42
P stock mineral soil 5–10 cm (kg P ha−1)195.4 (12.3)65.3–964.02160.5 (12.3)6.34–905.12
P content mineral soil 0–5 cm (g P kg−1)0.53 (0.03)0.14–2.2320.46 (0.03)0.05–1.750
P content mineral soil 5–10 cm (g P kg−1)0.44 (0.03)0.12–2.120.41 (0.03)0.03–1.610
C/P soil stock ratio 0–10 cm (kg P ha−1)113.7 (5.1)18.5–327.22166.7 (12.4)19.1–602.60
Table 3. Biodiversity measures for forest types and vegetation layers. Number of plots (N) and mean (range) species richness (S), Shannon index (Hs), Gini-Simpson index (1 − D), and Heip’s index of evenness (EHeip) by forest stand and vegetation layer (bold values refer to significant differences between European beech and Norway spruce forests according to the Kruskal-Wallis test).
Vegetation LayerForest TypeDiversity Indices
N S H s 1 D E H e i p
TotalEuropean beech10118 (2–44)1.05 (0–2.5)0.44 (0–0.9)0.21 (0–0.5)
Norway spruce9917 (1–67)1.07 (0–4.1)0.44 (0–1.0)0.24 (0–1)
TreeEuropean beech1012 (1–8)0.31 (0‒1.5)0.18 (0‒0.7)0.75 (0.1‒1)
Norway spruce992 (1‒5)0.22 (0‒1.0)0.12 (0‒0.6)0.78 (0.1‒1)
ShrubEuropean beech792 (1–11)0.28 (0–1.6)0.15 (0–0.8)0.85 (0.3–1)
Norway spruce623 (1–9)0.56 (0–1.8)0.30 (0–0.8)0.69 (0.1–1)
HerbEuropean beech10116 (1–43)1.83 (0–3.4)0.76 (0–1.0)0.57 (0.1–1)
Norway spruce9717 (1–66)1.70 (0–4.1)0.67 (0–1.0)0.53 (0.1–1)
MossEuropean beech333 (1–5)0.77 (0–1.6)0.45 (0–0.8)0.99 (0.8–1)
Norway spruce665 (1–12)0.98 (0–2.0)0.50 (0–0.9)0.70 (0.2–1)
Table 4. Correlation matrix between α-diversity of European beech forests separated by vegetation layer and P-related variables in the organic layer and different soil depths. Legend: VL, vegetation layer; OV, overall vegetation; TL, tree layer; SL, shrub layer; HL, herb layer; ML, moss layer; SR, species richness; SH, Shannon diversity index; SI, Gini-Simpson index; E, Heip’s index of evenness. The number of asterisks indicates the degree of significance: * is p ≤ 0.05, ** is p ≤ 0.01, and *** is p ≤ 0.001.
P Stock Organic LayerP Content Org. LayerP Content in Soil (0–5 cm)P Content in Soil (5–10 cm)
VLSRSHSIESRSHSIESRSHSIESRSHSIE
OV−0.21 *nsnsnsnsnsnsns0.27 **0.21 *nsns0.32 ***0.27 **0.22 *ns
TLns−0.23 *−0.23 *nsnsnsnsnsnsnsnsnsnsnsnsns
SLnsnsnsnsnsnsnsnsnsnsnsnsnsnsnsns
HL−0.23 *nsnsnsnsnsnsns0.25 *nsns−0.24 *0.31 **nsns−0.35 ***
MLnsnsnsnsnsnsnsnsnsnsnsnsnsnsnsns
Table 5. Correlation matrix between α-diversity of Norway spruce forests separated by vegetation layer and P-related variables in the organic layer and different soil depths. The number of asterisks indicates the degree of significance: * is p ≤ 0.05, ** is p ≤ 0.01, and *** is p ≤ 0.001.
P Stock Organic LayerP Content Organic LayerP Content in Soil (0–5 cm)P Content in Soil (5–10 cm)
VLSRSHSIESRSHSIESRSHSIESRSHSIE
OVnsnsnsns0.22 *nsns−0.35 **nsnsnsnsnsnsnsns
TLnsnsnsnsnsns−0.21 *ns−0.28 **−0.31 **−0.31 **−0.21 *−0.31 **−0.36 ***−0.36 ***0.23 *
SLnsnsnsnsnsnsnsnsnsnsnsnsnsnsnsns
HLns−0.33 ***−0.38 ***−0.39 ***0.23 *nsnsns0.23 *0.23 *0.21 *ns0.23 *0.2 *nsns
ML0.39 **0.25 *ns−0.31 *0.38 **0.34 **0.34 **nsnsnsns0.35 **nsnsnsns
Table 6. Correlation matrix between phosphorus use efficiencies and α-diversity separated by vegetation layer in European beech and Norway spruce forests. The number of asterisks indicates the degree of significance: * is p ≤ 0.1, * is p ≤ 0.05, ** is p ≤ 0.01, and *** is p ≤ 0.001.
Phosphorus Use EfficienciesForest EcosystemTree LayerShrub LayerHerb LayerMoss Layer
SRSHSIESRSHSIESRSHSIESRSHSIE
P nutrition statusEuropean beechnsnsnsnsns0.210.22nsnsnsnsnsnsnsnsns
Norway spruce−0.18−0.21 *−0.21 *nsnsnsnsns0.24 *nsnsnsnsnsnsns
P recycling efficiencyEuropean beechns0.180.17nsnsnsnsnsns−0.25 *−0.23 *nsnsnsnsns
Norway sprucensnsnsnsnsnsnsnsnsnsnsns−0.29 *nsnsns
P uptake eff. (0–5 cm)European beechnsnsnsnsnsnsnsns−0.23 *nsns0.20 *nsnsnsns
Norway spruce0.22 *0.28 **0.29 **nsnsnsnsnsns−0.18−0.18nsnsnsns−0.37 **
P uptake eff. (5–10 cm)European beechnsnsnsnsnsnsnsns−0.31 **nsns0.32 **ns−0.32−0.31ns
Norway spruce0.25 *0.32 **0.32 **−0.17nsnsnsnsnsnsnsnsnsnsns−0.29 *
P utilization efficiencyEuropean beechnsnsnsnsnsnsnsnsnsnsnsnsnsnsnsns
Norway sprucensnsnsnsnsnsns−0.36 **nsnsns−0.21 *0.32 *ns0.26 *−0.24

