1. Introduction
A fire is a primary disaster in forests, disturbing biodiversity and forest wealth. Forest fires sometimes destroy human settlements and cause loss of life and property. The forest fires in South Korea occur mainly in the dry season (from winter to spring), and are mostly caused by humans. As a forest fire burns off vegetation, soil, organic matter, and moisture, there is a danger of landslides or other secondary disasters during the summer rainy season. In the Republic of Korea, there were 6,588 forest fires from 2004 to 2018. The total area affected was 11,065 hectares, and the damage amounted to US
$ 252 million [
1].
A strategy is needed to recover from the damage and to respond to secondary disasters by rapidly investigating the burn severity. Burn severity is mainly investigated by field survey or visual interpretation of satellite imagery. Field surveys need a lot of labor, incur high costs, and take time. Satellite imagery has limited uses based on weather conditions and image resolution. Therefore, a rapid and efficient method is needed to investigate burn severity. The unmanned aerial vehicle (UAV) is widely used in various fields. UAVs and sensors provide high-resolution data when users want them, and they are less affected by atmospheric conditions [
2,
3,
4,
5]. In most cases, UAVs can acquire images right after a forest fire even though the location and time of a forest fire cannot be anticipated [
6,
7].
Previous studies used spaceborne or airborne multispectral imagery to analyze burn severity. The traditional methods are comparisons of spectral indices pre- and post-fire [
8,
9]. The normalized difference vegetation index (NDVI) and the normalized burn ratio (NBR) are well-known as spectral indices sensitive to forest fire damage [
10,
11,
12,
13]. Recent studies widely used NBR and the burned area index (BAI) because shortwave infrared (SWIR) bands are more sensitive to forest fire damage [
14,
15,
16]. UAV or high-resolution satellite images have to use visible-near infrared (VNIR) bands because they do not have SWIR bands.
Burn severity incorporates both short- and long-term post-fire effects on the local and regional environment. Burn severity is defined as the degree to which an ecosystem has changed as a result of the fire. Vegetation rehabilitation may specifically vary based on burn severity after a fire [
17,
18,
19,
20,
21,
22]. Previous studies classified burn severity into four or five classes, such as extreme, high, moderate, low, and unburned, using remote sensing data based on the composite burn index (CBI) suggested by the United States Forest Service [
23,
24,
25]. Those classes might not be clear enough to define burn severity with remote sensing data. One study suggested a Korean CBI (KCBI) by adjusting the CBI classes to burned crown, boiled crown, moderate (a mix of burned crown and burned surface), low (burned surface only), and unburned [
26]. But
low and
unburned are challenging classes. They look similar from nadir views of the crown because the class
low means a burned surface under an unburned crown. Also, the Korean forest has a very high canopy density. These characteristics add limitations to classifying severity as low or unburned. Therefore, a method is needed to classify low and unburned severity using remotely sensed imagery that might contribute to estimating damaged areas and establishing a recovery plan.
This study tries to analyze multispectral UAV images that can be used to classify burn severity, including surfaces in the study area that are classed as low under the KCBI. Sample pixels were collected from UAV multispectral images based on visual interpretation and field surveys. Spectral characteristics of the samples were analyzed, after which burn severity was classified using a spectral index and supervised classifiers. The suitability of multispectral UAV imaging for burn severity analysis is shown by the classification accuracy.
2. Study Area and Data
2.1. Study Area
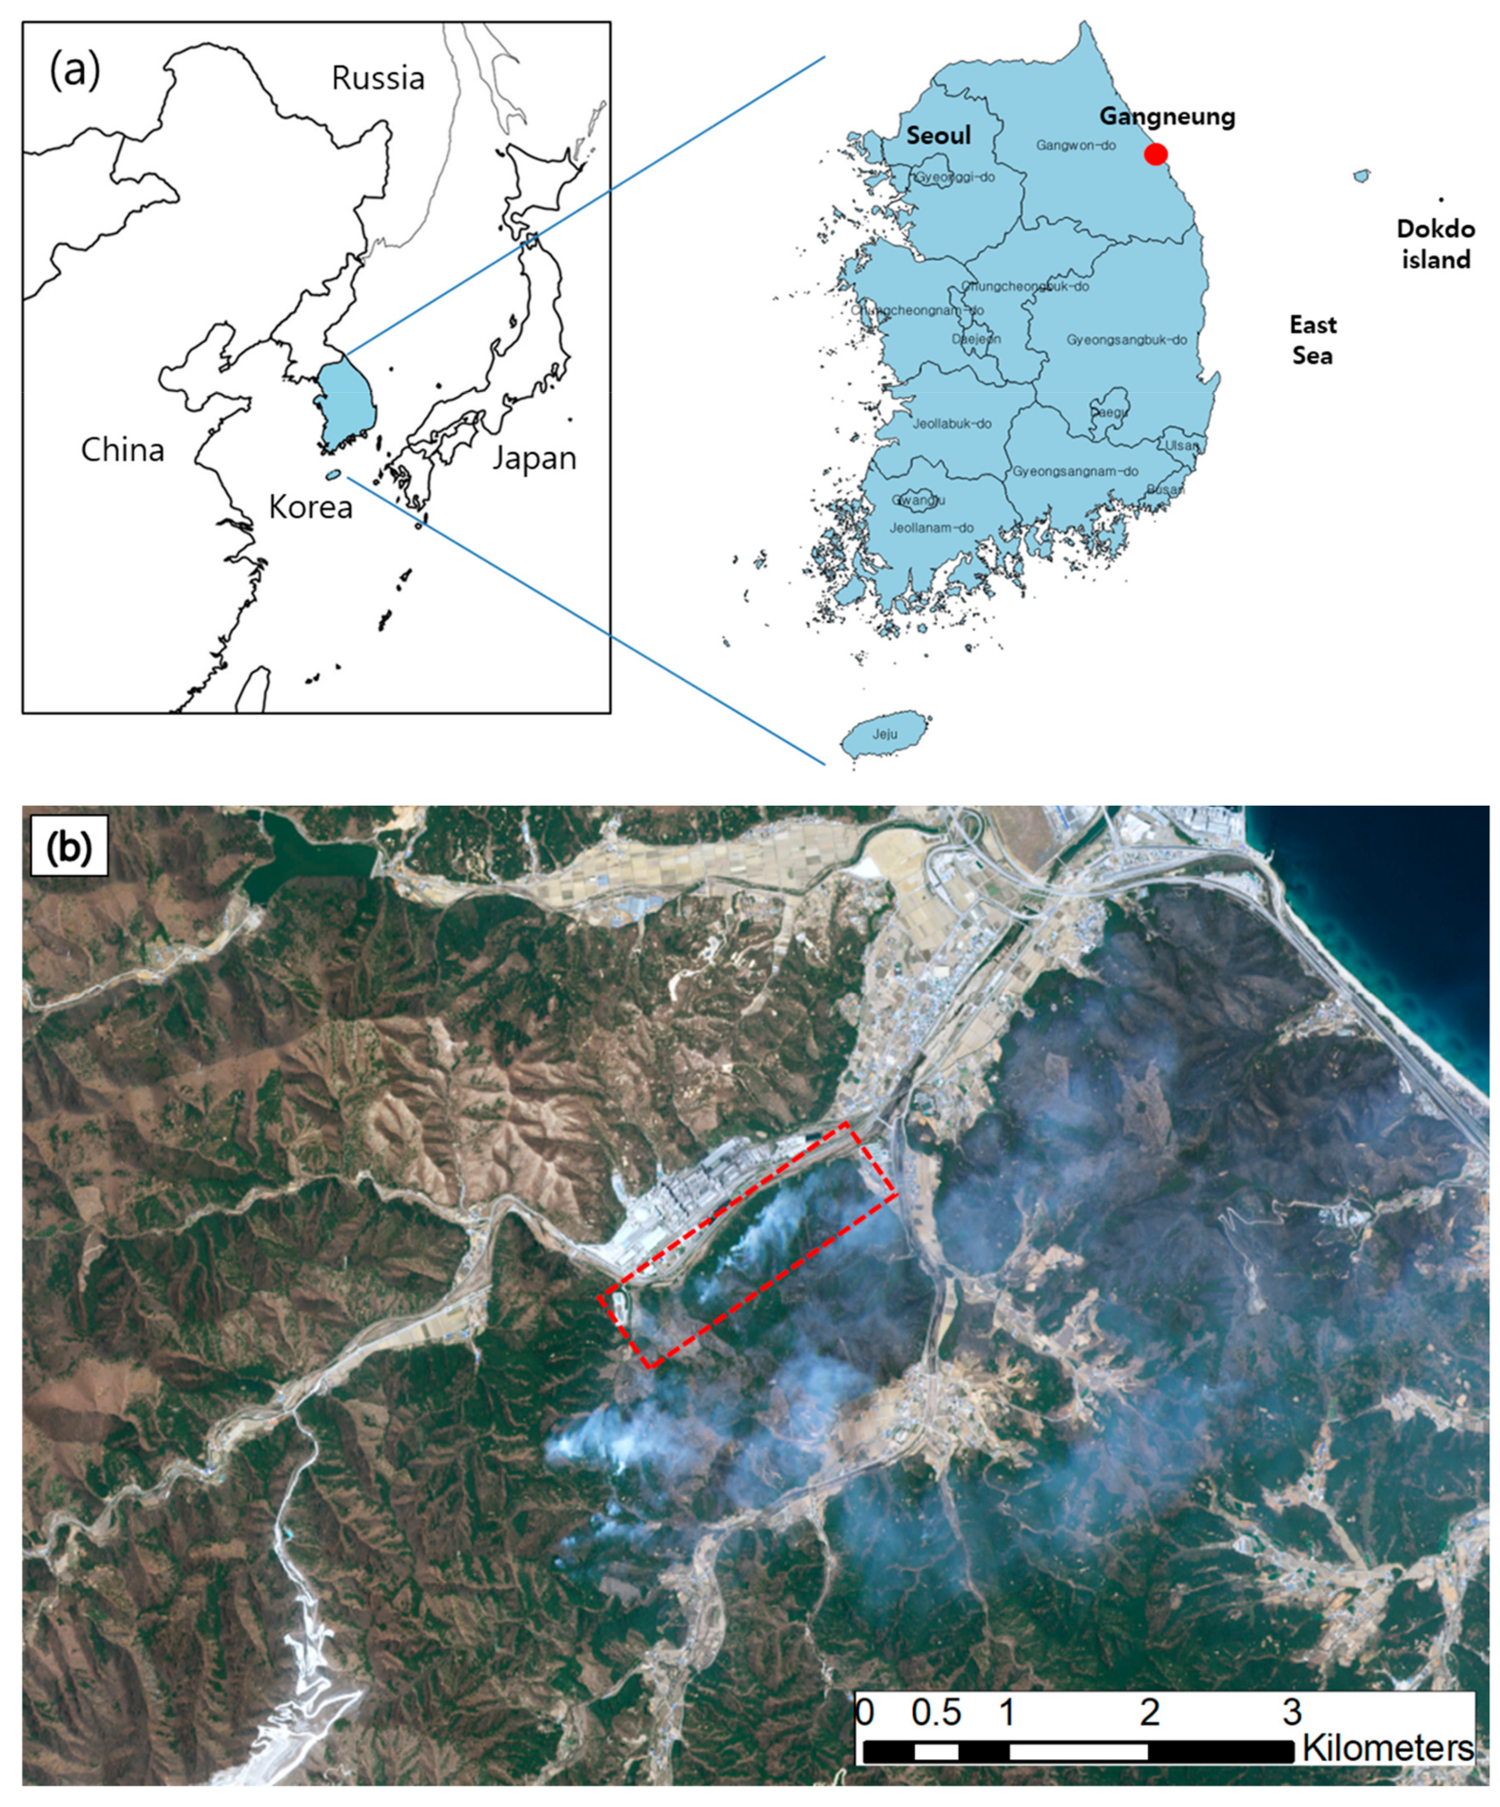
The study area is in a forest near the city of Gangneung, Republic of Korea, which is located on the coast of the East Sea, as seen in
Figure 1a. The area is very dry from winter to spring owing to a föhn wind and low precipitation. The Korean red pine (
Pinus densiflora) is the primary species in the area, which has a volatile pine resin. These environmental and climatic factors are the cause of frequent and huge forest fires. The study area was some of the damaged area from a forest fire that occurred from 4 to 5 April 2019. Seven hundred hectares burned, and US
$ 61 million was lost from this forest fire.
Figure 1b shows a KOMPSAT-3A high-resolution satellite image taken on 5 April 2019 when the forest fire was in progress, which has a spatial resolution of 2.2 m and four bands (blue, green, red, and near-infrared). The red box is the study area, which is 2 km × 0.5 km in size, located at the border of the whole damaged area, where there were various KCBI types of burn severity.
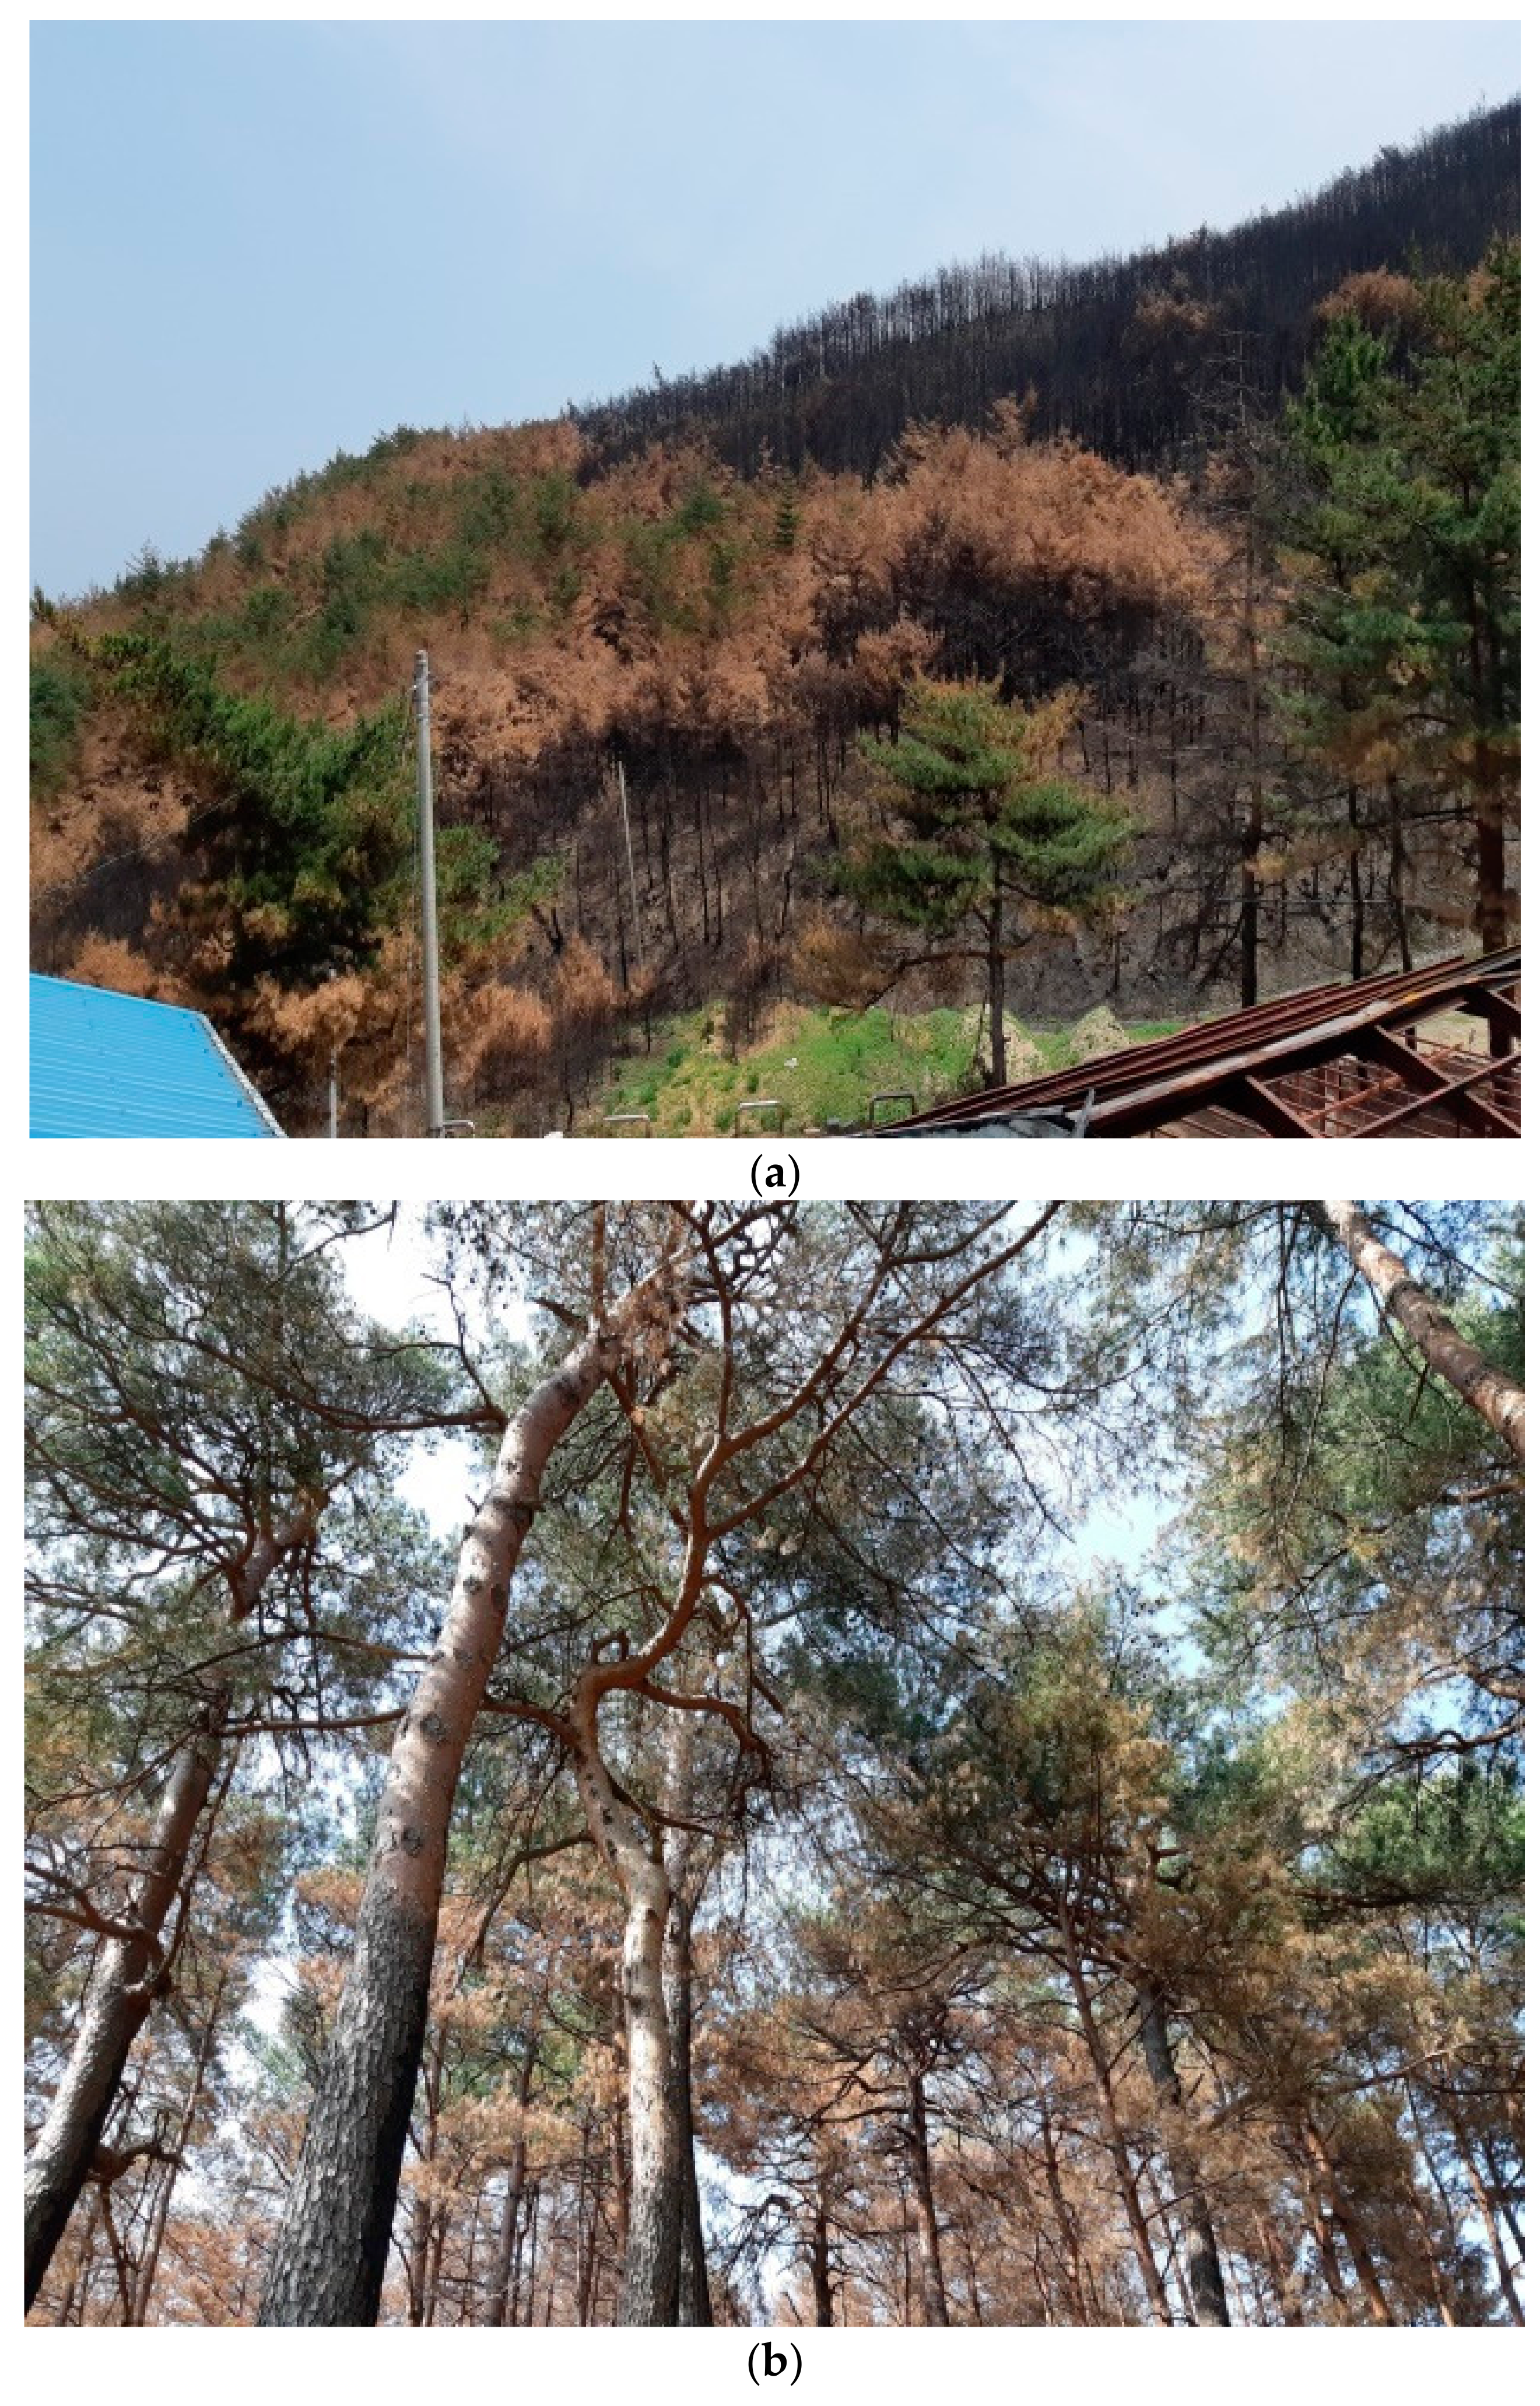
Figure 2 shows some of the damaged locations in the study area. The burned crown looks black along one ridge, and the boiled crown shows brown-colored needles in
Figure 2a. In the burned surface area, green needles are distributed in the crown, although the ground surface and the bark of the lower trunks that burned are black (
Figure 2b). A burned surface stresses the trees owing to a lack of organic matter and moisture in the soil.
2.2. Data
2.2.1. Multispectral UAV Image
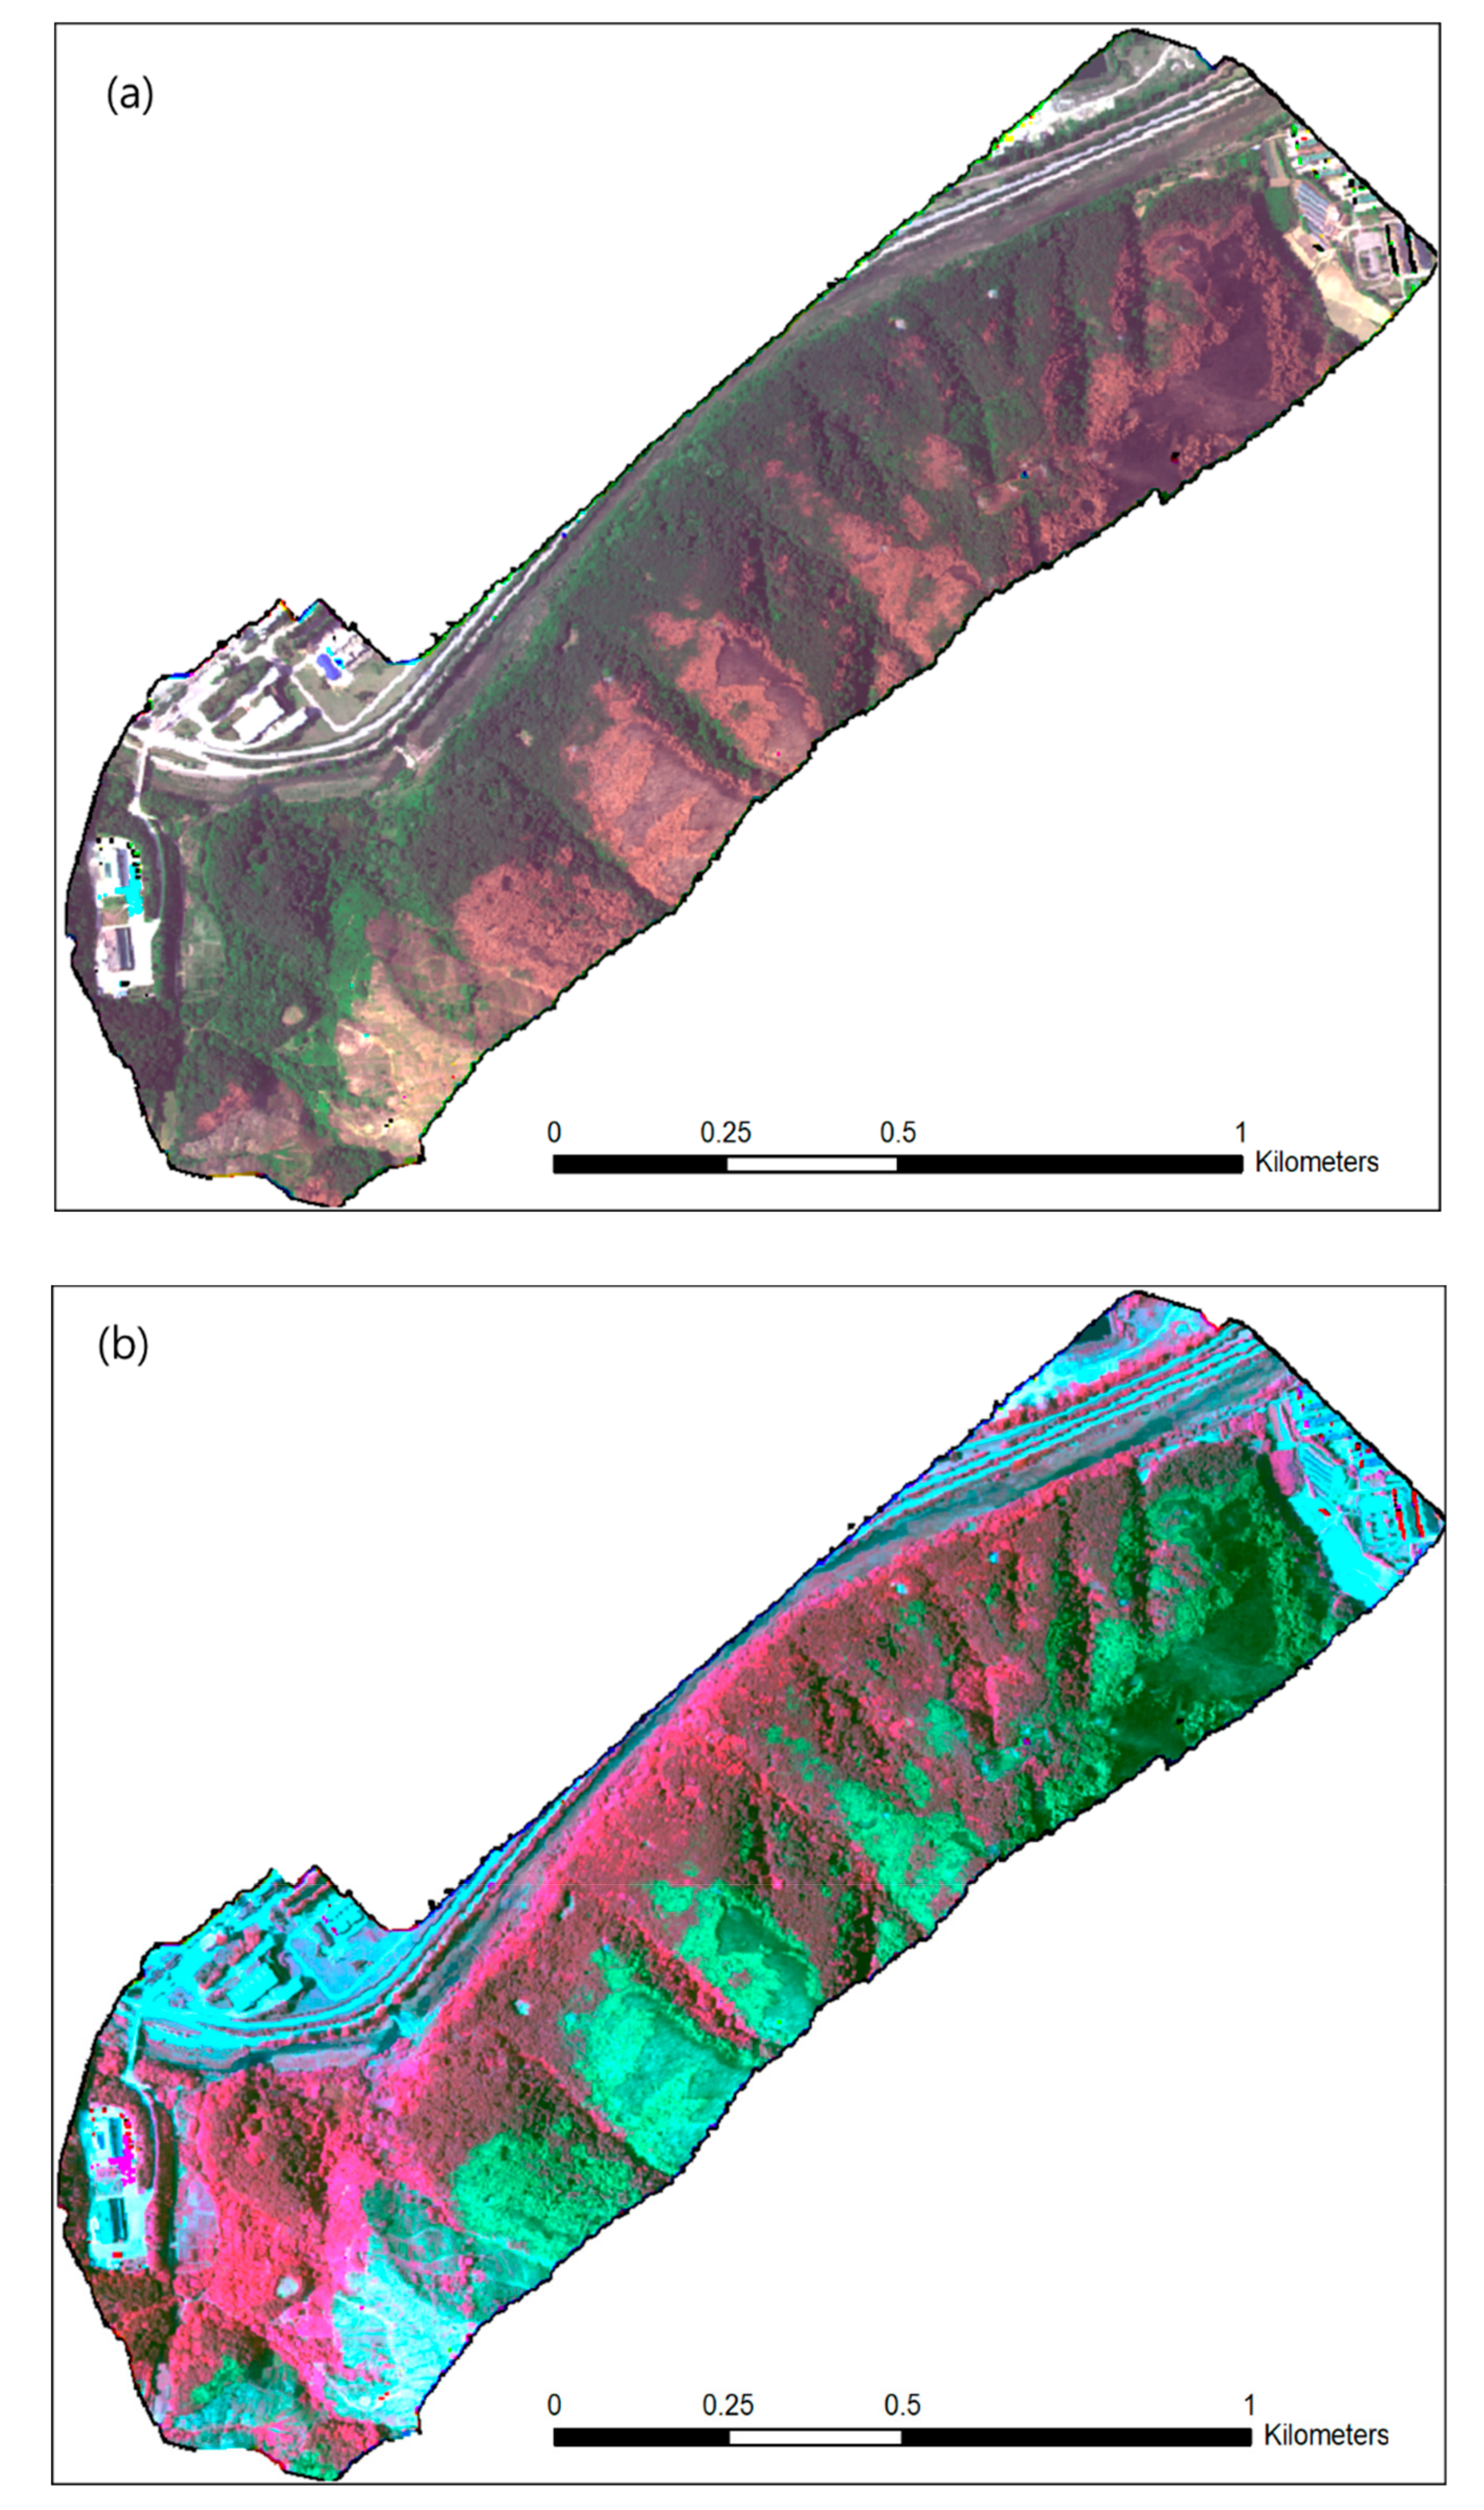
Multispectral images were acquired using a RedEdge camera (Micasense, Seattle, WA, USA) on 9 May 2019, which was more than one month after the forest fire. The camera was installed on a self-developed hexa-copter UAV that was 100 cm in diameter and 10 kg in weight. The acquired images were 214 scenes with 70% overlap and 50% sidelap. An image consisted of five bands (blue, green, red, red edge, and near infrared) that are appropriate to observe vegetation. The spatial resolution was 31 cm with a flight altitude of 500 m. The images were preprocessed to a mosaicked reflectance image using Pix4D software (Pix4 S.A., Prilly, Switzerland).
Figure 3 shows an image with (a) natural color composite and (b) pseudo-infrared composite. The image shows some distinguishable colors in
Figure 3a, which are dark brown, light brown, dark green, and light green for the burned crown, boiled crown, unburned pine trees, and deciduous trees, respectively. However, the burned surface and unburned (pine) trees cannot be classified from visual interpretation.
Figure 3b shows more clearly distinguished colors using the NIR band.
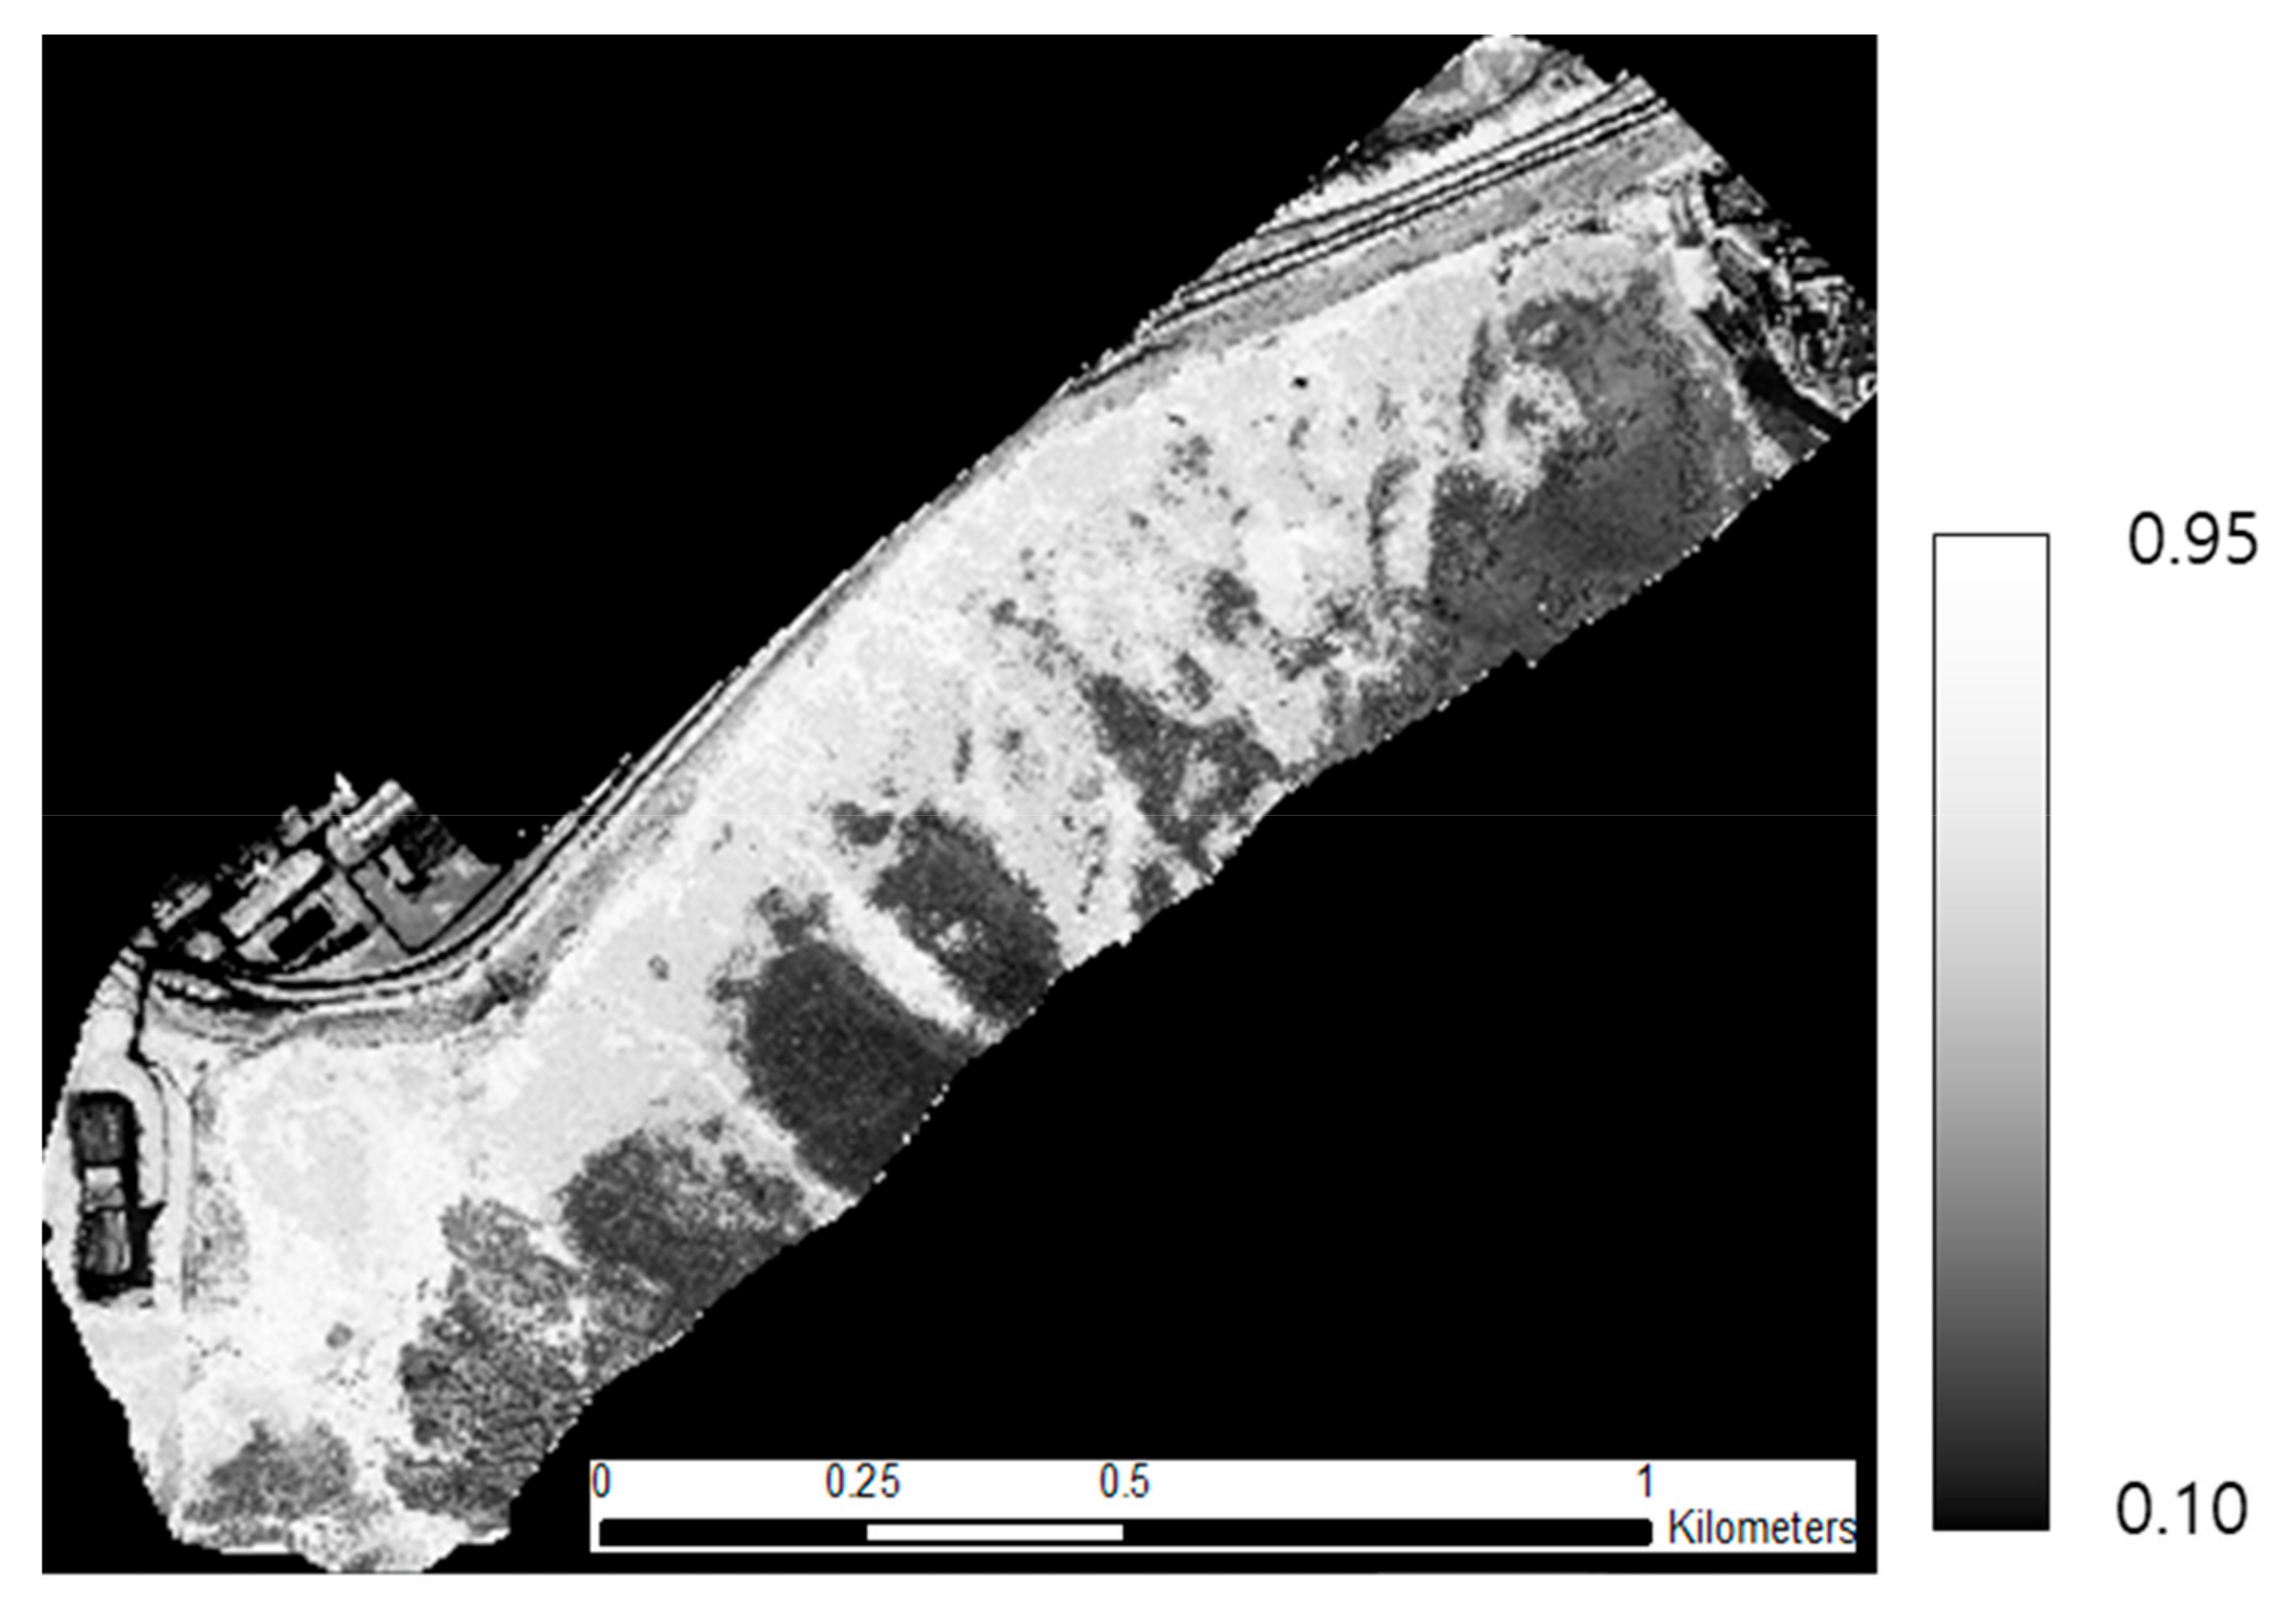
Figure 4 shows an NDVI transformed image.
2.2.2. Reference Map
A reference map was produced with screen digitizing based on a field survey, and it was used to extract samples to validate the classification results of burn severity. In screen digitizing, some classes were distinguished well by eye, such as burned crown, boiled crown, and unburned deciduous trees. The boundary between a burned surface and unburned pine was drawn on the image through a field survey.
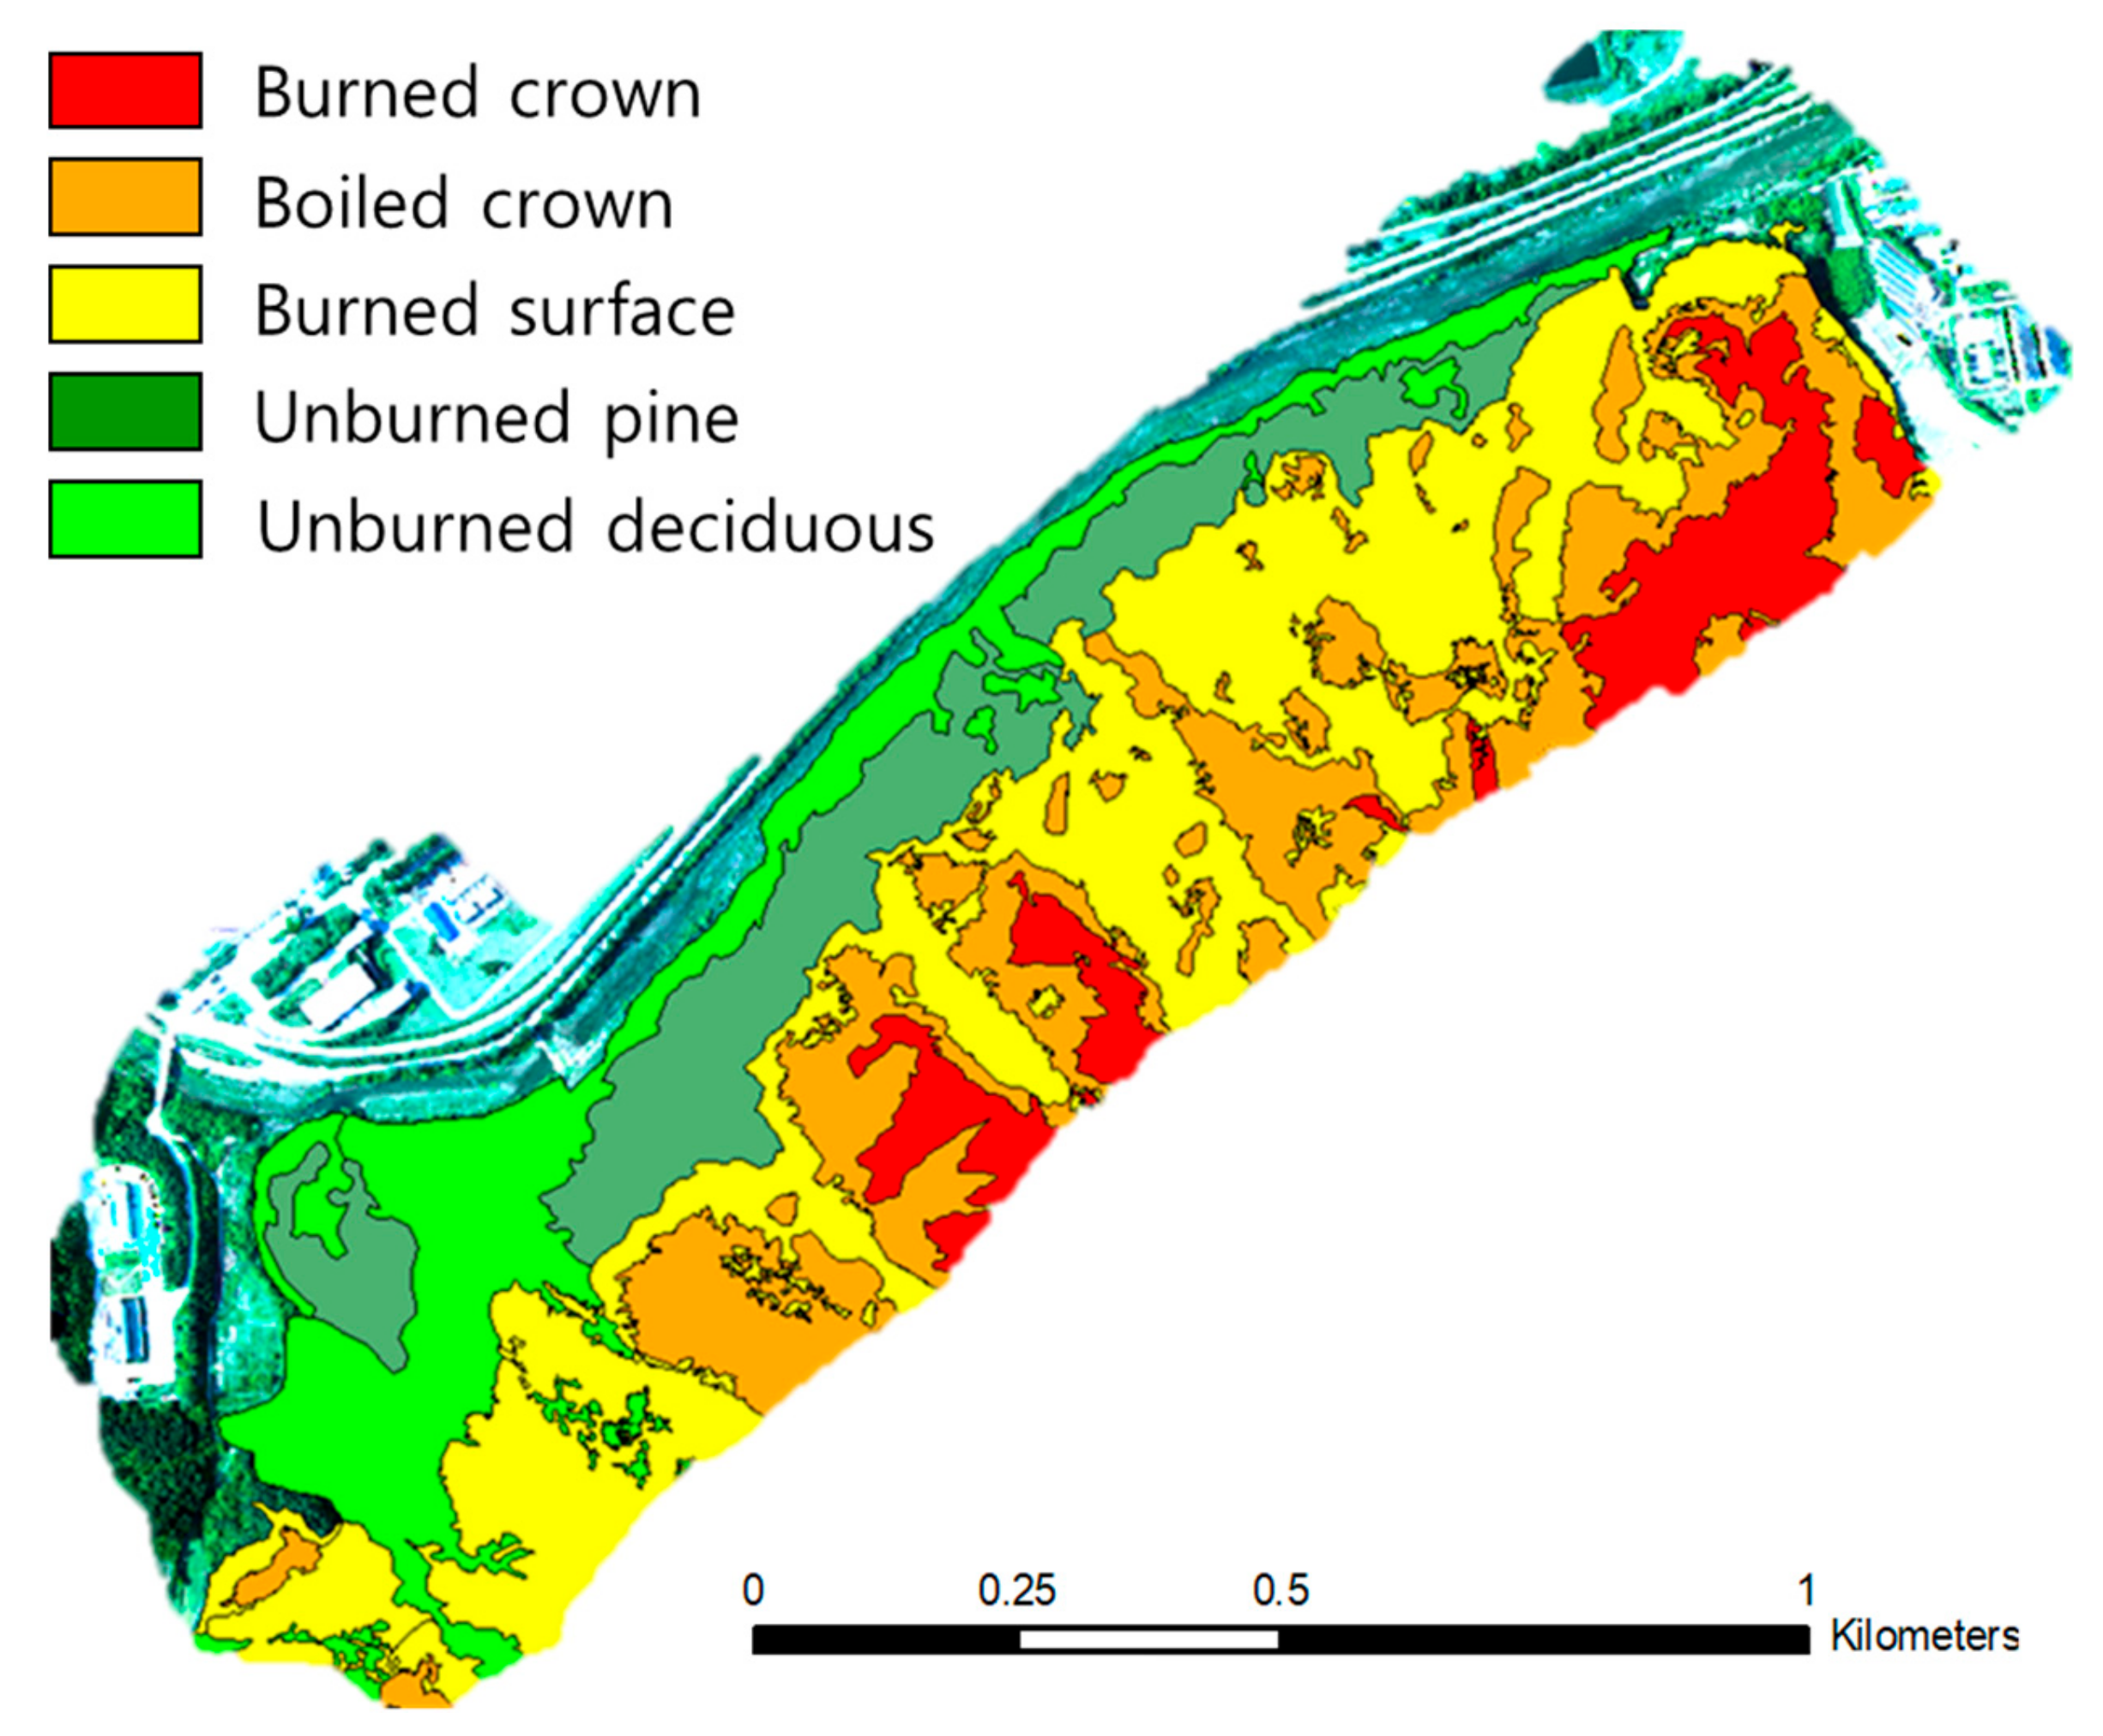
Figure 5 shows the reference map with color-coded classes. Red, orange, yellow, dark green, and light green mean burned crown, boiled crown, burned surface, unburned pine, and unburned deciduous, respectively. The classes are further defined in the following section.
3. Methods
3.1. Sample Collection and Spectral Analysis
3.1.1. Class Definition of Burn Severity
Previous studies defined classes of burn severity as extreme, high, moderate, low, and unburned. These classes might be subjective (or qualitative), and might not be considered spectral characteristics. In this study, burn severity classes are defined with consideration for both KCBI and spectral characteristics. The defined classes are burned crown, boiled crown, burned surface, unburned pine, and unburned deciduous in this study. Some classes can be compatible between KCBI and previously defined classes, such as burned crown (extreme), boiled crown (high), and burned surface (low). However, others are not compatible with each other. Moderate means a spatial mixture of burned crown and burned surface. Unburned should be classified as pine (coniferous) or deciduous, from the perspective of spectral characteristics.
3.1.2. Sample Collection
Samples were collected from a multispectral UAV image. The samples consisted of five defined classes as outlined in
Section 3.1.1. Twenty plots were selected for each class based on a field survey and visual interpretation. The plots were evenly distributed in the image, and one plot is a nine-pixel square. Therefore, 450 sample pixels were collected for each class; 180 pixels (40%) were assigned as a training set, and the other 270 pixels (60%) were used as a validation set for the classifications.
Figure 6 shows examples of the collected sample pixels.
3.1.3. Spectral Characteristics Analysis
It is necessary to know the possible burn severity classifications as prior information. The possibilities were analyzed with statistics on reflectance and from spectral indices of the training samples. The mean and standard deviation of reflectance were calculated for each class. NDVI, red edge NDVI (RE-NDVI), and the visible-band difference vegetation index (VDVI) were calculated using the mean reflectance of each class. Equations (1) to (3) show the definitions of each vegetation index, where ρ is the mean reflectance of each band:
Table 1 shows the mean values of the burn severity classes for three spectral indices where mean values were estimated from collected training samples. NDVI shows bigger gaps among the classes than other indices. NDVI might be useful in the classification of burn severity because we can easily define thresholds among classes.
3.2. Classification of Burn Severity
3.2.1. Supervised Classification
Maximum likelihood (MLH) and spectral angle mapper (SAM) were used as supervised classification methods. The MLH classifier assigns a pixel to a class with the highest probability under the assumption that reflectance values of each class have a normal (Gaussian) distribution in each band. The probability for a pixel is calculated by the multivariate normal density function from the mean, variance, and covariance of training samples [
27]. The SAM classifier calculates similarity using the spectral angle between a pixel and the mean of each class. Spectral reflectance is assumed to be a vector in n-dimensional space, where n is the number of bands. A pixel is assigned to a class with the smallest spectral angle [
28]. Equations (4) and (5) show the definitions of MLH and SAM, respectively:
where,
n, X,
Vi, and
Mi denote the number of multispectral bands, the unknown measurement vector, the covariance matrix of each training class, and the mean vector of each training class, respectively, and
where,
n,
ti, and
ri denote the number of multispectral bands, the unknown measurement vector, and the reference spectrum vector, respectively; and α denotes an angle between
r and
t vectors.
3.2.2. Spectral Index Classification
Thresholding of a spectral index is used a classification method for burn severity. In this study, NDVI was used only as a spectral index for classification because NDVI shows higher differences among classes, compared with other indices.
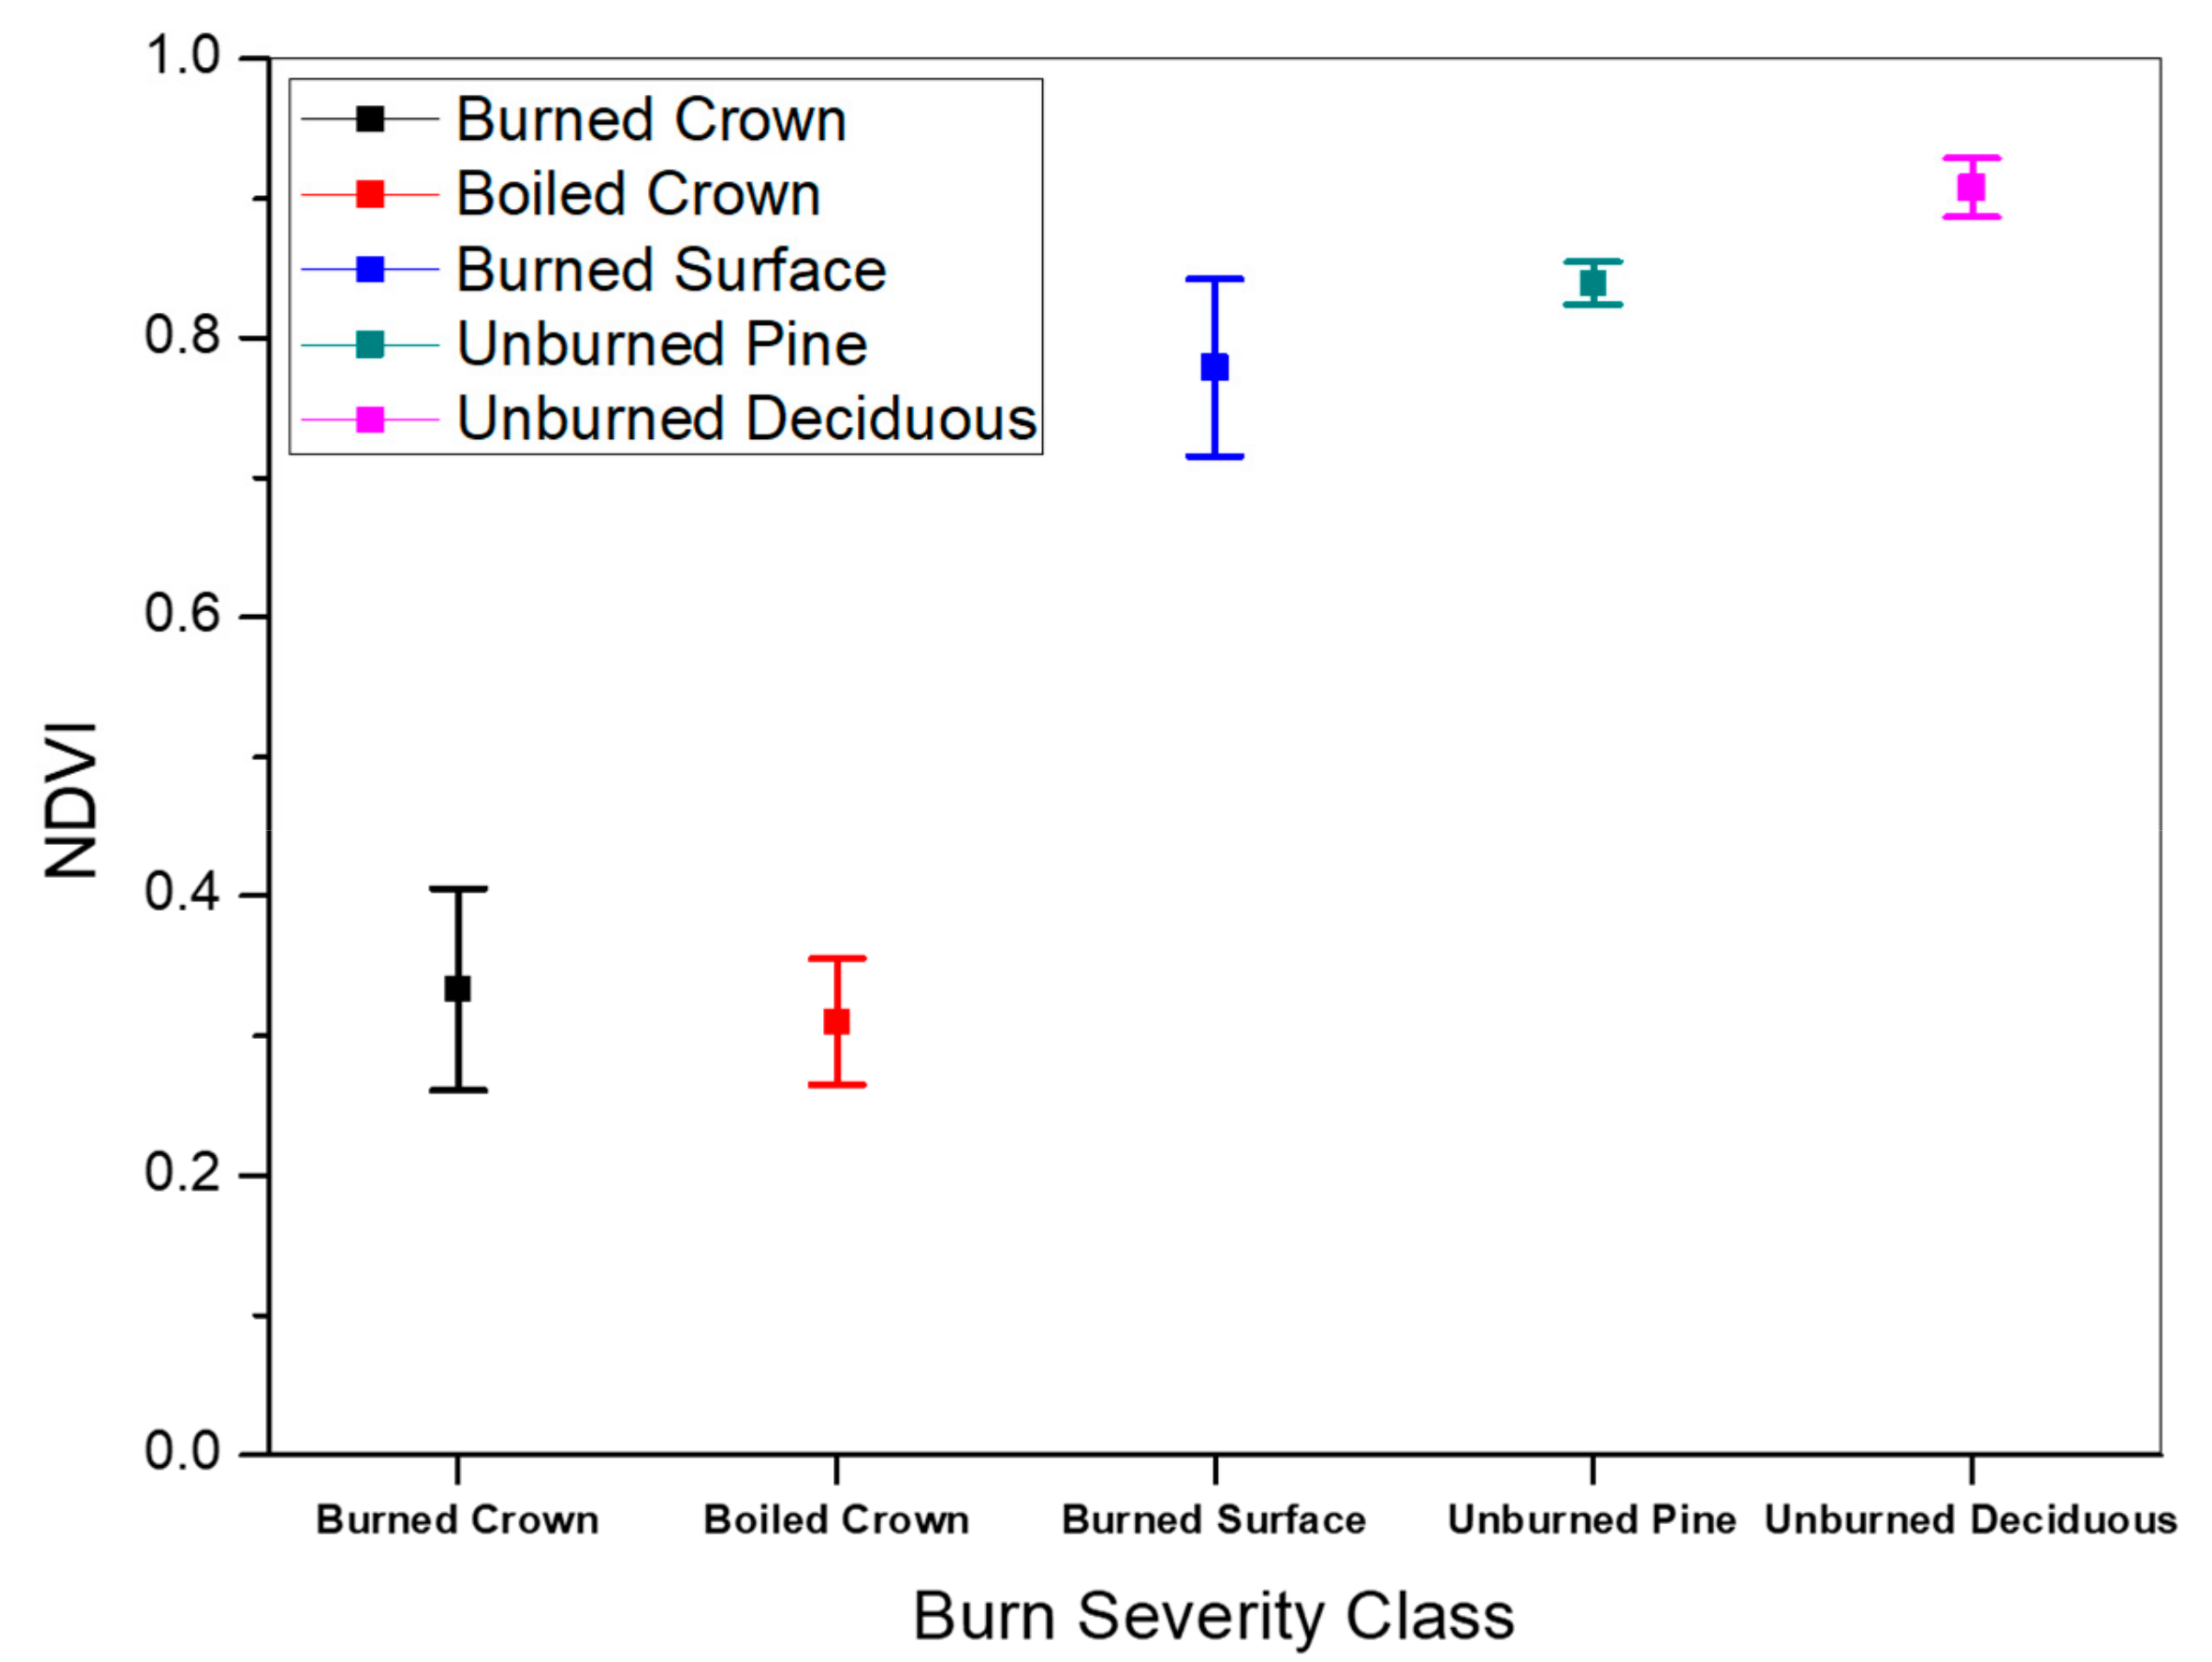
Figure 7 shows the range of NDVI values for each class, with the mean ± standard deviation. Burned crown and boiled crown are perfectly separated with burned surface, unburned pine, and unburned deciduous. However, some class pairs overlap each other, such as burned crown (boiled crown) and burned surface (unburned pine). Thresholds were defined as the median of the overlapping range between neighboring classes (
Table 2).
4. Results
4.1. Spectral Charateristics
Spectral reflectance curves were plotted for training samples; those are the mean reflectance of each band (
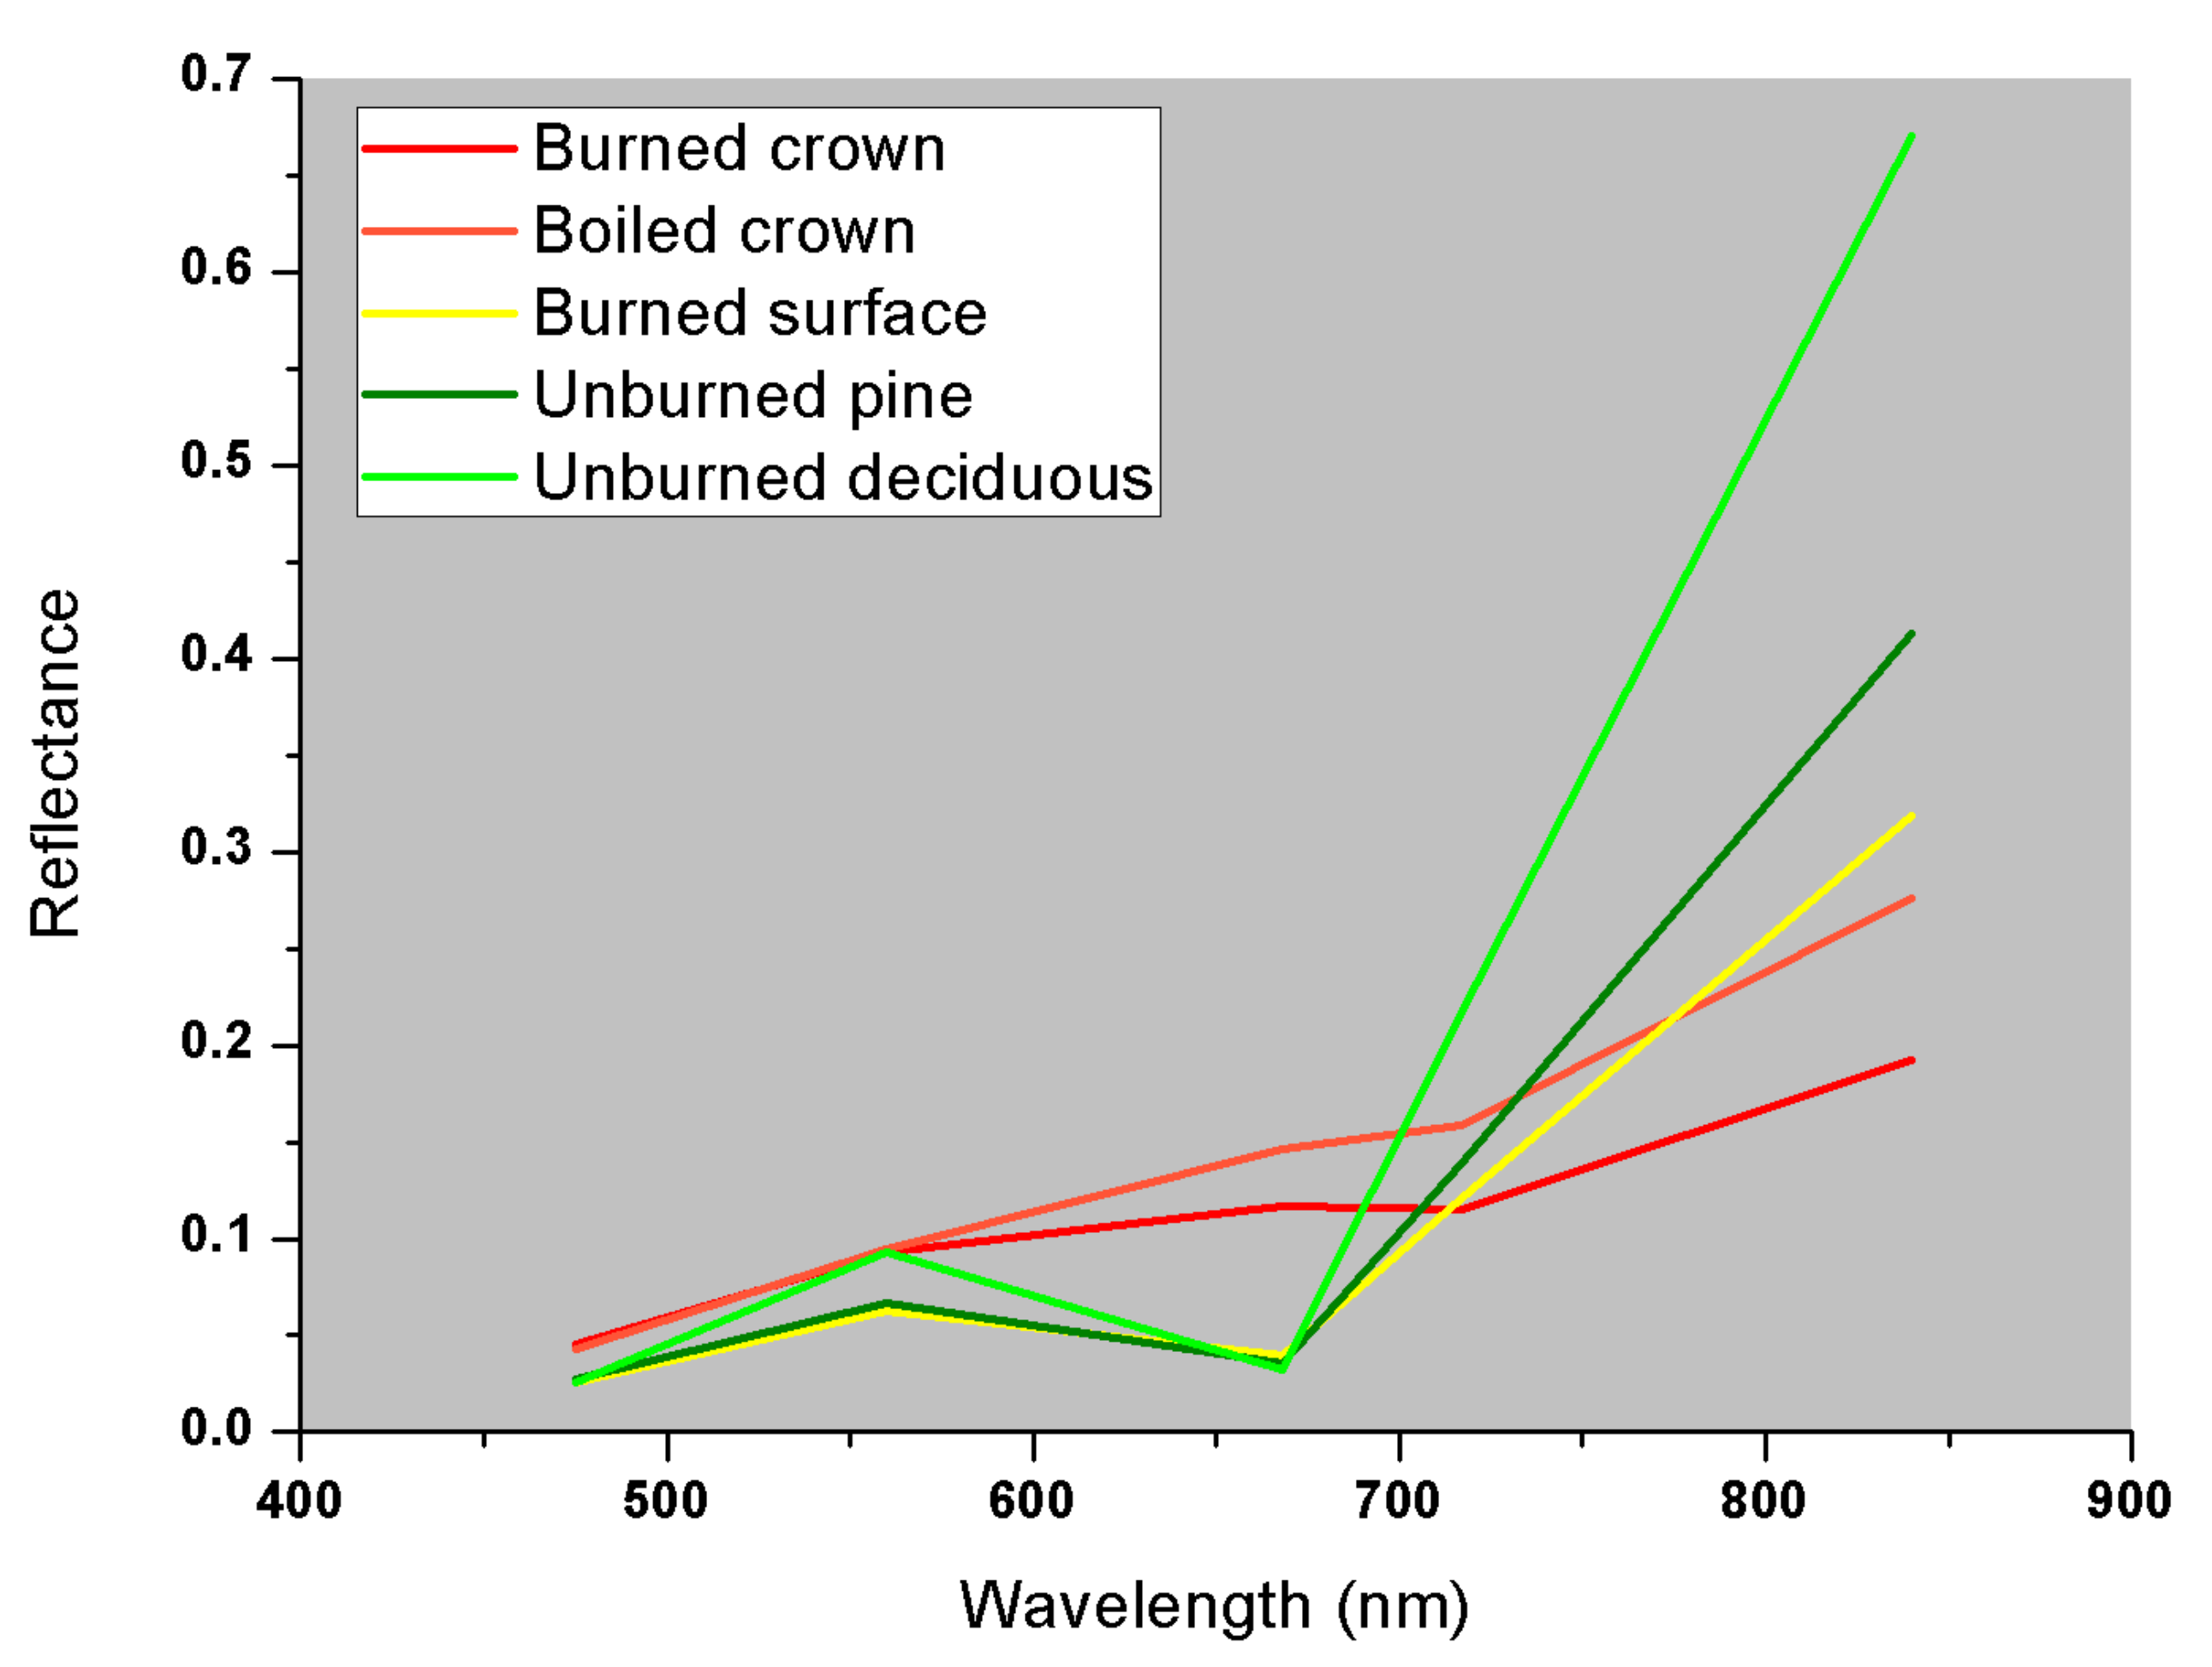
Figure 8). Burned crown shows lower reflectance than other classes because of soot and ash. In boiled crown, yellow needles show high reflectance in green (560 nm) and red (668 nm) bands, and needles are distributed in the crown, which creates higher reflectance in the near-infrared band (840 nm) than burned crown, where we can see that the spectral reflectance of boiled crown is higher in the blue (475 nm) and red bands than with unburned pine, unburned deciduous, and burned surface classes. This can be attributed to the loss of chlorophyll, a pigment that absorbs blue and red as the leaves turn yellow owing to damage from the heat. Unburned deciduous shows low reflectance in the blue and red bands, and high reflectance in the green, red edge, and NIR bands; these are typical spectral characteristics of broadleaf vegetation. This study focuses on unburned pine and burned surface classifications. Burned surface and unburned pine show similar spectral reflectance curves and an overlapped range for the mean ± standard deviation (
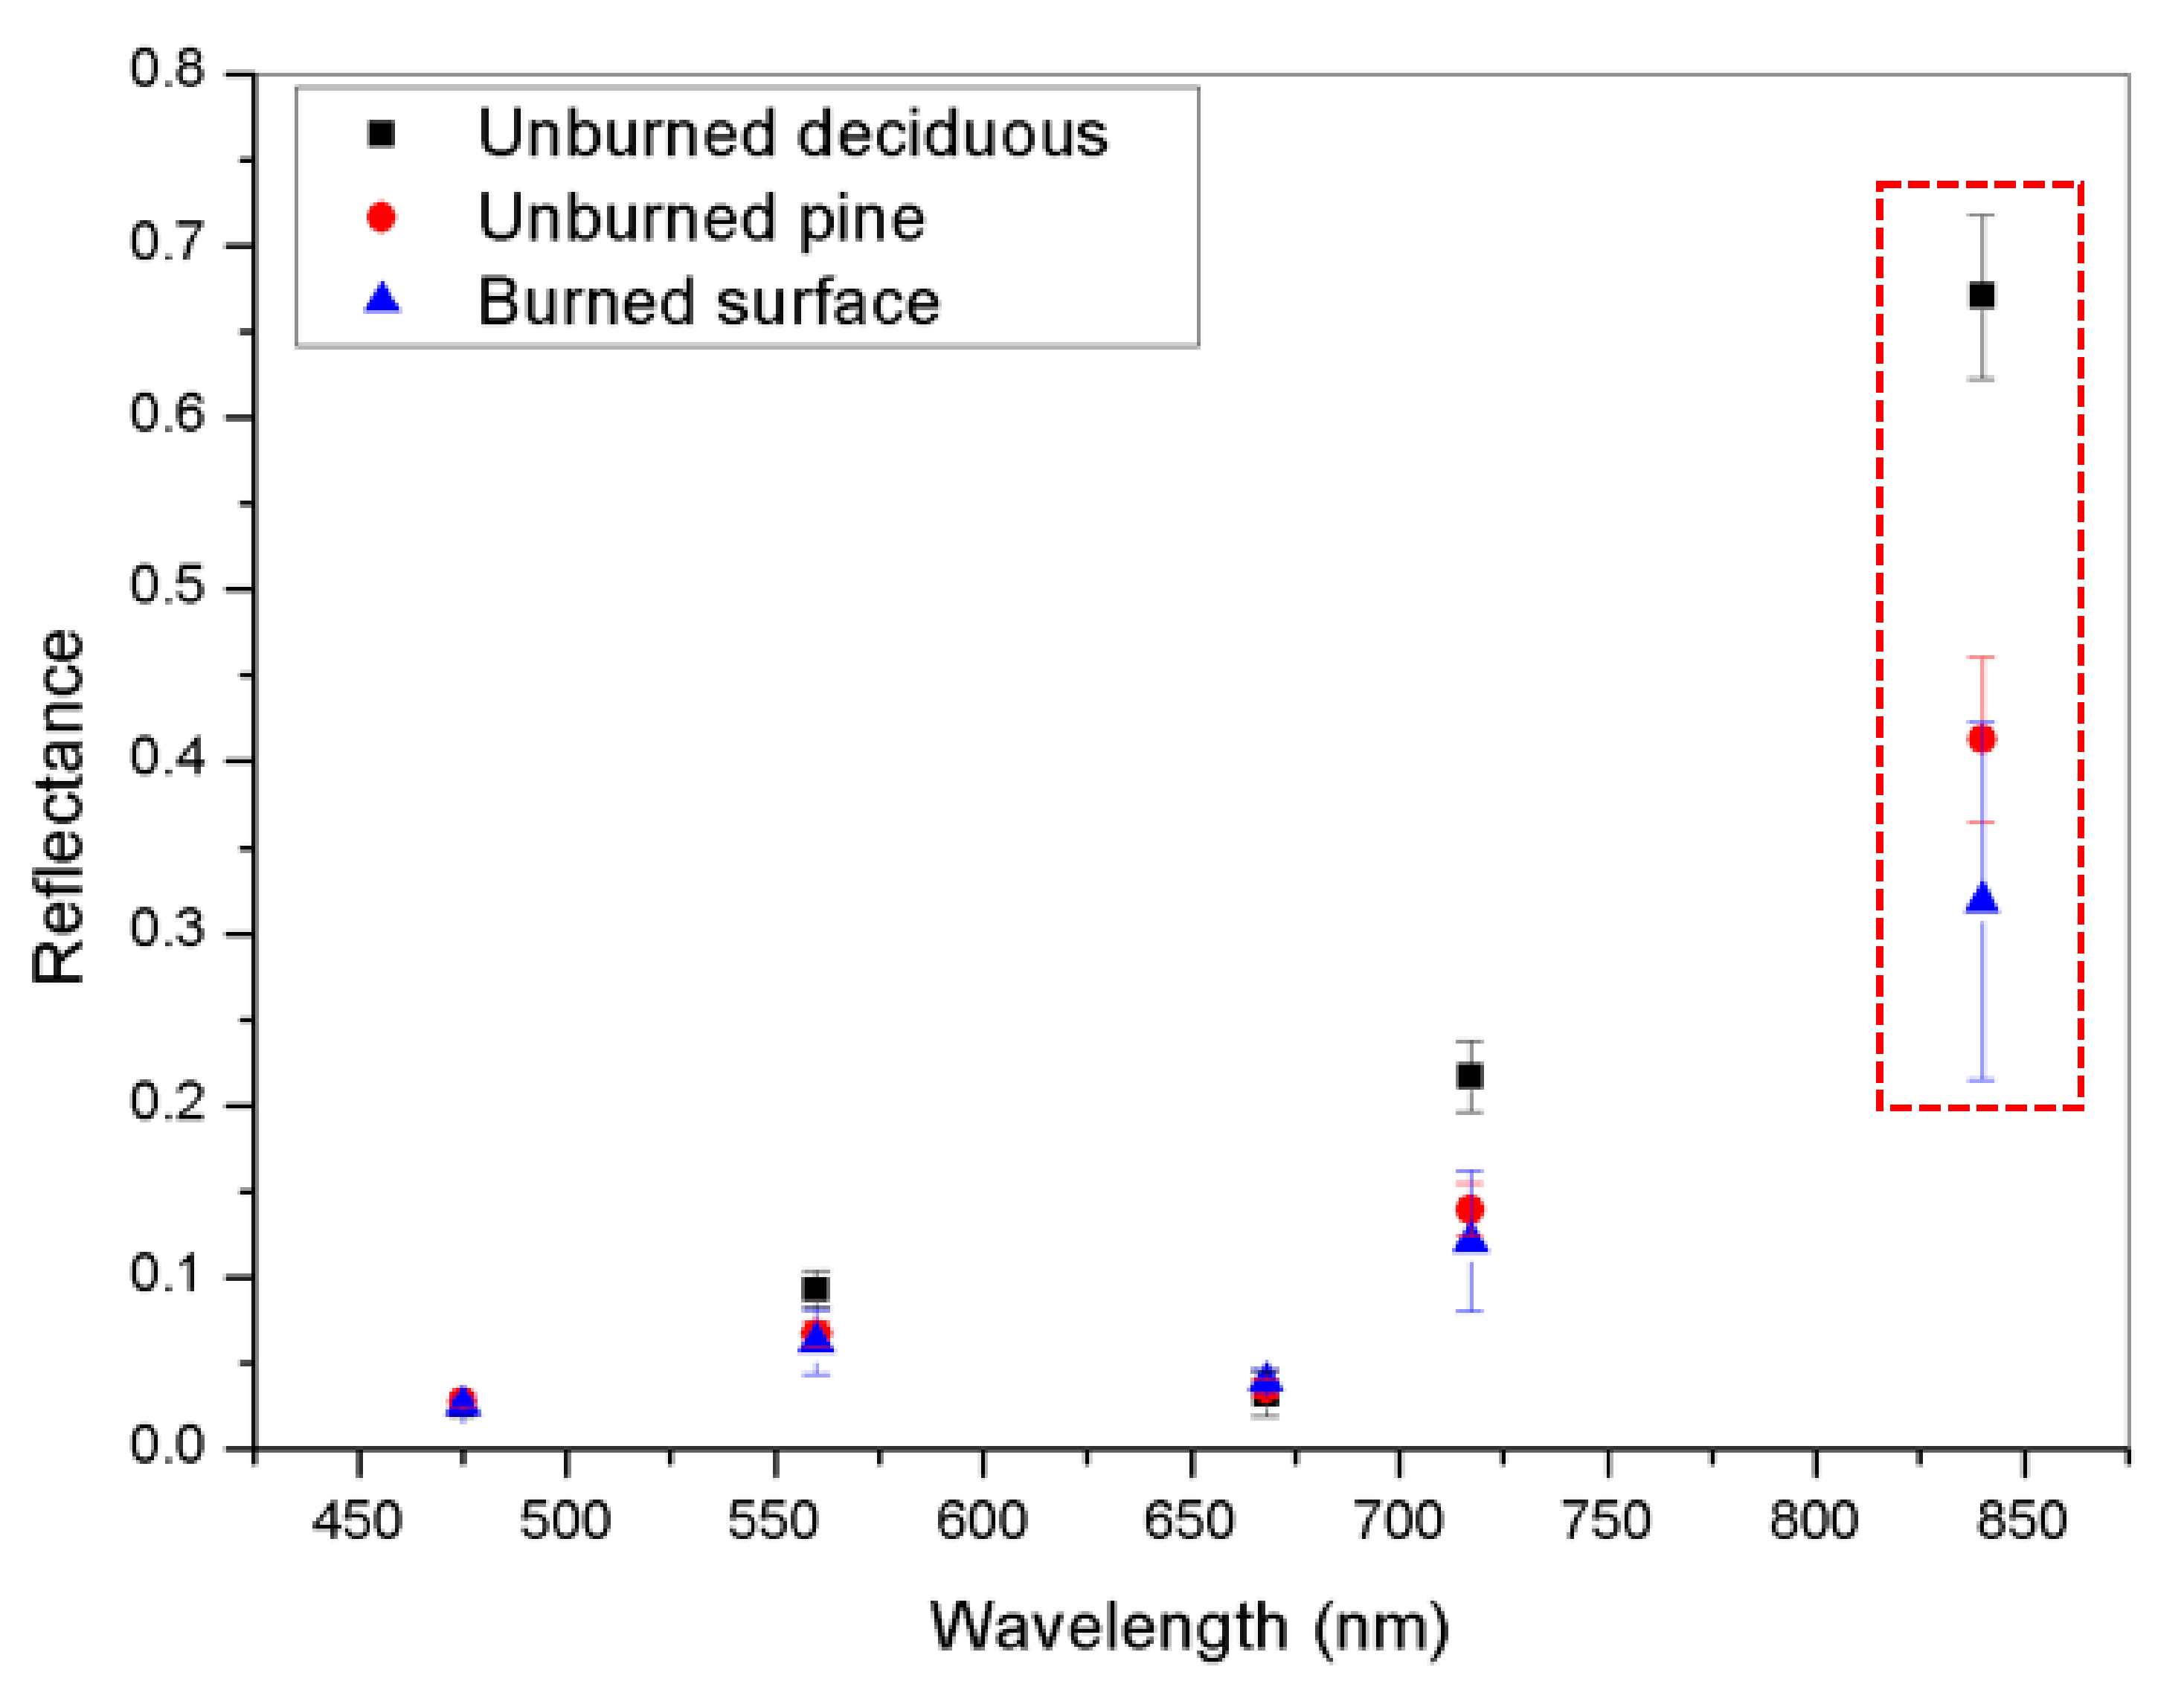
Figure 9), because they both have green needles at the top of the crown. However, a burned surface shows slightly higher reflectance at the red edge, and lower reflectance at the NIR bands. This is called the red-edge shift phenomenon, where the center wavelength of the red edge between the red and NIR bands slightly shifts to a shorter wavelength [
29]. The reason for the red-edge shift is known to be decreased vitality owing to stress. Therefore, a burned surface and unburned pine might be classified using slightly different spectral characteristics.
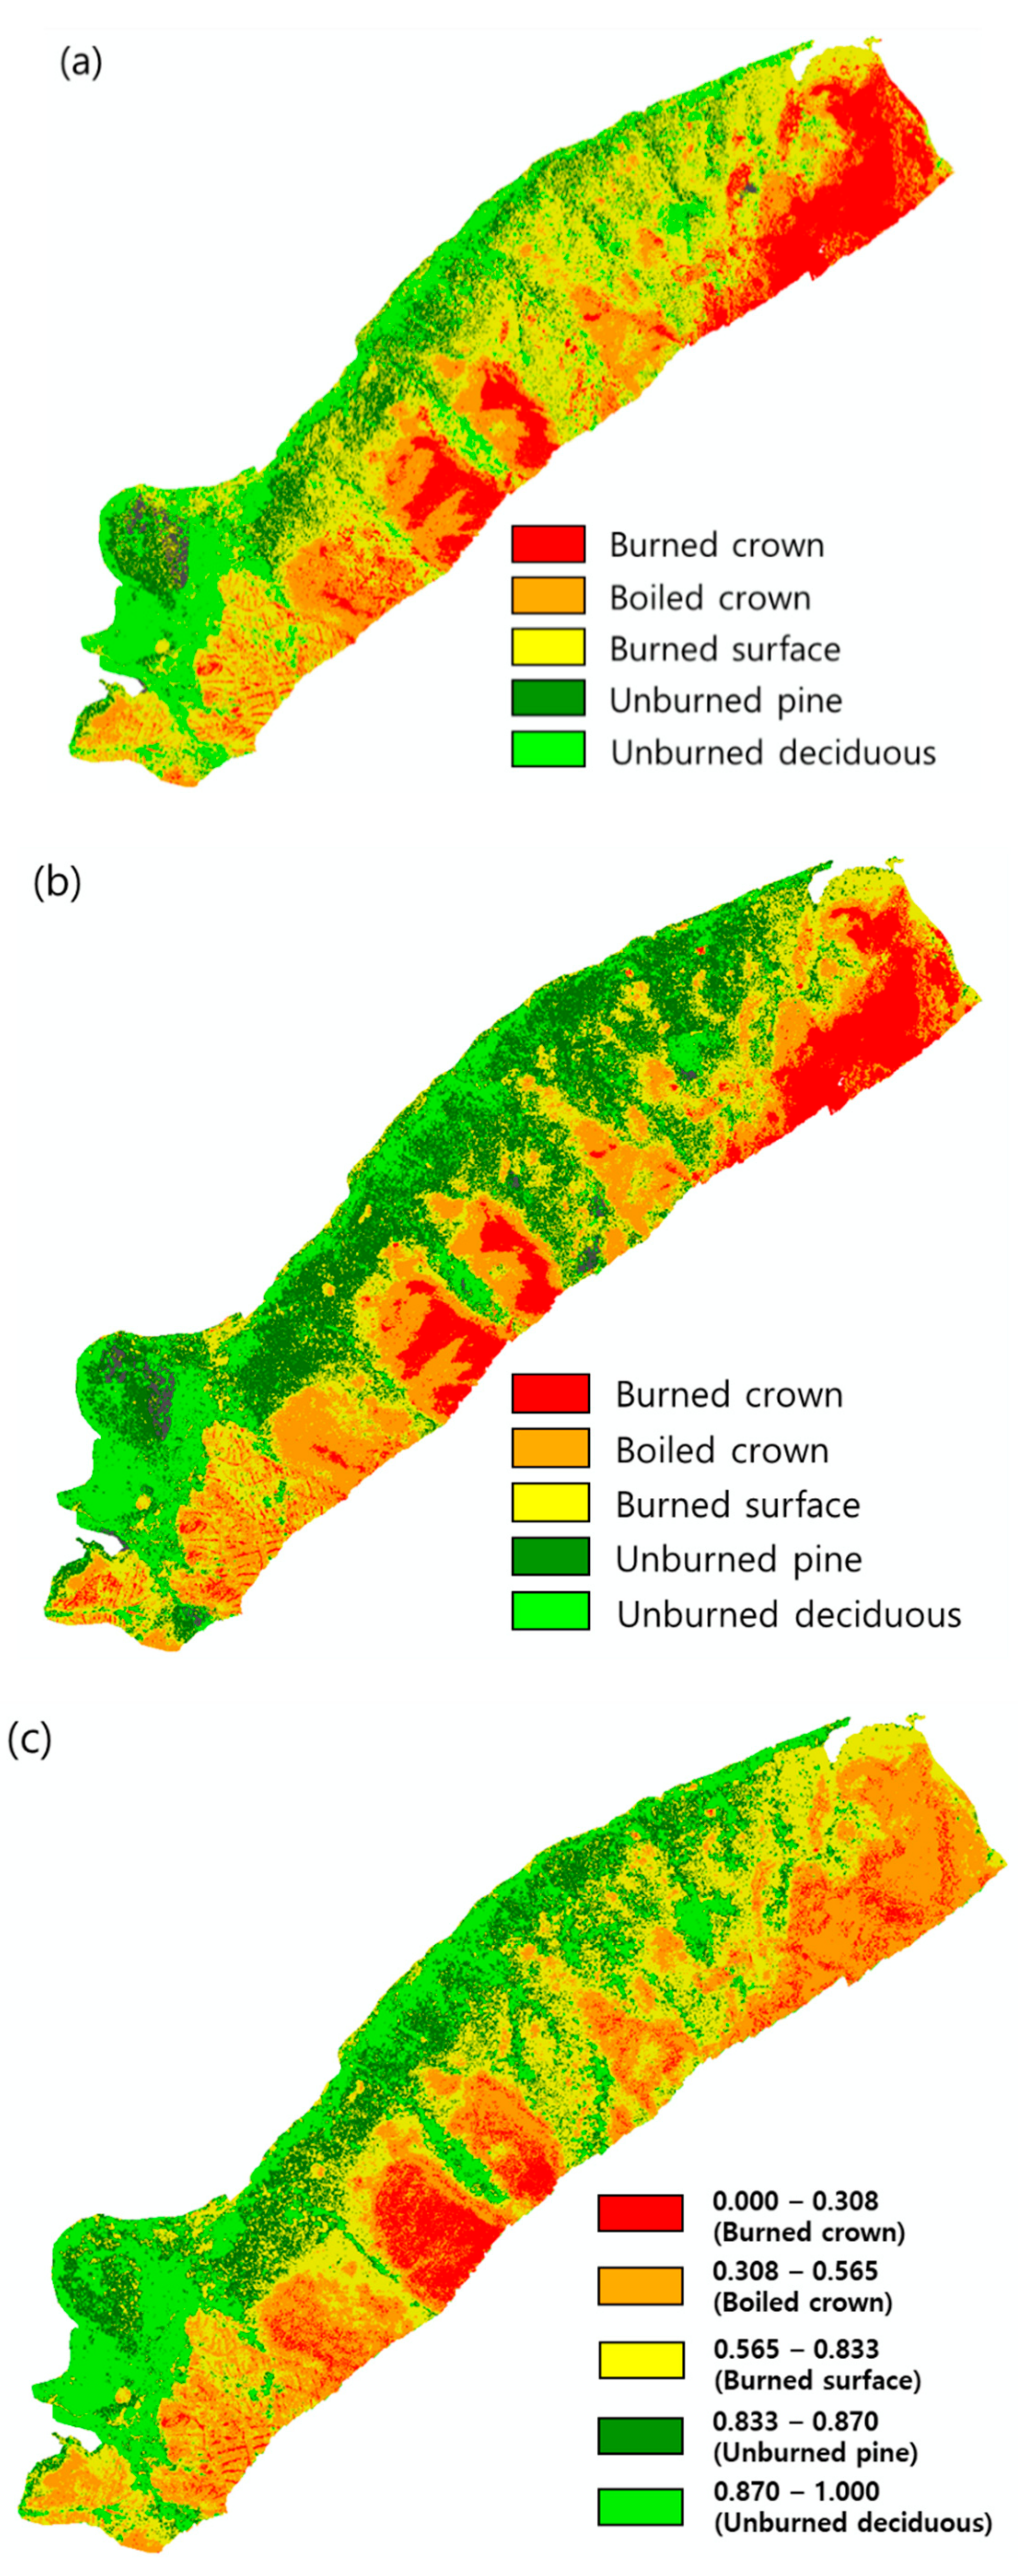
4.2. Interpretation of Classification Results
Burn severity was classified using two supervised classification methods plus the NDVI thresholding method.
Figure 10a–c show classification results from using MLH, SAM, and NDVI thresholding, respectively. SAM shows good classification results for overall classes, except for burned surface, which was mostly misclassified as unburned pine. MLH showed better results with a burned surface, although it was overestimated by misclassification between unburned pine and burned surface. Additionally, it showed confusion between unburned pine and unburned deciduous. NDVI thresholding showed moderate results among the three classification methods. The burned surface class was underestimated, and burned crown was confused with boiled crown.
Confusion matrices (
Table 3,
Table 4 and
Table 5) show the classification accuracy for each classifier. High accuracy was shown in the following order: MLH, SAM, and NDVI thresholding. Overall accuracies are 89%, 81%, and 71% for MLH, SAM, and NDVI thresholding, respectively. Kappa coefficients were also similar to overall accuracy at 0.86, 0.76, and 0.64, respectively. As seen in
Table 3, MLH showed very high accuracy of more than 85% for four classes, except unburned pine. We can see that 33% of the unburned pine was misclassified as burned surface, demonstrating that burned surface was overestimated, as seen in the visual analysis of classification results in
Figure 10a. In
Table 4, we see that SAM had more than 85% classification accuracy in three classes except for unburned pine and unburned deciduous. Those were misclassified as burned surface, or confused with each other, because the SAM algorithm uses a pattern of spectral reflectance rather than an absolute value of reflectance. In
Table 5, NDVI thresholding showed lower overall accuracy than the supervised classifiers, MLH and SAM. Low overall accuracy was caused by confusion between burned crown and boiled crown from similar NDVI values for burned out or discolored needles. However, the classification accuracy of burned surface, unburned pine, and unburned deciduous showed similar or higher levels than the two supervised classifiers.
5. Discussion
In this study, two supervised classifiers and NDVI thresholding were compared for the classification of forest burn severity, including burned surface. As a result, the classification of burned surface showed accuracy of more than 85%. This means that the UAV multispectral image can be used to accurately classify a burned surface, even though the two classes are very similar when viewed from the air.
Comparing the classification methods, the supervised classifiers (MLH and SAM) showed more than 80% overall accuracy, while the NDVI thresholding accuracy was 71%. However, 20% to 30% of unburned pine and deciduous trees were misclassified as a burned surface, and the amount of burned surface was overestimated. This means that a high degree of expertise and a lot of time are required to collect dozens to hundreds of training samples for a supervised classifier such as MLH, while the classification accuracy between burned surface and unburned pine is not high. SAM can classify with one training sample, such as a collected pixel or a spectrum from a spectral library. It showed a high number of misclassifications between classes with similar spectral patterns, although hundreds of training samples were used.
NDVI thresholding showed similar or higher accuracy with the burned surface class, compared with the supervised classifiers, even though it showed confusion between burned crown and boiled crown. Previous studies reported that burned crown and boiled crown can be classified easily with various methods, including visual interpretation. Detection or classification of a burned surface should be the focus for accurate assessment of damaged areas and burn severity. Therefore, the NDVI thresholding method is expected to be able to estimate forest fire damage more easily and accurately. Further studies are needed to generalize the threshold for application in the field. In other words, independent thresholds should be defined for different regions and times when classifying burn severity of a forest.
UAV multispectral images have very high spatial resolution and multispectral bands that can be used as training samples for classification using high-resolution satellite images and deep learning algorithms in the future. Deep learning can enhance accuracy and convenience, although it needs a long-term approach to collecting a large number of training samples. High-resolution earth observation satellites can also be a useful tool for analyzing burn severity and damaged areas. The Korean government is developing a new earth observation satellite program, the Compact Advanced Satellite 500 (CAS 500), to shorten the observation interval. The first and second twin satellites will be launched in 2020, and have a 0.5 m panchromatic band and 2 m multispectral bands. We are expecting acquisition of high-resolution multispectral images within two to three days. In the future, it will be necessary to suggest the possibility of classifying burn severity using high-resolution satellite images, in comparison with UAV images.
6. Conclusions
This study tried to analyze the use of multispectral UAV images to classify burn severity, including burned surfaces. A RedEdge multispectral image was acquired for a region of the Gangneung forest fire in April 2019. Spectral characteristics showed differences among burn severity classes, although some of them were similar. Burn severity was classified using two supervised classifiers, MLH and SAM, as well as the NDVI thresholding method. Classification accuracies were about 80% to 90% using the supervised classifiers and about 70% using NDVI thresholding. They showed an accuracy of more than 85% for the burned surface class, where a multispectral UAV image can differentiate a burned surface from unburned pine or deciduous trees. The NDVI thresholding method also showed high classification accuracy for burned surface, unburned pine, and deciduous. It can be useful as an easier and more accurate tool for the estimation of burn severity and damaged areas than a supervised classifier. Supervised classification approaches might be applied to other regions through collection of corresponding training samples. However, NDVI of burn severity classes might have different values by regional characteristics. Further studies are needed to generalize NDVI or the thresholds for application in other regions. In the future, multispectral UAV images can also be used for training deep learning techniques and high-resolution satellite images.
Author Contributions
Conceptualization, C.-s.W. and J.-i.S.; data curation, C.-s.W.; formal analysis, J.-i.S. and W.-w.S.; funding acquisition, J.P. and T.K.; investigation, J.-i.S., C.-s.W., and W.-w.S.; methodology, J.-i.S.; project administration, J.P. and T.K.; supervision, C.-s.W.; visualization, J.-i.S. and W.-w.S.; writing—original draft, J.-i.S. and W.-w.S.; writing—review and editing, J.-i.S., W.-w.S. and T.K.
Funding
This research was funded by “National Institute of Forest Science grant, number FE0500-2018-04” and “Satellite Information Utilization Center Establishment Program (18SIUE-B148326-01) by Ministry of Land, Infrastructure, and Transport of Republic of Korea”.
Acknowledgments
We thank In-Sup Kim as the staff of the National Institute of Forest Science who helped our UAV image acquisition and we also thank Korea Aerospace Research Institute for offering a KOMPSAT-3A satellite image.
Conflicts of Interest
The authors declare they have no conflicts of interest. The funders had no role in the design of the study; in the collection, analyses, or interpretation of the data; in the writing of the manuscript; or in the decision to publish the results.
References
- Statistical yearbook of wild fire 2018, Statistics Korea. Available online: https://www.index.go.kr/potal/stts/idxMain/selectPoSttsIdxMainPrint.do?idx_cd=1309&board_cd=INDX_001 (accessed on 16 September 2019).
- Tang, L.; Shao, G. Drone remote sensing for forestry research and practices. J. For. Res. 2015, 26, 791–797. [Google Scholar] [CrossRef]
- Torresan, C.; Berton, A.; Carotenuto, F.; Di Gennaro, S.F.; Gioli, B.; Matese, A.; Wallace, L. Forestry applications of UAVs in Europe: A review. Int. J. Remote Sens. 2017, 38, 2427–2447. [Google Scholar] [CrossRef]
- Sankey, T.; Donager, J.; McVay, J.; Sankey, J.B. UAV lidar and hyperspectral fusion for forest monitoring in the southwestern USA. Remote Sens. Environ. 2017, 195, 30–43. [Google Scholar] [CrossRef]
- Carvajal-Ramírez, F.; Marques da Silva, J.R.; Agüera-Vega, F.; Martínez-Carricondo, P.; Serrano, J.; Moral, F.J. Evaluation of Fire Severity Indices Based on Pre-and Post-Fire Multispectral Imagery Sensed from UAV. Remote Sens. 2019, 11, 993. [Google Scholar] [CrossRef]
- Pla, M.; Duane, A.; Brotons, L. Potential of UAV images as ground-truth data for burn severity classification of Landsat imagery: Approaches to an useful product for post-fire management. Rev. Teledetec. 2017, 49, 91–102. [Google Scholar] [CrossRef]
- Fernández-Guisuraga, J.; Sanz-Ablanedo, E.; Suárez-Seoane, S.; Calvo, L. Using unmanned aerial vehicles in postfire vegetation survey campaigns through large and heterogeneous areas: Opportunities and challenges. Sensors 2018, 18, 586. [Google Scholar] [CrossRef]
- García, M.L.; Caselles, V. Mapping burns and natural reforestation using Thematic Mapper data. Geocarto Int. 1991, 6, 31–37. [Google Scholar] [CrossRef]
- Barbosa, P.M.; Stroppiana, D.; Grégoire, J.M.; Cardoso Pereira, J.M. An assessment of vegetation fire in Africa (1981–1991): Burned areas, burned biomass, and atmospheric emissions. Glob. Biogeochem. Cycles 1999, 13, 933–950. [Google Scholar] [CrossRef]
- Chafer, C.J.; Noonan, M.; Macnaught, E. The post-fire measurement of fire severity and intensity in the Christmas 2001 Sydney wildfires. Int. J. Wildland Fire 2004, 13, 227–240. [Google Scholar] [CrossRef]
- Epting, J.; Verbyla, D.; Sorbel, B. Evaluation of remotely sensed indices for assessing burn severity in interior Alaska using Landsat TM and ETM+. Remote Sens. Environ. 2005, 96, 328–339. [Google Scholar] [CrossRef]
- Collins, B.M.; Kelly, M.; van Wagtendonk, J.W.; Stephens, S.L. Spatial patterns of large natural fires in Sierra Nevada wilderness areas. Landsc. Ecol. 2007, 22, 545–557. [Google Scholar] [CrossRef]
- Tran, B.; Tanase, M.; Bennett, L.; Aponte, C. Evaluation of Spectral Indices for Assessing Fire Severity in Australian Temperate Forests. Remote Sens. 2018, 10, 1680. [Google Scholar] [CrossRef]
- Amos, C.; Petropoulos, G.P.; Ferentinos, K.P. Determining the use of Sentinel-2A MSI for wildfire burning & severity detection. Int. J. Remote Sens. 2019, 40, 905–930. [Google Scholar]
- Filipponi, F. BAIS2: Burned Area Index for Sentinel-2. Proc. Int. Electron. Conf. Remote Sens. 2018, 2, 364. [Google Scholar] [CrossRef]
- Chuvieco, E.; Martin, M.P.; Palacios, A. Assessment of different spectral indices in the red-near-infrared spectral domain for burned land discrimination. Int. J. Remote Sens. 2002, 23, 5103–5110. [Google Scholar] [CrossRef]
- Key, C.H.; Benson, N.C. Fire Effects Monitoring and Inventory Protocol—Landscape Assessment; USDA Forest Service Fire Science Laboratory: Missoula, MT, USA, 2002; pp. 1–16.
- Van Wagtendonk, J.W.; Root, R.R.; Key, C.H. Comparison of AVIRIS and Landsat ETM+ detection capabilities for burn severity. Remote Sens. Environ. 2004, 92, 397–408. [Google Scholar] [CrossRef]
- Hartford, R.A.; Frandsen, W.H. When it’s hot, it’s hot... or maybe it’s not! (Surface flaming may not portend extensive soil heating). Int. J. Wildland Fire 1992, 2, 139–144. [Google Scholar] [CrossRef]
- Neary, D.G.; Klopatek, C.C.; DeBano, L.F.; Ffolliott, P.F. Fire effects on belowground sustainability: A review and synthesis. For. Ecol. Manag. 1999, 122, 51–71. [Google Scholar] [CrossRef]
- Miller, J.D.; Yool, S.R. Mapping forest post-fire canopy consumption in several overstory types using multi-temporal Landsat TM and ETM data. Remote Sens. Environ. 2002, 82, 481–496. [Google Scholar] [CrossRef]
- Smith, A.M.; Wooster, M.J. Remote classification of head and backfire types from MODIS fire radiative power and smoke plume observations. Int. J. Wildland Fire 2005, 14, 249–254. [Google Scholar] [CrossRef]
- McKenna, P.; Erskine, P.D.; Lechner, A.M.; Phinn, S. Measuring fire severity using UAV imagery in semi-arid central Queensland, Australia. Int. J. Remote Sens. 2017, 38, 4244–4264. [Google Scholar] [CrossRef]
- Fraser, R.; Van Der Sluijs, J.; Hall, R. Calibrating satellite-based indices of burn severity from UAV-derived metrics of a burned boreal forest in NWT, Canada. Remote Sens. 2017, 9, 279. [Google Scholar] [CrossRef]
- Rossi, F.; Fritz, A.; Becker, G. Combining satellite and UAV imagery to delineate forest cover and basal area after mixed-severity fires. Sustainability 2018, 10, 2227. [Google Scholar] [CrossRef]
- Won, M. Analysis of Burn Severity in Large-Fire Area Using Satellite Imagery. Ph.D. Thesis, Korea University, Seoul, Korea, July 2013. [Google Scholar]
- Swain, P.H.; Davis, S.M. Remote sensing: The quantitative approach. IEEE Trans. Pattern Anal. Mach. Intell. 1981, 6, 713–714. [Google Scholar] [CrossRef]
- Kruse, F.A.; Lefkoff, A.B.; Boardman, J.W.; Heidebrecht, K.B.; Shapiro, A.T.; Barloon, P.J.; Goetz, A.F.H. The spectral image processing system (SIPS)—Interactive visualization and analysis of imaging spectrometer data. Remote Sens. Environ. 1993, 44, 145–163. [Google Scholar] [CrossRef]
- Clevers, J.P.G.W.; Jongschaap, R. Imaging spectrometry for agricultural applications. In Imaging Spectrometry—Basic Priciples and Prospective Applications, 1st ed.; Van Der Meer, F.D., Ed.; Kluwer Academic Publishers: Dordrecht, The Netherlands, 2003; pp. 157–199. [Google Scholar]
Figure 1.
Location of (a) the city of Gangneung, and (b) the study area (red box) in the burning forest shown in a KOMPSAT-3A satellite image taken on 5 April 2019.
Figure 1.
Location of (a) the city of Gangneung, and (b) the study area (red box) in the burning forest shown in a KOMPSAT-3A satellite image taken on 5 April 2019.
Figure 2.
The study area is forest damaged by fire from 4 to 5 April 2019, near the city of Gangneung: (a) burned forest where there are various burned (damaged) types mixed in the area; and (b) a typical burned surface area where some tree trunks were burned, even though the crown was not burned.
Figure 2.
The study area is forest damaged by fire from 4 to 5 April 2019, near the city of Gangneung: (a) burned forest where there are various burned (damaged) types mixed in the area; and (b) a typical burned surface area where some tree trunks were burned, even though the crown was not burned.
Figure 3.
RedEdge multispectral unmanned aerial vehicle (UAV) image of some of the burned area (red box in
Figure 1) near the city of Gangneung: (
a) natural color composite: RGB = band 3, 2, 1; and (
b) pseudo-infrared composite: RGB = band 5, 3, 2.
Figure 3.
RedEdge multispectral unmanned aerial vehicle (UAV) image of some of the burned area (red box in
Figure 1) near the city of Gangneung: (
a) natural color composite: RGB = band 3, 2, 1; and (
b) pseudo-infrared composite: RGB = band 5, 3, 2.
Figure 4.
A normalized difference vegetation index (NDVI) transformed image that was stretched from 0.10 to 0.95.
Figure 4.
A normalized difference vegetation index (NDVI) transformed image that was stretched from 0.10 to 0.95.
Figure 5.
A reference map from visual interpretation based on a field survey.
Figure 5.
A reference map from visual interpretation based on a field survey.
Figure 6.
Examples of sample collections for (a) an unburned area and (b) a burned crown and burned surface area.
Figure 6.
Examples of sample collections for (a) an unburned area and (b) a burned crown and burned surface area.
Figure 7.
Distribution of NDVI values with mean ± one standard deviation for each burn severity class.
Figure 7.
Distribution of NDVI values with mean ± one standard deviation for each burn severity class.
Figure 8.
Mean spectral reflectance curve for five classes in the training samples.
Figure 8.
Mean spectral reflectance curve for five classes in the training samples.
Figure 9.
Range of mean ± one standard deviation for burned surface, unburned pine, and unburned deciduous.
Figure 9.
Range of mean ± one standard deviation for burned surface, unburned pine, and unburned deciduous.
Figure 10.
Results from classification of burn severity using (a) maximum likelihood (MLH), (b) spectral angle mapper (SAM), and (c) NDVI thresholding.
Figure 10.
Results from classification of burn severity using (a) maximum likelihood (MLH), (b) spectral angle mapper (SAM), and (c) NDVI thresholding.
Table 1.
Mean of burn severity classes for each vegetation index. NDVI, normalized difference vegetation index; RE-NDVI, red edge NDVI; VDVI, visible-band difference vegetation index.
Table 1.
Mean of burn severity classes for each vegetation index. NDVI, normalized difference vegetation index; RE-NDVI, red edge NDVI; VDVI, visible-band difference vegetation index.
| Index | Burned Crown | Boiled
Crown | Burned Surface | Unburned Pine | Unburned Deciduous |
|---|
| NDVI | 0.33 | 0.31 | 0.78 | 0.84 | 0.91 |
| RE-NDVI | 0.33 | 0.27 | 0.45 | 0.49 | 0.51 |
| VDVI | 0.08 | 0.00 | 0.33 | 0.36 | 0.52 |
Table 2.
Thresholds between burn severity classes using the median of the overlapped range.
Table 2.
Thresholds between burn severity classes using the median of the overlapped range.
| Class Pair | Burned Crown—Boiled Crown | Boiled Crown—Burned Surface | Burned Surface —Unburned Pine | Unburned Pine—Unburned Deciduous |
|---|
| Threshold | 0.308 | 0.565 | 0.833 | 0.870 |
Table 3.
Confusion matrix for classification accuracy assessment using MLH (%).
Table 3.
Confusion matrix for classification accuracy assessment using MLH (%).
Reference
Classifications | Burned Crown | Boiled Crown | Burned Surface | Unburned Pine | Unburned Deciduous | Total |
|---|
| Burned crown | 96 | 13 | 0 | 0 | 0 | 22 |
| Boiled crown | 4 | 87 | 3 | 0 | 0 | 19 |
| Burned surface | 0 | 0 | 92 | 33 | 0 | 25 |
| Unburned pine | 0 | 0 | 5 | 67 | 0 | 14 |
| Unburned deciduous | 0 | 0 | 0 | 0 | 100 | 20 |
| Total | 100 | 100 | 100 | 100 | 100 | 100 |
| Overall accuracy = 89%, Kappa coefficient = 0.86 |
Table 4.
Confusion matrix for classification accuracy assessment using spectral angle mapper (SAM) (%).
Table 4.
Confusion matrix for classification accuracy assessment using spectral angle mapper (SAM) (%).
Reference
Classifications | Burned Crown | Boiled Crown | Burned Surface | Unburned Pine | Unburned Deciduous | Total |
|---|
| Burned crown | 95 | 6 | 0 | 0 | 0 | 20 |
| Boiled crown | 2 | 91 | 2 | 0 | 0 | 19 |
| Burned surface | 3 | 3 | 85 | 24 | 20 | 27 |
| Unburned pine | 0 | 0 | 13 | 74 | 22 | 22 |
| Unburned deciduous | 0 | 0 | 0 | 2 | 58 | 12 |
| Total | 100 | 100 | 100 | 100 | 100 | 100 |
| Overall accuracy = 81%, Kappa coefficient = 0.76 |
Table 5.
Confusion matrix for classification accuracy assessment using NDVI thresholding (%).
Table 5.
Confusion matrix for classification accuracy assessment using NDVI thresholding (%).
Reference
Classifications | Burned Crown | Boiled Crown | Burned Surface | Unburned Pine | Unburned Deciduous | Total |
|---|
| Burned crown | 72 | 70 | 6 | 0 | 0 | 29 |
| Boiled crown | 25 | 27 | 0 | 0 | 0 | 11 |
| Burned surface | 3 | 3 | 89 | 24 | 0 | 24 |
| Unburned pine | 0 | 0 | 5 | 74 | 6 | 17 |
| Unburned deciduous | 0 | 0 | 0 | 2 | 94 | 19 |
| Total | 100 | 100 | 100 | 100 | 0 | 100 |
| Overall accuracy = 71%, Kappa coefficient = 0.64 |
© 2019 by the authors. Licensee MDPI, Basel, Switzerland. This article is an open access article distributed under the terms and conditions of the Creative Commons Attribution (CC BY) license (http://creativecommons.org/licenses/by/4.0/).


