Article

The Use of DNA Barcoding to Assess Phylogenetic β-Diversity in Mid-Subtropical Evergreen Broad-Leaved Forests of China

1
Collaborative Innovation Centre of Jiangxi Typical Trees Cultivation and Utilization, College of Forestry, Jiangxi Agriculture University, Nanchang 310045, China
2
Key Laboratory of Plant Resources Conservation and Sustainable Utilization, South China Botanical Garden, Chinese Academy of Sciences, Guangzhou 510650, China
3
Jiangxi Provincial Key Laboratory for Restoration of Degraded Ecosystems & Watershed Ecohydrology, Nanchang Institute of Technology, Nanchang 330099, China
*
Author to whom correspondence should be addressed.
Forests 2019, 10(10), 923; https://doi.org/10.3390/f10100923
Submission received: 25 September 2019 / Revised: 14 October 2019 / Accepted: 18 October 2019 / Published: 20 October 2019
(This article belongs to the Special Issue Functional and Phylogenetic Signals of Forest Tree Communities)

Abstract

:
The application of quantifying phylogenetic information into measures of forest β-diversity is increasing for investigating the underlying drivers of community assembly along environmental gradients. In terms of assessing evolutionary inferences of community processes, a variety of plant DNA barcodes has been widely used in phylogenetic diversity measurements. However, relatively few studies have evaluated the effectiveness of DNA barcodes with using nuclear region in estimating phylogenetic β-diversity, particularly for communities in tropical or subtropical forests. In this study, we employed DNA barcodes combing with the nuclear region to construct the community phylogeny and examined the patterns of phylogenetic β-diversity of three mid-subtropical evergreen broad-leaved forests (EBLFs) in South China. Three phylogenetic construction methods were performed, including a Phylomatic-generated tree and two ML trees based on the combination of rbcL + matK + ITS with or without a constrained tree. Our results showed that the DNA barcodes including nuclear ITS constructed a highly resolved phylogenetic tree, but the application of a constrained tree had little influence on estimation of phylogenetic diversity metrics (mean pairwise distances and mean nearest taxon distances) based on branch lengths. Using both metrics and their standardized effect size metrics, we found that the patterns of phylogenetic β-diversity in mid-subtropical forests were non-random. There was a slight decline of phylogenetic β-diversity with increasing latitudes, but no trend was found along the altitude gradient. According to the analysis of variation partition, both environmental filtering and dispersion limitation could explain the variation of phylogenetic dissimilarity between communities in mid-subtropical EBLFs of China. Our results highlight the importance of neutrality and the niche conservatism in structuring the patterns of species diversity in subtropical woody communities.

1. Introduction

Unraveling mechanisms that determine species diversity is an essential issue in ecology. Niche-based deterministic and neutrality-based stochastic processes are considered to be two main drivers for the variation of species composition [1,2,3,4]. The relative importance of the deterministic or the stochastic process in shaping the patterns of species diversity has been debated for a long time by community ecologists, especially for the regional spatial scales in biodiversity hotspots, where highly diverse biomes exist (e.g., tropical or subtropical forests). By quantifying the degree to which space, environment, or their interactions would influence the community dissimilarity, β-diversity has become increasingly important in studies of inferring the dominant mechanism underlying the assembly of communities [5,6,7,8,9]. Generally, changes of species composition caused by deterministic processes may be strongly associated with environmental distances, as species distribution may differ in large environmental gradients. While the variation of species turnover caused by stochastic processes may have strong correlations with geographical distances, because species dispersal limitation may occur in biogeographic barriers.
However, most measures of β-diversity treat all species as evolutionarily independent, ignoring the dissimilarity of phylogenetic relatedness of species between communities [10,11,12,13,14]. Unlike the traditional species-based method, phylogenetic β-diversity permits an understanding of the phylogenetic turnover between communities and is increasingly employed to unravel mechanisms of community assembly [15,16,17,18,19]. Generally, a rapid construction of community phylogeny can be achieved by pruning and grafting taxa from the existing phylogenetic relationships of a super-tree using the online software Phylomatic (i.e., APG III phylogeny for angiosperms) [12,20]. However, Phylomatic-generated phylogenies of species among communities provide little phylogenetic information among closely related species, which could influence estimates of phylogenetic metrics based on the terminal clades, thus leading to incomprehensive or inaccurate ecological inferences [21,22]. This problem might be more severe in species-rich regions where the existing phylogenetic information for many complex taxa is lacking [20,23]. DNA barcoding data composed of one or multiple-barcode sequences, has a high potential in constructing more comprehensive community phylogenies than the Phylomatic method [21,22,23,24]. For example, DNA barcoding successfully constructed a community phylogeny for trees in a tropical forest of Panama for the first time [22]. Thereafter, the integration of DNA barcoding sequences into the generation of community phylogeny is applied to estimate the phylogenetic community structure of many forests [21,24].
For plant DNA barcoding, in addition to core barcodes (rbcL + matK), the supplementary marker of trnH-psbA has also been used widely in phylogenetic community construction. However, this supplementary marker shows the limited ability in assessments of floristic biodiversity in many tropical or subtropical areas for some complex lineages with rapid evolutionary history, such as the genera of Ilex, Rhododendron, and Ficus [25,26,27]. Furthermore, a constrained tree of community phylogeny is often suggested when applying these barcodes in community phylogenetic analyses because of the incongruence in topology with the accepted phylogeny classification [21,24]. Compared with the chloroplast supplementary plant barcodes (e.g., trnH-psbA), nuclear regions, such as ITS, have been demonstrated to be more powerful for identifying species in species-rich regions and resolving the phylogenetic relationships within a clade, or even within a rapidly diverged genus [28,29,30]. However, since ITS is rarely introduced in phylogenetic community structure analyses, few studies focus on the phylogenetic signals based on the combination of rbcL, matK, and ITS to assess the patterns of phylogenetic turnover between communities in tropical or subtropical forests. In particular, when using ITS, whether or not the construction of phylogeny with the constrained tree would affect the measures of phylogenetic β-diversity has also been barely investigated.
As an important component of subtropical ecosystems in East Asia, subtropical evergreen broad-leaved forests (EBLFs) represent one of most diverse biomes on earth (second only to the tropical forests) and cover approximately 25% areas of China [31]. In contrast to the tropics where dispersal limitation is the main driver of community assembly [19,32], most species-based β-diversity studies in EBLFs show joint effects of environmental filtering and dispersal limitation on species composition, in which habitat variables generally could explain much more variation than the geographical distance [33,34]. However, many studies focus on species turnover at a local community with a limited spatial scale, and phylogenetic information is rarely included. In EBLFs of China, numerous mountains possess extremely diverse environmental conditions, even within a small spatial scale [35]. Meanwhile, these mountains are considered as refuges and dispersal corridors for species during periods of large and rapid Neogene and Quaternary climate fluctuations [35,36]. Thus, quantitative analyses are needed to investigate the evolutionary β-diversity in EBLFs in a wide range of environmental conditions among different mountains, such as along the latitude and altitude gradients. In addition, the high species richness in EBLFs is mainly characterized by species from complex genera, such as Syzygium, Ilex, Rhododendron, and Viburnum [25]. Phylomatic may perform poorly on the resolution of these species phylogenetic relationships. DNA barcodes combing with the nuclear region may have an ability to distinguish species among these complex genera and construct a robust community phylogeny, which may influence estimates of phylogenetic β-diversity.
In this study, we focus on the following issues: (1) the comparison of phylogenetic β-diversity between the rbcL + matK + ITS constructed tree and the Phylomatic-generated tree; (2) the patterns of phylogenetic turnover along latitudinal and altitudinal gradients in mid-subtropical mountain forests of China; and (3) the roles of environment filtering and spatial distances on shaping the phylogenetic β-diversity in subtropical forests.

2. Materials and Methods

2.1. Study Sites and Materials

This study was performed in three National Nature Reserves along the latitudinal gradient in Jiangxi province of China, which were GuanShan (GS, 28°30′ N, 114°29′ E) mountain, JingGangShan (JGS, 26°38′ N, 114°04′ E) mountain, and JiuLianShan (JLS, 24°31′ N, 114°27′ E) mountain, respectively (Figure S1). The highest peak of the three reserves located in the JGS mountain and is about 1841 m above the sea level. EBLFs are the major forest vegetation in the three reserves, which contribute greatly to the biodiversity and ecological services for these areas [37]. Some other ecosystems (e.g., alpine forests) were not investigated in this study. Depending on the geographic realms of EBLFs in each reserve, 15 forest plots were placed in each of the first 2 mountains respectively (i.e., GS and JGS; from about 200 m to 1000 m a.s.l.), and another 12 forest plots for the third mountain (i.e., JLS; from about 200 m to 1200 m a.s.l.) during June and July 2016. We adopted the field experiment design and sampling protocols from the project of forest restoration in EBLFs [31], which were also similar to the investigating guidelines of plant diversity in China’s mountains directed by PKU-PSD projects [38]. Plots measuring 20 × 20 m were set up and all woody species within each plot were investigated due to their importance in shaping and maintaining the community structure in subtropical forests. Tree plots representing typical types of community vegetation for EBLFs (including Fagaceae, Lauraceae, Theaceae, and Magnoliaceae) were selected at intervals of 100–200 m in each mountain. All trees stems > 1 cm in diameter at breast height (dbh) were surveyed and identified to the species level. During the survey, a few rare species in some plots failed to be accurately identified in the field due to the lack of specimens with key identification traits. To reduce the ambiguity, these rare species (about five species) were removed from their plot species lists. Subspecies and varieties were combined, and taxonomic synonymy were re-corrected through the World Flora Online (www.worldfloraonline.org). In total, there were 8879 individuals representing 242 species, 110 genera, and 54 families across all plots. In addition, tissue sample of each woody species surveyed was collected and preserved with silica gel desiccation for further DNA extraction.
The geographic information and altitudes of each plot were recorded via GPS. Soil cores (2.5 cm in diameter, 5 cm in length) were taken at 0–10 cm depths from 10 randomly selected locations in each plot. After removing the surface litter, ten cores were composited into one sample. Five variables of soil nutrients—including pH, total C, total N, total phosphorus, and available phosphorus stocks—were analyzed according to the procedure in literature [39].
We collected two specimens for each species in each reserve. After identifying and checking all specimens by local taxonomists, one sample for each species was used to obtain DNA barcoding sequences. In total, 142, 139, and 106 species were sampled for the GS, JGS, and JLS mountain, respectively. Genomic DNA was extracted from dried leaf tissues using a modified CTAB method [40]. Three regions (rbcL, matK, and ITS) were amplified in a 25 uL reaction mixture respectively. Methods of DNA extraction, PCR for each region and sequencing followed Liu et al. [25]. While sequencing some samples of ITS directly, messy positions (e.g., sequencing errors or polymorphism) were found. In order to obtain clear sequences of ITS, PCR bands from these samples were excised, purified with a Generay kit (Shanghai, China) and re-sequenced after visualization on 2% agarose gel. Sequences for some of taxa were retrieved from our previously published local comprehensive DNA barcoding library in the south subtropical EBLFs of China [25]. All 129 DNA barcodes generated in this study were deposited in GenBank (Table S1). In total, we used 684 sequences that included 242 sequences for rbcL, 231 for matK, and 211 for ITS. All trace files for each of the three barcodes were edited and assembled via Sequencher 4.1.4 (GenCodes, Corp. Ann Arbor), and each sequence was re-checked and verified using a BLASTn search of the NCBI database. Because of the confusion in taxonomic synonymy and local botanical nomenclature, about 35 incorrect species names were found. All of these misidentifications were corrected. Alignment of rbcL and matK were conducted globally via MUSLE aligner in Mega 6.0. Sequences from the hyper-variable ITS barcode were aligned using SATe based on the guide tree at the family level derived from the Phylomatic portal [24]. Based on the ‘divide and conquer’ style arithmetic, SATe could first generate many sub-alignments by subdividing sequences into small sets and operating many cycles of alignment. Thereafter, all sub-alignments are merged to the optimal alignment state based on the likelihood scores of a guide phylogenetic tree. This alignment method has been proved to be very powerful in the alignment for hyper-variable markers [23,25]. The alignments for each of three barcodes were edited and checked manually using Mega 6.0, and then concatenated to produce a three-gene alignment for all species by super-matrix combining via the R package ‘phylotools’.
To evaluate the effectiveness of the combination of three barcodes (i.e., rbcL + matK + ITS) on estimating phylogenetic diversity, three community phylogenetic trees for all 242 woody species were constructed and compared. The first tree was generated by the online eco-informatics software Phylomatic based on Zane et al. [41], the phylogeny of which includes 98.6% of seed plant families in the world. The other two trees were constructed using the maximum likelihood (ML) algorithm with the aligned three-barcode matrix (rbcL + matK + ITS). In order to generate the consistent deep topology with broadly accepted phylogeny, the ordinal-level topologies of the APG tree as a constrained tree were often suggested in phylogenetic analyses when using DNA barcoding data [24,42]. For some species-level megaphylogenies of vascular plants based on DNA sequences (e.g., Zane et al. [41]), both orders and families were constrained according to the APG tree [41]. In this study, the constrained tree was derived using Phylomatic from the APG Ⅲ system, and then each family was modified into a polytomy in Mesquite. Both unconstrained and constrained barcoding ML trees were built by employing RAxML via the CIPRES super-computer cluster [43]. The GTR model with a gamma distribution parameter was selected for the analysis based on jModeltest [44]. Node supports were assessed by 1000 bootstrap replicates. Finally, an ultrametric tree was obtained using the Mean Path Length (MPL) method, which was implemented by the ‘chonoMPL’ command within the R package ‘ape’. Based on the phylogeny with internode lengths, the MPL method could produce relative age estimates with confidence intervals [45].

2.2. Measures of Phylogenetic β-Diversity

A variety of phylogenetic β-diversity metrics have been adopted in multiple studies since the phylogenetic community ecology was proposed [10], but some of these indices are considered to be highly correlated with the existing ones [19]. In this study, to avoid the redundancy of evaluating similar indices, we measured two phylogenetic β-diversity metrics that have been widely used, which were the mean phylogenetic dissimilarity (Dpw) and the mean nearest taxon distance (Dnn) with both abundances weighted and presence–absence data [19]. The standardized effective sizes of these two metrics quantified from a null distribution output were also calculated, for evaluating whether the phylogenetic relatedness between species in two plots differed from the randomly expected. When generating the null distribution, we randomized the species names 999 times and re-evaluated Dpw and Dnn metrics for each plot. This randomization procedure maintained the existing community data matrix and only changed species names across the tips of the phylogenetic tree, which were suggested to be particularly powerful in phylogenetic β-diversity since it can fix all observed spatial patterns [19,46]. The standardized effect sizes (S.E.S.) of Dnn and Dpw through randomization were calculated as
S . E . S . D p w = 1 × D p w   o b s e r v e d D p w   r a n d o m s d ( D p w   r a n d o m )
S . E . S . D n n = 1 × D n n   o b s e r v e d D n n   r a n d o m s d ( D n n   r a n d o m )
Five gymnosperm species (Pinus massonina, P. taiwanensis, Taxus wallichiana, Cunninghamia lanceolata, Negeia nagi) found in the plot species list were dropped from the analysis of community phylogeney, due to their long evolutional branch lengths in the phylogeny [47]. On the other hand, angiosperms are a major source in subtropical forests. In addition, the differentiation of deep level phylogenetic relationships between gymnosperms and angiosperms may not affect the relationship at the generic or the species level [48]. Therefore, omitting some rare gymnosperm species would have little influence on the estimation of assembly processes of angiosperm woody species.

2.3. Patterns of Phylogenetic Dissimilarity in Different Mountains

To explore the patterns of phylogenetic dissimilarity along the latitude and altitude of the three mountains, we converted the community dissimilarity matrices of all phylogenetic dissimilarity between plots into pairwise lists. Each of the pairwise was divided into two parts for each analysis: the dissimilarity in species composition between plot-pairs along the altitudinal gradient on the same mountain, and the decaying rate of similarity in species composition for plot-pairs from two different mountains. Therefore, the plot-pair lists of two plots were assigned into six groups: plot-pairwise of two plots from the same mountain, including GS, JGS, and JLS respectively, and plot-pairwise from two different mountains, including GS vs. JGS, GS vs. JLS, and JGS vs. JLS respectively. We employed two-way ANOVAS to test the differences of S.E.S.Dnn and S.E.S.Dpw between each group.
Spatial variables were calculated using GPS coordinates collected from each plot. Environmental distances between each plot-pair were estimated by calculating the Euclidean distance between plots based on their five soil variables. The elevational distances between plots were also calculated by using the Euclidean distance. As EBLFs generally develop under the subtropical monsoon climate [31], five climatic variables were chosen to quantify the climates of each plot: annual mean temperate, temperature seasonality, minimum temperature of the coldest month, temperature annual range, and annual precipitation. The data of these climatic variables were downloaded from the WorldClim website (www.worldclim.org). According to the principal component analysis, the first and second principal components (PC1 and PC2) contributed to a large amount of the variation in these five climatic variables, and therefore the climate PC1 and PC2 were employed to represent the five climate variables (Table 1 and Table S2). We also subjected five edaphic variables to another principal component analysis and the first two principal components contributed to a high amount of the variation in the five edaphic variables. Thus, the soil PC1 and PC2 were used to represent the five original edaphic variables (Table 1 and Table S2). The influence of spatial variables, environmental variables, and the changes of elevation were assessed using statistical methods described below.
To explore the patterns of phylogenetic dissimilarity along the altitudinal gradient, we conducted linear regressions for S.E.S. Dpw and S.E.S. Dnn plotted against the changes of elevation for each pair of plots. The Pearson’s correlation coefficient based on the Mantel test was utilized to quantify relationships between phylogenetic dissimilarity, geographical distance, climatic distance, and edaphic distance.

2.4. Quantifying the Relative Importance of Explanatory Variables

Multiple regression on distance matrices (MRM) was employed to partition the variances in Dpw and Dnn. MRM could quantify both independent joint effects of different explanatory variables. In this study, phylogenetic β-diversity metrics were regressed on the geographical distance, the change of elevation, and the environmental distance. The coefficient of adjusted R2 inferred the explanatory abilities of independent variables or the interactions of the three independent variables. All the procedures and plotting were performed with the R language (version 3.1.2; R Foundation for Statistical Computing), using the packages of ‘geosphere’, ‘vegan’, ‘ape’, ‘picante’, and ‘ggplot2’.

3. Results

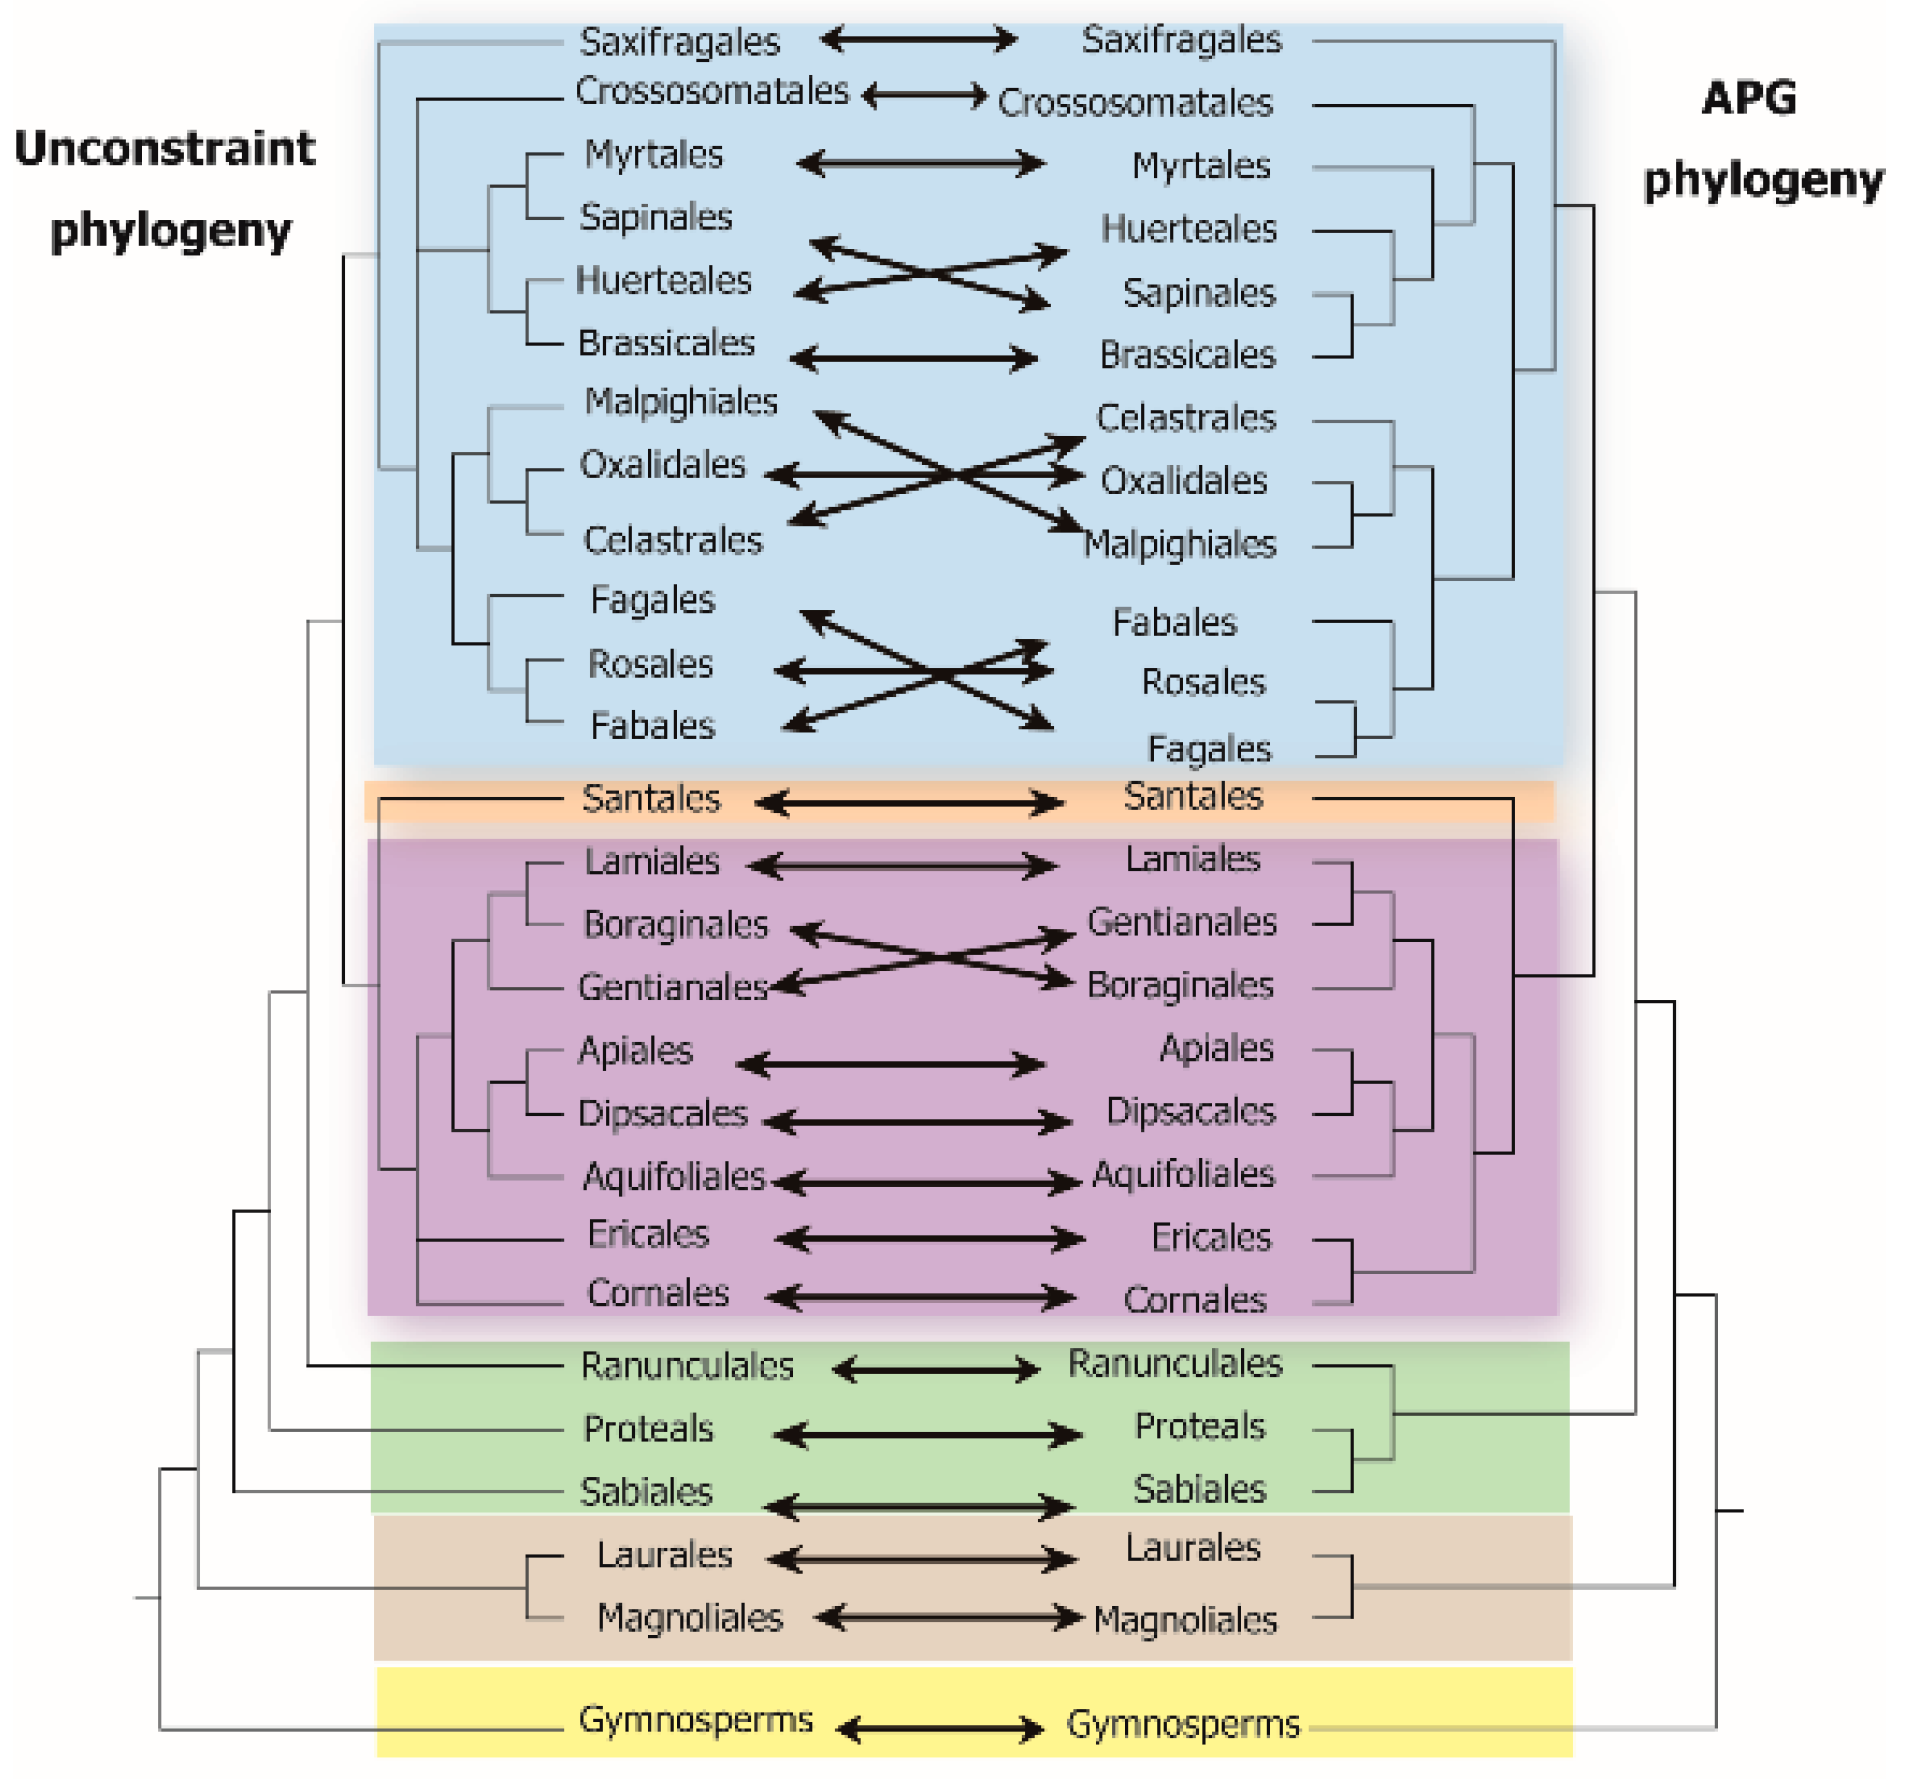
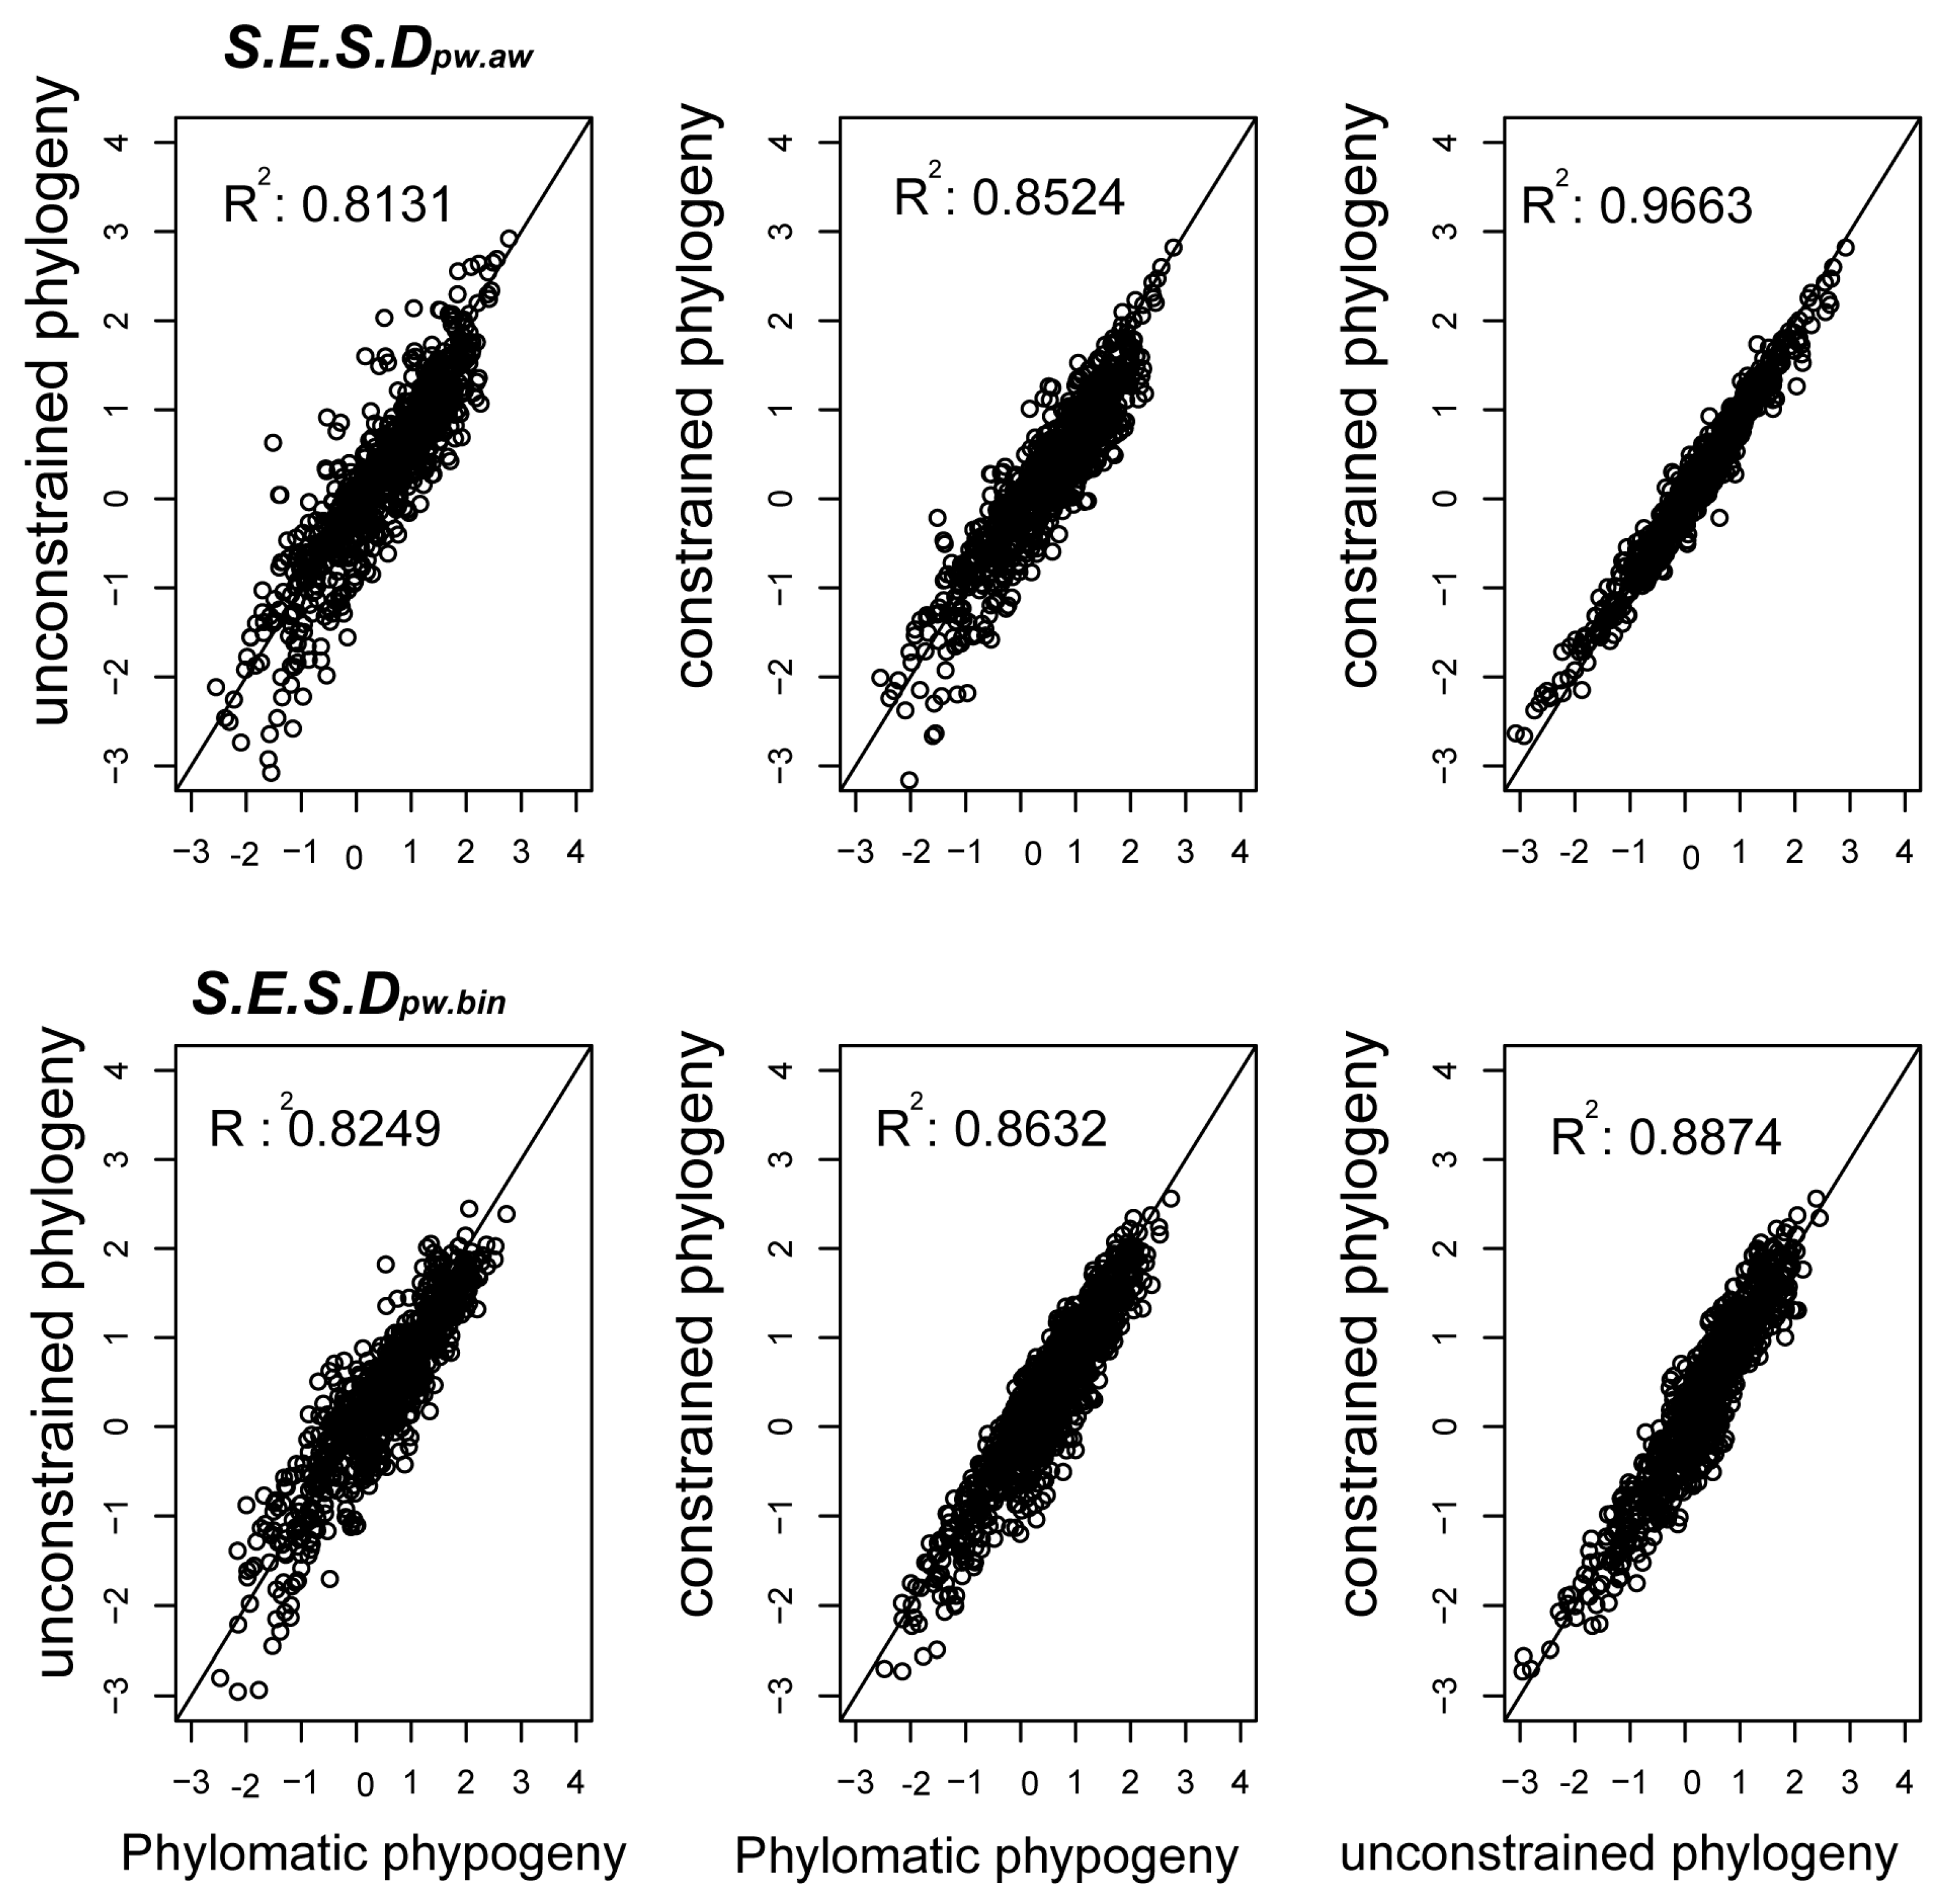
3.1. Assessment of Phylogenetic β-Diversity

Three community phylogenetic trees were built in this study with different approaches including the phylomatic phylogeny, the unconstrained barcoding phylogeny, and the constrained barcoding phylogeny, which differed in phylogenetic topology. The Phylomatic-generated tree resolved 217 nodes, and most of unresolved relationships in this tree were found in five complex genera, which were Ficus, Callicarpa, Ilex, Euonymus, and Castanopsis. The ML tree using DNA barcoding data without a constrained tree exhibited nearly fully resolved topology and showed 53.53% high bootstrap values (BS > 85) and 60.17 % moderate bootstrap values (BS > 70). However, the overall topology of the unconstrained barcoding tree was significantly incongruent with the Phylomatic-generated ordinal topology (Figure 1). Almost 30% orders (8 of 27 all orders) were misplaced with respect to the accepted APG topology at the ordinal level. The constrained barcoding tree also showed a well-resolved phylogeny among all species relationships, and performed best in highly supported nodes (BS > 85: 67.92% and BS > 70: 75%) among the three constructed trees. Further investigation was conducted to evaluate the effects of these phylogenetic incongruities on community phylogenetic β-diversity indices in our study.
Phylogenetic β-diversity was quantified by pairwise and nearest-neighbor metrics, and the presence-abundance and abundance weighted approach was employed. All values were multiplied by −1. Negative values of any phylogenetic β-diversity metric indicated a lower turnover than the expected phylogenetic turnover between plots, while positive values indicated higher turnover rates than expectation.
The effectiveness of the three different phylogenies on community assembly parameters was compared in pairs (Figure 2). When using pairwise t-test, differences in phylogenetic β-indices between the Phylomatic-generated and the unconstrained barcoding phylogeny were significant (Table S3; e.g., for S.E.S.Dpw.aw, t = 4.802, df = 2356, p < 0.0001). Highly significant differences were also found in phylogenetic β-indices between the Phylomatic-generated and the constrained barcoding phylogeny (e.g., for S.E.S.Dpw.aw, t = 6.211, df = 2356, p < 0.0001). There was no difference detected in calculations between the two phylogenies based on barcoding data (e.g., for S.E.S.Dpw.aw, t = 1.223, df = 2356, p = 0.2241). Because the trends of the following results based on the three phylogenies were similar, we report on the remainder of the results calculated by the constrained barcoding phylogeny in this study.

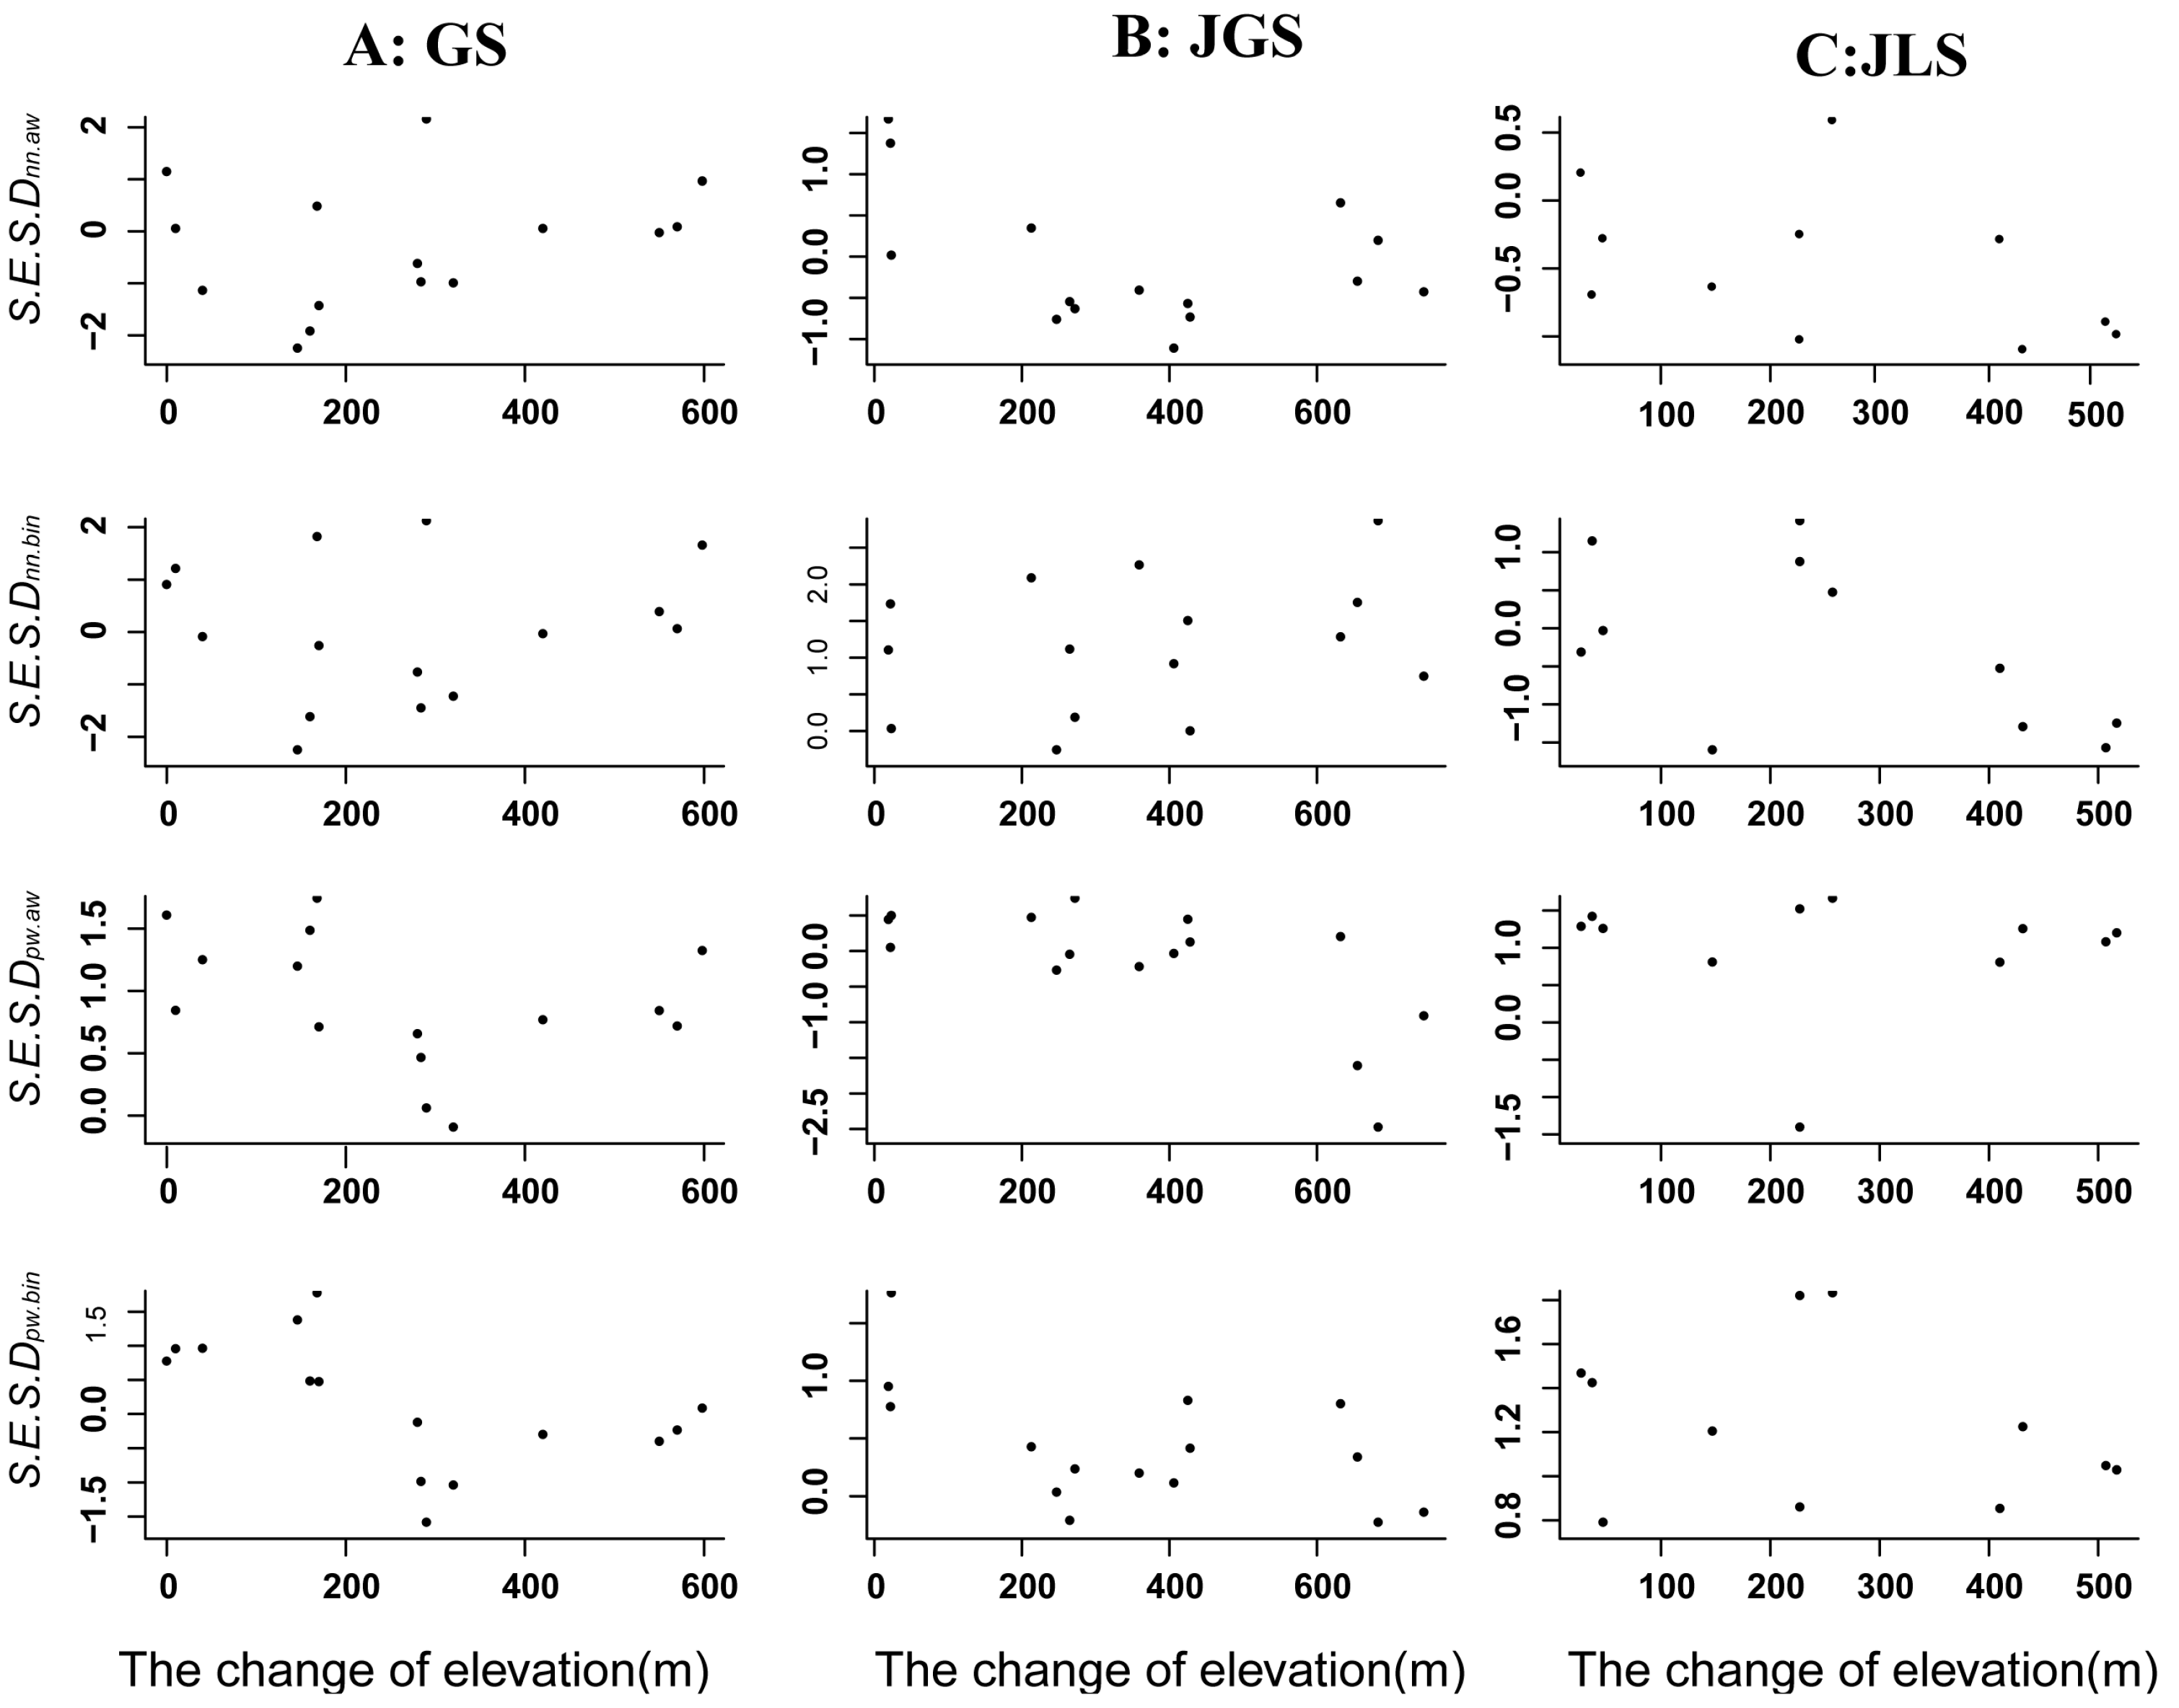
3.2. Patterns of Phylogenetic β-Diversity of Evergreen Broad Assemblages along Latitudinal and Altitudinal Gradients in Sub-Tropical Forests

For each of the three mountains located at different latitudes, results of the pairwise metrics showed that the majority of S.E.S. Dpw values based on the constrained barcoding ML tree were higher than the expected phylogenetic turnover, and JLS showed the highest values among the three mountains (Figure 3). Similar results were found in the comparisons with the other two mountains, and any comparisons with JLS obtained higher values than the comparisons with JGS or GS. However, results of the two phylogenetic near-neighbor metrics were largely different from results of pairwise metrics. S.E.S. Dnn was a little lower than the expected value. In addition, ranges of dissimilarity between plots reduced when species abundance was weighted. Along the altitudinal gradient in each mountain, no significant tendency was found for the four phylogenetic metrics (Figure 4).
Furthermore, correlations between phylogenetic β-diversity and spatial and environmental distances were analyzed by the Mantel test. Based on Dpw and Dnn metrics weighted by abundance or presence-absence data (Table 2 and S4), the phylogenetic dissimilarity of the tree communities was moderately correlated with the geographic distance, and the changes of soil and climate. For example, when measured by the constrained barcoding phylogeny, the abundance weighted Dpw values were strongly correlated with the geographical distance (Mantel’s r = 0.162, p < 0.01), the change of soil (Mantel’s r = 0.1766, p < 0.05), and the change of climate (Mantel’s r = 0.1593, p < 0.01). However, only Dpw abundance-weighted values were correlated with the change of elevation (Mantel’s r = 0.142, p < 0.05), and for any of the other three metrics indicating phylogenetic β-diversity, none of them was correlated with the change of elevation.

3.3. Relative Importance of Environmental Distance, Climatic Distance, and Geographical Distance on Phylogenetic β-Diversity

The geographical distance, the changes of soil and climatic distance were correlated with the observed patterns of phylogenetic dissimilarity. Only a small proportion of the variance in abundance weighted Dpw and Dnn could be explained by the geographical distance, the climatic distance, and the change of soil. The explanatory power of the geographical distance was greater (6.1%, p < 0.01) than that of the climatic distance (3.445%, p < 0.01), as indicated by the presence-absence S.E.S. Dnn based on the constrained barcoding phylogeny (Table 3). Variance partitioning highlighted the roles of the geographical distance, if taking S.E.S. Dnn as an example. In contrast, the dominating factor for S.E.S. Dpw was the change of soil.

4. Discussion

The underlying drivers of β-diversity have been discussed in many studies at different scales, but consistent conclusions remain unclear [6,8,9,14]. New insights for assessing the community assembly structure would benefit from phylogenetic relationships among species in a regional β-diversity. Taking advantage of the evolutionary information obtained from DNA barcoding data, this study carried out a phylogenetic β-diversity analysis on 42 forests plots along altitudinal and latitudinal gradients in mid-subtropical evergreen broad-leaved forests in China.

4.1. Assessment of Phylogenetic β-Diversity Based on Different Phylogenetic Methods

The estimation of phylogenetic relationships among species has become increasingly prevalent in assessing the assembly of community [13,19,22,23]. The level of topological resolution was considered to have a great impact on community structure analysis, because a well-resolved community phylogeny would improve the statistical ability for detecting the patterns of community structure [22]. In this study, three community phylogenies were built using different approaches, including the Phylomatic method and the ML analysis using combined DNA barcodes (rbcL + matK + ITS) with or without a constrained tree. When considering the efficiency of time and cost, the Phylomatic-generated phylogeny, which was trimmed from an accepted phylogeny, would be more feasible than the others. However, the APG system, which is committed to determine the family and ordinal relationships among seed plants based on a large amount of data, may be hard to include all species in the genus level. This in turn would result in low resolution for complex genera and poorly resolved topology in the community phylogeny [49]. In this study, some species in the genera of Ficus, Callicarpa, Ilex, Euonymus, and Castanopsis could not be well-resolved in the Phylomatic-generated tree. Given that DNA barcodes combing with the nuclear region offered enough sequence variation in those genera, ML phylogenetic trees using DNA barcodes performed much better on the structure of community phylogeny. However, there were about 30% of discrepancies at the ordinal level between the unconstrained barcoding ML tree and the APG phylogeny in this study, similar to previous phylogenetic community studies at the Dinghushan subtropical forest and the Brunei Darussalam tropical forest [21,49]. This may be due to the taxon-sampling issue (e.g., some orders included just one or two species in the community) or the limited number of species included. The application of a constrained tree based on the APG topology might be helpful for solving this problem [21]. In this study, the phylogeny generated by the combination of DNA barcode data (rbcL + matK + ITS) and a constrained tree was closely parallel with the widely accepted phylogenetic system at deep nodes and included high support values and a high level of species resolution.
Different results in the calculation of phylogenetic diversity were generally detected with different phylogenetic structures in many community phylogeny studies. In our study, the two phylogenetic β-diversity indices based on the Phylomatic-generated tree and the barcoding trees differed significantly. The ordinary-topology inconsistency between the two barcoding phylogenies was supposed to have a great influence on estimating phylogenetic diversity. However, results of the unconstrained barcoding tree were highly corresponded with that of the constrained barcoding tree, given that they shared the similar phylogenetic abundance distribution among terminal branches. In the other words, the application of a constrained tree on DNA barcoding trees may rarely affect estimates of the phylogenetic β-diversity patterns in our study, which seemed that the two employed phylogenetic β-metrics based on branch lengths might more greatly depend on the phylogenetic relationships among the terminal clades than among the deep clades. Our results were similar to that of a recently published study, where most of phylogenetic diversity parameters were more sensitive to the barcode data (rbcL, matK, and ITS) than the application of a constrained tree, when comparing the performance of different barcode combinations and phylogenetic construction methods by general linear mixed-effect models [50]. However, measures of some phylogenetic diversity parameters, which might highly depend on the phylogenetic topology such as IAC (imbalance of abundance among clades), would benefit from the use of a constrained phylogeny [50].

4.2. Patterns of Phylogenetic Turnover along Latitudinal and Altitudinal Gradients in Subtropical Forests

Identification of β-diversity patterns across ecological gradients, such as along the global or regional latitudinal gradients have been evaluated for a long time [6,8,9,14]. It is generally accepted that β-diversity declines with an increasing latitude, because of stronger environmental filtering and smaller species range size in lower latitudes than higher latitudes [6,51]. However, non-clear tendency was also observed when β-diversity was corrected by a standardized effect size [47]. Recently, the U-shape latitudinal relationship was detected in regional β-deviation for eastern North American trees [9]. In our study, the phylogenetic turnover of the JLS mountain at the lowest latitude was much larger than the other two mountains (Figure 2). In addition, the phylogenetic dissimilarities between JLS and the other two mountains (i.e., JGS and GS) were much lower than those of JGS vs. GS. The JLS mountain locates at the transition zone between the south-subtropical and the mid-tropical regions, which has greater habitat variability (i.e., warmer climates, more rainfall, and more complex geographic conditions) coinciding with a higher phylogenetic turnover. However, there was no difference between JGS and GS. Thus, the patterns of β-diversity may be more complicated than expected, and further analyses are needed in controlling latitudinal gradients of β-diversity in south China and elsewhere.
As the natural experiments for studying effects of climate change, elevational diversity gradients have attracted much attention in the past [14,15,52,53]. In our study, there was no significant tendency in the three mountains of subtropical forests along the altitudinal gradient (Figure 3). This result was inconsistent with the opinion that β-diversity declines with the increasing altitude, but was similar to the study of Tang et al. [54], where they failed to find any decline in large-scale patterns of altitudinal β-diversity in most mountains of China, particularly for mountains in subtropical forests. A possible reason for explaining the findings in this study would be that only evergreen broad-leaf forests with relatively similar vegetation types were explored and their elevational ranges (up to 1200 m) were limited. In addition, not all climate variability declined as the elevation increased. For example, diurnal range temperate in the Taibai mountain of China had no significant trend [55]. Moreover, human activities may modify mountain biodiversity. Increasing evidence shows that species diversity is lower at the middle altitude than lowlands because of human disturbance and land use change. Therefore, our results suggest that the variation of diversity along the altitude gradient might not be suitable for assessing phylogenetic β-diversity in subtropical mountains.

4.3. Relative Contribution of Geographical and Environmental Distances to Phylogenetic β-Diversity

In our study, the phylogenetic turnover between plots in each mountain or among different mountains was non-random (Figure 3). The drivers of community assembly under this phylogenetically non-random distribution may differ when using different phylogenetic β-metrics. The pairwise values of phylogenetic turnover were higher than expected, whereas the near neighbor metrics of phylogenetic β-diversity were lower than expected, implying that the phylogenetic β-diversity might be influenced by different ecological processes. It is widely accepted that variations in environmental heterogeneity and dispersal limitation are the two major mechanisms shaping gradients of phylogenetic β-diversity. In our study, results of variation partitioning analyses revealed that both spatial and environmental distances significantly accounted for the variance in phylogenetic β-diversity (Table 3). A recent phylogenetic β-diversity study for eastern North America trees suggest that the determiner of phylogenetic β-diversity is scale dependent, and environment filtering may shape phylogenetic β-diversity in a regional scale (spatial scale of more than 7 km for forest tree assemblages) [9]. Although the scale corresponding to the three mountains was limited, the habitat heterogeneity could not be underestimated for the high phylogenetic β-diversity in subtropical regions of China. Furthermore, a comprehensive molecular biogeographical study found that Eastern Asian flora might be relatively young and may provide refugia for ancient lineages [56]. This indicates that there might not be enough time to diffuse to suitable habitats for some lineages, implying that dispersion limitation would contribute to phylogenetic dissimilarity.
Our results showed that both edaphic and climate distances were more important than the geographical distance in determining S.E.S. Dpw, while S.E.S. Dnn was most affected by the geographical distance. The large difference between these two metrics was reported previously [19]. This phenomenon may attribute to the fact that Dpw includes more phylogenetic information than that of Dnn and the variation of species abundance distribution between plots may drive the dissimilarity of Dpw, but not Dnn. Therefore, Dpw would be a more powerful metric than Dnn in reflecting the phylogenetic β-diversity patterns.
However, there was still a considerable amount of unexplained variation for phylogenetic β-diversity in this study. This may be attributed to three main reasons. The first reason would be the limited scale of our study. The effects of various underlying drivers of diversity may vary in different scales [57]. The estimates of phylogenetic β-diversity in this study were conducted in a number of 400 m2 plots within EBLFs. In such cases, not all environmental conditions might be included and then it was difficult to determine the universality of observed diversity patterns in several scales. The second reason would be the limited ecological processes analyzed in our study. For example, variation of species range size is generally recognized as one of the major mechanisms invoking phylogenetic β-diversity [9,58,59], which unfortunately could not be considered in our study. The third reason would be that functional traits were not taken into account in this β-diversity study, sharing the same weakness for ecological inferences in many phylogenetic diversity studies. In general, species are not functionally identical in the community, even for closely related species. As indicators of ecological strategy for species, functional traits could provide more refined ecological inferences for the community structure and diversity [8,13]. Therefore, further studies of community phylogeny need to combine functional traits and phylogenetic β-diversity metrics, and explore more ecological processes for addressing the mechanisms of community assembly comprehensively at multiple spatial scales in subtropical forests.

5. Conclusions

This study examined the effectiveness of the combination of three barcodes (rbcL + matK + ITS) on the calculation of phylogenetic β-diversity, and explored the underlying drivers of community assembly in EBLFs of China. The combined DNA barcodes (rbcL + matK + ITS) was able to construct a more finely resolved community phylogeny in subtropical forests than the traditional Phylomatic approach. Given the complexity and sensitivity of different phylogenetic diversity metrics to tree topology, the use of a constrained tree coupled with DNA barcode data was considered in generating community phylogenies. Non-random patterns of phylogenetic β-diversity were found. We emphasized the importance of niche conservatisms in shaping species diversity patterns, and the influence of existing mountains as the geographical barriers on the dispersal of some species (e.g., relic species) in EBLFs of China.

Supplementary Materials

The following are available online at https://www.mdpi.com/1999-4907/10/10/923/s1, Table S1: The species lists with Genbank accession numbers. Table S2: The correlation coefficients of the original variables with each PC axis. Table S3: Pairwise t-test for the S.E.S. Dpw and S.E.S. Dnn between each pair of plots by three different phylogenies. Table S4: The mantel test between phylogenetic β-diversity and geographical and environmental distances for forest plots using different phylogenetic approaches. Table S5: Results from the permutational multivariate analysis of variance using phylogenetic β-diversity indices by ‘adonis’ when using different phylogenetic approaches. Figure S1: Location for three mountains in mid-subtropical evergreen broad-leaved forests of China. Figure S2: Dispersion of the four phylogenetic β-metrics bases on un-constrained barcoding tree for each mountain and between different mountains. Figure S3: Dispersion of the four phylogenetic β-metrics based on Phylomatic-generated tree for each mountain and between different mountains. Figure S4: Correlations between S.E.S.Dnn.aw and S.E.S. Dnn.bin of the three phylogenetic trees (the Phylomatic-generated tree, the unconstrained barcoding tree, and the constrained barcoding tree). S1 Text: Text file containing different phylogenies generated in this study. (1) the ML tree of barcoding without a constrained tree; (2) the ML tree of barcoding with a constrained tree; (3) the Phylomatic-generated tree.

Author Contributions

J.L. (Juan Liu) and S.W. designed the experiment. J.L. (Juan Liu), J.L. (Jiajia Liu), and Z.Z. performed the study data collection. J.L. (Juan Liu) and S.W. analyzed the results. J.L. (Juan Liu), X.G. and G.H. reviewed the article. J.L. (Juan Liu) wrote the final article. All authors approved the final version of the manuscript.

Funding

This research was funded by the National Nature Science Foundation of China (41867007, 31500341, and 31570210) and the Science and Technology Departments of Jiangxi Province in China (20171BAB214034).

Acknowledgments

We thank Qingpei Yang and Wensheng Bu for their assistant on field experiments. We also thank Lin Chen for species identification.

Conflicts of Interest

The authors declare no conflict of interest.

References

  1. Keddy, P.A. Assembly and response rules: Two goals for predictive community ecology. J. Veg. Sci. 1992, 3, 157–164. [Google Scholar] [CrossRef]
  2. Kubota, Y.; Hirao, T.; Fujii, S.J.; Shiono, T.; Kusumoto, B. Beta diversity of woody plants in the Japanese archipelago: The roles of geohistorical and ecological processes. J. Biogeogr. 2014, 41, 1267–1276. [Google Scholar] [CrossRef]
  3. Hawkins, B.A.; Porter, E.E. Relative influences of current and historical factors on mammal and bird diversity patterns in deglaciated North America. Glob. Ecol. Biogeogr. 2003, 12, 475–481. [Google Scholar] [CrossRef] [Green Version]
  4. Willis, K.J.; Niklas, K.J. The Role of Quaternary Environmental Change in Plant Macroevolution: The Exception or the Rule? Philos. Trans. R. Soc. B 2004, 359, 159–172. [Google Scholar] [CrossRef] [PubMed]
  5. Lorenzo, M.; Alessio, B.; Enzo, B.; Germano, F.; Fabrizio, M.; Filippo, P.; Riccardo, B. Beta-diversity patterns elucidate mechanisms of alien plant invasion in mountains. Glob. Ecol. Biogeogr. 2013, 22, 450–460. [Google Scholar]
  6. Qian, H.; Ricklefs, R.E. A latitudinal gradient in large-scale beta diversity for vascular plants in North America. Ecol. Lett. 2007, 10, 737–744. [Google Scholar] [CrossRef]
  7. Legendre, P.; Borcard, D.; Peres-Neto, P.R. Analyzing beta diversity: Partitioning the spatial variation of community composition data. Ecol. Monogr. 2005, 75, 435–450. [Google Scholar] [CrossRef]
  8. Swenson, N.G. Phylogenetic beta diversity metrics, trait evolution and inferring the functional beta diversity of communities. PLoS ONE 2011, 6, e21264. [Google Scholar] [CrossRef]
  9. Xing, D.; He, F. Environmental filtering explains a U-shape latitudinal pattern in regional β-deviation for eastern North American trees. Ecol. Lett. 1111, 22, 284–291. [Google Scholar] [CrossRef]
  10. Webb, C.O. Exploring the phylogenetic structure of ecological communities: An example for rain forest trees. Am. Nat. 2000, 156, 145–155. [Google Scholar] [CrossRef]
  11. Webb, C.O.; Ackerly, D.D.; McPeek, M.A.; Donoghue, M.J. Phylogenies and community ecology. Annu. Rev. Ecol. Evol. Syst. 2002, 33, 475–505. [Google Scholar] [CrossRef]
  12. Qian, H.; Zhang, Y.; Zhang, J.; Wang, X. Latitudinal gradients in phylogenetic relatedness of angiosperm trees in North America. Glob. Ecol. Biogeogr. 2013, 22, 1183–1191. [Google Scholar] [CrossRef]
  13. Yang, J.; Zhang, G.; Ci, X.; Swenson, N.G.; Cao, M.; Sha, L.; Li, J.; Baskin, C.C.; Slik, J.; Lin, L. Functional and phylogenetic assembly in a Chinese tropical tree community across size classes, spatial scales and habitats. Funct. Ecol. 2014, 28, 520–529. [Google Scholar] [CrossRef]
  14. McFadden, L.R.; Sandel, B.; Tsirogiannis, C.; Morueta-Holme, N.; Svenning, J.C.; Enquist, B.J.; Kraft, N.J.B. Temperature shapes opposing latitudinal gradients of plant taxonomic and phylogenetic beta diversity. Ecol. Lett. 2019, 22, 112–1135. [Google Scholar] [CrossRef] [PubMed]
  15. Qian, H.; Hao, Z.; Zhang, J. Phylogenetic structure and phylogenetic diversity of angiosperm assemblages in forests along an elevational gradient in Changbaishan, China. J. Plant Ecol. 2014, 7, 154–165. [Google Scholar] [CrossRef] [Green Version]
  16. Liu, X.; Swenson, N.G.; Zhang, J.; Ma, K. The environment and space, not phylogeny, determine trait dispersion in a subtropical forest. Funct. Ecol. 2013, 27, 264–272. [Google Scholar] [CrossRef]
  17. Chi, X.; Tang, Z.; Fang, J. Patterns of phylogenetic beta diversity in China’s grasslands in relation to geographical and environmental distance. Basic Appl. Ecol. 2014, 15, 416–425. [Google Scholar] [CrossRef]
  18. González-Caro, S.; Umaña, M.N.; Álvarez, E.; Stevenson, P.R.; Swenson, N.G. Phylogenetic alpha and beta diversity in tropical tree assemblages along regional-scale environmental gradients in northwest South America. J. Plant Ecol. 2014, 7, 145–153. [Google Scholar] [CrossRef]
  19. Zhang, J.L.; Swenson, N.G.; Chen, S.B.; Liu, X.J.; Li, Z.S.; Huang, J.H.; Mi, X.C.; Ma, K.P. Phylogenetic beta diversity in tropical forests: Implications for the roles of geographical and environmental distance. J. Syst. Evol. 2013, 51, 71–85. [Google Scholar] [CrossRef]
  20. Lahaye, R.; van der Bank, M.; Bogarin, D.; Warner, J.; Pupulin, F.; Gigot, G.; Maurin, O.; Duthoit, S.; Barraclough, T.G.; Savolainen, V. From the Cover: DNA barcoding the floras of biodiversity hotspots. Proc. Natl. Acad. Sci. USA 2008, 105, 2923–2928. [Google Scholar] [CrossRef]
  21. Pei, N.C.; Lian, J.Y.; Erickson, D.L.; Swenson, N.G.; Kress, W.J.; Ye, W.H.; Ge, X.J. Exploring tree-habitat associations in a Chinese subtropical forest plot using a molecular phylogeny generated from DNA barcode loci. PLoS ONE 2011, 6, e21273. [Google Scholar] [CrossRef]
  22. Kress, W.J.; Erickson, D.L.; Jones, F.A.; Swenson, N.G.; Perez, R.; Sanjur, O.; Bermingham, E. Plant DNA barcodes and a community phylogeny of a tropical forest dynamics plot in Panama. Proc. Natl. Acad. Sci. USA 2009, 106, 18621–18626. [Google Scholar] [CrossRef] [PubMed] [Green Version]
  23. Costion, C.; Ford, A.; Cross, H.; Crayn, D.; Harrington, M.; Lowe, A. Plant DNA barcodes can accurately estimate species richness in poorly known floras. PLoS ONE 2011, 6, e26841. [Google Scholar] [CrossRef] [PubMed]
  24. Erickson, D.L.; Jones, F.A.; Swenson, N.G.; Pei, N.C.; Bourg, N.A.; Chen, W.; Davies, S.J.; Ge, X.J.; Hao, Z.; Howe, R.W. Comparative evolutionary diversity and phylogenetic structure across multiple forest dynamics plots: A mega-phylogeny approach. Front. Genet. 2014, 5, 358. [Google Scholar] [CrossRef] [PubMed]
  25. Liu, J.; Yan, H.F.; Newmaster, S.G.; Pei, N.C.; Ragupathy, S.; Ge, X.J. The use of DNA barcoding as a tool for the conservation biogeography of subtropical forests in China. Divers. Distrib. 2015, 21, 188–199. [Google Scholar] [CrossRef]
  26. Huang, X.C.; Ci, X.Q.; Conran, J.G.; Li, J. Application of DNA barcodes in Asian tropical trees–A case study from Xishuangbanna nature reserve, Southwest China. PLoS ONE 2015, 10, e0129295. [Google Scholar] [CrossRef]
  27. Tripathi, A.M.; Tyagi, A.; Kumar, A.; Singh, A.; Singh, S.; Chaudhary, L.B.; Roy, S. The internal transcribed spacer (its) region and trnH-psbA are suitable candidate loci for DNA barcoding of tropical tree species of India. PLoS ONE 2013, 8, e57934. [Google Scholar] [CrossRef]
  28. Liu, J.; Yan, H.F.; Ge, X.J. The use of DNA barcoding on recently diverged species in the genus Gentiana (Gentianaceae) in China. PLoS ONE 2016, 11, e0153008. [Google Scholar] [CrossRef]
  29. Li, D.Z.; Gao, L.M.; Li, H.T.; Wang, H.; Ge, X.J.; Liu, J.Q.; Chen, Z.D.; Zhou, S.L.; Chen, S.L.; Yang, J.B.; et al. Comparative analysis of a large dataset indicates that internal transcribed spacer (ITS) should be incorporated into the core barcode for seed plants. Proc. Natl. Acad. Sci. USA 2011, 108, 19641–19646. [Google Scholar] [Green Version]
  30. Yan, L.J.; Liu, J.; Möller, M.; Zhang, L.; Zhang, X.M.; Li, D.Z.; Gao, L.M. DNA barcoding of Rhododendron (Ericaceae), the largest Chinese plant genus in biodiversity hotspots of the Himalaya–Hengduan Mountains. Mol. Ecol. Resour. 2014, 15, 932–944. [Google Scholar] [CrossRef]
  31. Wang, X.H.; Kent, M.; Fang, X.F. Evergreen broad-leaved forest in Eastern China: Its ecology and conservation and the importance of resprouting in forest restoration. For. Ecol. Manag. 2007, 245, 76–87. [Google Scholar] [CrossRef]
  32. Condit, R.; Pitman, N.; Leigh, E.G.; Chave, J.; Terborgh, J.; Foster, R.B.; Nunez, V.P.; Aguilar, S.; Valencia, R.; Villa, G.; et al. Beta-diversity in tropical forest trees. Science 2002, 925, 666–669. [Google Scholar] [CrossRef] [PubMed]
  33. Legendre, P.; Mi, X.C.; Ren, H.B.; Ma, K.P.; Yu, M.J.; Sun, I.F.; He, F.L. Partitioning beta diversity in a subtropical broad-leaved forest of China. Ecology 2009, 90, 663–674. [Google Scholar] [CrossRef] [PubMed]
  34. Qiao, X.J.; Jiang, Q.H.; Jiang, Q.H.; Lu, J.M.; Franklin, S.; Tang, Z.Y.; Wang, Q.G.; Zhang, J.X.; Lu, Z.J.; Bao, D.C.; et al. Beta diversity determinants in Badagongshan, a subtropical forest in central China. Sci. Rep. 2015, 5, 17403. [Google Scholar] [CrossRef]
  35. Tian, S.; Kou, Y.X.; Zhang, Z.R.; Yuan, L.; Li, D.R.; López-Pujol, J.; Fan, D.M.; Zhang, Z.Y. Phylogeography of Eomecon chionantha in subtropical China: The dual roles of the Nanling Mountains as a glacial refugium and a dispersal corridor. BMC Evol. Biol. 2018, 18, 20. [Google Scholar] [CrossRef]
  36. Muellner-Riehl, A.N. Mountains as evolutionary arenas: Patterns, emerging approaches, paradigm shifts, and their implications for plant phylogeographic research in the Tibeto-Himalayan region. Front. Plant Sci. 2019, 10, 195. [Google Scholar] [CrossRef]
  37. Song, Y.C.; Da, L.J. Evergreen broad-leaved forest of East Asia. In Vegetation Structure and Function at Multiple Spatial, Temporal and Conceptual Scales; Box, E.O., Ed.; Springer International: Switzerland, The Netherlands, 2016; Volume 1, pp. 101–128. [Google Scholar] [CrossRef]
  38. Fang, J.Y.; Wang, X.P.; Tang, Z.Y.; Shen, Z.H.; Zheng, C.Y. Exploring patterns of plant diversity in China’s mountains. In Data Mining for Global Trends in Mountain Biodiversity; Box, E.O., Ed.; Springer International: Switzerland, The Netherlands, 2014. [Google Scholar] [CrossRef]
  39. Wan, S.; Zhang, C.; Chen, Y.; Zhao, J.; Wang, X.; Wu, J.; Zhou, L.; Lin, Y.; Liu, Z.; Fu, S. The understory fern Dicranopteris dichotomafacilitates the overstory Eucalyptus trees in subtropical plantations. Ecosphere 2014, 5, 51. [Google Scholar] [CrossRef]
  40. Doyle, J.L.; Doyle, J.L. A rapid DNA isolate procedure for small quantities of fresh leaf tissue. Phytochem. Bull. 1987, 19, 11–15. [Google Scholar]
  41. Zane, A.E.; Tank, D.C.; Cornwell, W.K. Eastman, J.M.; Smith, S.A.; FitzJohh, R.G.; McGlinn, D.J.; O’Meara, B.C.; Moles, A.T.; Reich, P.B.; et al. Three keys to the radiation of angiosperms into freezing environment. Nature 2014, 506, 89–92. [Google Scholar] [CrossRef]
  42. Kress, W.J.; Erickson, D.L.; Swenson, N.G.; Thompson, J.; Uriarte, M.; Zimmerman, J.K.; Chave, J. Advances in the use of DNA barcodes to build a community phylogeny for tropical trees in a Puerto Rican forest dynamics plot. PLoS ONE 2010, 5, e15409. [Google Scholar] [CrossRef]
  43. Miller, A.M.; Pfeiffer, W.; Schwartz, T. Creating the CIPRES Science Gateway for inference of large phylogenetic trees. In Proceedings of the Gateway Computing Environments Workshop (GCE), New Orleans, LO, USA, 14 November 2010. [Google Scholar] [CrossRef]
  44. Dariba, D.; Taboada, G.L.; Doallo, R.; Posada, D. jModelTest 2: More models, new heuristics and parallel computing. Nat. Methods 2012, 9, 772. [Google Scholar] [CrossRef] [PubMed]
  45. Britton, T.; Oxelman, B.; Vinnersten, A.; Bremer, K. Phylogenetic dating with confidence intervals using mean path lengths. Mol. Phylogenet. Evol. 2012, 24, 58–65. [Google Scholar] [CrossRef]
  46. Swenson, N.G.; Erickson, D.L.; Mi, X.; Bourg, N.A.; Forero-Montaña, J.; Ge, X.; Howe, R.; Lake, J.K.; Liu, X.; Ma, K. Phylogenetic and functional alpha and beta diversity in temperate and tropical tree communities. Ecology 2012, 93, S112–S125. [Google Scholar] [CrossRef] [Green Version]
  47. Kubota, Y.; Kusumoto, B.; Shiono, T.; Ulrich, W. Environmental filters shaping angiosperm trees assembly along climatic and geographical gradients. J. Veg. Sci. 2018, 29, 1–12. [Google Scholar] [CrossRef]
  48. Massante, J.C.; Götzenberger, L.; Takkis, K.; Hallikma, T.; Kaasik, A.; Laanisto, L.; Hutchings, M.; Gerhold, P. Contrasting latitudinal patterns in phylogenetic diversity between woody and herbaceous communities. Sci. Rep. 2019, 9, 6443. [Google Scholar] [CrossRef]
  49. Heckenhauer, J.; Salim, K.A.; Chase, M.W.; Dexter, K.G.; Pennington, R.T.; Tan, S.; Kaye, M.E.; Samuel, R. Plant DNA barcodes and assessment of phylogenetic community structure of a tropical mixed dipterocarp forest in Brunei Darussalam (Borneo). PLoS ONE 2017, 12, e0185861. [Google Scholar] [CrossRef] [PubMed]
  50. Liu, J.; Liu, J.; Shan, Y.X.; Ge, X.J.; Burgess, K.S. The use of DNA barcodes to estimate phylogenetic diversity in forest communities of southern China. Ecol. Evol. 2019, 9, 5372–5379. [Google Scholar] [CrossRef]
  51. Qian, H.; Ricklefs, R.E.; White, P.S. Beta diversity of angiosperms in temperate floras of eastern Asia and eastern North America. Ecol. Lett. 2005, 8, 15–22. [Google Scholar] [CrossRef]
  52. Alexander, J.M.; Kueffer, C.; Daehler, C.C.; Edwards, P.J.; Pauchard, A.; Seipel, T.; Consortium, M.; Arévalo, J.; Cavieres, L.; Dietz, H. Assembly of nonnative floras along elevational gradients explained by directional ecological filtering. Proc. Natl. Acad. Sci. USA 2011, 108, 656–661. [Google Scholar] [CrossRef]
  53. Haider, S.; Kueffer, C.; Bruelheide, H.; Seipel, T.; Alexander, J.M.; Rew, L.J.; Arévalo, J.R.; Cavieres, L.A.; McDougall, K.L.; Milbau, A.; et al. Mountain roads and non-native species modify elevational patterns of plant diversity. Global Ecol. Biogeogr. 2018, 27, 667–678. [Google Scholar] [CrossRef] [Green Version]
  54. Tang, Z.; Fang, J.; Chi, X.; Feng, J.; Liu, Y.; Shen, Z.; Wang, X.; Wang, Z.; Wu, X.; Zheng, C. Patterns of plant beta-diversity along elevational and latitudinal gradients in mountain forests of China. Ecography 2012, 35, 1083–1091. [Google Scholar] [CrossRef]
  55. Tang, Z.Y.; Fang, J.Y. Temperature variation along the northern and southern slopes of Mt. Taibai, China. Agric. For. Meteorol. 2006, 139, 200–207. [Google Scholar] [CrossRef]
  56. Deng, T.; Zhou, Z.; Sun, H.; Chen, Y.-S. Is the East Asian flora ancient or not? Natl. Sci. Rev. 2018, 5, 920–932. [Google Scholar] [CrossRef]
  57. Swenson, N.G.; Enquist, B.J.; Pither, J.; Thompson, J.; Zimmerman, J.K. The problem and promise of scale dependency in community phylogenetics. Ecology 2006, 87, 2418–2424. [Google Scholar] [CrossRef]
  58. Kraft, N.J.; Comita, L.S.; Chase, J.M.; Sanders, N.J.; Swenson, N.G.; Crist, T.O.; Stegen, J.C.; Vellend, M.; Boyle, B.; Anderson, M.J. Disentangling the drivers of β-diversity along latitudinal and elevational gradients. Science 2011, 333, 1755–1758. [Google Scholar] [CrossRef]
  59. Wang, Z.; Fang, J.; Tang, Z.; Shi, L. Geographical patterns in the beta diversity of China’s woody plants: The influence of space, environment and range size. Ecography 2012, 35, 1092–1102. [Google Scholar] [CrossRef]
Figure 1. Comparison of the ordinal topologies between the Phylomatic-generated tree (APG phylogeny) and the unconstrained barcoding tree (rbcL + matK + ITS) generated from the ML analysis.
Forests 10 00923 g001
Figure 2. Correlations between S.E.S.Dpw.aw and S.E.S.Dpw.bin of the three phylogenetic trees (the Phylomatic-generated tree, the unconstrained barcoding tree, and the constrained barcoding tree).
Forests 10 00923 g002
Figure 3. Dispersion of the four phylogenetic β-metrics using constrained barcoding tree for each mountain and between different mountains. JLS, JGS, and GS represent the phylogenetic turnover of the Jiulianshan, Jinggangshan, and Guangshan mountain, respectively. JLS vs. JGS represents the dissimilarity between pair plots from JLS and JGS respectively; JLS vs. GS represents the dissimilarity between pair plots from JLS and GS respectively; and GS vs. JGS represents the dissimilarity between pair plots from GS and JGS respectively. Different letters on the top of each boxplot stand for the significant differences among comparisons with LSD tests (p < 0.05).
Forests 10 00923 g003
Figure 4. Patterns of the four phylogenetic β-diversity metrics based on the constrained barcoding phylogeny along the altitudinal gradient for the three mountains.
Forests 10 00923 g004
Table 1. The first three principal components (PCs) of the two principal component analyses for climatic and soil variables.
ClimateSoil
PC1PC2PC3PC1PC2PC3
Eigenvalue3.5451.3620.0892.6571.5660.3903
Proportion of variation70.8927.241.79953.1331.337.810
Cumulative % of variance70.8998.1399.9353.1384.4692.26
Table 2. Mantel test between phylogenetic β-diversity based on the constrained barcoding phylogeny and geographical and environmental distances for forests plots.
Geographical DistanceChange of SoilChange of ElevationChange of Climate
Dnn abundance-weighted0.0175 **0.28700.09270.1534 *
Dnn presence-absence0.1449 **0.1953 *0.08950.1701 **
Dpw abunance weighted0.1620 **0.1766 *0.1420 *0.1593 **
Dpw presence-absence0.2301 **0.2870 *0.08550.1626 **
** and * indicate the significance at the levels of p < 0.001 and 0.05 respectively.
Table 3. Percentages of variation of phylogenetic β-diversity (using the constrained barcoding phylogeny) accounted for the change in geographical distance, edaphic distance, and climatic distance for the four phylogenetic β-diversity metrics based on results of the permutational multivariate analysis of variance using phylogenetic β-diversity indices by ‘adonis’.
S.E.S. Dnn.awS.E.S. Dnn.binS.E.S. Dpw.awS.E.S. Dpw.bin
Geographical distance6.100 **2.706 **0.2600.579 *
Edaphic distance0.22800.0672.480 **1.857 **
Climatic distance3.445 **0.824 **0.0391.485 **
Geographical distance + edaphic distance0.390.1010.793 **0.044
Geographical distance + climatic distance0.0080.0361.812 **0.895 **
Edaphic distance + climatic distance1.885 **1.046 *0.624 *0.420 *
Geographical distance + edaphic distance + climatic distance0.030.2970.1330.032
Residuals88.0294.92293.8694.69
** and * indicate the significance at the levels of p < 0.001 and 0.05 respectively.

