1. Introduction
Humans often interact with forests, which may disturb the activities of birds and other animals which live there; this interaction might also disturb the biodiversity in these forests [
1,
2,
3]. Therefore, it is important to understand the relationships between bird and human activities in forests [
4]. Due to the large size of forests, it is expensive to send experts to each forest to monitor these activities manually. Thus, there is a demand for methods able to summarize the patterns of bird chirping and human activities in forest areas over time. Recently, bioacoustic data have been utilized to monitor different phenomena [
5] in natural environments, such as forests, for many different applications, such as species classification [
6] and environmental monitoring [
7,
8]. Bioacoustics analysis could also be used to address the challenge of monitoring and summarizing interactions between human and bird activity in forests. Setting up bioacoustic sensors in forests provides an economic and efficient way to collect bioacoustic data, providing rich information [
9] with which to study animal communities. However, analyzing and summarizing these data to provide insight into how human and bird activities affect each other has not been addressed until now.
Most researchers take advantage of remote bioacoustic sensors to work on classifying specific species, especially birds. Salamon and Bello [
10] applied a deep convolutional neural network to bird flight calls to classify 43 different species based on the features of mel-frequency cepstral coefficients (MFCCs). Their overall classification accuracy was 96%. Zhao and Zhang [
11] applied a support vector machine (SVM) to classify 10 species with an average precision of 95%. Moreover, Zamanian and Pourghassem [
12] fed 29 features extracted from both the temporal and spectral domains into a multi-layer perceptron (MLP) model to classify insects and achieved an average of 99% accuracy. The first limitation of the previous works is that they focused only on classifying a specific animal group, such as a bird species [
7,
10], insect species [
13,
14], etc. However, it is also meaningful to study mixed category classifications, such as bird chirping and human activities. In some environmental studies, details about which species of birds are present in a location may not be as important as understanding how overall bird chirping changes over time as a whole event. The aim of such studies might be to study or compare this kind of event with other events, like human activities [
15,
16]. The second limitation is that most previous works on bioacoustics have focused only on researching the appropriate methods by which to classify or detect events [
17,
18,
19] and comparing the results with different methods, without studying how to summarize the patterns of these events over time (for example, how the patterns change by month or season). This means that these analyses, while accurate, require thorough expert analysis to gain real insight into species interactions. Effective summarization is required to reduce costs and quickly inform organizations about how to best interact with forests with minimal disturbance to other species, such as birds.
In this paper, we proposed an integrated system to not only classify bird chirping and human activities, but also to provide a frequency–duration graph (FDG) framework to summarize the patterns of these activities over time. This system will help researchers who are interested in studying the relationships between bird and human activities to gain a deeper insight into the patterns of these events as they evolve in forests at different time periods over time.
The remainder of this paper is organized as follows.
Section 2 introduces the materials and methods,
Section 3 gives the case-study-based evaluation,
Section 4 shows the results and discussion, and
Section 5 offers the conclusions of the whole study.
2. Materials and Methods
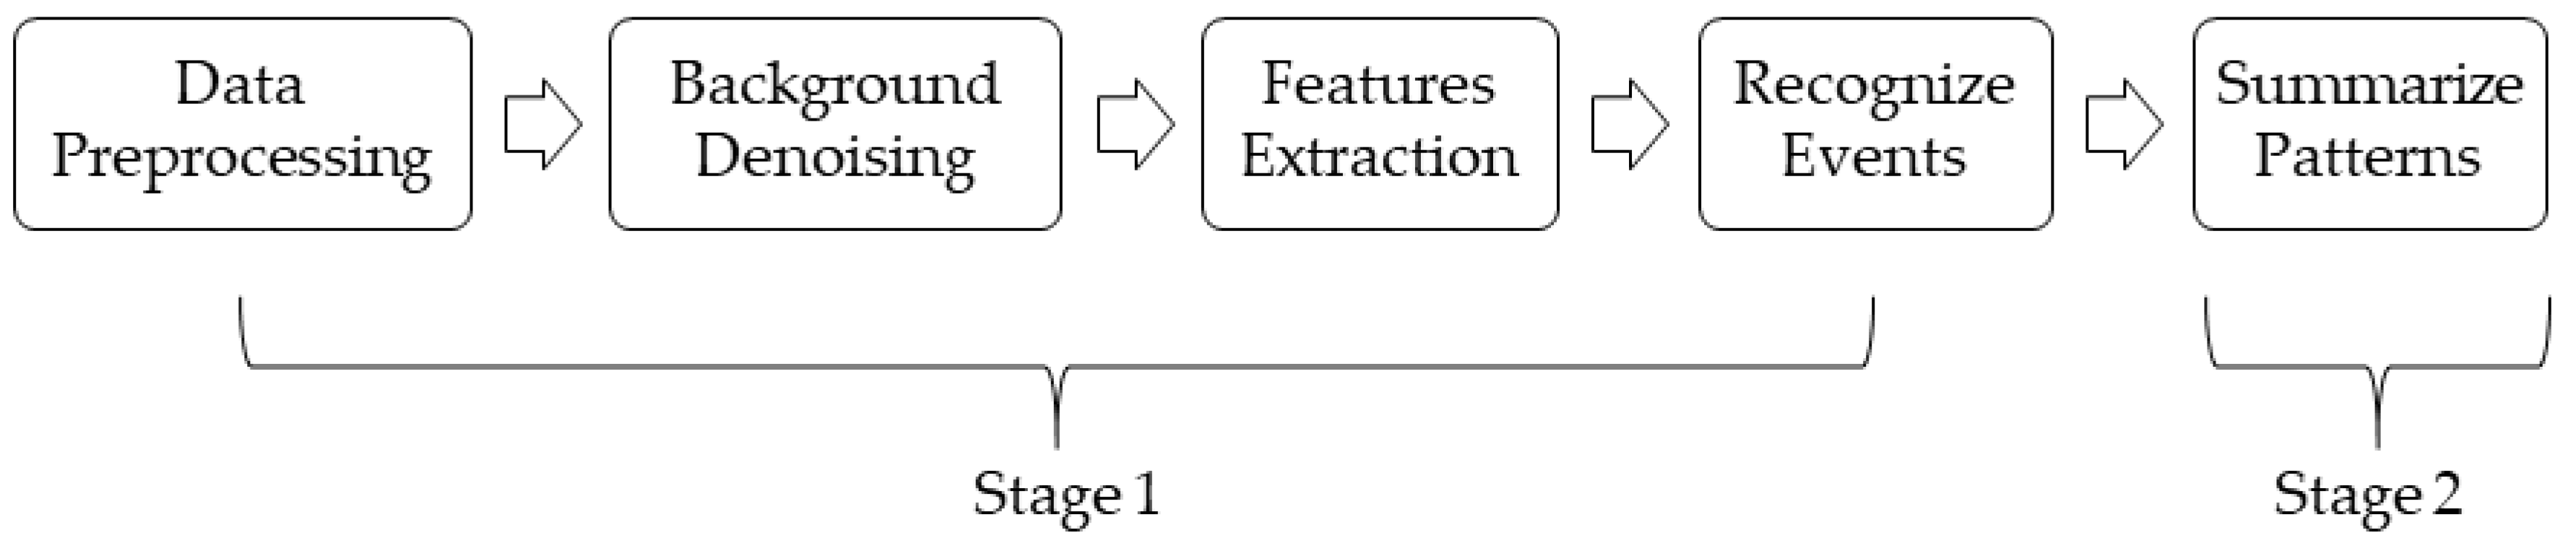
This system proposed consists of two stages. The first stage recognizes different events in a natural forest environment based on bioacoustic data, and the second stage summarizes the patterns of these events during any given time period. In this system, data are segmented based on expert annotations and input into our proposed system, although the system should be compatible with the automatic segmentation methods derived in the existing literature [
19]. In this work, we focused only on how to recognize events based on already-event-segmented periods, and how to summarize patterns of events over time.
Figure 1 shows a system overview.
First, the raw bioacoustic data were converted into the WAV format with a 22.05 kHz sample rate. Next, the background noises of the preprocessed data were removed by applying low and high-pass filters [
7,
20]. The low and high-pass filters were used to filter out the noisy frequency regions that we were not interested in. According to the dataset and Pijanowski et al. [
21], human noises and bird chirping lie in the frequency range of 1 kHz to 10 kHz. As such, the high-pass filter was set to 10 kHz, and the low-pass filter was set to 1 kHz. This meant that the frequency regions above 10 kHz and below 1 kHz were filtered out. The background noises to be filtered out included wind noises, which are in the low-frequency range (from 20 Hz to 200 Hz), and special machine noises, which are above 10 kHz. After background denoising, features were extracted based on the pre-segmented periods of events. Different classifiers were then implemented to classify different events using the extracted features. The final step was to summarize the patterns of events based on the given period of bioacoustic data. To make the system flexible, the number of events and classifiers can be modified to suit different researchers’ interests.
In summary, the goal of this system was, given a set of bioacoustic recordings as the input, to output a summary of different events’ patterns over time.
2.1. Feature Extraction
A set of features were extracted based on each period of events based on the bioacoustic signal. These features are the mean of zero-crossing rate (zcrMean), standard deviation of zero-crossing rate (zcrSD), mean of spectral centroid (specMean), standard deviation of spectral centroid (specSD), mean of root mean square (rmsMean), mel-frequency cepstral coefficients (MFCCs), and spectral entropy (spectralEntropy).
2.1.1. zcrMean, zcrSD, specMean, specSD, and rmsMean
The features of zcrMean and zcrSD were calculated based on the zero-crossing rate. The zero-crossing rate is a commonly used feature in bioacoustic analysis, which measures the rate of signal changes from positive to zero and from negative to zero [
22]. The features of specMean and specSD were calculated based on the spectral centroid. The spectral centroid is another commonly used feature in signal analysis, which measures the gravity of the spectrum in a given signal period [
12]. The rmsMean feature was calculated based on the root mean square of the signal in each period. This feature is commonly used in signal analysis to measure the average power of a signal [
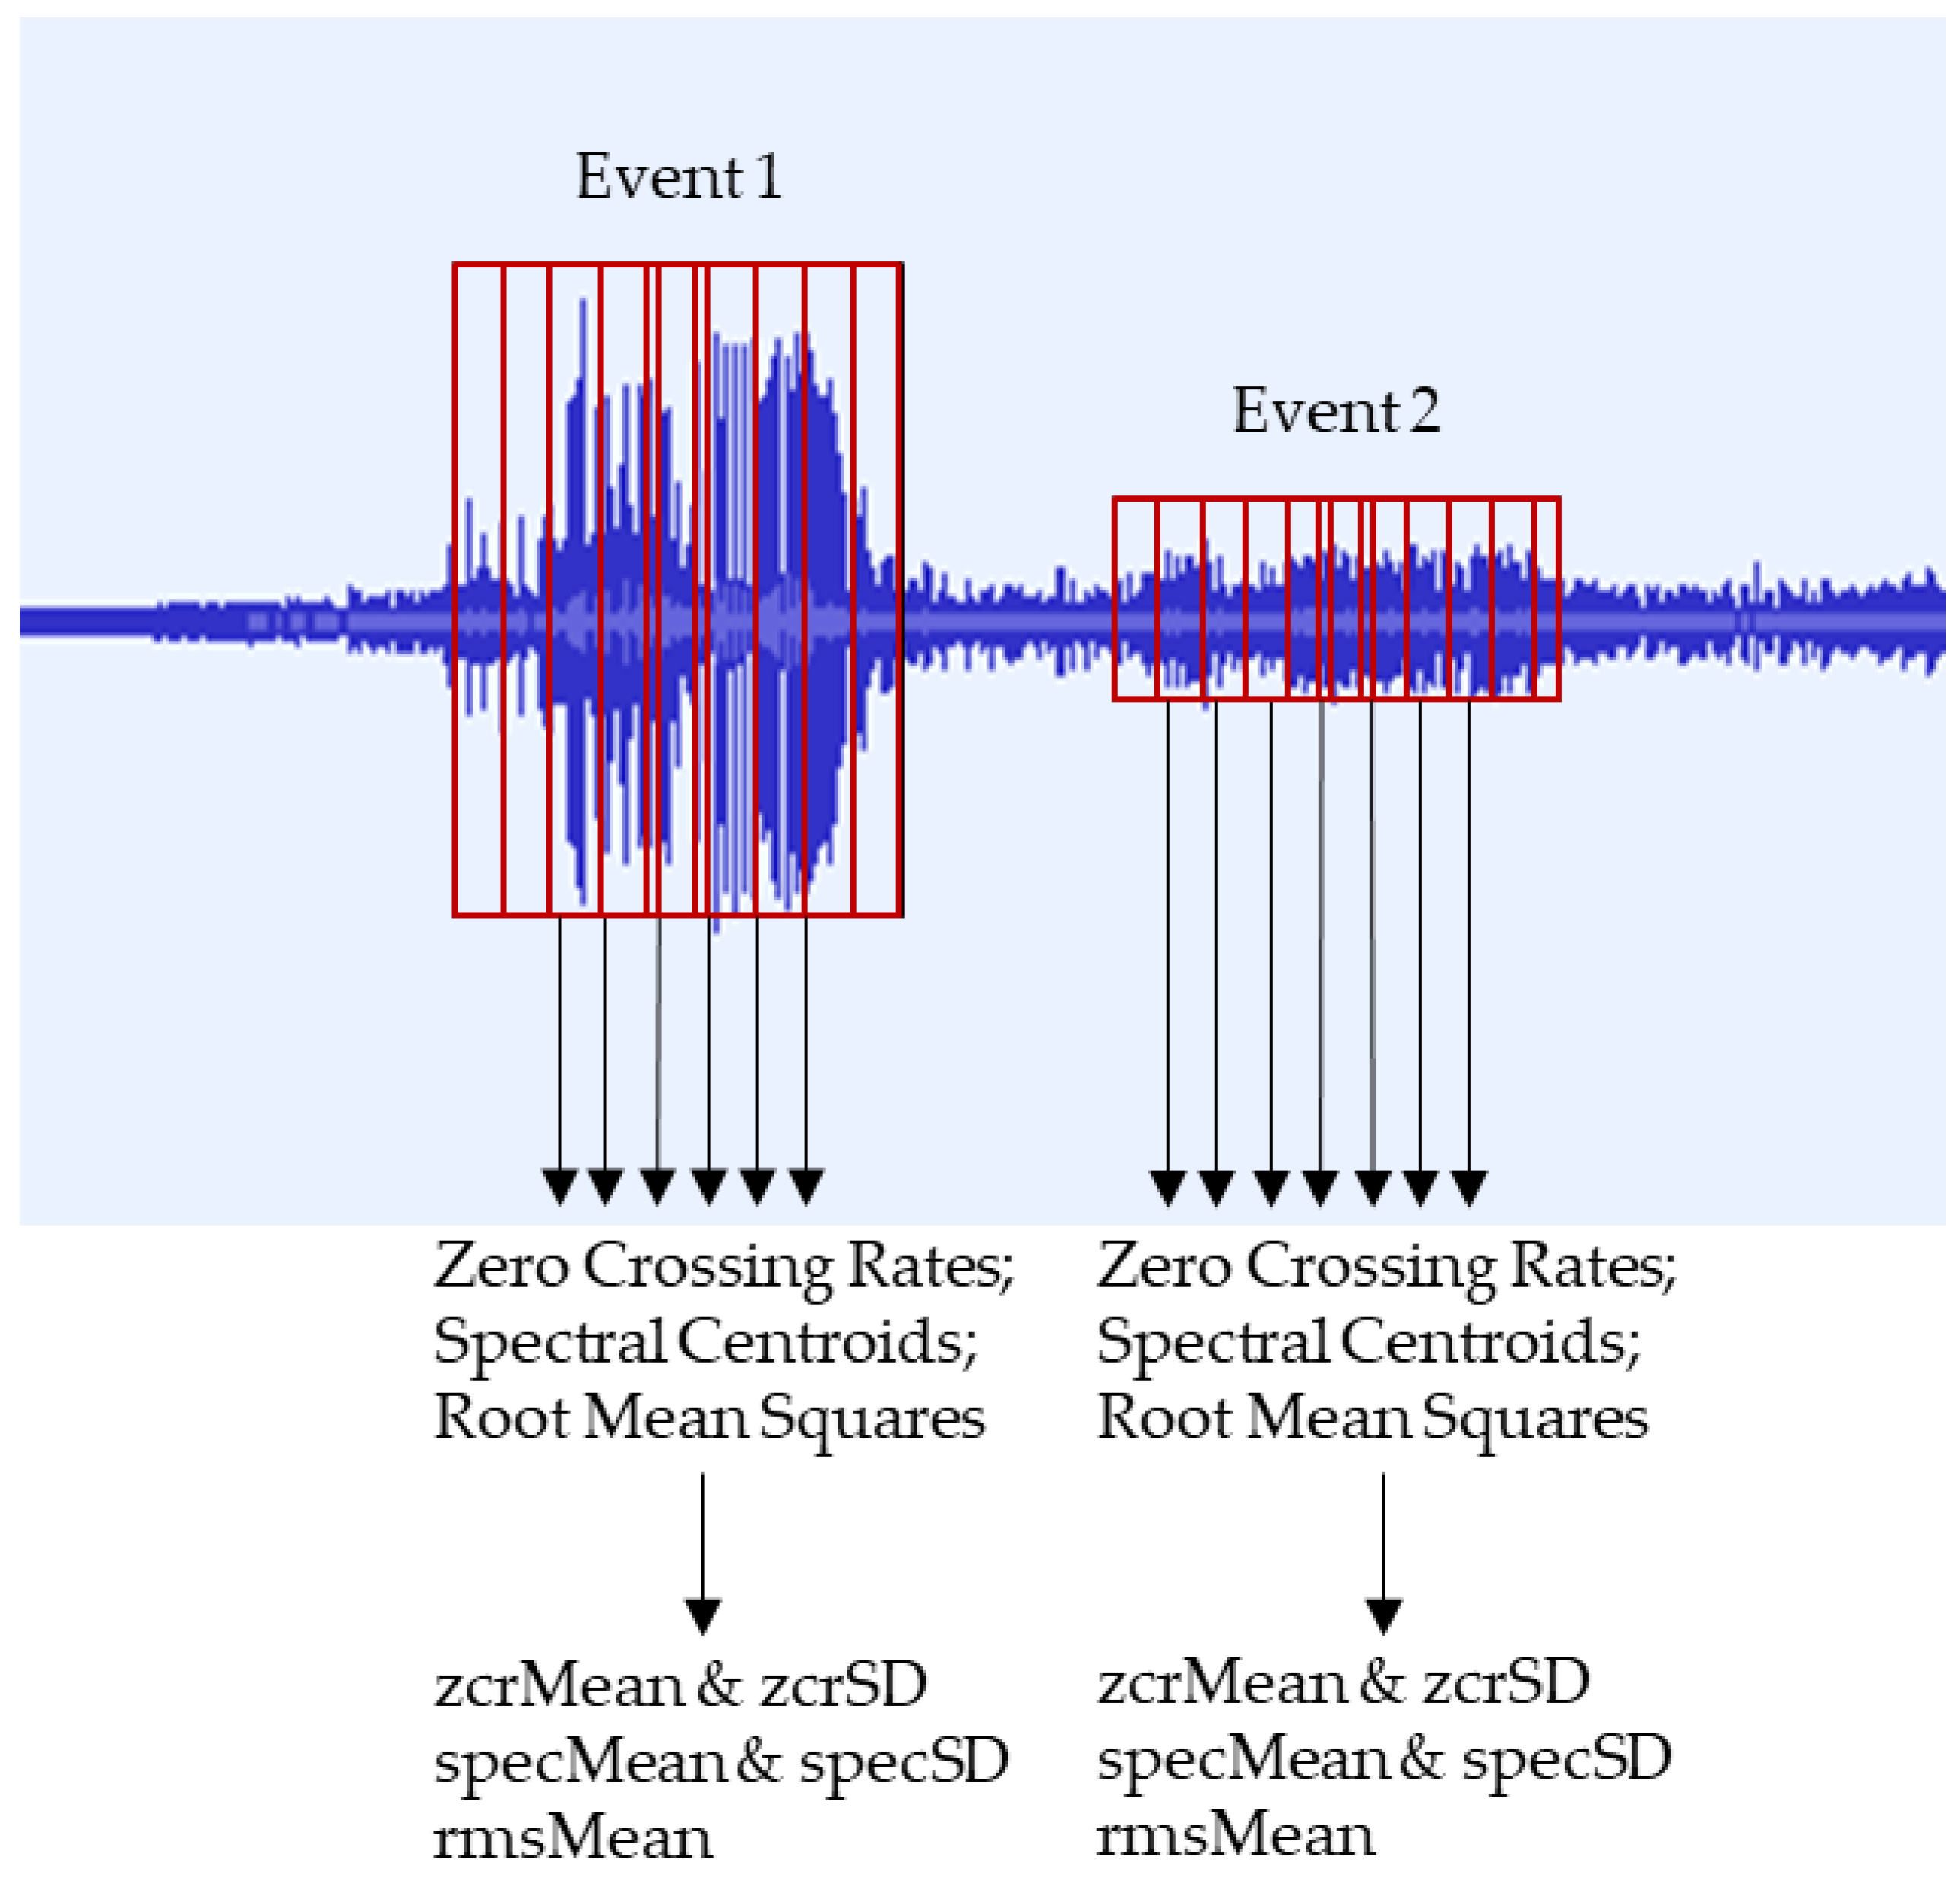
23]. For each event signal period, the zero-crossing rate, spectral centroid, and root mean square features were extracted and calculated using a short-time Fourier transform (STFT) with a Hann window, using 2048 samples with a 75% overlap. After extracting a series of these features for each event signal period, the zcrMean, specMean, and rmsMean were calculated based on the mean value of the zero-crossing rates, the mean value of the spectral centroids, and the mean value of the root mean squares, respectively, while the zcrSD and specSD were calculated based on the sample deviation values of the zero-crossing rates and spectral centroids, respectively.
Figure 2 summarizes the process used to extract such features, showing how each signal was segmented into frames and multiple samples.
2.1.2. Mel-Frequency Cepstral Coefficients (MFCCs)
Mel-frequency cepstral coefficients (MFCCs) are features in the bioacoustics domain [
10,
24,
25]. First, the STFT is calculated based on the raw signal. The Mel-frequency cepstrum (MFC), which represents the short-term energy, is then calculated by passing the STFT to the filter bank and calculating the real logarithm of the short-term energy spectrum at each of the mel-frequencies. Next, discrete cosine transform (DCT) is applied to each mel-frequency. The MFCC is thus obtained. The first 13 cepstral coefficients are used to describe the signal information.
2.1.3. Spectral Entropy (SpectralEntropy)
The feature of spectralEntropy is used to measure the spectral entropy of a signal’s period. Spectral entropy is derived from information entropy [
26], which measures the complexity of a signal. Based on the concept of information entropy, spectral entropy measures the complexity of spectral power distribution [
27]. It has been used in some acoustic classification problems [
28,
29]. Specifically, spectral entropy is calculated as follows:
Calculate the power spectral density (PSD) of the signal by squaring the amplitude normalized by the number of bins (1):
where
is the spectrum of the signal.
Normalize the
(2):
Calculate the spectral entropy (3):
2.2. Recognize Events
There were two groups of target events we wanted to recognize: bird chirping and human/machine events. The 19 features extracted based on different periods of events were used as input to the classifiers to recognize these two events. The classifiers evaluated for this project were support vector machine (SVM) and multi-layer perceptron (MLP). Both of these classifiers have already been used in the bioacoustics domain [
6,
13,
30,
31] to perform species classification tasks.
2.2.1. Support Vector Machine
A support vector machine (SVM) is a commonly used classifier. The rationale of SVM is to map the data points to a higher dimension, and its classification is defined by finding the optimal hyperplane to separate the data points [
32].
2.2.2. Multi-Layer Perceptron
Multi-layer perceptron (MLP) is a type of feedforward artificial neural network (ANN) that consists of an input layer, some hidden layers, and an output layer. In each layer, there are some neurons that can be activated by non-linear activation functions. This model is trained by following the backpropagation method using the gradient descent algorithm derived by Seiffert [
33].
2.3. Proposed Framework for Pattern Summarization
We proposed a novel FDG (frequency–duration graph) framework to summarize the patterns of different events in a forest environment based on bioacoustic data over time. Given a bioacoustic signal as an input to the system, the output will show how frequently different events happen (F), the durations of different events (D), and a graphical analysis showing how different events are distributed over a given time period (G).
Frequency (F) calculates how many times a particular event happens in a given time period. Many events (such as bird chirping events, human activities, wind, and rain) may happen during a given time period. The frequencies of different events are important to researchers devoted to working on the interrelationships between different events. Monitoring the frequencies over different time periods may help in the study of how the patterns of events evolve over time.
Duration (D) calculates how long each event lasts in seconds. Combining duration with the frequency of each event, more features such as D/F can then be obtained for different events. D analysis provides information for studying the patterns related to how long events last over time.
Graphic (G) analysis provides a visualization tool to show how different events are distributed over the given time period. The x-axis represents the time and the y-axis represents different events. It is obvious how different events might evolve in a time-based graph. An important point is that G analysis shows the time-series features. Different events may happen sparsely during some time periods but densely in others. Based on the graphic analysis, more features can be derived to describe the patterns of events, which is meaningful for further study.
3. Case-Study-Based Evaluation
This section first introduces the dataset we used to evaluate the system. The SVM and MLP models were then applied to classify bird chirping and human events. Next, the patterns were summarized using the proposed FDG framework, and this summarization was analyzed to determine the FDG’s usefulness.
3.1. Data Source
Bioacoustic data were collected from the Samford Ecologic Research Facility (SERF), which recorded bioacoustics information in Queensland, Australia over 4 days from October 13th, 2010 to October 16th, 2010. The dataset was 44.1 kHz, 128 kbps, and in MP3 format. The dataset utilized was also 4 days in length and was broken up into day-long recordings, each of which was around 1.28 GB in size. For convenience, the data were transformed to a 22.05 kHz WAV format for analysis. Some previous works have already done research based on this dataset [
34,
35,
36,
37].
The recordings are diverse, including the chirping of different birds and human-made sounds. Accordingly, this dataset was suitable for testing the proposed pattern recognition system. As there have been several works [
18,
25] already done on event detection itself, for the evaluation of the proposed recognition system, we assumed that the identified events were available to be input into the system. For the experiments, bird experts listened to the audio files and recorded the different events’ start times and end times. We compared the expert´s annotations with the output of the FDG framework to assess its effectiveness.
Table 1 shows a summary of the different activities present in the dataset.
For this project, we aimed to classify bird chirping activity and human activity in the first stage, and summarize the event patterns in the second stage.
3.2. Event Classification Evaluation
A total of 19 features (zcrMean, zcrSD, specMean, specSD, spectralEntropy, rmsMean, and 13 MFCCs), explained in the previous section, were fed into the SVM and MLP models. Ten-fold cross-validation tests were conducted to evaluate the FDG framework.
Features were normalized using the min–max feature scaling approach before they were fed to the classification models. The SVM and MLP models were then used to classify different events. For the SVM model, the linear kernel was used and the penalty parameter C was set to 1. For the MLP model, the input layer had 19 neurons because of its 19 features, the hidden layer 1 had 12 neurons with the activation function set to “relu”, the dropout layer rate was set to 0.2, hidden layer 2 had 8 neurons with the activation function set to “relu”, and the output layer had one neuron with the activation function set to “sigmoid”. The loss function used binary cross-entropy and its optimizer used “adam”.
Ten-fold cross-validation tests were conducted on the NE20101013 data. The NE20101014 data were used for evaluation. The accuracy rate, precision rate, recall rate, and F
1-score [
38,
39] were used to evaluate the system (4), (5), (6), (7):
where
stands for true positive,
stands for true negative,
stands for false positive, and
stands for false negative. In this work, these variables referred to how closely the classification output compared to expert annotations. For example, for bird chirping,
referred to the number of instances labeled as bird chirps by both the classifier and the expert annotator.
3.3. Pattern Summarization Evaluation
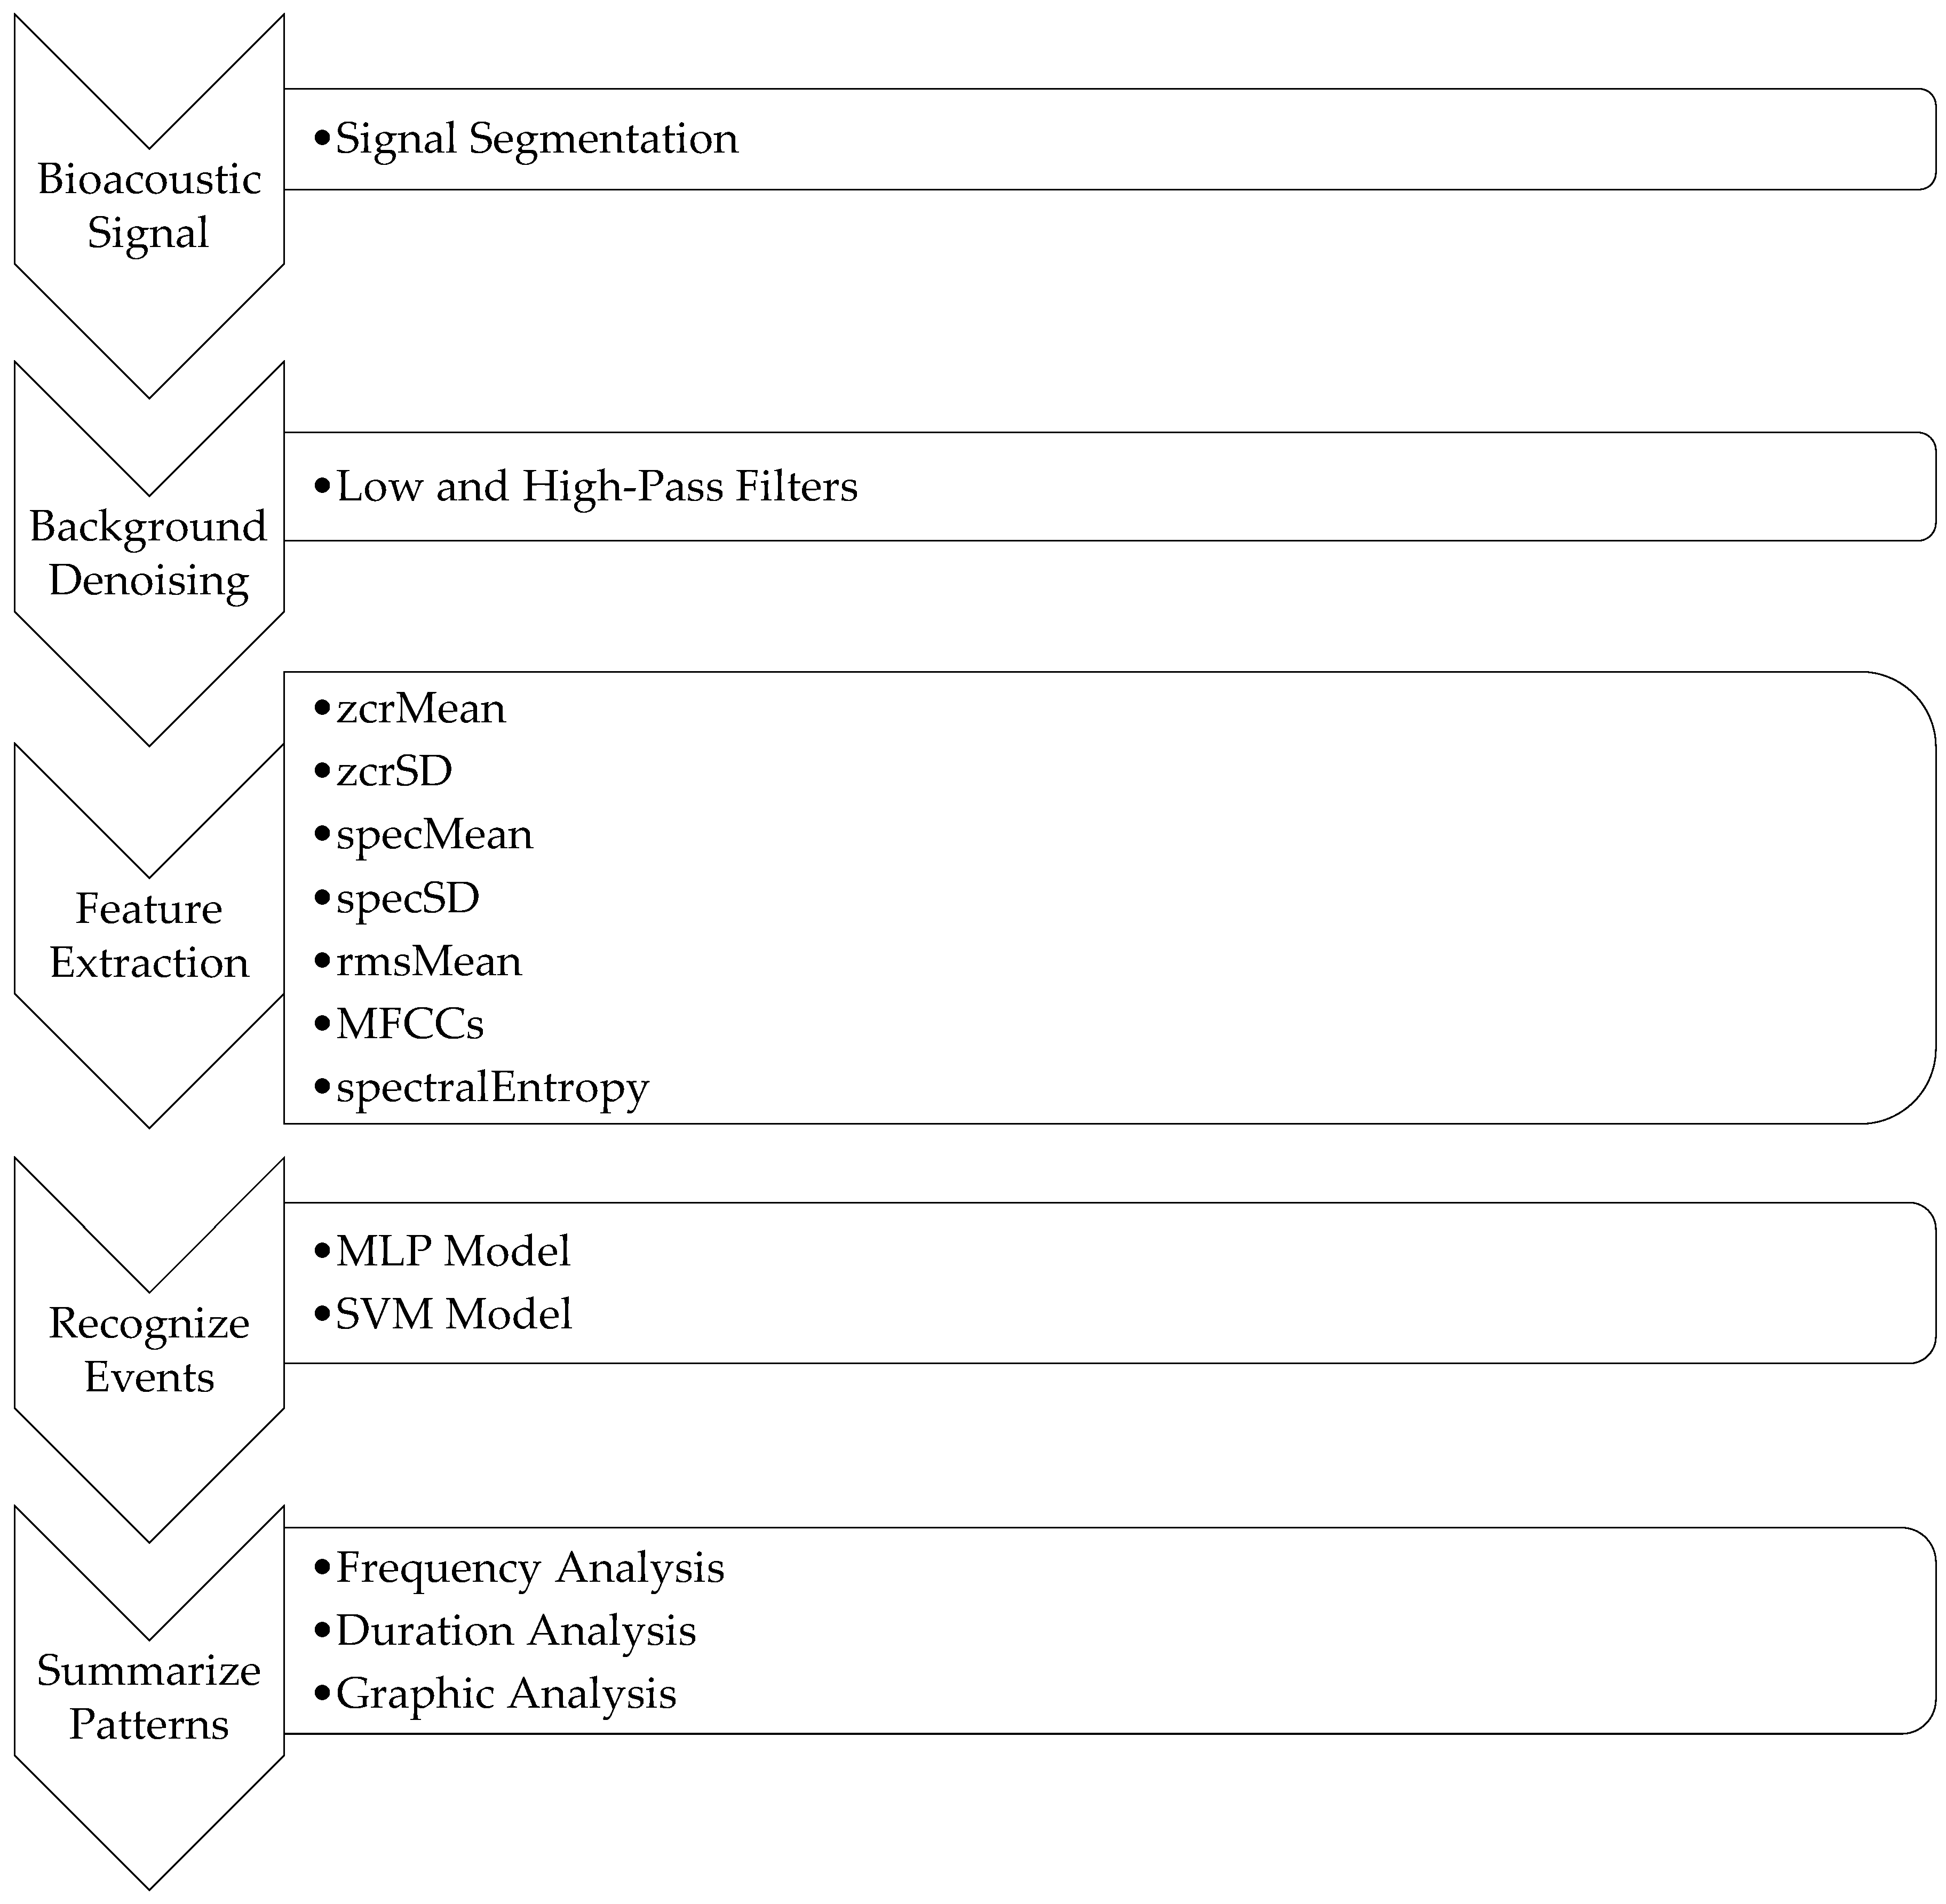
Figure 3 summarizes the whole system, including the FDG framework. In this framework, different classifiers were applied to perform event classification. Next, patterns were summarized by F (frequency), D (duration), and G (graph) over time. In this work, MLP and SVM models were applied to perform event classification in order to compare the two classifiers’ qualities. To make the whole system more flexible, more classifiers could be added to the system for comparison, some of which might be better suited to different scenarios.
4. Results and Discussion
4.1. Event Classification
A 10-fold cross-validation test was used for both the SVM and MLP models.
Table 2 and
Table 3 show the classification results of the two models in scenarios with and without denoising.
According to
Table 2 and
Table 3, the overall accuracies for the two models with denoising and without denoising were very similar. However, in terms of precision, recall, and F
1-Score, the MLP model performed better than the SVM model when denoising was not used. When using denoising, the SVM model showed higher precision but a lower recall and F
1-score than the MLP model. Brown et al. [
20] tried to use a high-pass filter to denoise the data to detect rain sounds and cicada sounds based on the same dataset. The results showed that denoising worked well for detecting rain sounds, but, in contrast, classification models were not sensitive to noise when it came to cicada chorus sound detection. Moreover, removing background noise did not improve the classification results.
4.2. Case Studies for Pattern Summarization Using FDG Framework
The FDG framework’s summarization of patterns over 2 days (13 Oct 2011 and 14 Oct 2011) is shown in
Table 4 and
Figure 4.
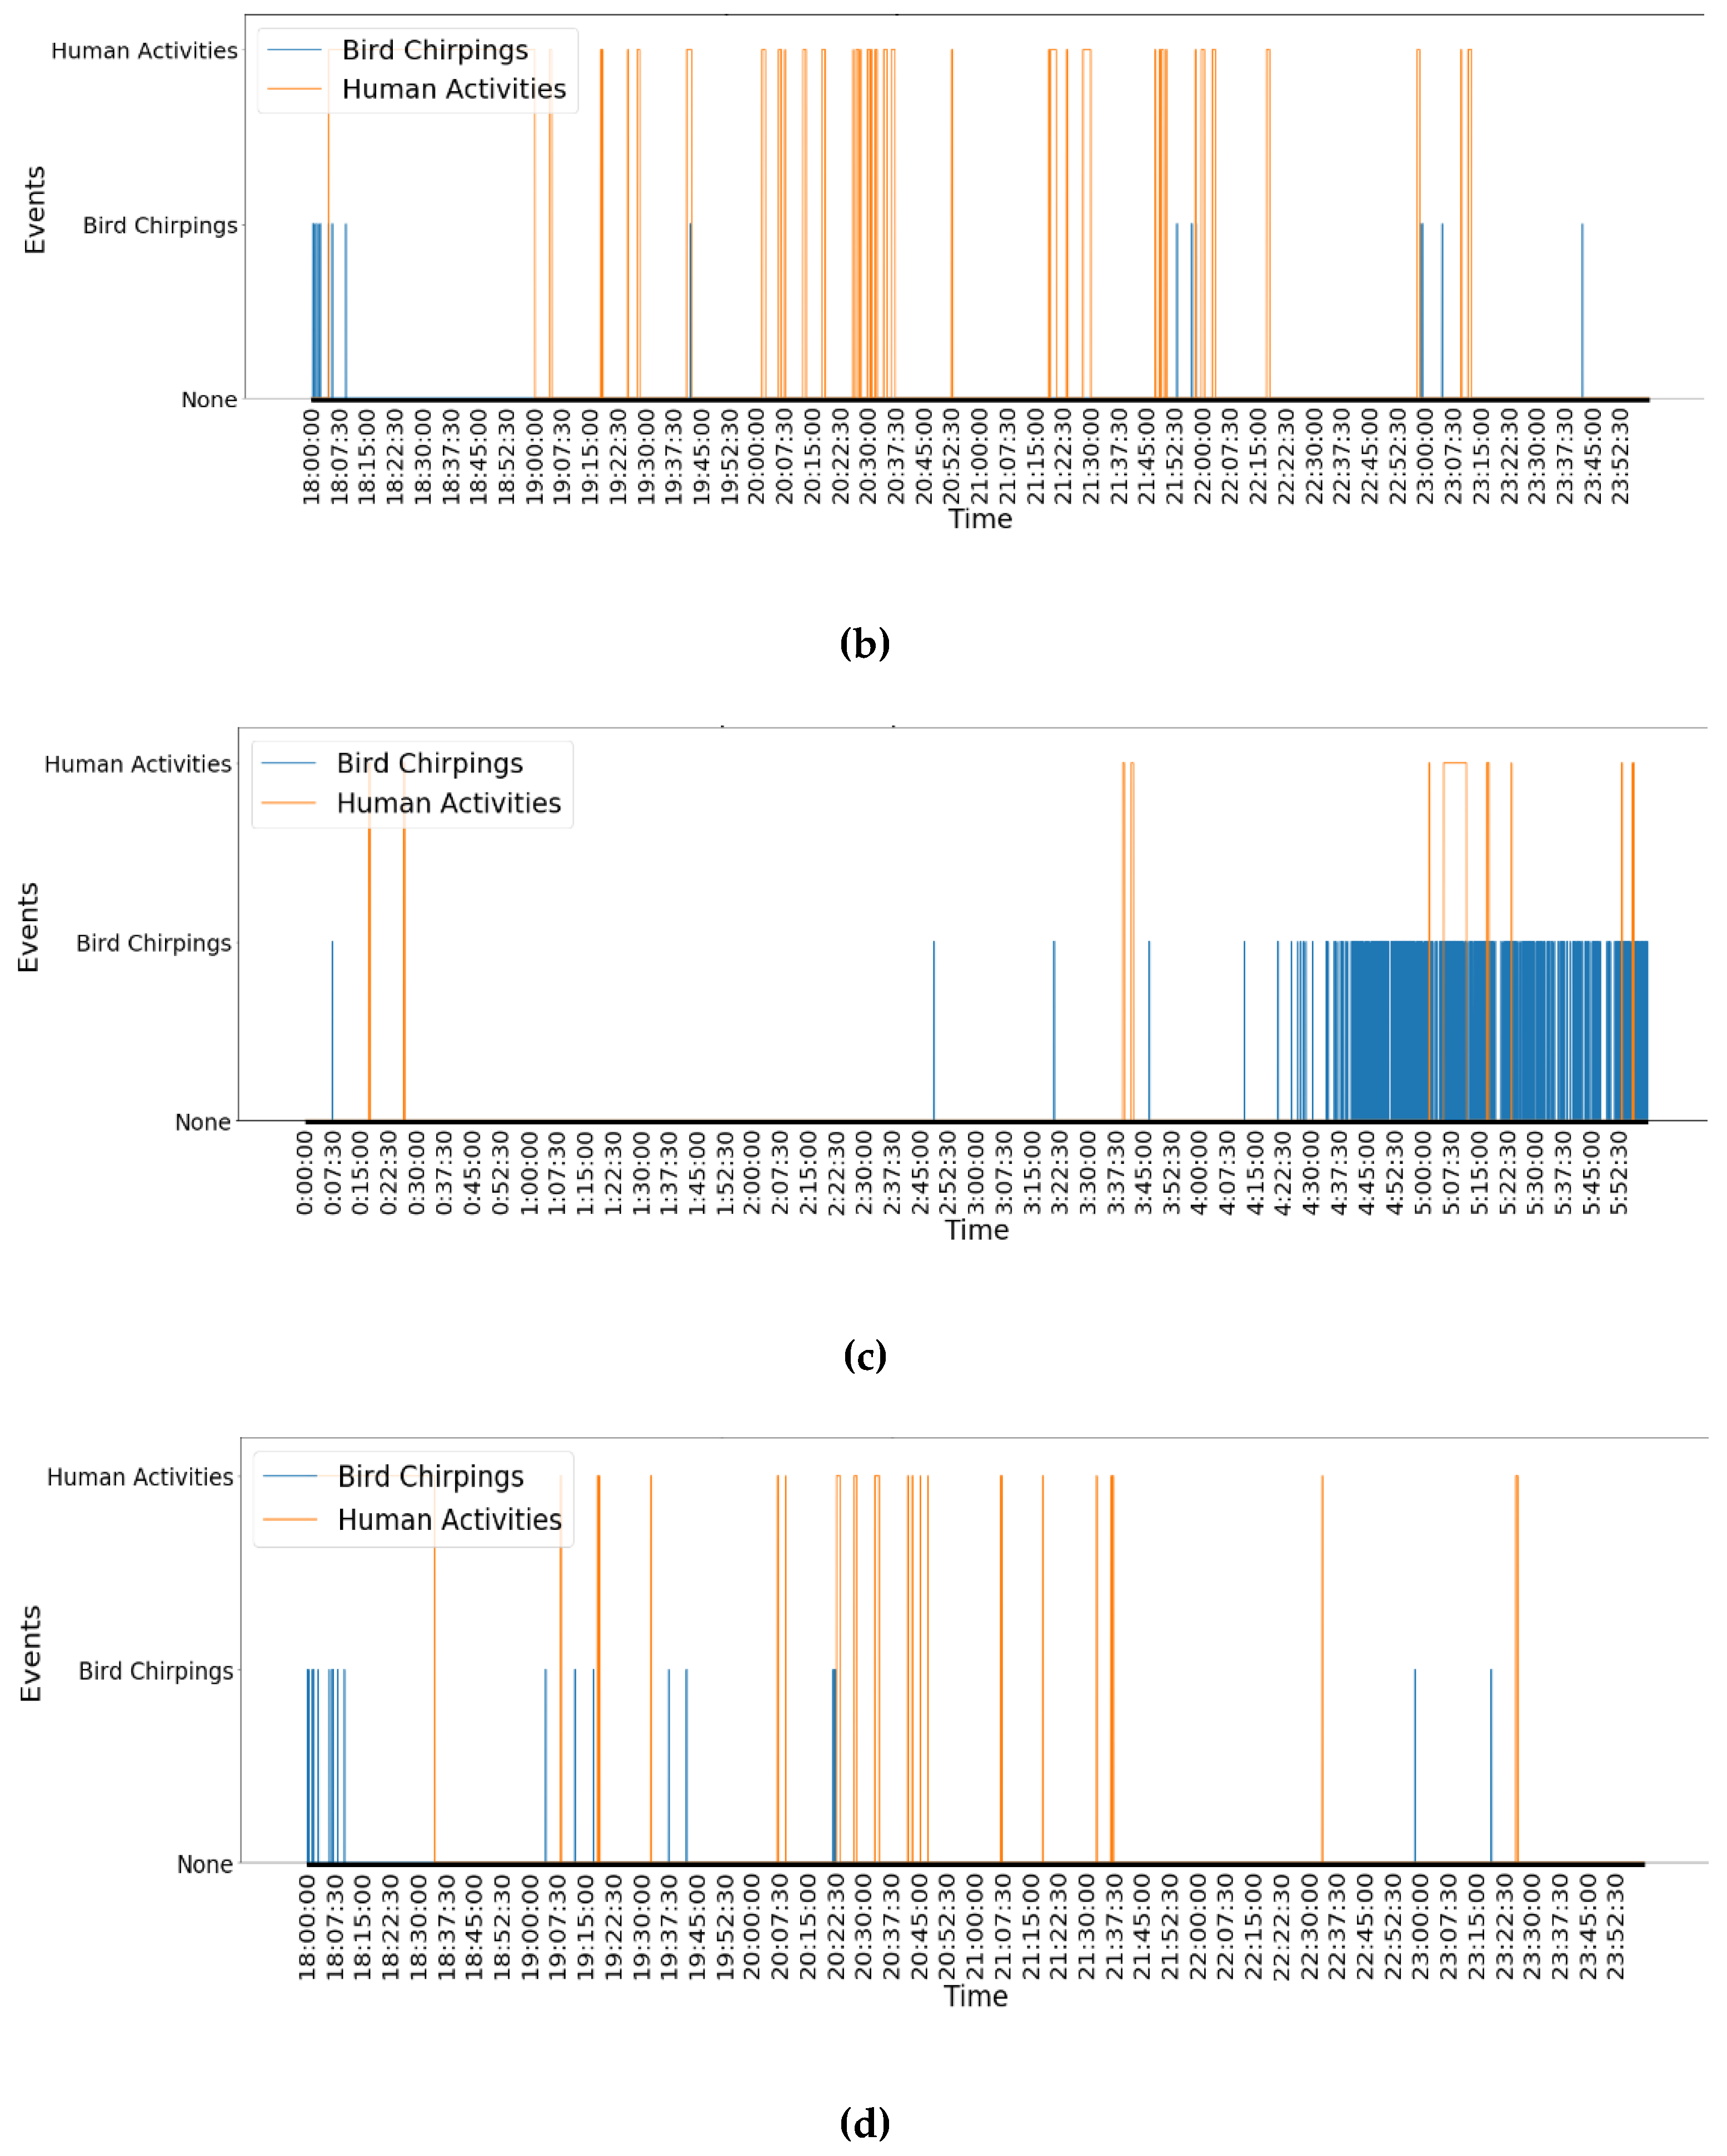
4.2.1. Case 1: Comparing Different Time Periods in One Day
Comparing the time period from 0 to 6:00:00 (
Table 3 and
Figure 4a) with the time period from 18:00:00 to 23:59:59 pm (
Table 3 and
Figure 4b) on 13 Oct 2010, it was concluded that the patterns were significantly different between the two periods. According to
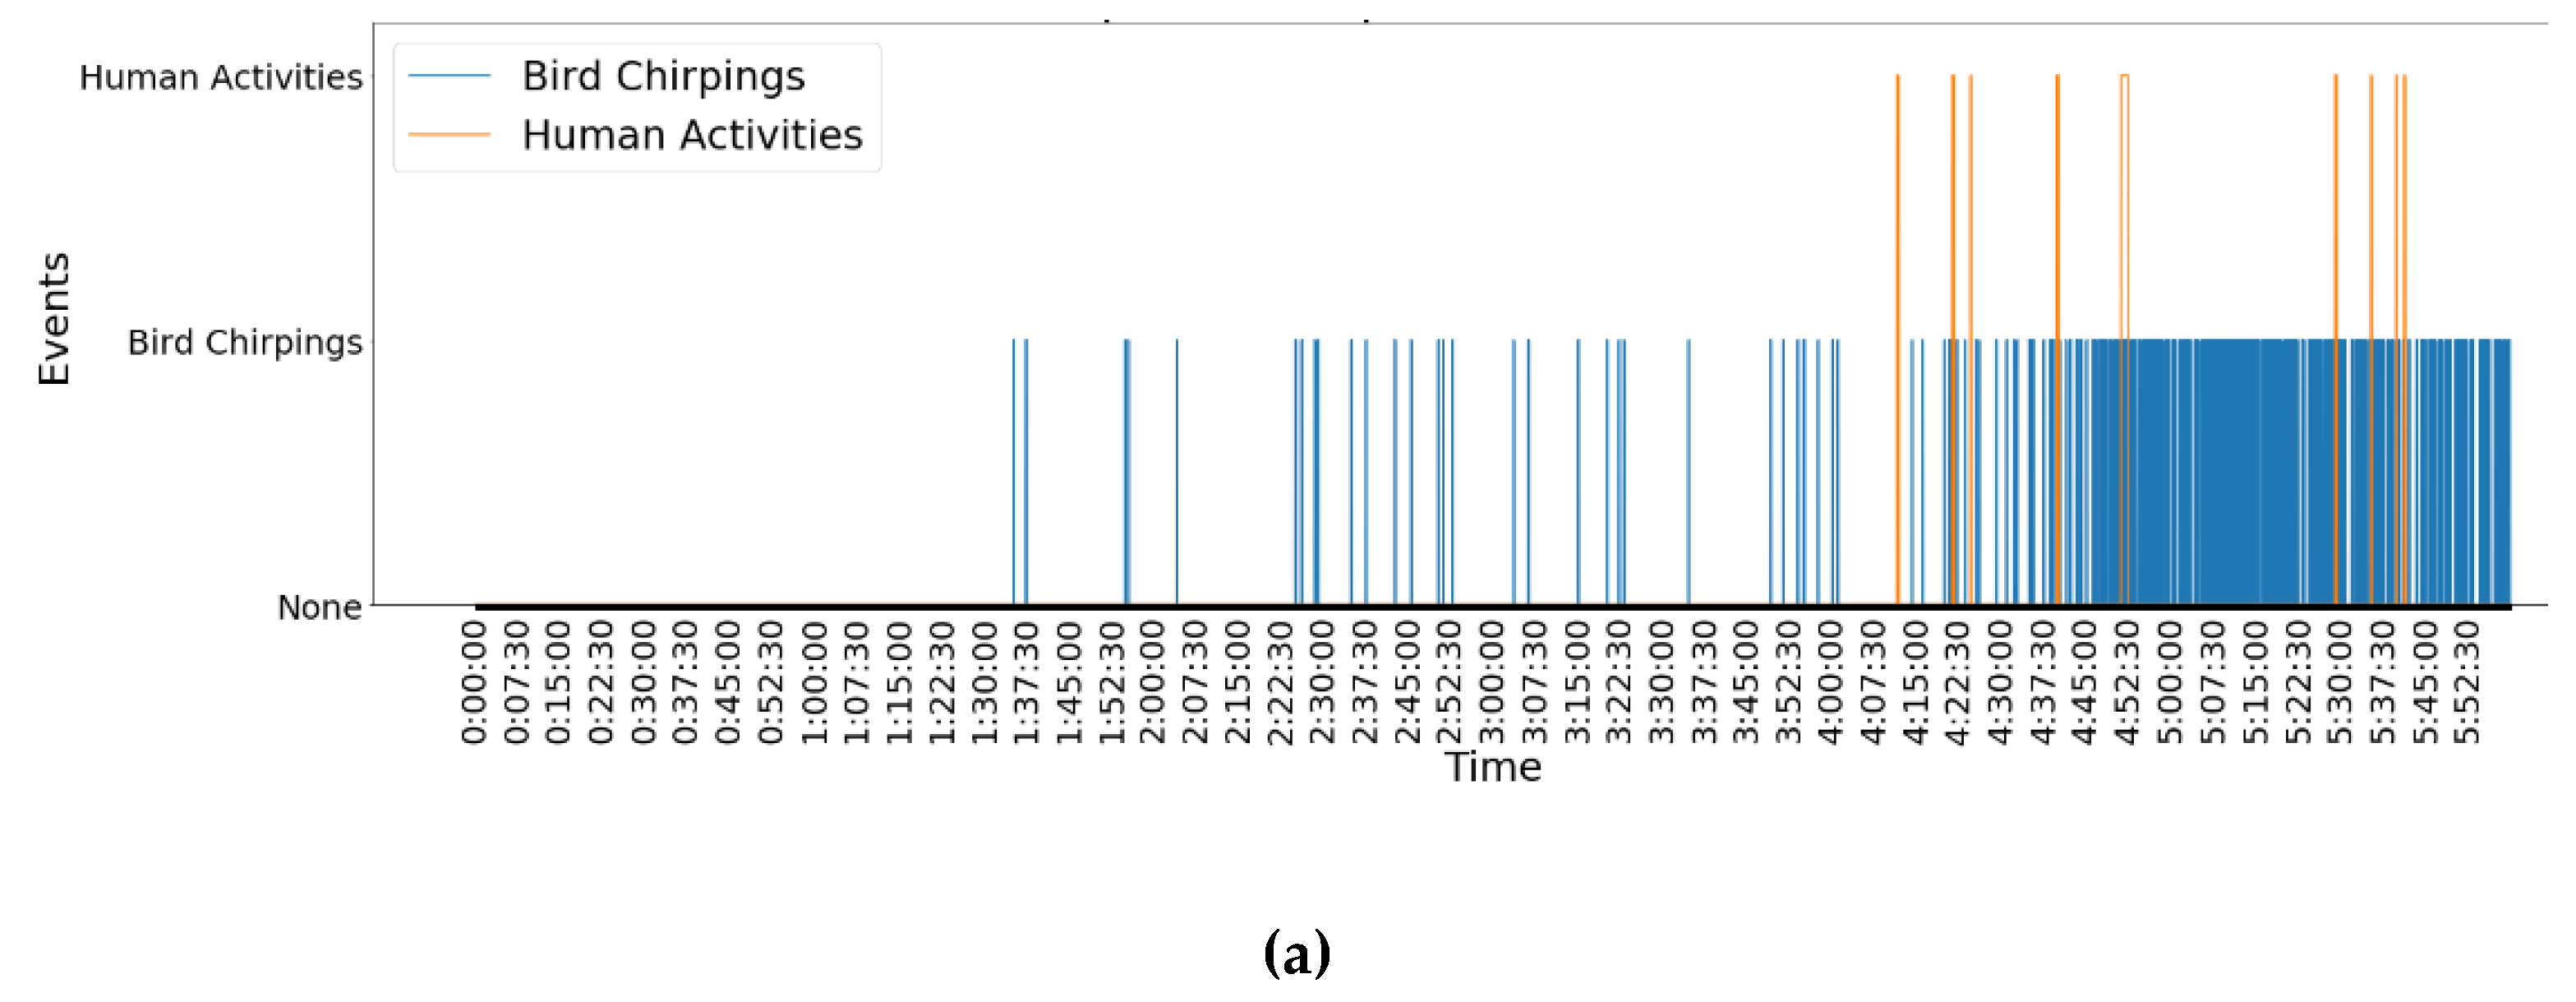
Table 3, the frequency of bird chirping in the morning (0 to 6:00:00) was around 11 times the frequency in the evening (18:00:00 to 23:59:59). The duration of bird chirping in the morning (1047 s) also lasted much longer than that in the evening (60 s). By contrast, human activities are not frequent in the morning (9 times) but are frequent in the evening (38 times). Moreover, the duration of human activities in the evening was 4605 s, which was significantly higher than the duration in the morning (187 s). It can be concluded that bird chirping and human activities have different patterns between morning and evening. The graphic analyses shown in
Figure 4a,b give clearer insight into different events’ patterns over different time periods throughout a day. According to
Figure 4a, in the morning, starting around 1:30:00, birds began to chirp, but these events appeared sparsely over time. From around 4:30:00, bird chirping became very dense over time. Human activities seldomly appeared after around 4:00:00. According to
Figure 4b, fewer birds chirped but more human activities appeared in the evening. Human activities happened densely around 20:30:00 and 21:50:00. Thanks to the FDG framework, at least some of the following information could be concluded. During a day (i.e., 13 Oct 2010), bird chirping and human activities have significantly different patterns between morning and evening times. Bird chirping happens more frequently and densely in the morning than in the evening. However, human activities show a contrasting pattern, as they happen more frequently starting at 19:00:00 in the evening than in the morning.
4.2.2. Case 2: Comparing Same Time Periods in Different Days
Comparing how different events evolve during the same time period for different days could provide valuable insights into how soundscapes change over long durations. Comparing
Table 3 and
Figure 4b with
Table 3 and
Figure 4d, it can be concluded that in the evening (18:00:00 to 23:59:59), two events showed very similar patterns on two different days. There was much less bird chirping activity during the evening on both days (56 times on 13 Oct 2011 and 49 times on 14 Oct 2010). The total time durations of the bird chirping were also similar between the two days, with 60 s on 13 Oct 2010 and 54 s on 14 Oct 2010. In addition, the graphic analysis shows that bird chirping activities were densely distributed around 18:00:00 on both days. In contrast, human activities lasted longer than bird chirping in the evenings on both days (4605 s on 13 Oct 2010 and 2403 s on 14 Oct 2010). In this case, it can be concluded that during the evening time, bird chirping and human activities had similar patterns over the two different days analysed. Bird chirping activities happened less in the evening, with some activity at around 18:00:00, while more human activities occurred in the evening.
4.2.3. Case 3: Temporal Correlation Analysis of Patterns over 4 Days
With the help of the FDG framework, some basic temporal analysis of the patterns as conducted. According to the duration and Ggraphic analysis, we assigned value 1 to the timepoints when the activities were happening, and value 0 to the timepoints when the activities were not happening. For example, for the period from 4:30:25 to 4:30:30, if the birds chirped from 4:30:26 to 4:30:28, but a human activity lasted from 4:30:25 to 4:30:27, then we can assign different values, as shown in
Table 5.
The Pearson correlation coefficient and its p-value were calculated based on 4 days’ (from 13 Oct 2010 to 16 Oct 2010) data to analyze the temporal correlations between the two activities.
Table 6 shows the results.
Table 6 shows that there was a very low temporal correlation between birds chirping and human activities.
5. Conclusions and Future Directions
To conclude, this study addressed the problem of comparing and summarizing different event patterns (bird chirping and human activities) over time by proposing a new system utilizing a novel frequency–duration graph (FDG) framework to automatically summarize how frequencies of different activities change over time. The proposed framework is flexible and allows users to add different events. For example, users might be interested in how weather changes over time, so that specific weather events, such as rain and wind, can be added to the system in the event classification stage. The FDG framework will generate detailed pattern summaries for these weather events over time to give researchers more insight into the environment. Finally, classification approaches are developing rapidly, but these new approaches can be easily incorporated into the classification process described here.
One future research direction could be to add more events of interests and evaluate the system further. In this work, we focused on analyzing the patterns of bird chirping activities and human activities over time. In recent years, climate change has also attracted much attention. Different climates might have different impacts on forest health and evolution. This work could be extended by including more climate phenomena able to be captured by bioacoustic data, from sources such as wind, thunder, and rain, to show how the patterns of these phenomena evolve over time.
The FDG framework could also be extended to different locations. Bioacoustic data collected from different locations could be processed by the proposed system and FDG framework to automatically compare patterns over time for different locations. For those who are experts in comparing different eco-environments, this extension work could be meaningful and helpful. Additionally, more temporal analyses, such as a concept drift analysis for different activity patterns, could be conducted in different eco-environments based on the FDG framework in future works.
One of the assumptions made in this paper was that some denoising has already been done and events have already been detected before using the proposed system. Even though there have been several works on event detection, new methods for when the environment is too noisy for current event detection methods must still be researched.
Author Contributions
Conceptualization, S.G.; formal analysis, R.L.; investigation, R.L. and S.G.; methodology, R.L. and S.G.; project administration, S.G.; supervision, S.G.; validation, R.L.; visualization, R.L.; writing—original draft, R.L.; writing—review and editing, S.G. and A.B.
Acknowledgments
We sincerely thanks the peer reviewers’ detailed feedback and comments, which helped us improve the quality of this work.
Conflicts of Interest
The authors declare no conflict of interest.
References
- Cornelius, C.; Navarrete, S.A.; Marquet, P.A. Effects of human activity on the structure of coastal marine bird assemblages in central Chile. Conserv. Biol. 2001, 15, 1396–1404. [Google Scholar] [CrossRef]
- Putri, I.A.; Ansari, F.; Susilo, A. Response of Bird Community Toward Tourism Activities in the Karst Area of Bantimurung Bulusaraung National Park. J. Qual. Assur. Hosp. Tour. 2019, 1–22. [Google Scholar] [CrossRef]
- Sauvajot, R.M.; Buechner, M.; Kamradt, D.A.; Schonewald, C.M. Patterns of human disturbance and response by small mammals and birds in chaparral near urban development. Urban Ecosyst. 1998, 2, 279–297. [Google Scholar] [CrossRef]
- Gill, J.A. Approaches to measuring the effects of human disturbance on birds. Ibis 2007, 149, 9–14. [Google Scholar] [CrossRef]
- Dong, X.; Towsey, M.; Zhang, J.; Banks, J.; Roe, P. A novel representation of bioacoustic events for content-based search in field audio data. In Proceedings of the 2013 International Conference on Digital Image Computing: Techniques and Applications (DICTA), Hobart, Australia, 26–28 November 2013. [Google Scholar]
- Chesmore, D. Automated bioacoustic identification of species. An. Acad. Bras. Ciências 2004, 76, 436–440. [Google Scholar] [CrossRef]
- Bardeli, R.; Wolff, D.; Kurth, F.; Koch, M.; Tauchert, K.-H.; Frommolt, K.-H. Detecting bird sounds in a complex acoustic environment and application to bioacoustic monitoring. Pattern Recognit. Lett. 2010, 31, 1524–1534. [Google Scholar] [CrossRef]
- Fristrup, K.M.; Mennitt, D. Bioacoustical monitoring in terrestrial environments. Acoust. Today 2012, 8, 16–24. [Google Scholar] [CrossRef]
- Obrist, M.K.; Pavan, G.; Sueur, J.; Riede, K.; Llusia, D.; Márquez, R. Bioacoustics approaches in biodiversity inventories. Abc Taxa 2010, 8, 68–99. [Google Scholar]
- Salamon, J.; Bello, J.P.; Farnsworth, A.; Kelling, S. Fusing shallow and deep learning for bioacoustic bird species classification. In Proceedings of the 2017 IEEE International Conference on Acoustics, Speech and Signal Processing (ICASSP), New Orleans, LA, USA, 5–9 March 2017; IEEE: Piscataway, NJ, USA, 2017. [Google Scholar]
- Zhao, Z.; Zhang, S.-H.; Xu, Z.-Y.; Bellisario, K.; Dai, N.-H.; Omrani, H.; Pijanowski, B.C. Automated bird acoustic event detection and robust species classification. Ecol. Inform. 2017, 39, 99–108. [Google Scholar] [CrossRef]
- Zamanian, H.; Pourghassem, H. Insect identification based on bioacoustic signal using spectral and temporal features. In Proceedings of the 2017 Iranian Conference on Electrical Engineering (ICEE), Tehran, Iran, 2–4 May 2017; IEEE: Piscataway, NJ, USA, 2017. [Google Scholar]
- Noda, J.J.; Travieso, C.M.; Sánchez-Rodríguez, D.; Dutta, M.K.; Singh, A. Using bioacoustic signals and support vector machine for automatic classification of insects. In Proceedings of the 2016 3rd International Conference on Signal Processing and Integrated Networks (SPIN), India, Noida, 11–12 February 2016; IEEE: Piscataway, NJ, USA, 2016. [Google Scholar]
- Chesmore, D. Automated bioacoustic identification of insects for phytosanitary and ecological applications. In Computational Bioacoustics for Assessing Biodiversity; Federal Agency for Nature Conservation: Bonn, Germany, 2008; pp. 59–72. [Google Scholar]
- Coetzee, B.W.; Chown, S.L. A meta-analysis of human disturbance impacts on Antarctic wildlife. Biol. Rev. 2016, 91, 578–596. [Google Scholar] [CrossRef]
- Pan, X.; Liang, D.; Zeng, W.; Hu, Y.; Liang, J.; Wang, X.; Robinson, S.K.; Luo, X.; Liu, Y. Climate, human disturbance and geometric constraints drive the elevational richness pattern of birds in a biodiversity hotspot in southwest China. Glob. Ecol. Conserv. 2019, 18, e00630. [Google Scholar] [CrossRef]
- McLoughlin, I.V.; Zhang, H.; Xie, Z.; Song, Y.; Xiao, W. Robust sound event classification using deep neural networks. IEEE/ACM Trans. Audio Speech Lang. Process. 2015, 23, 540–552. [Google Scholar] [CrossRef]
- Thakur, A.; Thapar, D.; Rajan, P.; Nigam, A. Multiscale CNN based Deep Metric Learning for Bioacoustic Classification: Overcoming Training Data Scarcity Using Dynamic Triplet Loss. arXiv 2019, arXiv:1903.10713. [Google Scholar]
- Colonna, J.G.; Cristo, M.; Salvatierra, M.; Nakamura, E.F. An incremental technique for real-time bioacoustic signal segmentation. Expert Syst. Appl. 2015, 42, 7367–7374. [Google Scholar] [CrossRef]
- Neal, L.; Briggs, F.; Raich, R.; Fern, X.Z. Time-frequency segmentation of bird song in noisy acoustic environments. In Proceedings of the 2011 IEEE International Conference on Acoustics, Speech and Signal Processing (ICASSP), Prague, Czech Republic, 22–27 May 2011; IEEE: Piscataway, NJ, USA, 2011. [Google Scholar]
- Dumyahn, S.L.; Farina, A.; Krause, B.L.; Napoletano, B.M.; Gage, S.H.; Pijanowski, B.C.; Villanueva-Rivera, L.J.; Pieretti, N. Soundscape ecology: The science of sound in the landscape. BioScience 2011, 61, 203–216. [Google Scholar]
- Gouyon, F.; Pachet, F.; Delerue, O. On the use of zero-crossing rate for an application of classification of percussive sounds. In Proceedings of the COST G-6 Conference on Digital Audio Effects (DAFX-00), Verona, Italy, 7–9 December 2000. [Google Scholar]
- Exadaktylos, V.; Ferrari, S.; Silva, M.D.; Guarino, M.; Berckmans, D. A tool for labeling individual sounds from continuous recordings: An application to bio-acoustics; American Society of Agricultural and Biological Engineers: St. Joseph, MI, USA, 2009. [Google Scholar]
- Noda, J.J.; Travieso, C.M.; Sánchez-Rodríguez, D. Methodology for automatic bioacoustic classification of anurans based on feature fusion. Expert Syst. Appl. 2016, 50, 100–106. [Google Scholar] [CrossRef]
- Colonna, J.G.; Gama, J.; Nakamura, E.F. How to correctly evaluate an automatic bioacoustics classification method. In Proceedings of the Conference of the Spanish Association for Artificial Intelligence, Salamanca, Spain, 14–16 September 2016; Springer: Berlin/Heidelberg, Germany, 2016. [Google Scholar]
- Shannon, C.E. A mathematical Theory of Communication. Bell Syst. Tech. J. 1948, 27, 379–423. [Google Scholar] [CrossRef]
- Rezek, I.A.; Roberts, S.J. Stochastic complexity measures for physiological signal analysis. IEEE Trans. Biomed. Eng. 1998, 45, 1186–1191. [Google Scholar] [CrossRef]
- Han, N.C.; Muniandy, S.V.; Dayou, J. Acoustic classification of Australian anurans based on hybrid spectral-entropy approach. Appl. Acoust. 2011, 72, 639–645. [Google Scholar] [CrossRef]
- Erbe, C.; King, A.R. Automatic detection of marine mammals using information entropy. J. Acoust. Soc. Am. 2008, 124, 2833–2840. [Google Scholar] [CrossRef]
- Sachs, A.; Thiel, C.; Schwenker, F. One-class support-vector machines for the classification of bioacoustic time series. Int. J. Artif. Intell. Mach. Learn. 2006, 6, 29–34. [Google Scholar]
- Jaafar, H.; Ramli, D.; Rosdi, B. Comparative study on different classifiers for frog identification system based on bioacoustic signal analysis. In Proceedings of the 2014 International Conference on Communications, Signal Processing and Computers, Bangkok, Thailand, 10–12 October 2014. [Google Scholar]
- Scholkopf, B.; Smola, A.J. Learning with Kernels: Support Vector Machines, Regularization, Optimization, and Beyond; MIT Press: Cambridge, MA, USA, 2001. [Google Scholar]
- Seiffert, U. Multiple layer perceptron training using genetic algorithms. In Proceedings of the ESANN, Bruges, Belgium, 25–27 April 2001. [Google Scholar]
- Brown, A.; Grag, S.; Montgomery, J. Scalable Preprocessing of High Volume Bird Acoustic Data. arXiv 2018, arXiv:1802.00535. [Google Scholar]
- Towsey, M.; Wimmer, J.; Williamson, I.; Roe, P. The use of acoustic indices to determine avian species richness in audio-recordings of the environment. Ecol. Inform. 2014, 21, 110–119. [Google Scholar] [CrossRef] [Green Version]
- Truskinger, A.; Cottman-Fields, M.; Eichinski, P.; Towsey, M.; Roe, P. Practical Analysis of Big Acoustic Sensor Data for Environmental Monitoring. In Proceedings of the 2014 IEEE Fourth International Conference on Big Data and Cloud Computing, Sydney, Australia, 3–5 December 2014; IEEE: Sydney, NSW, Australia, 2014; pp. 91–98. [Google Scholar] [Green Version]
- Truskinger, A.; Cottman-Fields, M.; Johnson, D.; Roe, P. Rapid Scanning of Spectrograms for Efficient Identification of Bioacoustic Events in Big Data. In Proceedings of the 2013 IEEE 9th International Conference on E-Science, Beijing, China, 23–25 October 2014; IEEE: Beijing, China; pp. 270–277. [Google Scholar]
- Kiran, B.R.; Thomas, D.M.; Parakkal, R. An Overview of Deep Learning Based Methods for Unsupervised and Semi-Supervised Anomaly Detection in Videos. J. Imaging 2018, 4, 36. [Google Scholar] [CrossRef]
- Shakya, S.; Sigdel, S. An approach to develop a hybrid algorithm based on support vector machine and Naïve Bayes for anomaly detection. In Proceedings of the 2017 International Conference on Computing, Communication and Automation (ICCCA), Greater Noida, India, 5–6 May 2017; IEEE: Greater Noida, India, 2017; pp. 323–327. [Google Scholar]
© 2019 by the authors. Licensee MDPI, Basel, Switzerland. This article is an open access article distributed under the terms and conditions of the Creative Commons Attribution (CC BY) license (http://creativecommons.org/licenses/by/4.0/).


