Article

Effects of Fertilization Ratios and Frequencies on the Growth and Nutrient Uptake of Magnolia wufengensis (Magnoliaceae)

1
Ministry of Education Key Laboratory of Silviculture and Conservation, Forestry College, Beijing Forestry University, Beijing 100083, China
2
National Academy of Forestry and Grassland Administration (NAFGA), Beijing 102600, China
3
School of Landscape Architecture, Beijing Forestry University, Beijing 100083, China, userfoever1994@bjfu.edu.cn
*
Author to whom correspondence should be addressed.
Forests 2019, 10(1), 65; https://doi.org/10.3390/f10010065
Submission received: 13 December 2018 / Revised: 11 January 2019 / Accepted: 11 January 2019 / Published: 15 January 2019
(This article belongs to the Special Issue Forest Stand Management and Biomass Growth)

Abstract

:
Through this study, the most suitable fertilization ratio, amount and frequency were determined, providing a scientific reference for further fertilization management for Magnolia wufengensis (Magnoliaceae) seedlings. Fertilization is an important cultivation and management measure to maintain forest seedling health and rapid growth. However, improper fertilization can also have unexpected effects: inhibiting seedling growth, increasing the cost of production and contaminating the environment. Thus, to explore the most suitable fertilization treatment for Magnolia wufengensis growth, one-year-old Magnolia wufengensis seedlings and the orthogonal design method were used in this study. Three different fertilization frequencies were used combined with 9 NPK ratios. The growth index, chlorophyll content, nutrient content in tissues, nutrient transport efficiency, nutrient uptake, and soil properties were analyzed. Fertilization can increase chlorophyll content, promoting the vegetative growth and biomass accumulation of Magnolia wufengensis. Fertilization reduced the proportion of root biomass to whole plant biomass, resulting in an increase in stem biomass with little effect on leaf biomass. Additionally, fertilization also increased the proportion of N in roots, P in stems and K in leaves. Under fertilization, the K transport efficiency was higher than that of N and P. Furthermore, there was a positive correlation between the nutrient use efficiencies of N and K. Overall, the effects of six fertilizer applications were much better than those of four and eight fertilizer applications on the promotion of vegetative growth, biomass and nutrient accumulation, nutrient uptake and transport efficiency. The results showed that six fertilizer applications with an NPK ratio of 3:2:1 as follows: N application at 480 mg/plant, P application at 320 mg/plant, and K application at 160 mg/plant was the most suitable fertilization method for plant growth.

1. Introduction

Magnolia wufengensis (Magnoliaceae) is a new species of subgenus Magnolia, genus Magnolia with great ornamental value that was discovered by Luyi Ma, Luorong Wang, et al. in 2004 [1]. It is a type of hysteranthous deciduous tree with a completely red perianth (inside and outside) and flap of a single color that can be used in urban landscaping and mountain forestation with broad application and popularization prospects [2]. Additionally, it also has diverse variants because of its different shapes and numbers of petals [3]. Due to the variety and originality of its intrinsic morphology, M. wufengensis has become an indispensable material for the study of the origin, evolution, distribution and phylogeny of Magnolia and even Magnoliaceae. It has a narrow distributing range, with only 2000 strains in the wild community. More seriously, fragmented habitation makes it much more difficult for M. wufengensis to renew under natural conditions, leaving it in a critically endangered state. Thus, it is necessary to plant more seedlings to rescue this precious species.
Seedling growth requires careful management, and fertilization is important for sowing seedlings of forestry crops and ensuring healthy growth. Among the 16 necessary nutrients, nitrogen (N), phosphorus (P), and potassium (K) are heavily needed for plant growth. Because of their limited supply in soil, these nutrients are frequently replenished in production and thus are called the “three essentials of fertilizer” [4,5,6,7]. The contribution of nitrogen to plant growth is 40%–50%, N is an important component of proteins, nucleic acids, chlorophyll and some growth hormones in plants, and has an important effect on photosynthetic rate [8,9,10]. P is an indispensable element in the synthesis of nuclear proteins, lecithin, etc., and can also promote cell division and energy transport and accelerate both aerial and underground growth [11,12,13,14]. K is considered a ‘quality factor’ in plant production because it is closely related to plant development and metabolism. Although K is not a component of organic compounds, it can accelerate photosynthesis, influence production quality and participate in plant resistance mechanisms; the growth and development of plants will be repressed under K deficiency [15,16,17,18]. However, excessive fertilization will not only reduce fertilizer use efficiency, thereby increasing the cost of production, but also lead to soil and water pollution and increased plant pests and diseases [11,19,20,21,22]. The environmental problems caused by excessive fertilization have aroused increasing public attention. Thus a more scientific fertilization pattern that is not only good to plants but also harmless to environment is urgently needed.
According to the need to improve plant quality and environmental pollution, from an ecological point of view, appropriately balanced fertilization can be formulated to significantly promote plant growth without causing environmental pollution. Meanwhile, a reasonable ratio can also relatively reduce the amount of various fertilizers [23,24,25]. In the application of balanced fertilization, each balanced fertilization model has unique characteristics suiting for a specific area (soil environment), plant species, and fertilizer type. Through evaluation of the adaptability of the widely used balanced fertilization model in Europe, no one model has been found to be suitable in all plants, fertilizers and areas [26,27]. Therefore, it is necessary to explore an optimal NPK fertilization ratio for M. wufengensis.
Worldwide, fertilizer application is the main source for plants to absorb N, P, and K, but unfortunately, fertilizer cannot be effectively utilized in a soil-plant system at rates rarely exceeding 50% [28]. Generally, utilization of inorganic fertilizer on grassland is considered to be 80%–100%, however, it is usually as low as 60%–65% in practice [29,30], which means that up to 40% of fertilizer is wasted. Raun and Johnson (1999) [31] calculated that 67% of unutilized N fertilizers have an annual loss of $15.9 billion (assumed fertilizer-soil balance) and that a 1% increase in N fertilizer utilization results in a global savings of $234 million [19]. In the plant growing season, split fertilization is an effective way to reduce the loss of fertilizers and increase utilization [28,32,33]. In maize, compared with applying all N fertilizer at one time, separating fertilizer application into different development stages can promote N absorption (168 vs. 192 kg ha−1), increasing the grain yield (10.5 vs. 11.2 Mg ha−1) [34]. Similar effects have also been found in other experiments, in which split application of N fertilizer could increase N use efficiency (from 58% to 71%) and reduce N loss (2.6%–5.5% vs. 0.4%–1%) [35]. However, there have also been studies showing that split fertilizer application had no effect on plant growth [36,37]. Thus far, the effect of split fertilization on M. wufengensis is unclear.
This study was designed to explore the effects of different fertilization frequencies and ratios on the growth and nutrient uptake of M. wufengensis. One-year-old M. wufengensis seedlings and the orthogonal design method were used. The growth response of M. wufengensis seedlings to different NPK ratios under three fertilization times was analyzed. In addition, N, P, and K status in three different plant organs (leaves, stems, and roots), the nutrient uptake and transport efficiency and soil properties were also analyzed. The most suitable fertilization ratio, amount and frequency for M. wufengensis were determined by principal component analysis, providing theoretical basis for the establishment of NPK fertilizer management system with synchronous nutrient supply in root layer and M. wufengensis seedlings growth demand.

2. Materials and Methods

2.1. Experimental Field

The experiment was conducted in a greenhouse of the silviculture test station of Beijing Forestry University. The geographical coordinates of the station are 40°3′54″ N and 116°05′45″ E; this area has temperate humid monsoon climate zone with hot, variabe rainy summers and dry cold winters. The average annual temperature is 12.5 °C with an accumulating temperature of 4200 °C, and the number of annual sunshine hours is 2662 h. The average annual rainfall is 628.9 mm, and the rainfall from June to August is 465.1 mm, accounting for 70% of the annual rainfall. The rainfall from December to February accounts for only 1% of the annual rainfall. Drip irrigation system for irrigation (irrigation when soil water content is less than 85% of saturated water). The entire experiment was conducted in the greenhouse (day: 16 h of 22 °C; night: 8 h of 18 °C; 80% relative humidity; 90 W m−2 light intensity).

2.2. Materials

One-year-old M. wufengensis seedlings were provided by Wufeng Bo Ling Magnolia wufengensis Technology Development Co., Ltd., were planted in test ground in May 2016. The seedlings were basically the same size with an average height of 7.6 cm and a root collar diameter of 2.64 mm. The substrate was cinnamon soil from the test ground, its physicochemical properties are shown in Table 1. The containers were plastic pots with a central width of 21 cm and a height of 24 cm.

2.3. Experimental Design

2.3.1. Effects of Different NPK Ratios on the Seedling Growth of M. wufengensis

To supply the actual nutrients needed for M. wufengensis seedling growth, the nutrients supplied by the soil were considered, and the effects of fertilizer combinations were studied. The seedling height, root collar diameter, biomass, NPK content, chlorophyll content, and soil physicochemical properties were monitored in the potted experiments. Through physical and chemical analyses, the most suitable fertilizer ratio and amount that can be used as a special fertilizer for M. wufengensis seedlings were determined.
Tests were conducted with a three-factor and three-level (L9 (34)) orthogonal design method. N fertilizers were set at three levels: 160 mg plant−1 (A1), 320 mg plant−1 (A2), and 480 mg plant−1 (A3); P fertilizers were set at three levels: 80 mg plant−1 (B1), 160 mg plant−1 (B2), and 320 mg plant−1 (B3); and K fertilizers were set at three levels: 80 mg plant−1 (C1), 160 mg plant−1 (C2), and 320 mg plant−1 (C3). Taking the treatment without fertilization as a control (CK), there were 10 treatments in total, and each treatment contained 15 seedlings. The chemicals used were CO(NH4)2, NH4H2PO4, KH2PO4, and KCl. Before being injected directly into the pot with a 50-ml syringe, the fertilizers were dissolved in water (concentration: CO(NH4)2—1.2 mg ml−1, NH4H2PO4—0.8 mg ml−1, KCl—0.8 mg ml−1). The final fertilization details of the treatments are shown in Table 2.

2.3.2. Effects of Fertilization Frequencies on M. wufengensis Seedling Growth

Under unchanged total fertilizer application, fertilization frequency may affect the absorption and utilization of fertilizers. In this experiment, based on the experimental design of different NPK ratios, three different fertilizer application frequencies (four applications, six applications, and eight applications) were designed under nine different fertilization treatments (different NPK ratios). Including the CK groups, there were 28 fertilization treatments in total. There were 15 seedlings in every treatment, totaling 420 seedlings overall. The amount of fertilizer applied at each application was the average of the total fertilization according to the design of this study. Fertilization was applied from the beginning of June to the end of September at four applications (every 30 days), six applications (every 20 days), and eight applications (every 15 days). After analysis of growth (height, root collar diameter, biomass, NPK content, chlorophyll content, etc.) and soil properties, the most appropriate fertilizer application frequency was determined.

2.4. Methods to Measure Physiological Parameters

2.4.1. Height and Root Collar Diameter of Seedlings

Because the seedlings were planted in May and considering the growth period and consistency of measurement, measurements of height (H) and root collar diameter (D) were performed on the sixth day of each month in June, July, August, and September. Seedling height was measured with a steel tape with an accuracy of 0.01 cm; the root collar diameter was measured with an electronic digital caliper with an accuracy of 0.01 mm.

2.4.2. Determination of Chlorophyll Ccontent

Seedling leaves from different treatments were collected on the sixth day of each month in June, July, August, and September and then brought to the laboratory in a cold box. Each sample contained 2–3 leaves. Fresh leaves were cut into small pieces of approximately 2 mm and well mixed. A sample of 0.200 g was weighed and transferred to a 25-ml test tube, to which 80% acetone was added to volume. The test tube was inverted several times to ensure that all leaves were washed with the acetone solution. The test tube was covered with foil to block daylight and then was incubated at room temperature until the leaves turned completely white. The extracted liquid was filtered, and absorbance was measured at wavelengths of 663 mm and 645 mm. The amounts of chlorophyll a, chlorophyll b, and total chlorophyll were calculated (Equations (1)–(3)) [38].
Chlorophyll a: Ca = 12.72 × A663 − 2.59 × A645,
Chlorophyll b: Cb = 22.88 × A645 − 4.67 × A663,
Total chlorophyll: CT = Ca + Cb,

2.4.3. Determination of Biomass

In mid-November, M. wufengensis seedlings were harvested to measure biomass (five seedlings per treatment). The seedlings were cleaned with water and divided into three parts: roots, stems, and leaves. Then, they were fixed at 105 °C for 30 minutes and dried at 80 °C until the sample weight did not change anymore. The dry weight of each sample was measured (accurate to 0.001 g).

2.4.4. Determination of N, P, and K

Samples of different tissues were dried and sieved through 60 mesh (<0.25 mm) after being crushed. Samples of 0.200 g were weighed and then digested with sulfuric acid-hydrogen peroxide digestion method. Total N and P were measured using an AA3 continuous flow analyzer (SEAL, Norderstedt, Germany). Total K was measured by a flame photometer (FP6400, Shanghai, China). Each treatment sample was measured three times.

2.5. Data Processing and Analysis

2.5.1. Calculation of Nutrient Parameters

Nutrient transport efficiency = (Ana − ANb)/ANb × 100%,
Nutrient uptake efficiency = (Nf − Nc)/Nc × 100%,
ANa: Accumulation of nutrients content after fertilization (all tissues, g); ANb: Accumulation of nutrients content before fertilization (all tissues, g); Nf: Nutrient uptake content of fertilizer-treated plants (all tissues, g); Nc: Nutrient uptake content of control plants (all tissues, g); see equations (4)–(5).

2.5.2. Vector Analysis

Vector analysis is a technique that allows for simultaneous comparison of plant growth, nutrient concentration, and nutrient content in an integrated graphic format. In vector analysis, nutrient concentration is plotted as a function of plant weight (leaf, stem, root) and nutrient content, thereby allowing nutrient composition and plant biomass to be examined in a single diagram in which nutrient content (x), nutrient concentration (y), and biomass (z) satisfy the function: x = f (y,z). The vector analysis was adapted from Haase and Rose (1995) [39] and Imo and Timmer (1997) [40].

2.5.3. Seedling Quality Index (QI)

QI = Tm/(Hr + Sr),
Tm: Total biomass of seedling (g); Hr: Seedling height (cm)/seedling root collar diameter (mm); Sr: Stem biomass (g)/root biomass (g); see equation (6).

2.5.4. Data analysis

The Shapiro-Wilk and Levene tests showed that the data conformed to the normal distribution and had equal variance. Excel 2010 and SPSS 22.0 (Chicago, IL, USA) statistical software programs were used for the statistical analysis. A factorial analysis of variance (ANOVA) and the Duncan test were performed to analyze the variance and for multiple comparisons (α = 0.05). Plots were constructed with Origin 9.2 (Systat Software, Inc., Washington, St, USA) software programs.

3. Results

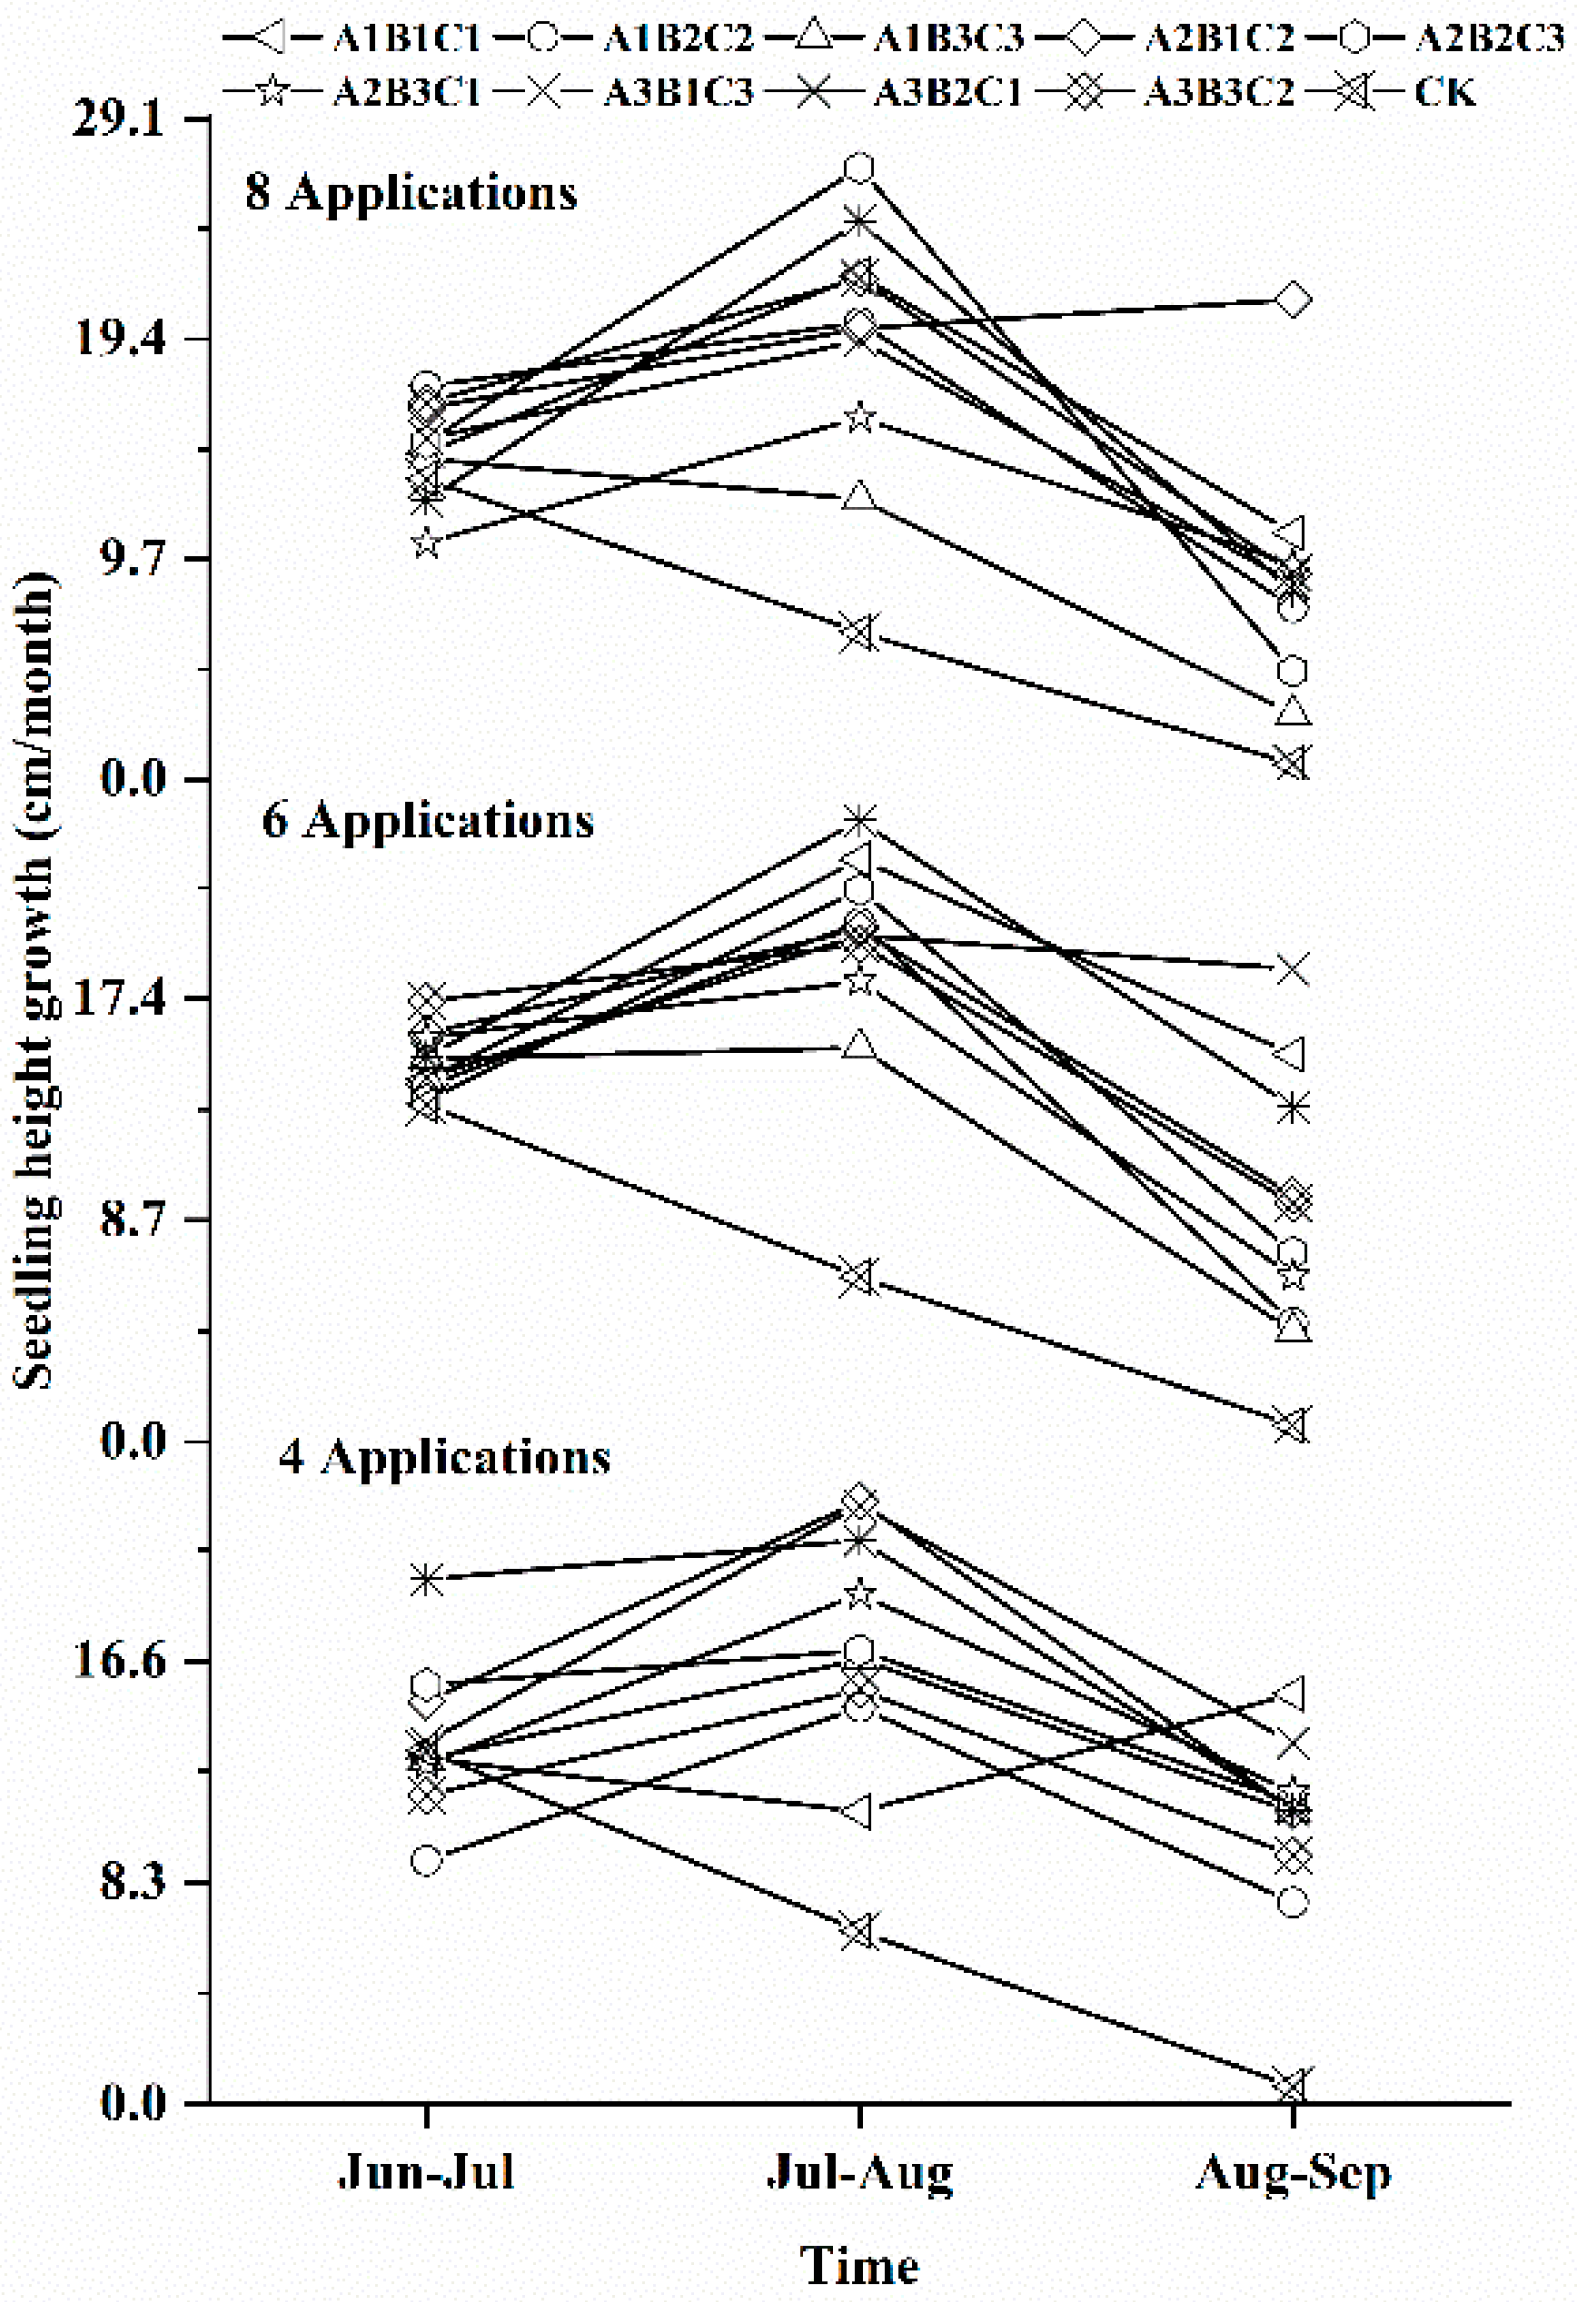
3.1. Effects of Different Fertilization Ratios and Frequencies on Seedling Height Growth

The mixed model for M. wufengensis showed differences in seedling height values among the fertilizer ratio, application frequency, time, and their interactions (Table 3). Table 4 shows the effects of different fertilizer application frequencies and ratios on height growth of M. wufengensis seedlings. Seedling height here was measured after the last fertilizer application. Seedling heights in the treatments (except for in the A1B3C3 treatment with eight fertilizer applications) was significantly higher than that in the CK. In the treatments with four fertilizer applications, heights increased by 20.8% to 99.8% compared to the CK. Among the nine treatments, seedling height in A2B1C2 was the highest (68.42 cm) and was 34.18 cm higher than that in the CK. In the treatments with six fertilizer applications, heights increased by 45.2% to 102.5% compared to that in the CK. Among the nine treatments, seedling height in A3B3C2 was the highest, at 69.34 cm, which was 35.1 cm higher than that in the CK. In treatments with eight fertilizer applications (excluding the A1B3C3 treatment), heights increased by 42.9% to 95.5% compared to that in the CK. Among the nine treatments, seedling height in the A3B1C3 treatment was the highest, at 66.94 cm, which was 32.70 cm higher than that in the CK. The average seedling height in the treatments with four, six, and eight fertilizer applications was 54.92, 60.14, and 56.44 cm, respectively. In addition, combined with the increased height relative to that of the CK, the performance of the treatment with six fertilizer applications was relatively better. Among the treatments with six fertilizer applications, the highest seedling height was found in A3B3C2 (69.34 cm), followed by A2B1C2 (67.60 cm) and A3B2C1 (63.10 cm).
As shown in Figure 1, in treatments with the three kinds of fertilizer application frequencies, except for the individual treatments, seedling height growth generally increased first and then decreased. From June to July, seedlings were in the initial growth stage, and from July to August, they reached peak growth with a decelerating growth rate from August to September. In contrast, CK seedling height growth maintained downward. Seedling height growth in the A1B1C1 treatment with four fertilizer applications decreased first and then increased. In the treatments with eight fertilizer applications, height growth in the A2B1C2 treatment continued to increase, whereas a downward trend was observed in the A1B3C3 treatment. In the treatments with four, six, and eight fertilizer applications, during the initial period of fertilization (from June to July), seedling height growth ranged from 9.11 to 19.66 cm, 13.96 to 17.27 cm, and 10.4 to 17.31 cm, respectively. During the middle period of fertilization (July to August), seedling height growth ranged from 10.94 to 22.57 cm, 15.46 to 24.38 cm and 12.34 to 26.95 cm, respectively. At the end of fertilization (August–September), seedling height growth ranged from 7.55 to 15.36 cm, 4.34 to 18.55 cm, and 4.76 to 21.14 cm, respectively. In treatments with all three fertilizer application frequencies, the maximum seedling height growth occurred during the middle period of fertilization. Among the treatments with four fertilizer applications, the seedling growth in A2B1C2 was the highest, at 22.57 cm; among the treatments with six fertilizer applications, that in A3B2C1 was the highest, at 24.38 cm; and among the treatments with eight fertilizer applications, that in A2B2C3 was the highest, at 26.95 cm.

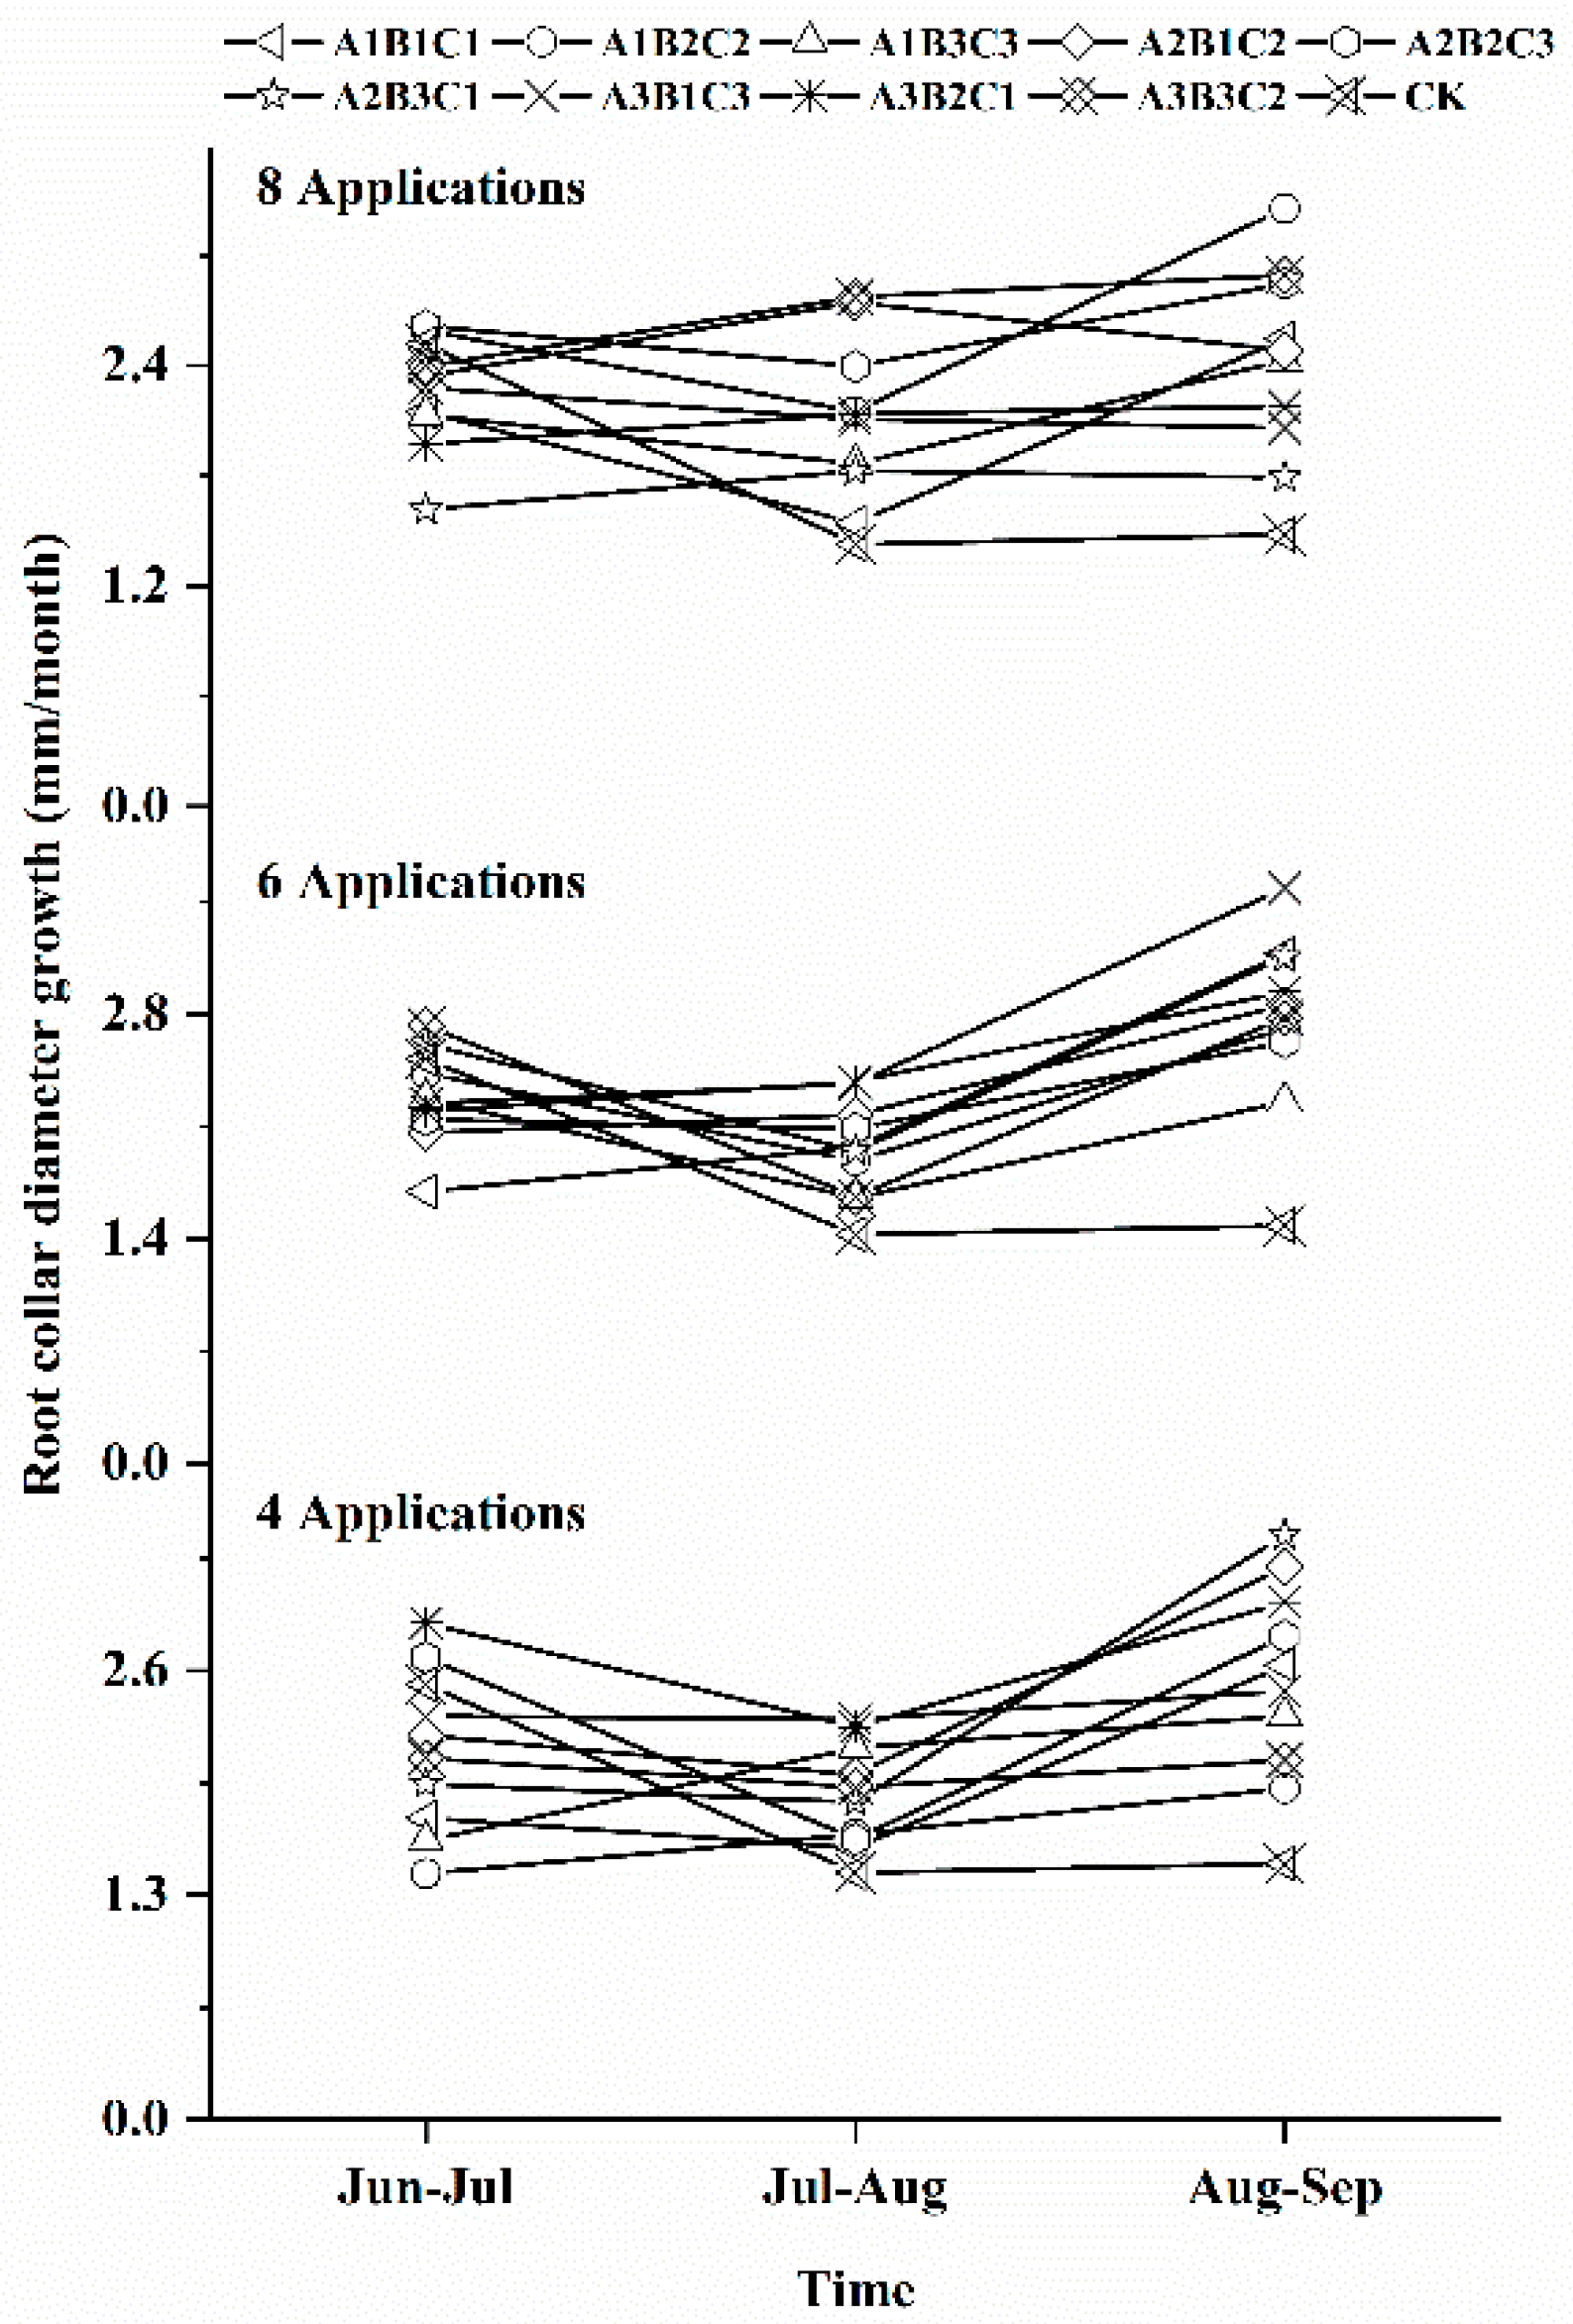
3.2. Effects of Different Fertilization Ratios and Frequencies on Seedling Root Collar Diameter

The mixed model for M. wufengensis showed differences in root collar diameter values among the fertilizer ratio, application frequency, time and their interactions (Table 3). Table 5 shows the effects of different fertilization ratios and frequencies on root collar diameter growth of M. wufengensis seedlings. Seedling root collar diameter here was measured after the last fertilization. According to Table 5, in the treatments with four fertilizer applications, except for in the A1B2C2 treatment, root collar diameters was significantly higher (16.7%–40.6% higher) than that in the CK. Among these treatments, the A3B1C3 treatment had the largest root collar diameter of 10.786 mm, which was 3.112 mm higher than that of the CK. In the treatments with 6 fertilizer applications, root collar diameters were significantly higher (23.0%–52.1% higher) than that in the CK. Among these treatments, the A3B2C1 treatment had the largest root collar diameter of 11.672 mm, which was 3.98 mm higher than that of the CK. In the treatments with 8 fertilizer applications, except for in the A1B3C3 treatment, root collar diameters were significantly higher (17.3%–56.5% higher) than that in the CK. Among these treatments, the A2B2C3 treatment had the largest root collar diameter of 12.012 mm, which was 4.938 mm higher than that in the CK. The average seedling root collar diameter in the treatments with four, six, and eight fertilizer applications was 9.922, 10.257, and 10.177 mm, respectively. In addition, the differences among different frequencies of the fertilization ratios were not significant.
As shown in Figure 2, in treatments with the three kinds of fertilizer application frequencies, seedling root collar diameter growth generally decreased first and then increased; this trend was opposite to that of seedling height growth. However, seedling root collar diameter growth in the CK did not change significantly (p > 0.05), except for an initial decreasing trend. In the treatments with four fertilizer applications, except for an increasing trend in the A1B3C3, A1B2C2, and A3B1C3 treatments, root collar diameter decreased first and then increased. During the early growth stage, from June to July, root collar diameter growth ranged from 1.423 to 2.875 mm; from July to August, root collar diameter growth decreased significantly (p < 0.05), ranging from 1.428 to 2.320 mm. However, from August to September, the root collar diameter growth significantly (p < 0.05) increased again, ranging from 1.481 to 2.995 mm, which was higher than that in the early growth stage (from June to July). The maximum root collar diameter growth appeared in the A3B2C1 treatment, with a root collar diameter of 2.995 mm. In the treatments with six fertilizer applications, the same phenomenon occurred: except for the continuously increasing root collar diameter growth in the A1B1C1, A2B1C2, A3B1C3, and A3B2C1 treatments, root collar diameter generally decreased first and then increased. The root collar diameter growth from June to July, July to August, and August to September was 1.695 to 2.730 mm, 1.428 to 2.378 mm, and 1.481 to 3.586 mm, respectively. The maximum growth was 3.586 mm in the A3B1C3 treatment. In the treatments with eight fertilizer applications, the dynamic variation in root collar diameter growth was not very clear compared with that in the treatments with four and six fertilizer applications. Root collar diameter growth in the A1B1C1, A1B3C3, A1B2C2, and A2B2C3 treatments first decreased and then increased, while the root collar diameter growth in the A2B3C1, A3B2C1, A2B1C2, and A3B3C2 treatments first increased and then decreased. Root collar diameter growth in the A3B1C3 treatment decreased.

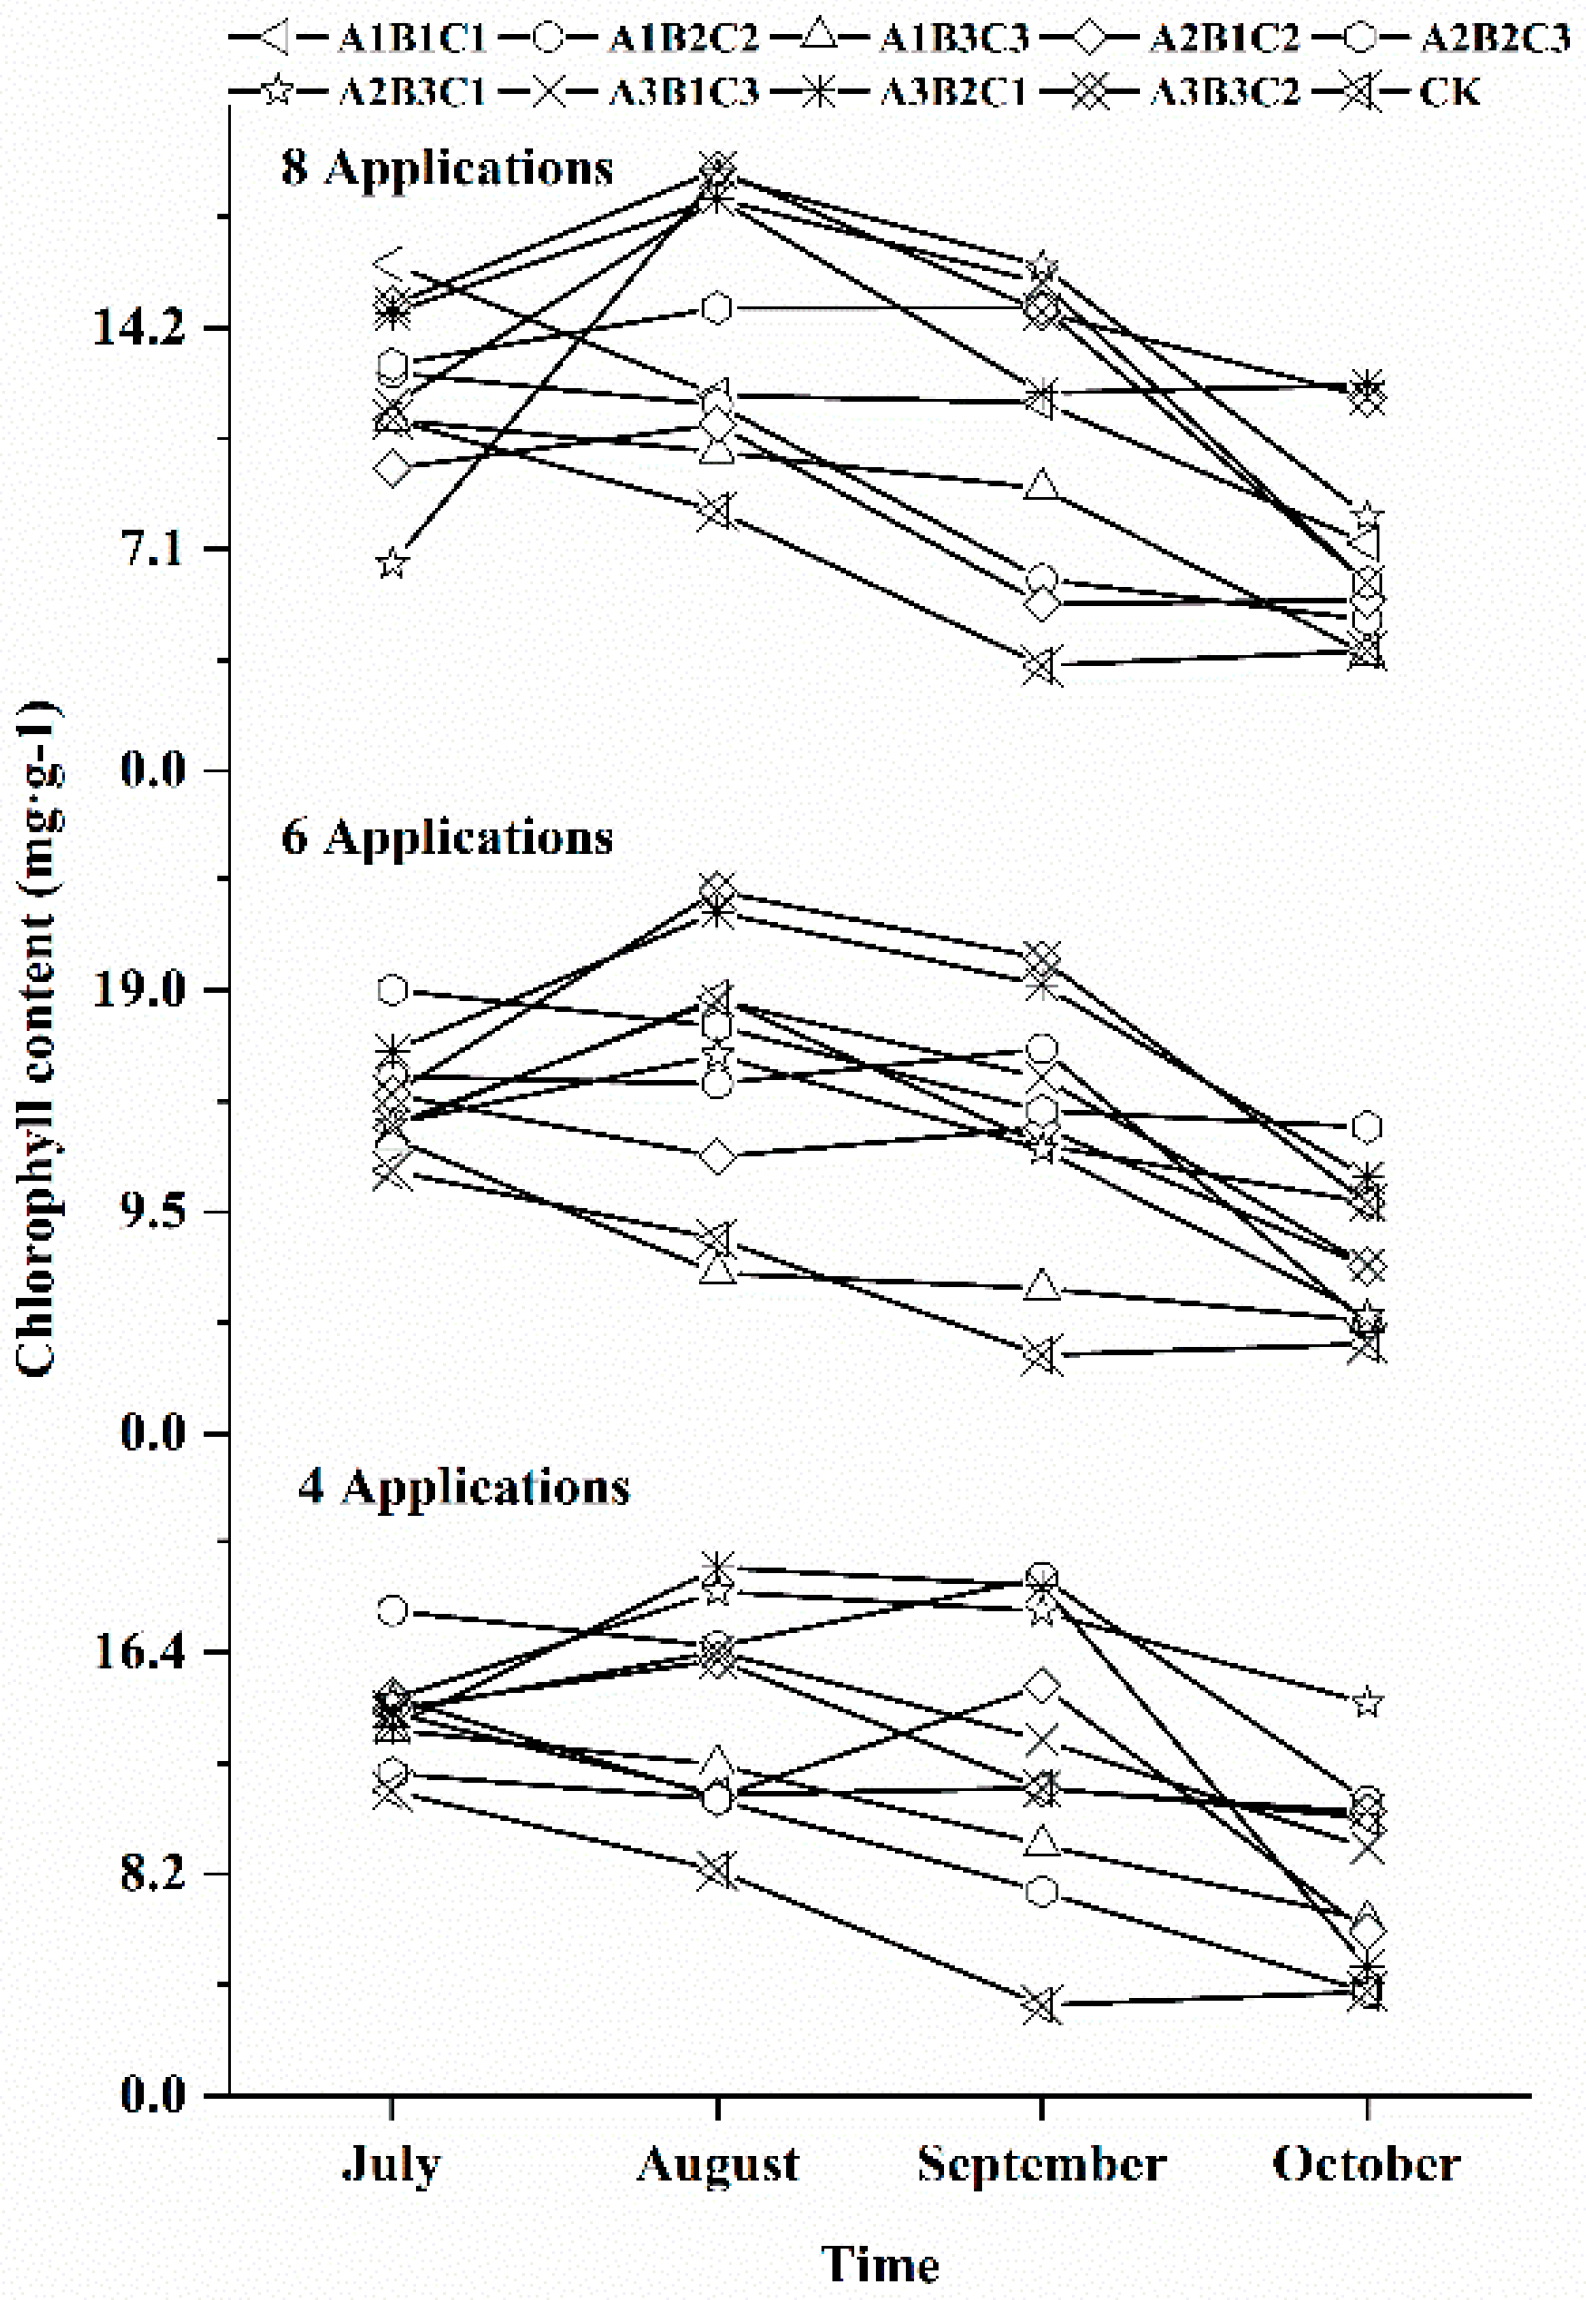
3.3. Effects of Different Fertilization Ratios and Frequencies on the Chlorophyll Content in Seedling Leaves

The mixed model for M. wufengensis showed significant differences in chlorophyll content among the fertilizer ratio, application frequency, time and their interactions (Table 3). The vast majority of plant growth depends on photosynthesis, and chlorophyll is a key substance for photosynthesis; thus, chlorophyll content can quickly and accurately reflect plant growth status. As shown in Figure 3, chlorophyll content changes were not very consistent, indicating that there were different effects on the chlorophyll content in seedling leaves under different fertilization ratios and frequencies. The chlorophyll content in the CK was basically unchanged after an initial decrease. In the treatments with four and six fertilizer applications, the chlorophyll content in the A2B3C1, A3B1C3, A3B2C1, and A3B3C2 treatments showed a trend of “moderate increase, sharp decrease”. The chlorophyll contents in leaves from the A1B2C2 and A2B1C2 treatments showed a trend of “decrease-increase-decrease” trend. Unlike in those treatments, the chlorophyll content in leaves from the A1B1C1, A1B3C3, and A2B2C3 treatments consistently decreased. In the treatments with eight fertilizer applications, the chlorophyll content in the A1B1C1, A1B2C2, and A1B3C3 treatments decreased, while that in the other treatments increased first and then decreased. At the beginning of July, except in the A1B2C2 (17.94 mg g−1) treatment with four fertilizer applications, the A3B2C1 (16.38 mg g−1) treatment with six fertilizer applications, and the A1B1C1 (16.25 mg g−1) and A3B3C2 (14.94 mg·g−1) treatments with eight fertilizer applications, the chlorophyll content was not significantly (p > 0.05) different from that in the CK. As the seedlings grew, the chlorophyll content in the treatments in which the chlorophyll content was significantly (p < 0.05) higher than that in the CK (8.33 mg g−1) increased, and the differences became increasingly significant (p < 0.05). By the end of October, although the chlorophyll content in the treatments in which the initial chlorophyll content was higher than that in the CK decreased, it was still greater than that during the early growth period. Furthermore, the chlorophyll content in the A1B2C2 treatment with four fertilizer applications, the A2B2C3 treatment with six fertilizer applications and the A3B3C2 and A2B3C1 treatments with eight fertilizer applications was significantly (p < 0.05) higher than that in the CK throughout the whole growth process and was maintained at a high level, which indicated that these treatments may be the optimal fertilization combinations for M. wufengensis.

3.4. Effects of Different Fertilization Ratios and Frequencies on Seedling Bbiomass

3.4.1. Effects on Seedling Root Biomass

The mixed model for M. wufengensis showed differences in total and stem biomass values among the fertilizer ratio, application frequency and their interactions, but for root and leaf biomass, only showed a significant difference between fertilization ratio (Table 6). As shown in Table 7, except in the A1B3C3 and A3B3C2 treatments with eight fertilizer applications, the proportion of root biomass to whole plant biomass decreased. Among the treatments with four fertilizer applications, the root biomass in the A2B3C1, A3B1C3, A3B2C1, and A3B3C2 treatments was significantly higher than that in the CK, and that in the A3B2C1 treatment was the highest, being 131.8% higher than that in the CK. The root biomass in the A3B2C1 treatment constituted the highest proportion of the whole plant biomass in all nine fertilization treatments, reaching 52.3%. In treatments with six fertilizer applications, except in the A1B1C1, A1B3C3, A2B1C2, and A2B2C3 treatments, the root biomass was significantly higher than that in the CK, and the root biomass in A3B3C2 (16.33 g plant−1) was the highest, being 141.2% higher than that in the CK. However, the A1B2C2 treatment had the highest proportion of root biomass to whole plant biomass, reaching 48.4%. In the treatments with eight fertilizer applications, except for the A1B1C1, A1B2C2, and A2B1C2 treatments, the root biomass was significantly higher than that in the CK. Among these treatments, although the root biomass in the A3B3C3 (17.04 g plant−1) treatment was the highest (151.7% higher than that in the CK), the proportion of root biomass to whole plant biomass was not the highest (52.3%), which occurred in the A1B3C3 treatment (57.3%). In summary, a higher root biomass did not mean a higher proportion of root biomass to whole plant biomass. From the perspective of fertilization frequency, under a constant total amount of fertilization, fertilization frequency will affect the proportion of root biomass to whole plant biomass, and that in treatments with six fertilizer applications will be lower than that in treatments with four and eight fertilizer applications.

3.4.2. Effects on Seedling Stem Biomass

As shown in Table 8, different fertilization ratios and frequencies not only significantly increased stem biomass but also increased the proportion of stem biomass to whole plant biomass. Among the treatments with four, six, and eight fertilizer applications, the treatments with the highest stem biomass were A3B3C2, A3B3C2, and A2B3C1, whose values were 206.5, 244.3, and 207.4% higher than that in the CK, respectively. However, the highest proportion of stem biomass to whole plant biomass occurred in the A2B1C2 treatment, which indicated that stem biomass did not positively correlate with its proportion to whole plant biomass. Moreover, fertilization frequency also had influence on stem biomass proportion to whole plant biomass, and the proportion of stem biomass to whole plant biomass in the treatments with six fertilizer applications was relatively high.

3.4.3. Effects on Seedling Leaf Biomass

The effects of different fertilization ratios and frequencies on leaf biomass are shown in Table 9. Among the treatments with four fertilizer applications, leaf biomass significantly increased in the A2B3C1, A3B1C3, and A3B3C2 treatments, and the highest leaf biomass was in the A3B3C2 treatment, at 158.9% higher than that in the CK; however, the highest proportion of leaf biomass to whole plant biomass was in the A1B3C3 treatment (23.4%). Among the treatments with six fertilizer applications, the leaf biomass in the A2B3C1, A3B1C3, A3B2C1, and A3B3C2 treatments was significantly higher than that in the CK, and that in the A3B3C2 treatment was the highest, at 168.4% higher than that in the CK. However, the A2B3C1 treatment had the highest proportion of leaf biomass to whole plant biomass, which reached 23.6%. In the treatments with 8 fertilizer applications, except in the A1B1C1, A1B2C2, A1B3C3, and A3B3C2 treatments, the leaf biomass was significantly higher than that in the CK, and the A3B1C3 treatment had the greatest change, with a leaf biomass 140.3% higher than that in the CK. Furthermore, the highest proportion of leaf biomass to whole plant biomass was in the A1B1C1 treatment. In general, fertilization significantly increased leaf biomass, but a higher leaf biomass did not mean a higher proportion of leaf biomass to whole plant biomass. In addition, fertilization frequency also had a significant influence on leaf biomass and its proportion to whole plants biomass, and the proportion of leaf biomass to whole plant biomass in the treatments with six fertilizer applications was relatively high.

3.4.4. Effects on Whole Seedling Biomass

Table 10 shows that fertilization could significantly increase the biomass of whole seedlings. In the treatments with four, six, and eight fertilizer applications, the whole plant biomass increased by 47.2%–141.6%, 50.2%–172.2%, and 49.6%–160.8%, respectively, compared to that in the CK. The maximum plant biomass in treatments with four, six, and eight fertilizer applications was found in the A3B2C1, A3B3C2, and A3B1C3 treatments, respectively. Comprehensive analyses of root biomass (Table 7), stem biomass (Table 8) and leaf biomass (Table 9) demonstrated that biomass in M. wufengensis seedlings generally ranked as root biomass > stem biomass > leaf biomass. However, in proportion to whole plant biomass, after fertilization, the root biomass decreased, resulting in an increase in stem biomass with little effect on leaf biomass. We can conclude that fertilization mainly affects root and stem growth in M. wufengensis seedlings, promoting stem development and growth.

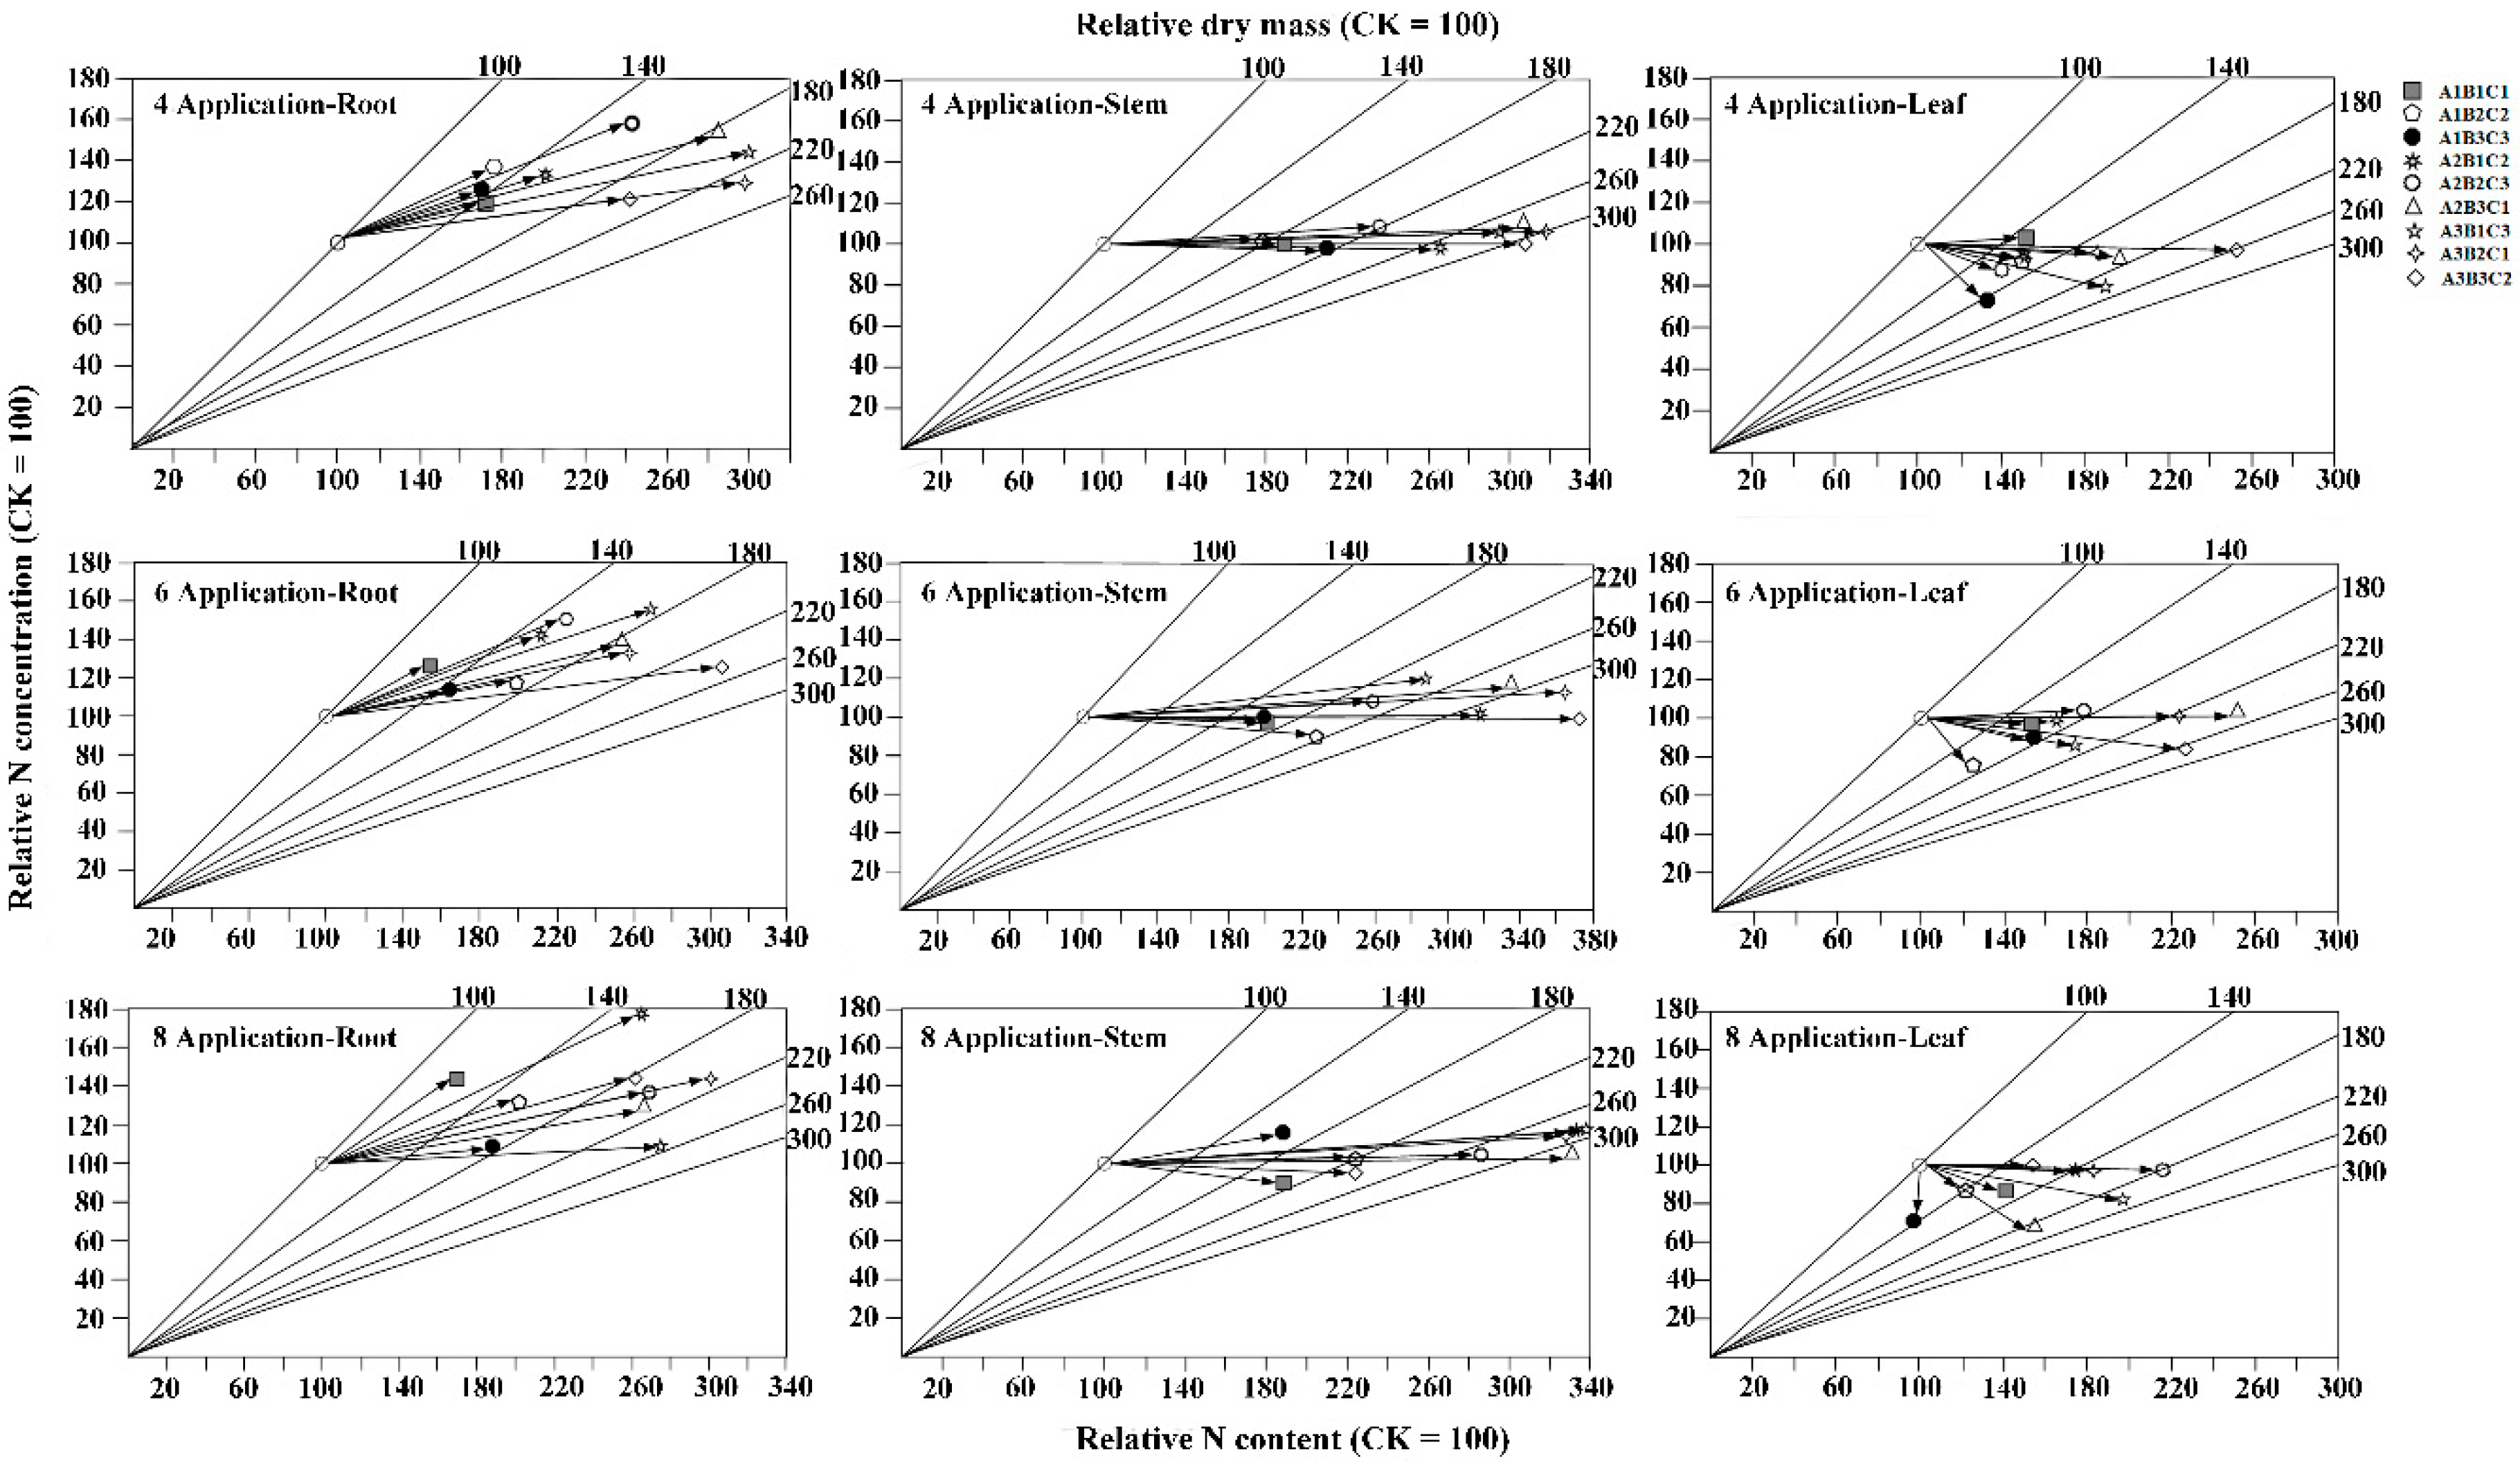
3.5. Effects of Different Fertilization Ratios and Frequencies on Nutrient Satus in Seedling Tissues

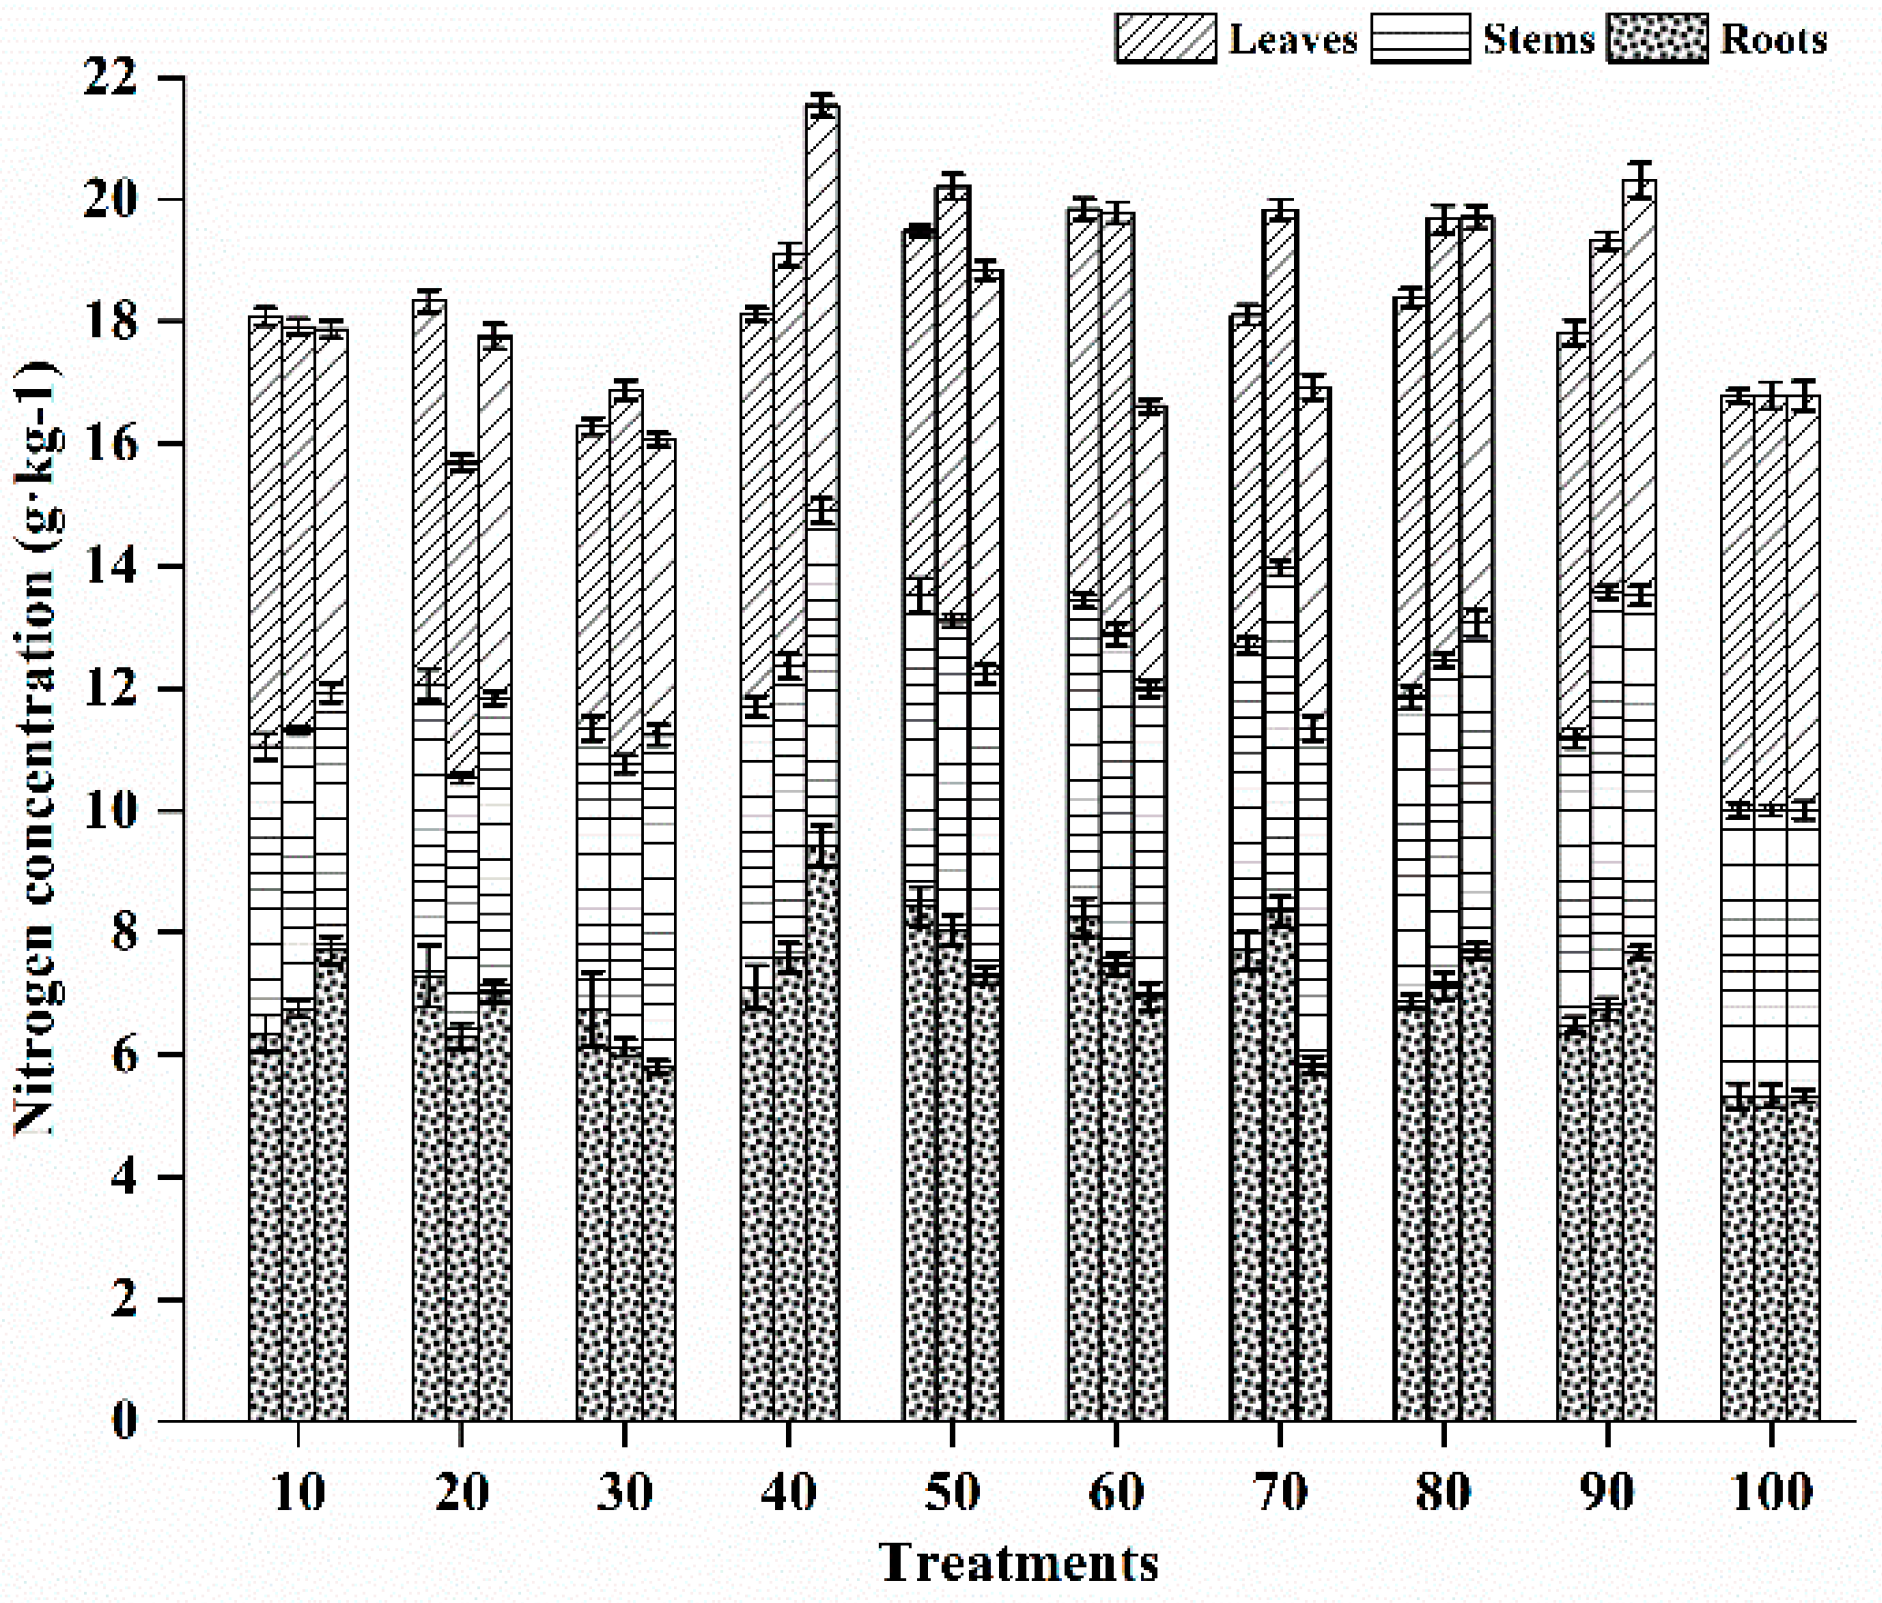
3.5.1. Nitrogen Status in Different Vegetative Tissues

Figure 4 and Figure 5 show the effects of different NPK ratios and fertilization frequencies on the N distribution in various seedling tissues. Although fertilization contributed to N accumulation in seedlings, contrasting trends in N concentration of different tissues were apparent. The highest content of N in the stem. N deficiency associated with increase in dry mass, N content, and N concentration was observed in the root (Figure 4). In contrast, marked dilution of N associated with increase in growth and N content but declining N concentration was observed in both stem and leaf (Figure 4). Except in the A1B3C3 treatment with four fertilizer applications, the A1B2C2 and A1B3C3 treatments with six fertilizer applications, and the A1B3C3, A2B3C1, and A3B1C3 treatments with eight fertilizer applications, the N concentration was significantly higher than that in the CK (16.789 g kg−1, Figure 5). Among the treatments with four, six, and eight fertilizer applications, the treatments with the highest N concentration were A2B3C1, A3B1C3, and A2B1C2, whose values were 18.2, 20.4, and 28.3% higher than that in the CK, respectively. Figure 5 also shows that the N concentration in the roots increased after fertilization and accounted for the highest proportion in plants, followed by that in the leaves, while the stem N concentration was the lowest. Under the three kinds of fertilization frequencies, N concentration in the roots ranged from 35.1%–43.2%, 34.9%–42.1%, and 34.4%–43.8%, respectively, which were higher than that in the CK (31.7%); N accumulation in the leaves ranged from 29.9%–38.9%, 29.8%–36.9%, and 27.9%–35.1%, respectively, which were lower than that in the CK (40.4%); and N concentration in the stems ranged from 25.3%–28.2%, 25.1%–35.3%, and 23.6%–33.8%, respectively. Except for in the A1B3C3 (28.2%) treatment with four fertilizer applications; the A3B3C2 (35.3%) and A3B1C3 (28.3%) treatments with six fertilizer applications; and the A1B3C3 (33.8%), A3B1C3 (32.6%), A2B3C1 (30.3%), and A3B3C2 (28.8%) treatments with eight fertilizer applications, N concentration was lower than that in the CK (27.9%). In summary, under these three fertilization frequencies, N concentration in roots significantly increased; in contrast, N concentration in leaves decreased. In addition, N accumulation in stems decreased with decreasing fertilization frequency; therefore, fertilization mainly increased the N concentration in roots.

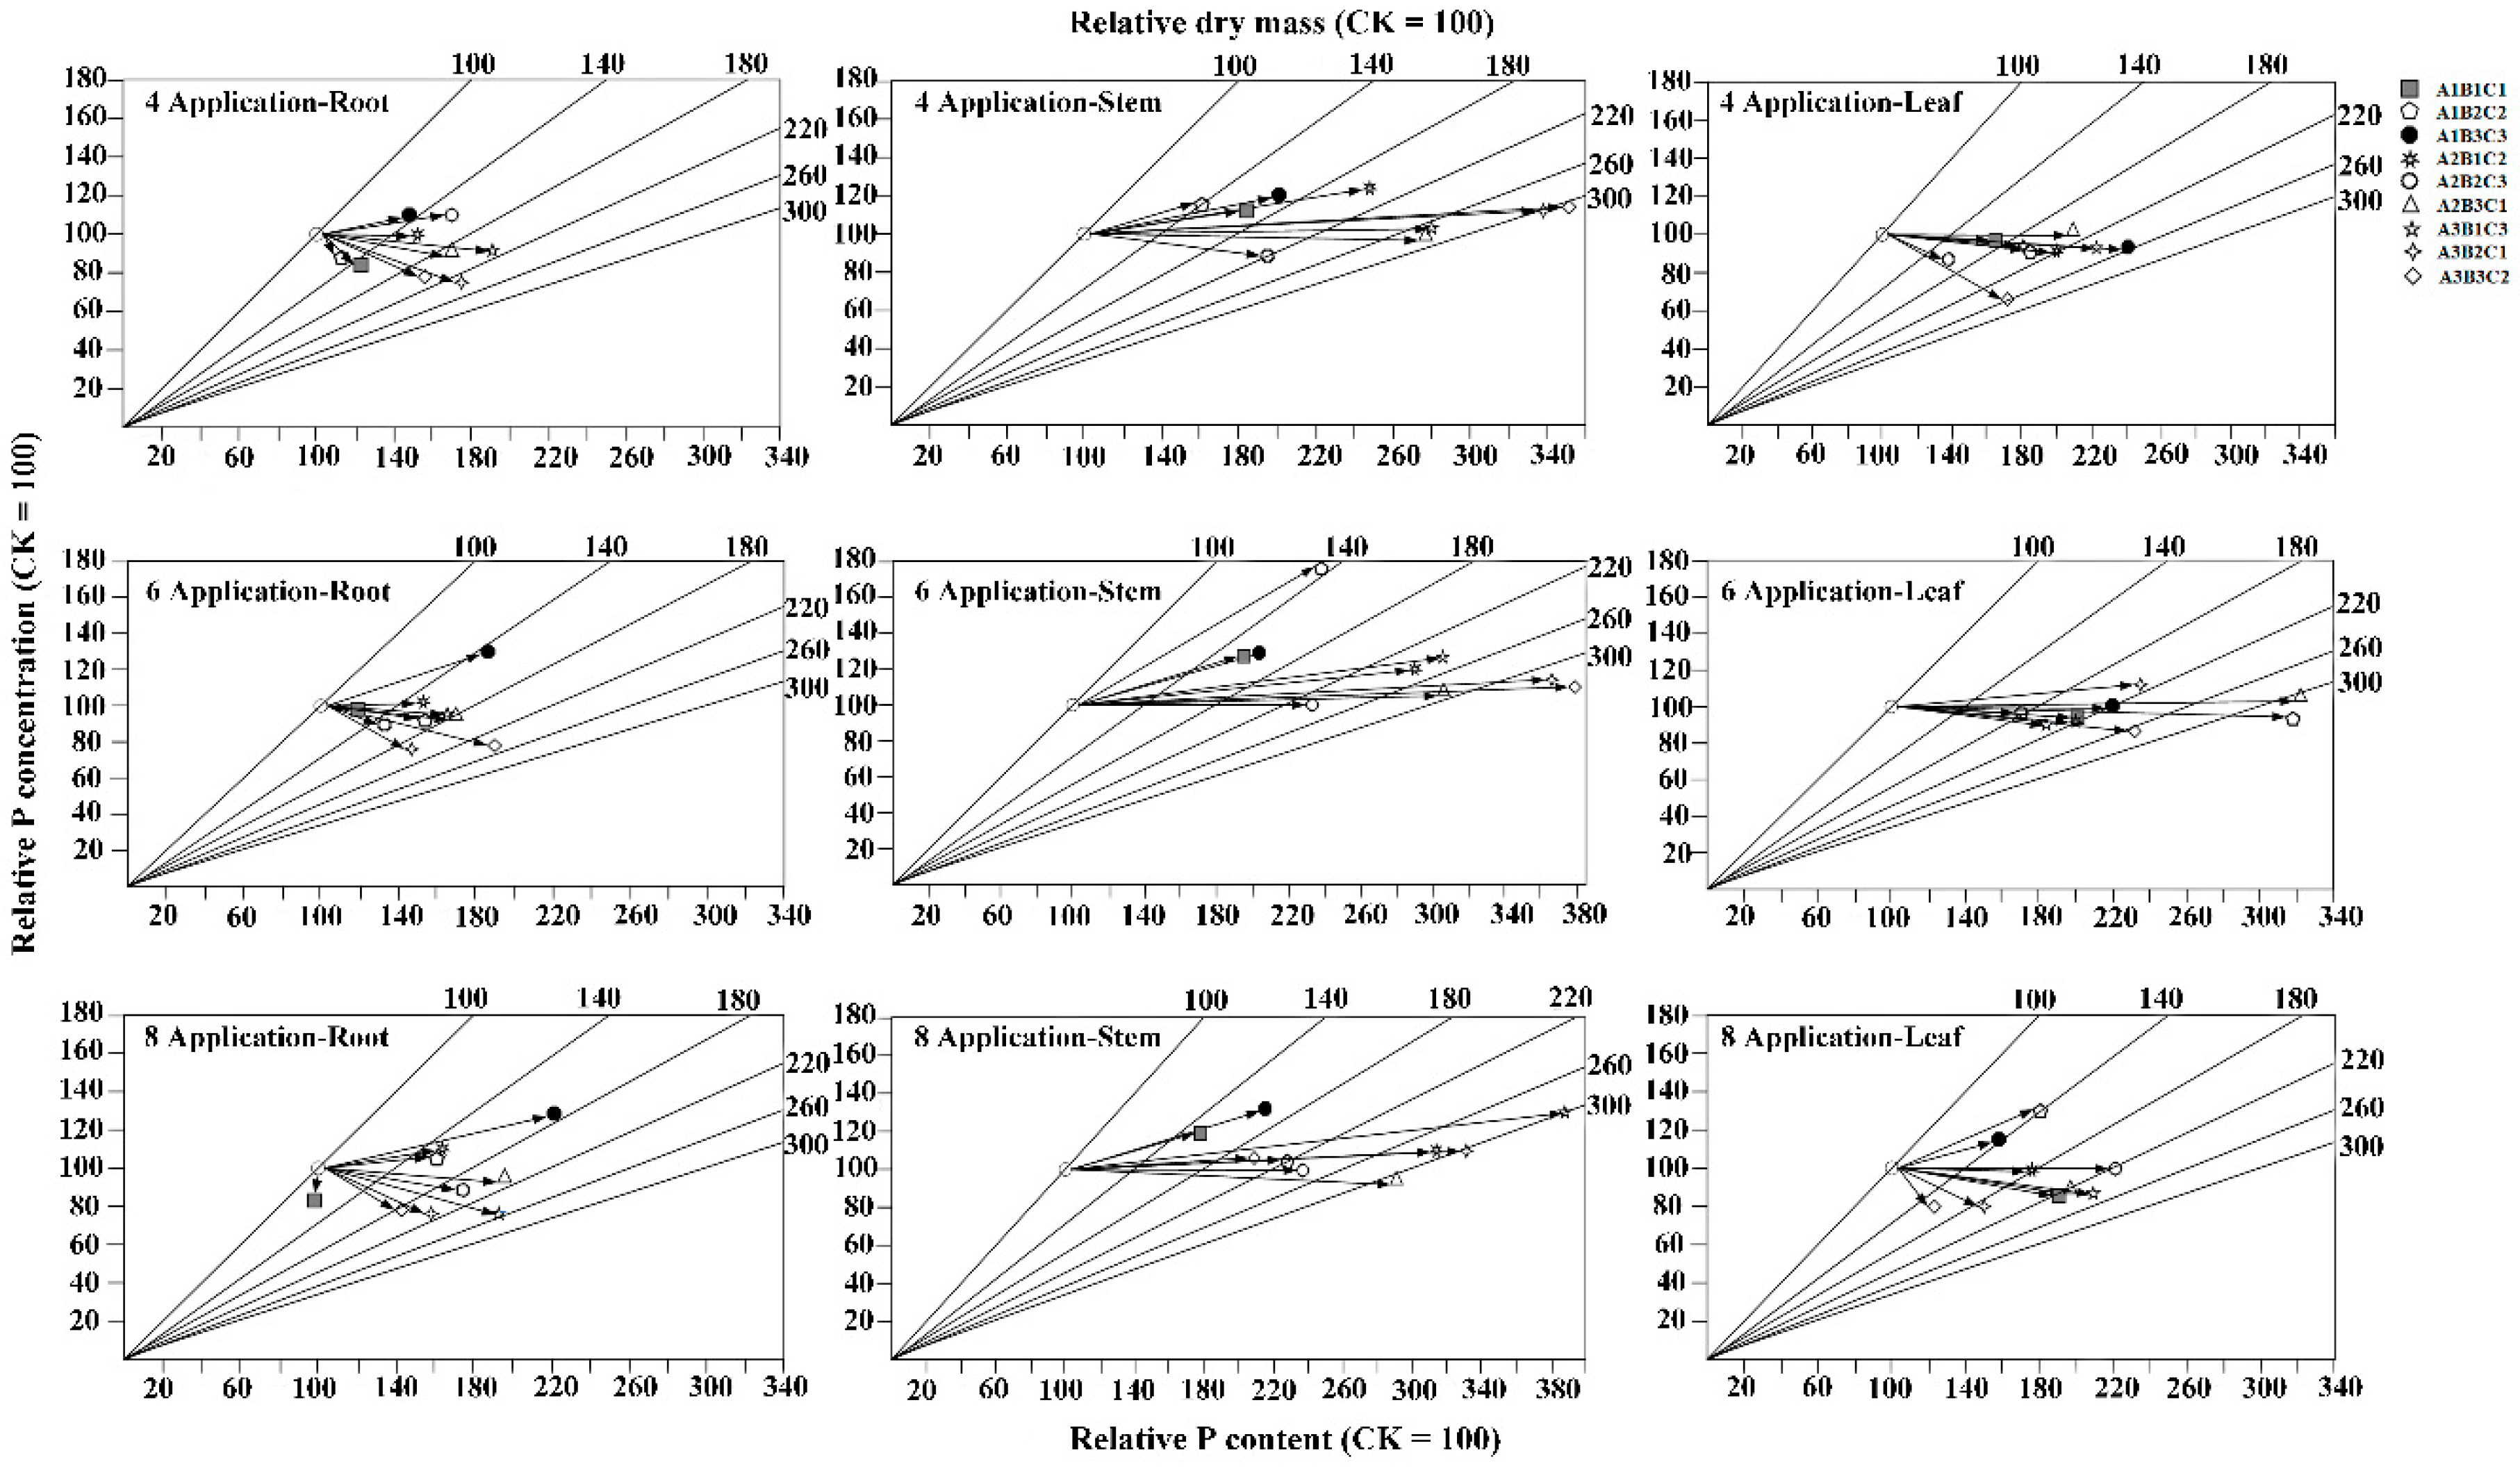
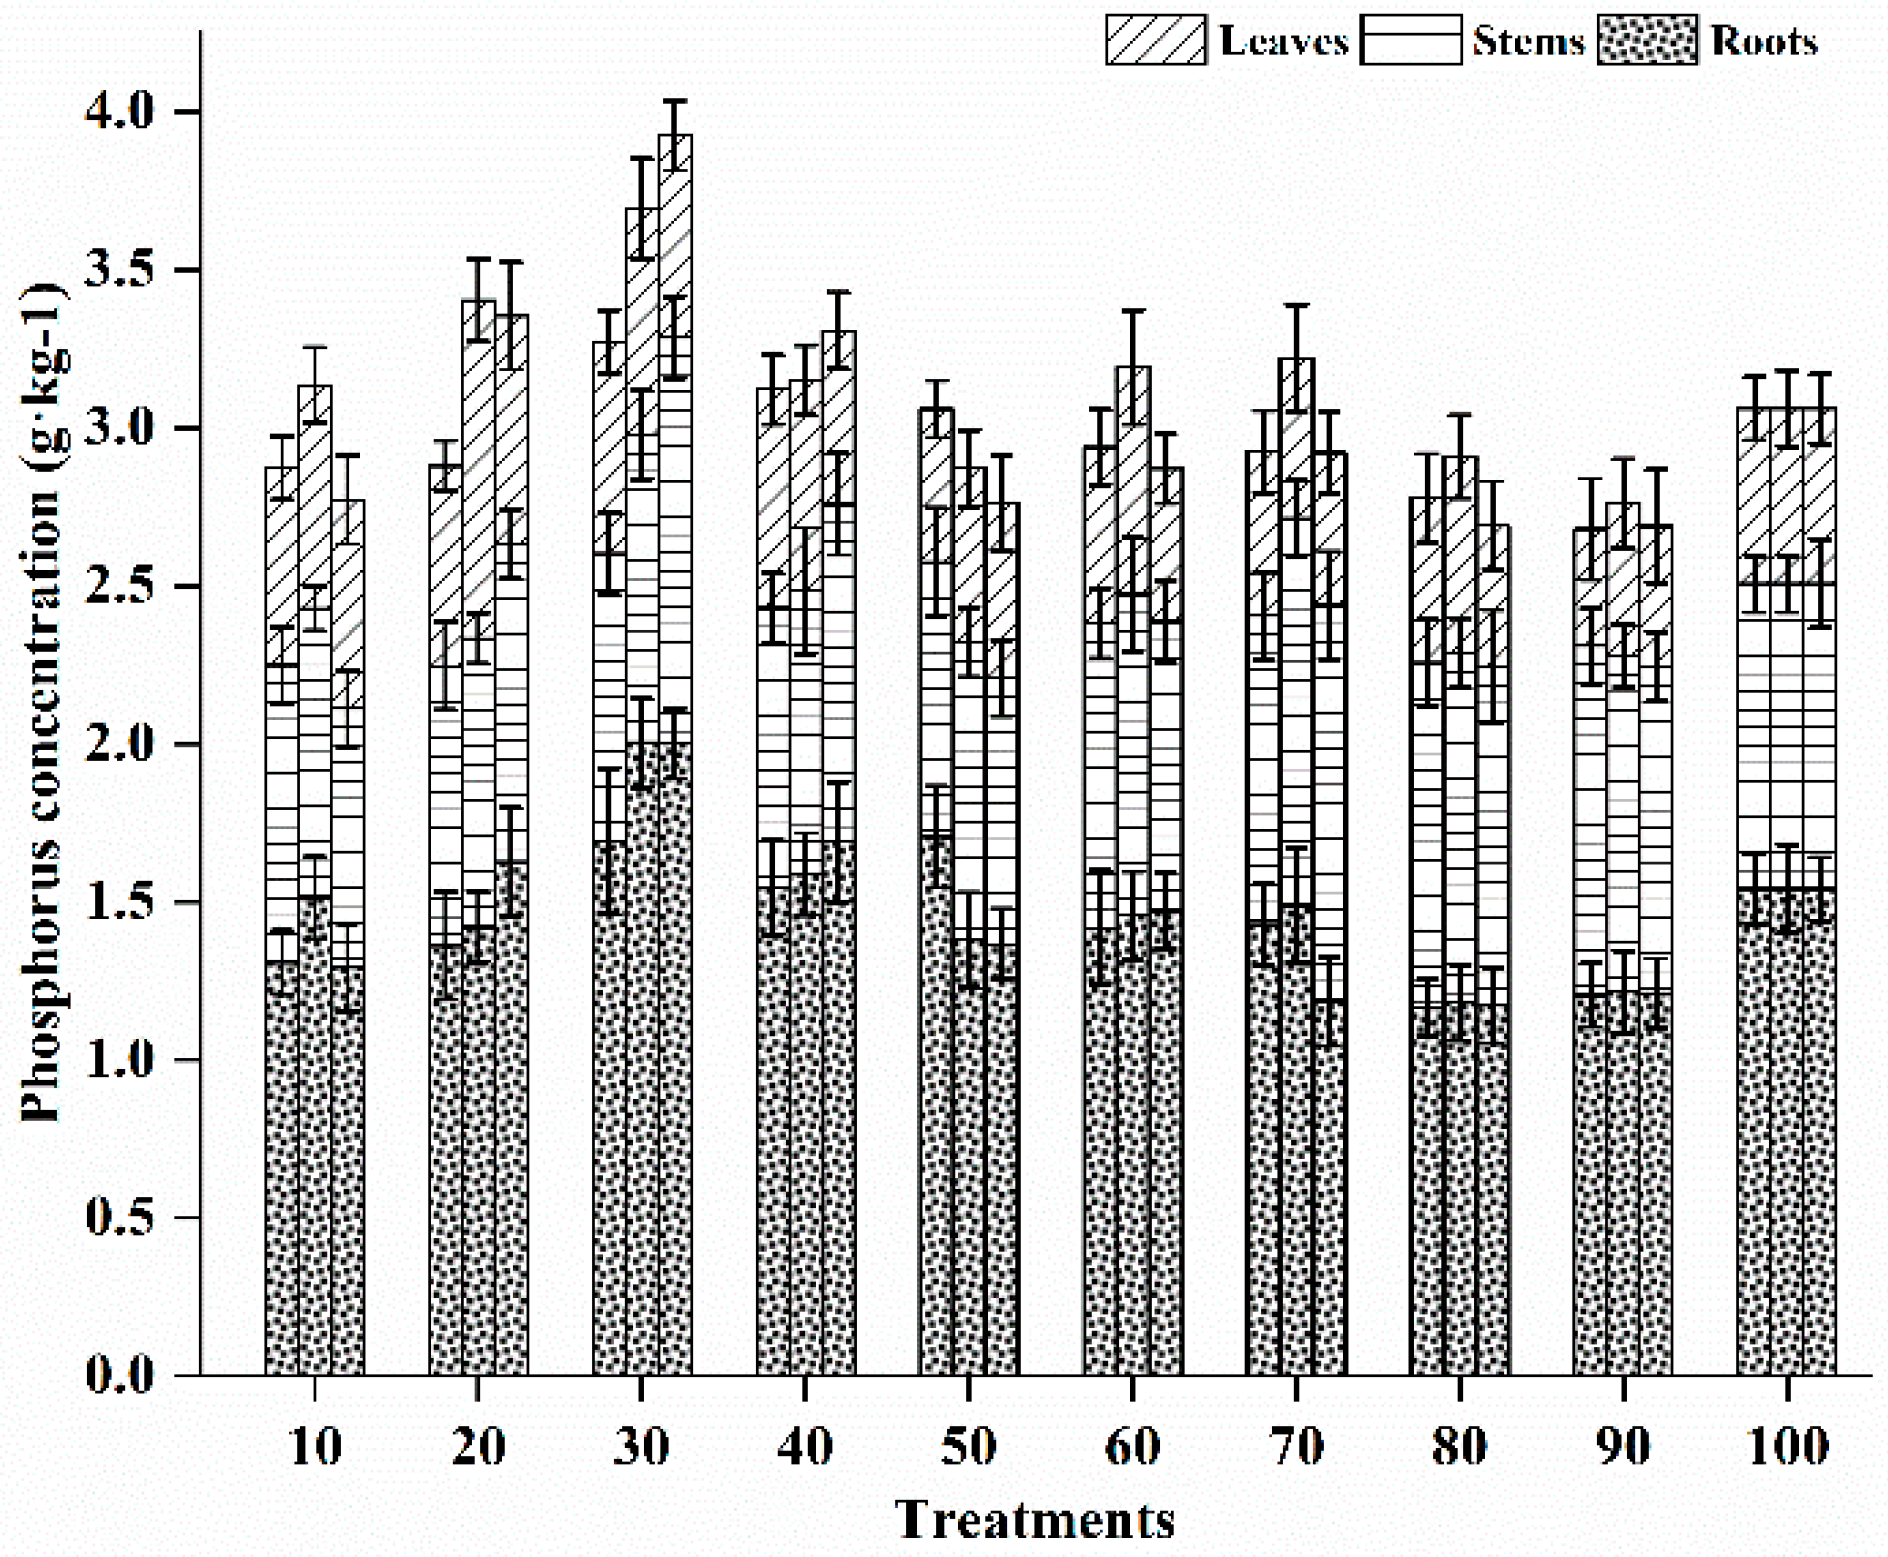
3.5.2. Phosphorus Status in Different Vegetative Tissues

Overall, all fertilization treatments could promote P uptake, and the highest content of P in the stem (Figure 6). P deficiency associated with increase in dry mass, P content, and P concentration was mainly observed in the stem (Figure 6). In contrast, marked dilution of P associated with increase in growth and P content but declining P concentration was mainly observed in both root and leaf (Figure 6). Among the treatments with four fertilizer applications, only the A1B3C3 treatment had a P concentration significantly higher than that in the CK (3.059 g kg−1, Figure 7); the P concentration in the other treatments were not significantly different from that in the CK, at 87.5%–102.0% of that in the CK. In the treatments with six fertilizer applications, except in the A3B3C2, A2B2C3, and A3B2C1 treatments, the P concentration was significantly higher (2.4%–20.6% higher) than that in the CK. Among these treatments, the A1B3C3 and A1B2C2 treatments had much higher P concentration, at 3.69 g kg−1 and 3.40 g kg−1, respectively. In the treatments with 8 fertilizer applications, except in the A2B1C2 (3.31 g kg−1), A1B2C2 (3.35 g kg−1), and A1B3C3 (3.92 g kg−1) treatments, the P concentration was lower (4.5%–12.2% lower) than that in the CK. These findings suggested the fertilization frequency of six fertilizer applications may have contributed to P accumulation in plants. At the same time, the P concentration in the roots was higher overall and accounted for the highest proportion of P in the whole plant, followed by the stems and leaves (Figure 7). In the treatments with four, six, and eight fertilizer applications, P concentration in the roots ranged from 41.9%–55.7%, 40.6%–54.2%, and 40.5%–51.1%, respectively. Except in the A1B3C3 (51.7%) and A2B2C3 (55.7%) treatments with four fertilizer applications; the A1B3C3 (54.2%) and A2B1C2 (50.4%) treatments with six fertilizer applications; and the A2B3C1 (51.2%), A2B1C2 (51.1%), and A1B3C3 (51.0%) treatments with eight fertilizer applications, the P concentration was lower than that in the CK (50.3%). P concentration in stems ranged from 27.8% to 41.3%, 26.4% to 38.6%, and 29.6% to 42.9%, respectively. Except in the A1B2C2, A2B2C3, A2B1C2, and A1B3C3 treatments with four fertilizer applications; the A1B3C3 (26.4%), A1B2C2 (26.9%), A2B1C2 (28.4%) and A1B1C1 (29.6%) treatments with six fertilizer applications; and the A1B1C1 (29.2%), A1B2C2 (30.0), and A2B2C3 (30.5%) treatments with eight fertilizer applications, the P concentration was higher than that in the CK (31.6%). P concentration in leaves was 13.8%–22.2%, 15.7%–31.4%, and 16.3%–23.8%, respectively. Except in the A3B3C2 (13.8%), A2B2C3 (15.8%), and A3B1C3 (17.8%) treatments with four fertilizer applications and the A3B1C3 (15.7%) and A3B3C2 (17.5%) treatments with six fertilizer applications, the P concentration was higher than that in the CK (18.1%). However, among the treatments with eight fertilizer applications, the P concentration in only three treatments, including A1B1C1 (23.8%), A1B2C2 (21.5%), and A2B2C3 (20.1%), was higher than that in the CK. In summary, although P concentration was highest in the roots under the three different fertilization frequencies, compared to the P concentration in roots of the CK, it decreased. In addition, P concentration in stems increased, and P concentration in leaves was the lowest, even decreasing. Therefore, fertilization mainly promoted P accumulation in stems.

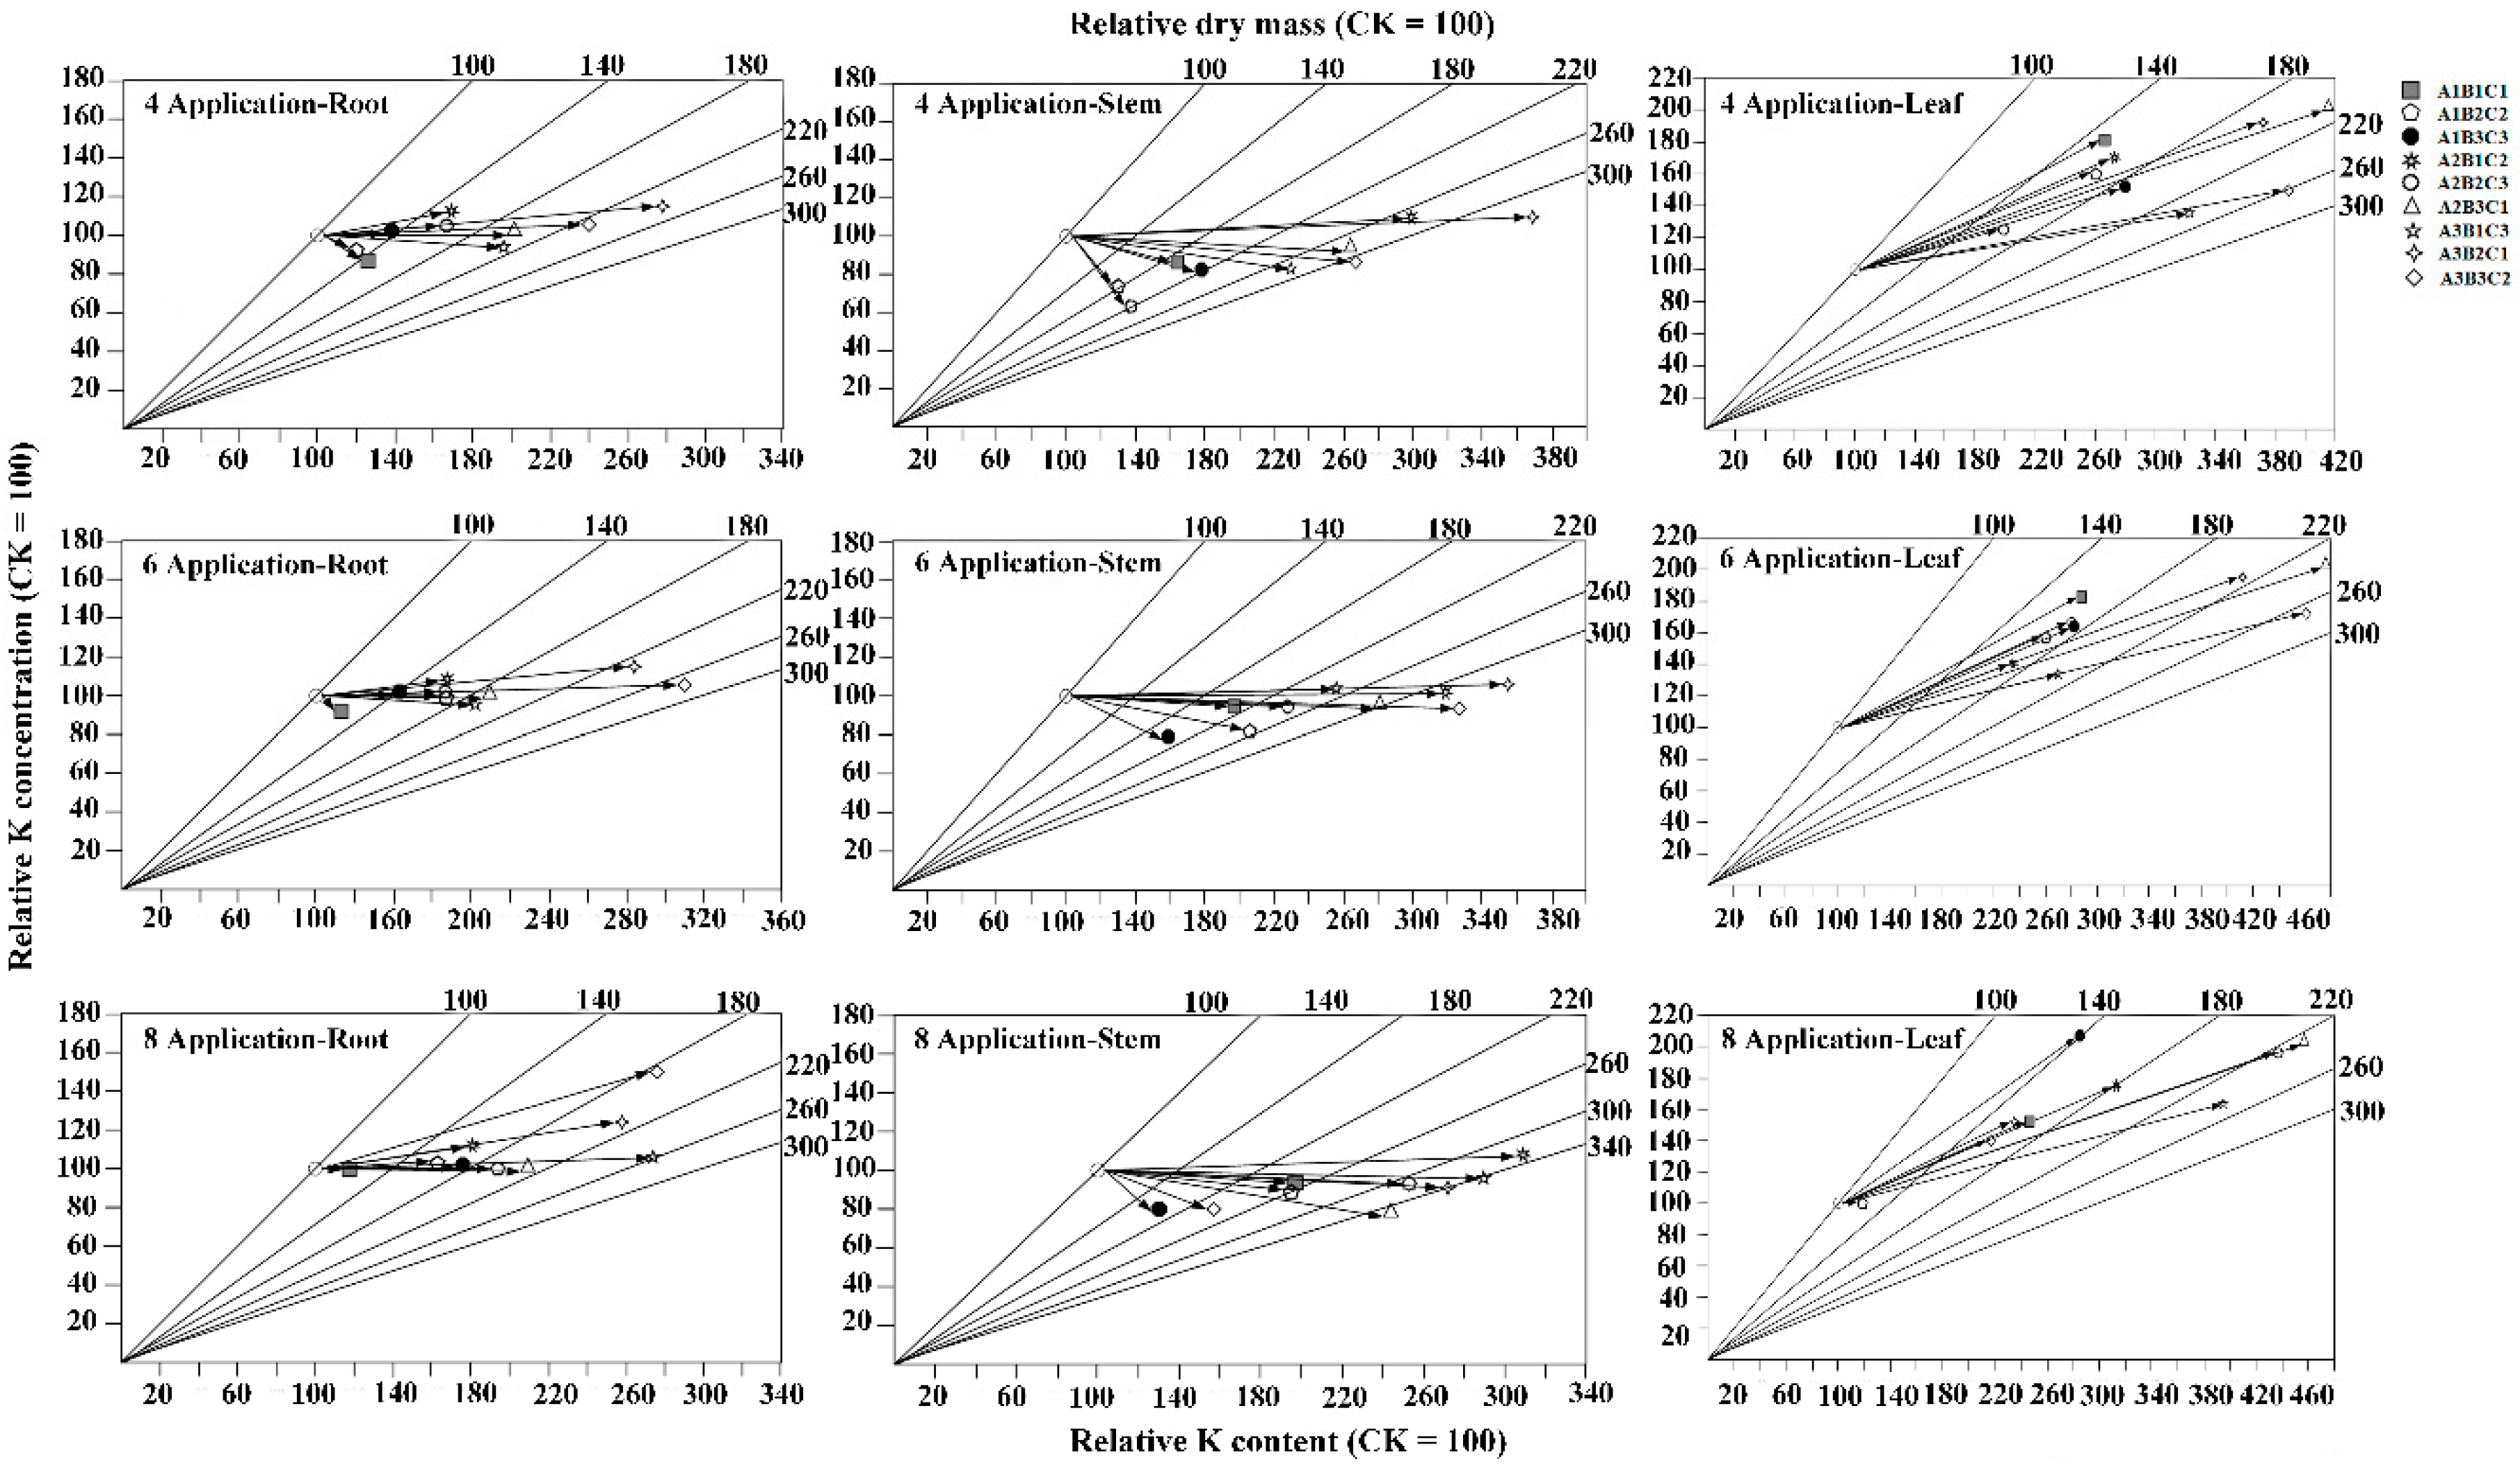
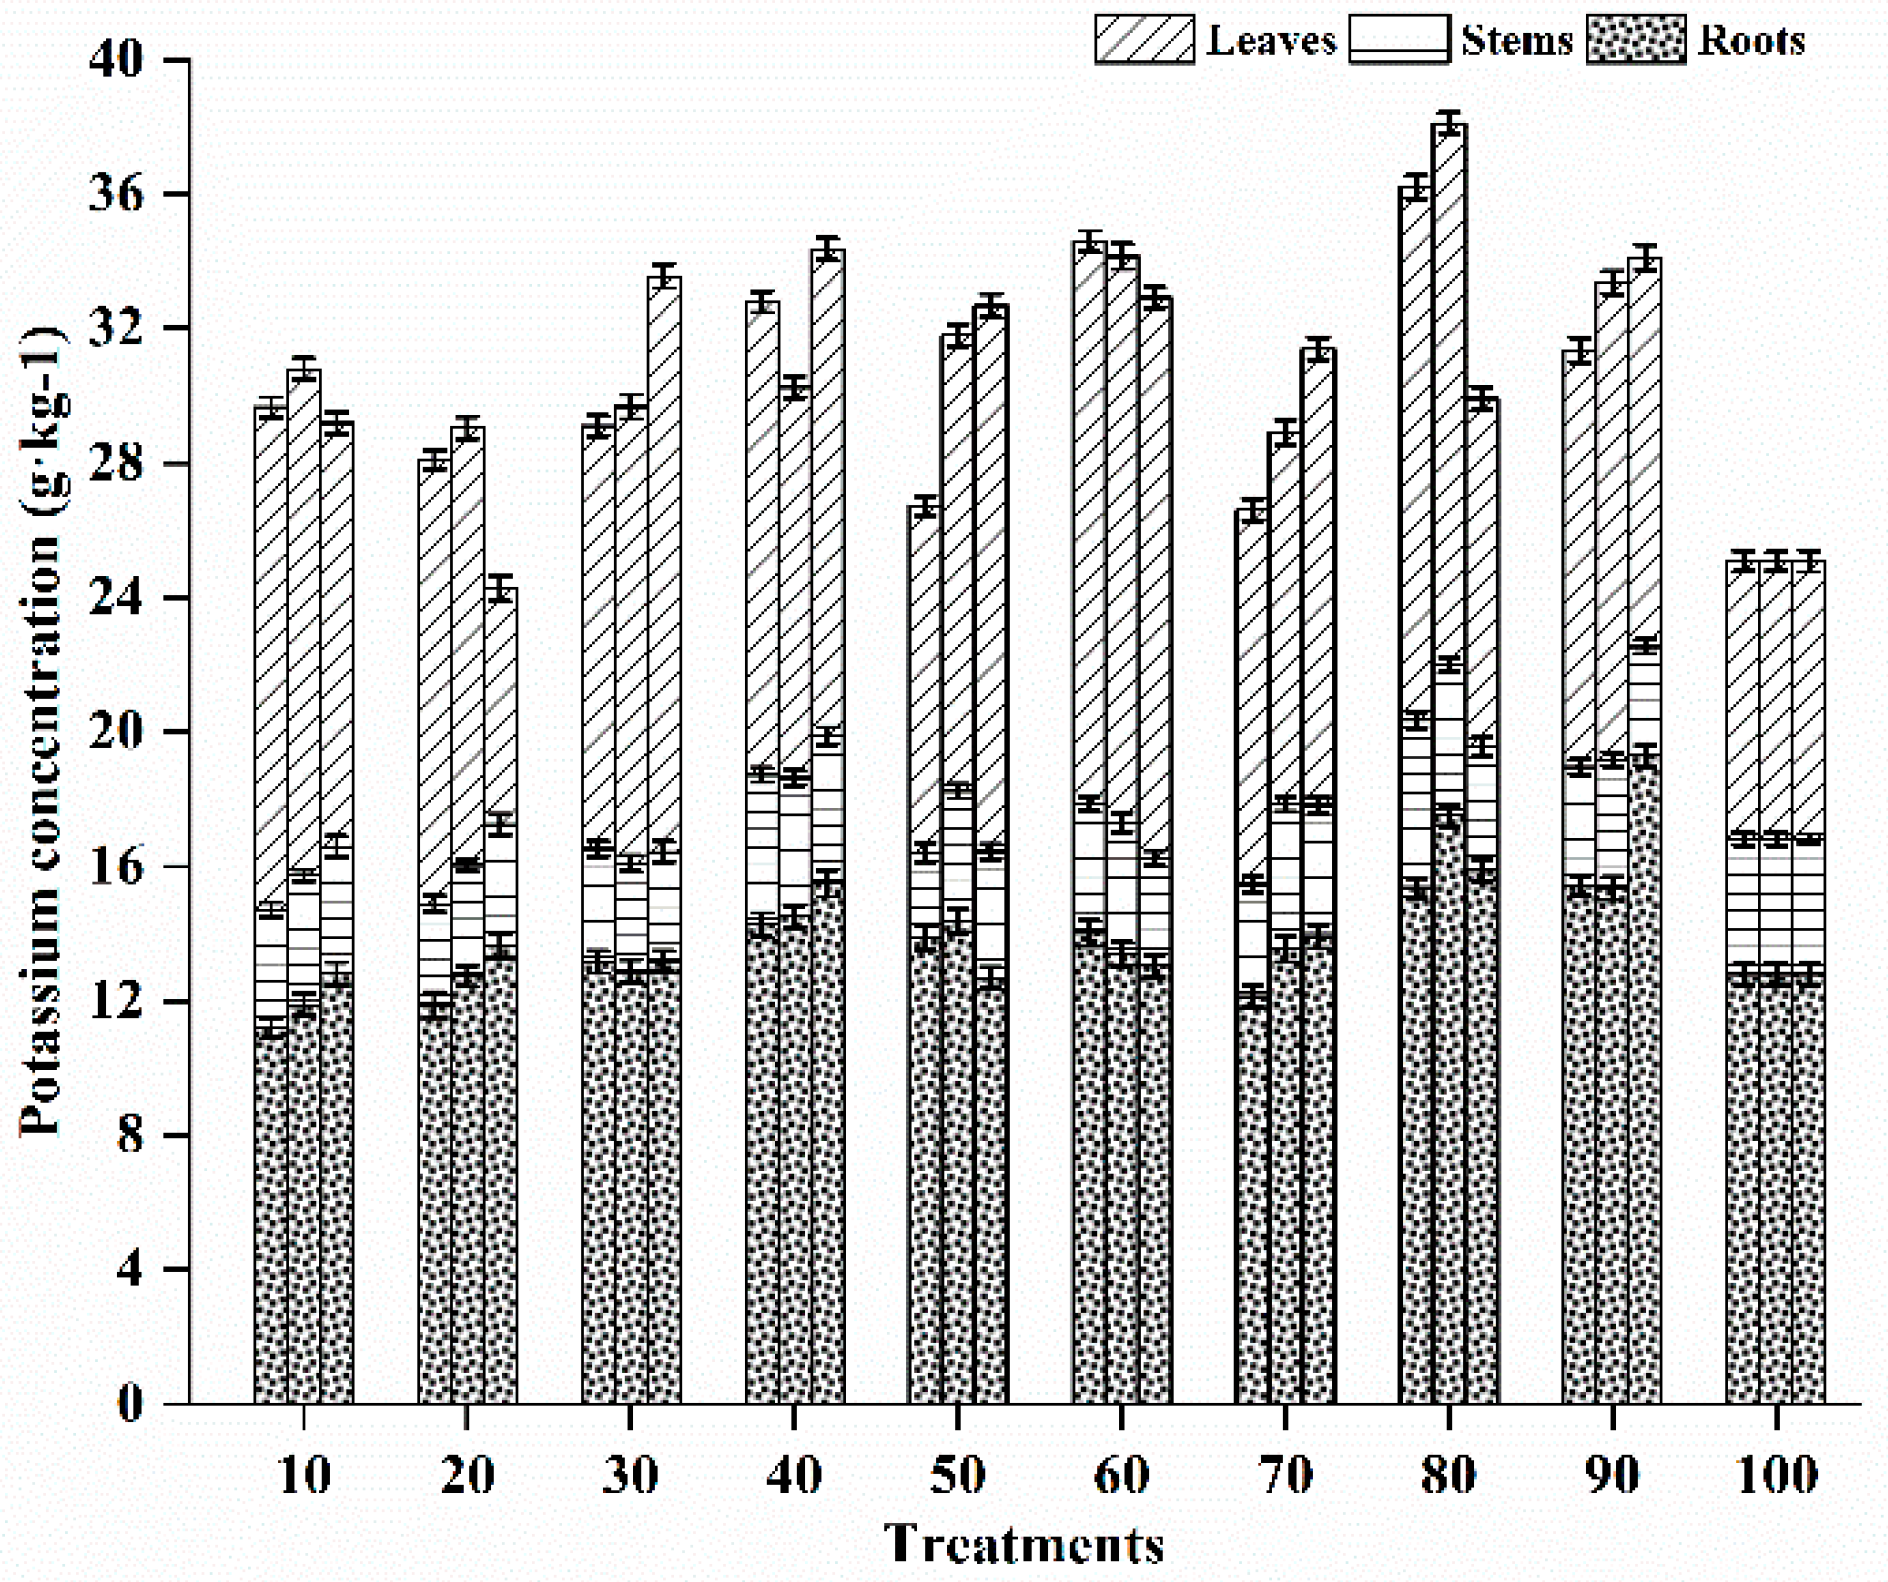
3.5.3. Potassium Status in Different Vegetative Tissues

Overall, K absorption in plants could be promoted through fertilization (Figure 8). The highest content of K in the leaf. K deficiency associated with increase in dry mass, K content, and K concentration was mainly observed in leaf (Figure 8). In contrast, marked dilution of K associated with increase in growth and K content but declining K concentration was mainly observed in both root and stem (Figure 8). In the treatments with four, six, and eight fertilizer applications, except in the A3B1C3 (26.606 g kg−1), A2B2C3 (26.711 g kg−1) and A1B2C2 (28.091 g kg−1) treatments with four fertilizer applications and the A1B2C2 (24.263 g kg−1) treatment with 8 fertilizer applications, the K concentration was significantly higher than that in the CK (25.073 g kg−1), by 6.1%–44.4%, 15.3%–52.0%, and 16.4%–37.0%, respectively. Figure 9 shows that the K concentration in the roots and leaves was high overall, accounting for the highest proportion in a single plant, and the K concentration in stems was the lowest. The K concentration in roots in the treatments with four, six, and eight fertilizer applications was 37.7%–51.9%, 38.6%–48.0%, and 38.8%–56.6%, respectively. Except in the A2B2C3 (51.9%) treatment with four fertilizer applications; and the A3B3C2 (56.6%), A1B2C2 (56.2%), and A3B2C1 (53.1%) treatments with eight fertilizer applications, the K concentration was lower than that in the CK (51.0%). K concentration in stems was 9.5%–13.7%, 10.8%–14.9% and 9.5%–14.9%, respectively, and was lower than that in the CK (16.1%) in all treatments. K concentration in leaves was 38.6%–50.4%, 38.2%–49.3%, and 28.9%–51.0%, respectively. Except in the A1B2C2 (28.9%) treatment with eight fertilizer applications, the K concentration was higher than that in the CK (32.9%). In summary, after fertilization, K concentration in roots and leaves was high, with a similar proportion in whole plants. However, K concentration in roots was significantly lower than that in the CK, and the proportion of K in leaves significantly increased, while that in stems was decreased; therefore, fertilization mainly increased the K concentration in leaves.

3.6. Effects of Different Fertilization Ratios and Frequencies on Nutrient Transport Efficiency

Nutrient transport efficiency reflects a plant’s absorption of nutrients in the soil, so it can be used to determine the effect of fertilization. The effects of different fertilization ratios and frequencies on nutrient transport efficiency are shown in Table 11. In the treatment with the three fertilization frequencies, except in the A1B3C3 treatment with four fertilizer applications, the A1B2C2 treatment with six fertilizer applications, and the A1B3C3 and A2B3C1 treatments with eight fertilizer applications, the N transport efficiency was higher than that in the CK. The highest transport efficiencies were in the A2B3C1, A2B2C3, and A2B1C2 treatments with four, six, and eight fertilizer applications, respectively, which were 19.4, 22.0, and 30.6% higher than that in the CK. With respect to the transport efficiency of P, only that in the A1B3C3, A2B1C2, and A2B2C3 treatments was greater than or equal to that in the CK with four fertilizer applications; however, in the treatments with six fertilizer applications, except in the A3B3C2, A2B2C3, and A3B2C1 treatments, the transport efficiency of P was higher than that in the CK, indicating this fertilization frequency significantly increased the efficiency of P transport. The highest P transport efficiency among the treatments with six fertilizer applications was in the A1B2C2 treatment and was 24.4% higher than that in the CK. The P transport efficiency in the treatments with eight fertilizer applications, by contrast, decreased; thus, only the P transport efficiency in the A1B3C3, A1B2C2, and A2B1C2 treatments was higher than that in the CK. The K transport efficiency in the treatments with different fertilization frequencies, except in the A1B2C2 treatment with eight fertilizer applications, increased. The highest K transport efficiency in the treatments with four, six, and eight fertilizer applications occurred in A3B2C1, A3B2C1, and A2B1C2, respectively, and were 50.3, 54.2, and 38.6% higher than that in the CK. In summary, only under proper NPK ratios could the nutrient transport efficiency be improved; otherwise, it was repressed. Under these three kinds of fertilization frequencies, P transport efficiency was negatively correlated with N and K transport efficiencies, particularly between N and P transport efficiencies. From the perspective of fertilization frequency, the increased efficiency and stability of the transport efficiency of various nutrients were greater in the treatments with six fertilizer applications than in those with four and eight fertilizer applications.

3.7. Effects of Different Fertilization Ratios and Frequencies on Nutrient Uptake Efficiency

Different fertilization ratios and frequencies can significantly affect nutrient uptake efficiency (Table 12). Under fertilization frequencies of four, six, and eight fertilizer applications, the highest nutrient uptake rates of N were in the A2B3C1 (83.7%), A2B2C3 (95.4%), and A2B1C2 (136.9%) treatments, respectively; the highest nutrient uptake rates of P were in the A1B3C3 (26.5%), A1B3C3 (78.9%), and A1B3C3 (49.2%) treatments; and the highest nutrient uptake rates of K were in the A2B3C1 (59.5%), A1B1C1 (71.5%), and A2B1C2 (58.0%) treatments. In the treatments with four and eight fertilizer applications, when the K uptake rate was at the highest level, the N uptake rate was at the highest level, too, while when the P uptake rate was at the highest level, inversely, the N uptake rate was at the lowest level. Overall, the P uptake rate was low relative to those of N and K in the treatments with four fertilizer applications, the P uptake rate only increased in the A1B3C3 (26.5%) and A2B1C2 (3.8%) treatments; and in the treatments with eight fertilizer applications, it only increased in the A1B3C3 (49.2%), A1B2C2 (36.7%), and A2B1C2 (15.4%) treatments. From the aspect of fertilization frequency, the N, P, and K uptake rates were higher in the treatments with six fertilizer applications than in those with four and eight fertilizer applications.

3.8. Effects of Different Fertilization Ratios and Frequencies on Soil Nutrient Contents

Table 13 shows the effects of different NPK ratios and fertilization frequencies on soil nutrient contents. Under fertilization frequencies of four, six, and eight fertilizer applications, the treatments in which the soil N content was significantly higher than that in CK were in the minority, including the A3B2C1 treatment with four fertilizer applications and the A1B2C2 treatment with six and eight fertilizer applications, whose values were 13.0, 63.5, and 72.9% higher than that in the CK, respectively. Among the three fertilization frequencies, the soil P content in the A2B3C1 treatment was the lowest, while the highest value was in the A1B3C3, A2B2C3, and A2B1C2 treatments, at 78.9, 80.9, and 80.7% higher than that in the CK, respectively. Although the K content in the soil in the A2B3C1 treatment was the lowest, the difference from that in the CK was smaller than between the other treatments and the CK. In the treatments with four and eight fertilizer applications, there was no significant difference in K content from that in the CK. Additionally, in the treatments with six fertilizer applications, except in the A2B2C3, A2B3C1, A3B1C3, and A3B2C1 treatments, the K content was not significantly different from that in the CK. Moreover, the soil nutrient contents in the treatments with six fertilizer applications were comparatively low under the same NPK ratios.

3.9. Comprehensive Analysis

The seedling quality index (QI) is a quantitative standard for evaluating seedlings through seedling height, root collar diameter, and dry weight and can intuitively reflect the growth status of seedlings. In general, the higher the QI, the better the seedling quality. Table 14 shows the seedling QI in each treatment in this study. In the treatments with four fertilizer applications, the top three treatments in terms of QI were A3B1C3, A3B3C2, and A3B2C1; in the treatments with six fertilizer applications, the top three treatments in terms of QI were A2B3C1, A3B3C2, and A3B2C1; and in the treatments with eight fertilizer applications, the top three treatments in terms of QI were A2B2C3, A2B3C1, and A3B2C1. Under the three fertilization frequencies, the top treatment in terms of QI was always A3B2C1, indicating that seedling growth was relatively stable under this NPK ratio.
As the indexes measured in this study were too great and the change rules of these indexes were not very consistent under different NPK ratios and fertilization frequencies, a comprehensive analysis of the measured indexes was performed using the principal component analysis method, which is a statistical analysis method that divides the plurality original variables into a few comprehensive indicators, replacing the original variables with fewer new variables by utilizing the correlation between original variables. Moreover, as the information reflected from the original variables was retained in these few new variables as much as possible, the complexity of the resulting variables decreased.
The data were integrated, all treatments in this experiment were renumbered, and a total of 27 fertilization treatments were obtained. According to the results of the principal component analysis, the KMO (Kaiser-Meyer-Olkin) test value was 0.362, and the Bartlett spherical test result was significance <0.01, so the eigenvalue analysis could be further performed. As a result, the six principal components with eigenvalues greater than 1 were retained. As these six principal components concentrated 85.977% of the original variable, the final results could be exactly reflected according to the scores of these six principal components. Table A1 shows the final score formula for each principal component. According to the rankings and final scores of the principal components in Table A2, the three treatments numbered 18, 25, and 17 had higher comprehensive scores, namely, the A3B3C2 treatment with six fertilizer applications, the A3B1C3 treatment with eight fertilizer applications, and the A3B2C1 treatment with six fertilizer applications. Among these treatments, the A3B3C2 treatment with six fertilizer applications had the highest scores; this treatment included six fertilizer applications in the growing season of 480 mg N per seedling, 320 mg P per seedling and 160 mg K per seedling, and the NPK ratio was 3:2:1. This result agreed with the result of the seedling QI previously calculated: the three treatments with six fertilizer applications with the highest QI ranking were A2B3C1, A3B3C2, and A3B2C1, and the results of the composite score also fell within this range. Therefore, the more suitable fertilization method for M. wufengensis seedlings was six fertilizer applications in the growing season of 480 mg N plant−1, 320 mg P plant−1, and 160 mg K plant−1.

4. Discussion

4.1. Fertilization Promotes Plant Growth

Different NPK fertilization ratios promoted high and root collar diameter growth of M. wufengensis seedlings (Table 2 and Table 3, Figure 1 and Figure 2), and the biomass of M. wufengensis seedlings also increased (Table 7, Table 8, Table 9 and Table 10), which was consistent with the effects of fertilization on other tree species in previous studies [41,42]. However, through fertilization, height and root collar diameter growth of M. wufengensis seedlings showed opposite trends: the height growth first increased and then decreased, and the maximum height growth in all treatments appeared in the middle of fertilization; in contrast, root collar diameter growth first decreased and then increased. This difference may be caused by the growth characteristics of M. wufengensis because forest trees while adapting to the nutrient environment show obvious reaction characteristics [43], such as changing their own growth rate, regulating the above-ground biomass distribution [44], and increasing root absorption area. Under fertilization, M. wufengensis seedlings accelerated height growth in the early stage because of the initial sufficient nutrient supply. With the extension of the growing season, M. wufengensis height growth gradually slowed and became a dormant state to adapt to the imminent cold environment. At the same time, the nutrients in leaves gradually return to the stems, resulting in an accelerating root collar diameter growth. However, the height growth in the CK decreased, while, the root collar diameter was basically unchanged, which may be because the CK did not receive fertilizer. Due to insufficient nutrients in the soil, the plants could not generate enough nutrients during the growth period, limiting growth, which intuitively reflects the importance of fertilization.
The whole biomass of M. wufengensis seedlings significantly increased by fertilization (Table 10), and the biomass pattern was generally root > stem > leaf (Table 7, Table 8 and Table 9). This result may be because the root is the most important organ for plants to absorb water and nutrients from soil, as well as a dynamic interface between plants and soil [45], making it the basis for plant growth. In addition, the test materials were the M. wufengensis seedlings sowed the year, so the root biomass was the highest. However, fertilization decreased the proportion of root biomass to whole plant biomass, increased the proportion of stem biomass to whole plant biomass, and had a smaller impact on the proportion of leaf biomass to whole plant biomass, which was consistent with many studies. Such as in Betula platyphylla, it was found that trees grew faster under high N conditions than under low N conditions, and trees under high N conditions had a higher total biomass and lower root/shoot biomass proportions [46]. It has also been found that the ratio of aboveground/underground biomass of Picea asperata seedlings under normal P supply was twice that under P deficiency, and almost no new stem grew under P deficiency [47]. This may be due to resource tropism of roots [48], and when some elements in the soil are deficient, the plant will allocate a higher proportion of biomass to the tissues where these elements can be obtained, thus maximizing the ability to obtain the resources that are most severely limiting plant growth [49]. Meanwhile, insufficient nutrients in soil will stimulate root growth and increase root biomass [50]. Under fertilization, trees will allocate more biomass to aerial tissues because of the sufficient nutrient contents in soil [51], and plants do not have to keep extending the root system to maximize the ability to obtain the resources that are limiting their growth. Under such conditions, the function of roots was mainly to transport the nutrients in soil to the aerial tissues of the plant, thereby promoting aboveground growth and slowing down root growth. Therefore, fertilization decreases the proportion of root biomass to whole plant biomass and increases the stem biomass proportion.

4.2. Effects of Fertilization on the Chlorophyll Content in Magnolia wufengensis

Chlorophyll is the main pigment that determines the concentration of plant leaf color, and it is also a significant indicator for environmental quality evaluation [52]. As chlorophyll is the foundation of photosynthesis, the chlorophyll concentration in leaves will directly affect the amount of solar energy absorbed by plants. Therefore, a low chlorophyll concentration will decrease photosynthesis and limit the primary productivity of leaves [53], inhibiting plant growth. In addition, chlorophyll is composed of a mass of N elements; thus, the plant nutritional status can be directly reflected through chlorophyll content measurement [54]. Pigment content is directly correlated with physiological stress: in plants undergoing senescence or suffering physiological stress, the chlorophyll concentration will decrease, and the carotenoid content will inversely increase [55]. Therefore, the determination of chlorophyll content can directly provide important information on the relationship between plants and the environment, which has great significance for the global diagnosis of plant nutrition and growth. We found that at the beginning of growth (July), there was no significant difference in chlorophyll content between treatments and the CK (Figure 3), possibly due to the relatively low growth rate in the early growth stage given that the soil nutrients could satisfy seedling growth. Furthermore, under a short fertilization time, nutrients might not be completely absorbed by the plants. With the extension of the growing season, the chlorophyll content differences between each treatment and the CK became increasingly significant (Figure 3) due to the important influence of N, P, and K on plant chlorophyll content. First, N is an essential component of chlorophyll [56]. Second, P can promote chlorophyll synthesis by maintaining the ATP and NADPH contents in leaves [57]. Moreover, K+, the most abundant metal element in chloroplasts, is an essential element for maintaining the normal structure of chloroplasts. K+ can also increase plant photosynthetic efficiency by promoting chlorophyll synthesis and strengthening chloroplast structure [58]. Therefore, the application of N, P, and K fertilizers could promote chlorophyll synthesis. At the same time, plant growth reduced the nutrient content in the soil of the CK, inhibiting chlorophyll synthesis. The inconsistent variation in chlorophyll content in each treatment may have been caused by the different fertilization ratios and frequencies. The effects of fertilizer amount on photosynthesis and chlorophyll content have a threshold value; if this value is exceeded, plant growth will be inhibited [59,60], which indicates the significance of a reasonable fertilization ratio for plant growth.

4.3. Effects of Fertilization on Nutrient Status in Magnolia wufengensis

The growth and development of plants are the processes of cell division and differentiation, which are accompanied by nutrient absorption and distribution throughout the life cycle. Although fertilization promoted NPK accumulation in M. wufengensis seedlings, but the NPK status in different tissues of plants is different. It can be seen from Figure 4, Figure 6 and Figure 8 that under different fertilization treatments, N is deficiency for roots, P is deficiency for stems, and K is deficiency for leaves. In terms of the NPK concentration in various organs of M. wufengensis, fertilization increased the proportions of N in roots, P in stems, and K in leaves (Figure 5, Figure 7 and Figure 9). Under the dynamic balancing principle, the elements in various tissues of plants are kept in relatively constant proportions, but plants will also constantly adjust their nutrient distribution and adapt to changes in the growth pattern during various developmental periods [61]. Plants themselves have a structural effect in that different tissues have their own specific functions, growth, and turnover rates, and life cycle strategies, resulting in different uptakes of nutrient elements in plant tissues [62]. As the soil nutrient supply changes, plants will respond to external environmental changes and pressure through different growth characteristics and substance distribution patterns. The elements among tissues will be redistributed, eventually resulting in diverse responses in various tissues with different changing nutrient conditions [63]. In this study, because of the relatively high N application in soil, resulting in plants grow rapidly. However, the growth rate was much higher than nutrient uptake rate, which may result in dilution of N in stems and leaves. At the same time, the root system is the main tissues for plant nutrient absorption [48], which continuously absorbs N from the soil in order to meet the growth needs. Therefore, N is deficiency for roots and the concentration of N in roots increased; under fertilization conditions, height growth in M. wufengensis seedlings was accelerated because of sufficient nutrient supply (Figure 1 and Figure 2). Generally, rapid plant growth was always accompanied by high protein production, while biological protein synthesis requires a large amount of ribosome support. Serving as an important component of the nucleus and nucleic acids, P is largely demanded during rapid plant growth [64], which promotes P absorption and accumulation in the stem. Therefore, fertilization increased the concentration of P in the stem; K is not involved in any substance formation during plant growth and it mainly regulates plant growth and development by participating in physiological and biochemical processes. The most important function of K is to regulate plant photosynthesis [65], and it is preferentially distributed in tissues and organs in which metabolic activities are most active [66]. Moreover, previous studies have shown that leaves are the most active tissues in plant physiology and metabolism [67]. In this study, fertilization accelerated M. wufengensis seedling growth and enhanced photosynthesis and physiological metabolism in the leaves, resulting in a large demand for K, which increased the concentration of K in leaves. Simultaneously, due to the rapid growth of plants, P are constantly required by stems, and K are constantly required by leaves, so P is deficiency for stems and K is deficiency for leaves. Marked dilution of P in roots and leaves and K in roots and stem, probably because plants normally adjust to current nutrient supply and often dilute their nutrient reserves before attaining equilibrium between nutrient supply and growth [68].

4.4. Effects of Fertilization on Nutrient Uptake and Transport Efficiency and Soil Nutrient Contents

The uptake and transport efficiency of nutrients and the soil nutrient contents reflect the absorption of nutrients in soil by plants, which can be used to determine the rationality of fertilization. Table 8, Table 9 and Table 10 show that fertilization improved the transport efficiency and uptake of N and K, except under several fertilizer ratios. However, the transport efficiency and uptake of P were relatively low, and the P content in soil was relatively high after fertilization, which may be due to its differences from N fertilizer and K fertilizer. After being applied to soil, a large amount of P accumulates in the soil profile. The P uptake rate can only be 10% to 25%, and the remaining 75% to 90% accumulate in soil as phosphate, such as Ca-P, Fe-P, and Mg-P [69]. Meanwhile, there was a positive correlation between the uptake of N and K because K could greatly increase N absorption and uptake, promoting its conversion to protein [65]. Moreover, much protein synthesis in plant cells relies on K+ [70], and K+ also plays an important role in strengthening protein stability [71]. The nutrient content in the soil was not significantly different from that in the CK and was even lower than that in the CK after fertilization, indicating that balanced fertilization promoted nutrient absorption in plants. Compared with a fertilization frequency of four and eight fertilizer applications, that of six fertilizer applications significantly increased P transport efficiency; increased N, P, and K uptake; and decreased the nutrient content in soil, indicating that this fertilization frequency is the most suitable for M. wufengensis seedlings in improving nutrient absorption from soil. Randall and Vetsch (2005) [33] obtained similar results, but the specific reasons still require further exploration.

5. Conclusions

This study shows that fertilization is an important management measure for tree cultivation. Fertilization promotes the growth of M. wufengensis seedlings, improves various growth indicators, and promotes nutrient accumulation in plants. At the same time, the optimum fertilization amount, ratio, and frequencies for one-year-old M. wufengensis growth in cinnamon soil were determined. A set of fertilization parameters was finally established: 6 fertilizer applications in the growing season of 480 mg N per seedling, 320 mg P per seedling, and 160 mg K per seedling and an NPK ratio of 3:2:1. In addition, a special fertilizer NPK ratio for one-year-old M. wufengensis seedlings was also preliminarily identified that could be directly used in pot cultivation according to this study. However, this experiment only evaluated the effect of fertilization on seedlings in cinnamon soil. The effect of this fertilization parameter on seedlings in other soil types needs further verification. If applied to the field, the NPK ratio should be recalculated considering the degree of soil erosion. As this study was mainly conducted in pots, field verification tests should be continued to obtain a better basis for actual large-scale production.

Author Contributions

Conceptualization, S.D. and K.S.; methodology, J.M.; software, S.D., J.M. and K.S.; validation, S.D., Z.J. and L.M.; formal analysis, L.Z.; investigation, S.D., J.M. and K.S.; resources, L.M.; data curation, S.D., J.M. and K.S.; writing—original draft preparation, S.D., L.Z. and K.S.; writing—review and editing, S.D., Z.J. and L.Z.; visualization, S.D.; supervision, Z.J. and L.M.; project administration, Z.J.; funding acquisition, L.M.

Funding

This research was financially supported by the Special Fund for Forest Scientific Research in the Public Welfare under grant no. 201504704.

Acknowledgments

We are thankful to Wufeng Bo Ling Magnolia wufengensis Technology Development Co., Ltd for providing Magnolia wufengensis seedlings. We are thankful to Special Fund for Forest Scientific Research in the Public Welfare under grant no. 201504704 for providing funds.

Conflicts of Interest

The authors declare no conflict of interest.

Appendix A

Table A1. Final score formula for the six principal components
Principal ComponentsScore Formula
1Y = 0.229X1 + 0.226X2 + 0.273X3 + 0.311X4 + 0.300X5 + 0.320X6 + 0.183X7 − 0.264X8 + 0.175X9 + 0.183X10 − 0.264X11 + 0.175X12 + 0.104X13 − 0.231X14 − 0.150X15 − 0.060X16 − 0.097X17 − 0.145X18 − 0.019X19 + 0.282X20 + 0.252X21
2Y = − 0.017X1 + 0.086X2 + 0.233X3 + 0.134X4 + 0.196X5 + 0.215X6 − 0.326X7 + 0.256X8 + 0.147X9 − 0.325X10 + 0.256X11 + 0.146X12 − 0.432X13 − 0.329X14 − 0.174X15 − 0.153X16 + 0.144X17 − 0.033X18 + 0.056X19 + 0.166X20 + 0.221X21
3Y = 0.039X1 − 0.086X2 − 0.138X3 + 0.019X4 − 0.073X5 − 0.084X6 + 0.301X7 + 0.153X8 + 0.386X9 + 0.301X10 + 0.153X11 + 0.386X12 − 0.240X13 + 0.099X14 − 0.350X15 − 0.382X16 + 0.262X17 − 0.067X18 + 0.133X19 − 0.027X20 − 0.077X21
4Y = − 0.276X1 − 0.109X2 + 0.158X3 − 0.105X4 − 0.105X5 + 0.026X6 − 0.036X7 − 0.093X8 + 0.309X9 − 0.036X10 − 0.093X11 + 0.310X12 − 0.004X13 − 0.028X14 + 0.226X15 + 0.353X16 − 0.474X17 + 0.375X18 + 0.330X19 + 0.038X20 + 0.036X21
5Y = − 0.137X1 + 0.192X2 + 0.097X3 + 0.018X4 − 0.042X5 + 0.049X6 + 0.263X7 + 0.292X8 − 0.195X9 + 0.264X10 + 0.293X11 − 0.195X12 + 0.148X13 + 0.264X14 − 0.352X15 + 0.113X16 − 0.019X17 + 0.049X18 + 0.500X19 + 0.217X20 + 0.130X21
6Y = − 0.530X1 − 0.189X2 + 0.150X3 + 0.315X4 − 0.083X5 + 0.171X6 − 0.031X7 + 0.047X8 + 0.017X9 − 0.031X10 + 0.047X11 + 0.017X12 − 0.027X13 + 0.027X14 − 0.178X15 + 0.029X16 + 0.130X17 + 0.499X18 + 0.132X19 − 0.135X20 − 0.428X21
Table A2. Comprehensive score for each seedling treatment
FrequenciesTreatmentsNumberingF1RankingF2RankingF3RankingF4RankingF5RankingF6RankingFRanking
4 ApplicationsA1B1C1135.1259.32415.715−0.273.91331.42595.225
A1B2C2232.7268.62715.1211.045.1327.22689.827
A1B3C3336.12311.31514.623−1.5113.81432.32296.523
A2B1C2442.81411.21617.46−5.3261.22743.24110.613
A2B2C3536.4219.42314.722−1.3105.8131.52496.524
A2B3C1643.71013.11017.73−0.254.11136.017114.39
A3B1C3745.0813.5913.326−4.9254.5740.610112.011
A3B2C1845.2715.2416.791.423.81538.513120.84
A3B3C2947.2414.4515.220−4.7242.62142.95117.76
6 ApplicationsA1B1C11037.5199.12517.28−3.5151.62638.414100.319
A1B2C21137.81812.81113.825−2.1133.71634.619100.518
A1B3C31235.42411.11715.318−0.984.11232.32197.420
A2B1C21343.21210.91916.510−6.1272.42343.23110.214
A2B2C31440.9169.72117.54−3.9192.81938.712105.717
A2B3C11544.7 913.8717.37−1.094.5636.016115.57
A3B1C31642.41511.31415.716−4.1214.4938.811108.515
A3B2C11747.4314.3618.82−1.8122.52241.07122.33
A3B3C21851.1115.9215.913−4.4222.91746.21127.61
8 ApplicationsA1B1C11937.1208.72616.112−3.8182.32436.41596.722
A1B2C22036.2229.62212.927−4.1205.4234.22094.226
A1B3C32132.62712.81316.2114.614.8425.82796.721
A2B1C22243.61110.22019.31−4.4232.22542.86113.710
A2B2C32343.11313.5815.914−0.264.5834.818111.712
A2B3C12446.3515.3315.517−2.8142.72041.08118.15
A3B1C32548.5216.1114.424−3.6172.91845.02123.32
A3B2C12645.3612.81215.319−3.6164.21040.69114.68
A3B3C22739.51711.11817.551.434.8531.923106.116

References

  1. Ma, L.; Luorong, W.; He, S.; Liu, X.; Wang, X. A new species of magnolia (magnoliaceae) from Hubei, China. Bull. Bot. Res. 2006, 26, 4–7. [Google Scholar]
  2. Sang, Z. Diversity Analysis of the Floral Traits and Study on the Drought Resistance of magnolia wufengensis. Ph.D. Thesis, Beijing Forestry University, Beijing, China, 2011. [Google Scholar]
  3. Ma, L.; Luorong, W.; He, S.; Liu, X.; Wang, X. A new variety of magnolia (magnoliaceae) from Hubei, China. Bull. Bot. Res. 2006, 26, 516–519. [Google Scholar]
  4. Pennazio, S. Mineral nutrition of plants: A short history of plant physiology. Riv. Biol. 2005, 98, 215–236. [Google Scholar] [PubMed]
  5. Marschner, P. Marschner’s Mineral Nutrition of Higher Plants; Academic Press: New York, NY, USA, 2011; Volume 24. [Google Scholar]
  6. Elser, J.J.; Bracken, M.E.; Cleland, E.E.; Gruner, D.S.; Harpole, W.S.; Hillebrand, H.; Ngai, J.T.; Seabloom, E.W.; Shurin, J.B.; Smith, J.E. Global analysis of nitrogen and phosphorus limitation of primary producers in freshwater, marine and terrestrial ecosystems. Ecol. Lett. 2007, 10, 1135–1142. [Google Scholar] [CrossRef] [PubMed] [Green Version]
  7. Aerts, R.; Chapin, F.S. The mineral nutrition of wild plants revisited: A re-evaluation of processes and patterns. In Advances in Ecological Research; Fitter, A.H., Raffaelli, D.G., Eds.; Academic Press: New York, NY, USA, 1999; Volume 30, pp. 1–67. [Google Scholar]
  8. Luo, J.; Qin, J.; He, F.; Li, H.; Liu, T.; Polle, A.; Peng, C.; Luo, Z.B. Net fluxes of ammonium and nitrate in association with h+ fluxes in fine roots of populus popularis. Planta 2013, 237, 919–931. [Google Scholar] [CrossRef] [PubMed]
  9. Güsewell, S. N:P ratios in terrestrial plants: Variation and functional significance. New Phytol. 2004, 164, 243–266. [Google Scholar] [CrossRef]
  10. Zhang, S.; Jiang, H.; Zhao, H.; Korpelainen, H.; Li, C. Sexually different physiological responses of Populus cathayana to nitrogen and phosphorus deficiencies. Tree Physiol. 2014, 34, 343–354. [Google Scholar] [CrossRef]
  11. Marschner, H. Mineral nutrition of higher plants. J. Ecol. 1995, 76, 1250. [Google Scholar]
  12. Gan, H.; Jiao, Y.; Jia, J.; Wang, X.; Li, H.; Shi, W.; Peng, C.; Polle, A.; Luo, Z.B. Phosphorus and nitrogen physiology of two contrasting poplar genotypes when exposed to phosphorus and/or nitrogen starvation. Tree Physiol. 2016, 36, 22–38. [Google Scholar] [CrossRef]
  13. Burman, U.; Garg, B.K.; Kathju, S. Effect of phosphorus application on clusterbean under different intensities of water stress. J. Plant Nutr. 2009, 32, 668–680. [Google Scholar] [CrossRef]
  14. Dos Santos, M.G.; Ribeiro, R.V.; de Oliveira, R.F.; Machado, E.C.; Pimentel, C. The role of inorganic phosphate on photosynthesis recovery of common bean after a mild water deficit. Plant Sci. 2006, 170, 659–664. [Google Scholar] [CrossRef]
  15. Cakmak, I. The role of potassium in alleviating detrimental effects of abiotic stresses in plants. J. Plant Nutr. Soil Sci. 2005, 168, 521–530. [Google Scholar] [CrossRef]
  16. Christina, M.; Le Maire, G.; Battie-Laclau, P.; Nouvellon, Y.; Bouillet, J.P.; Jourdan, C.; de Moraes Goncalves, J.L.; Laclau, J.P. Measured and modeled interactive effects of potassium deficiency and water deficit on gross primary productivity and light-use efficiency in Eucalyptus grandis plantations. Glob. Chang. Biol. 2015, 21, 2022–2039. [Google Scholar] [CrossRef] [PubMed]
  17. Armengaud, P.; Breitling, R.; Amtmann, A. The potassium-dependent transcriptome of arabidopsis reveals a prominent role of jasmonic acid in nutrient signaling. Plant Physiol. 2004, 136, 2556–2576. [Google Scholar] [CrossRef] [PubMed]
  18. Mengel, K.; Kirkby, E.A.; Kosegarten, H.; Appel, T. Principles of Plant Nutrition; International Potash Institute: Basel, Switzerland, 1982; pp. 639–655. [Google Scholar]
  19. Glass, A.D.M. Nitrogen use efficiency of crop plants: Physiological constraints upon nitrogen absorption. Crit. Rev. Plant Sci. 2003, 22, 453–470. [Google Scholar] [CrossRef]
  20. Raun, W.R.; Solie, J.B.; Johnson, G.V.; Stone, M.L.; Mullen, R.W.; Freeman, K.W.; Thomason, W.E.; Lukina, E.V. Improving nitrogen use efficiency in cereal grain production with optical sensing and variable rate application. Agron. J. 2002, 94, 815–820. [Google Scholar] [CrossRef]
  21. Bussi, C.; Amiot, M.J. Effects of nitrogen and potassium fertilization on the growth, yield and pitburn of apricot (cv. Bergeron). J. Hortic. Sci. Biotechnol. 1998, 73, 387–392. [Google Scholar] [CrossRef]
  22. Bussi, C.; Besset, J.; Girard, T. Effects of fertilizer rates and dates of application on apricot (cv bergeron) cropping and pitburn. Sci. Hortic. 2003, 98, 139–147. [Google Scholar] [CrossRef]
  23. Chu, H.; Lin, X.; Fujii, T.; Morimoto, S.; Yagi, K.; Hu, J.; Zhang, J. Soil microbial biomass, dehydrogenase activity, bacterial community structure in response to long-term fertilizer management. Soil Biol. Biochem. 2007, 39, 2971–2976. [Google Scholar] [CrossRef]
  24. Kanchikerimath, M.; Singh, D. Soil organic matter and biological properties after 26 years of maize–wheat–cowpea cropping as affected by manure and fertilization in a cambisol in semiarid region of india. Agric. Ecosyst. Environ. 2001, 86, 155–162. [Google Scholar] [CrossRef]
  25. Cai, Z.C.; Qin, S.W. Dynamics of crop yields and soil organic carbon in a long-term fertilization experiment in the huang-huai-hai plain of china. Geoderma 2006, 136, 708–715. [Google Scholar] [CrossRef]
  26. Osmond, D.L.; Riha, S.J. Nitrogen fertilizer requirements for maize produced in the tropics: A comparison of three computer-based recommendation systems. Agric. Syst. 1996, 50, 37–50. [Google Scholar] [CrossRef]
  27. Konde, N.M.; Kanase, N.M.; Jadhao, S.M.; Goud, V.V. Yield targetting equation for soybean with conjoint use of manure and chemical fertilizer based on fertility gradient approach. Ann. Plant Physiol. 2009, 23, 210–214. [Google Scholar]
  28. Abbasi, M.K.; Tahir, M.M.; Rahim, N. Effect of n fertilizer source and timing on yield and n use efficiency of rainfed maize (Zea mays L.) in kashmir–pakistan. Geoderma 2013, 195–196, 87–93. [Google Scholar] [CrossRef]
  29. Van Eekeren, N.; de Boer, H.; Hanegraaf, M.; Bokhorst, J.; Nierop, D.; Bloem, J.; Schouten, T.; de Goede, R.; Brussaard, L. Ecosystem services in grassland associated with biotic and abiotic soil parameters. Soil Biol. Biochem. 2010, 42, 1491–1504. [Google Scholar] [CrossRef]
  30. De Boer, H.C.; Deru, J.G.C.; Hoekstra, N.J.; van Eekeren, N. Strategic timing of nitrogen fertilization to increase root biomass and nitrogen-use efficiency of Lolium perenne L. Plant Soil 2016, 407, 81–90. [Google Scholar] [CrossRef]
  31. Raun, W.R.; Johnson, G.V. Improving nitrogen use efficiency for cereal production. Agron. J. 1999, 91, 357–363. [Google Scholar] [CrossRef]
  32. Ruiz Diaz, D.A.; Sawyer, J.E. Plant-available nitrogen from poultry manure as affected by time of application. Agron. J. 2008, 100, 1318. [Google Scholar] [CrossRef]
  33. Randall, G.W.; Vetsch, J.A. Corn production on a subsurface-drained mollisol as affected by fall versus spring application of nitrogen and nitrapyrin. Agron. J. 2005, 97, 472–478. [Google Scholar] [CrossRef]
  34. Rozas, H.R.S.; Echeverría, H.E.; Barbieri, P.A. Nitrogen balance as affected by application time and nitrogen fertilizer rate in irrigated no-tillage maize. Agron. J. 2004, 96, 1622. [Google Scholar] [CrossRef]
  35. Rozas, H.S.; Echeverría, H.; Andrade, F.; Studdert, G. Effect of urease inhibitor and fertilization time on nitrogen uptake and maize grain yield under no-tillage. Rev. Fac. Agron. La Plata 1997, 102, 129–136. [Google Scholar]
  36. Garrido-Lestache, E.; López-Bellido, R.J.; López-Bellido, L. Durum wheat quality under mediterranean conditions as affected by n rate, timing and splitting, n form and s fertilization. Eur. J. Agron. 2005, 23, 265–278. [Google Scholar] [CrossRef]
  37. Zebarth, B.; Leclerc, Y.; Moreau, G. Rate and timing of nitrogen fertilization of russet burbank potato: Nitrogen use efficiency. Can. J. Plant Sci. 2004, 84, 845–854. [Google Scholar] [CrossRef]
  38. Yang, L.; Pan, C.; Shao, S.; Tao, C.; Wang, W.; Ying, Y. Effects of pp_(333) and drought stress on the activity, photosynthetic characteristics, and non-structural carbohydrates of phyllostachys edulis seedlings. Acta Ecol. Sin. 2018, 39, 46–59. [Google Scholar]
  39. Haase, D.L.; Rose, R. Vector analysis and its use for interpreting plant nutrient shifts in response to silvicultural trea. For. Sci. 1995, 41, 54–66. [Google Scholar]
  40. Imo, M.; Timmer, V.R. Vector diagnosis of nutrient dynamics in mesquite seedlings. For. Sci. 1997, 43, 268–273. [Google Scholar]
  41. Chapin, F.S.; Vitousek, P.M.; Cleve, K.V. The nature of nutrient limitation in plant communities. Am. Nat. 1986, 127, 48–58. [Google Scholar] [CrossRef]
  42. Li, J.; Guo, Q.; Zhang, J.; Korpelainen, H.; Li, C. Effects of nitrogen and phosphorus supply on growth and physiological traits of two Larix species. Environ. Exp. Bot. 2016, 130, 206–215. [Google Scholar] [CrossRef]
  43. Rothstein, D.E.; Zak, D.R.; Pregitzer, K.S.; Curtis, P.S. Kinetics of nitrogen uptake by Populus tremuloides in relation to atmospheric co2 and soil nitrogen availability. Tree Physiol. 2000, 20, 265–270. [Google Scholar] [CrossRef]
  44. Ibrahim, L.; Proe, M.F.; Cameron, A.D. Interactive effects of nitrogen and water availabilities on gas exchange and whole-plant carbon allocation in poplar. Tree Physiol. 1998, 18, 481–487. [Google Scholar] [CrossRef]
  45. Gordon, W.S.; Jackson, R.B. Nutrient concentrations in fine roots. Ecology 2000, 81, 275–280. [Google Scholar] [CrossRef]
  46. Wang, J.R.; Hawkins, C.D.; Letchford, T. Relative growth rate and biomass allocation of paper birch (Betula pap). Can. J. For. Res. 1998, 28, 44–55. [Google Scholar] [CrossRef]
  47. Proe, M.F.; Millard, P. Effect of p supply upon seasonal growth and internal cycling of p in sitka spruce (Picea sitchensis (bong.)carr.) seedlings. Plant Soil 1995, 168/169, 313–317. [Google Scholar] [CrossRef]
  48. Deng, S.; Yin, Q.; Zhang, S.; Shi, K.; Jia, Z.; Ma, L. Drip irrigation affects the morphology and distribution of olive roots. HortScience 2017, 52, 1298–1306. [Google Scholar] [CrossRef]
  49. Klemens, J.A. Biomass allocation and growth of tropical dry forest tree seedlings across light and soil gradients. Ph.D. Thesis, University of Pennsylvania, Philadelphia, PA, USA, 2003. [Google Scholar]
  50. van der Werf, A.; Nagel, O.W. Carbon allocation to shoots and roots in relation to nitrogen supply is mediated by cytokinins and sucrose: Opinion. Plant Soil 1996, 185, 21–32. [Google Scholar] [CrossRef]
  51. Bekele, A.; Hudnall, W.H.; Tiarks, A.E. Response of densely stocked loblolly pine (Pinus taeda L.) to applied nitrogen and phosphorus. South. J. Appl. For. 2003, 27, 180–189. [Google Scholar]
  52. Coops, N.C.; Stone, C.; Culvenor, D.S.; Chisholm, L. Assessment of crown condition in eucalypt vegetation by remotely sensed optical indices. J. Environ. Qual. 2004, 33, 956. [Google Scholar] [CrossRef]
  53. Curran, P.J.; Dungan, J.L.; Gholz, H.L. Exploring the relationship between reflectance red edge and chlorophyll content in slash pine. Tree Physiol. 1991, 7, 33–48. [Google Scholar] [CrossRef]
  54. Moran, J.A.; Mitchell, A.K.; Goodmanson, G.; Stockburger, K.A. Differentiation among effects of nitrogen fertilization treatments on conifer seedlings by foliar reflectance: A comparison of methods. Tree Physiol. 2000, 20, 1113–1120. [Google Scholar] [CrossRef]
  55. Larcher, W. Physiological Plant Ecology; Springer-Verlag: Berlin, Germany, 1982; pp. 1217–1220. [Google Scholar]
  56. Duru, M. Evaluation of chlorophyll meter to assess nitrogen status of cocksfoot sward. J. Plant Nutr. 2002, 25, 275–286. [Google Scholar] [CrossRef]
  57. Rao, I.M.; Terry, N. Leaf phosphate status, photosynthesis, and carbon partitioning in sugar beet. Plant Physiol. 1989, 90, 814–819. [Google Scholar] [CrossRef] [PubMed]
  58. Liu, G. Effects of Balanced Fertilization on Mulberry Yield and Quality and Its Fertilization Model. Ph.D. Thesis, Southwest University, Chongqing, China, 2012. [Google Scholar]
  59. Machler, N. Influence of inorganic-phosphate on photosynthesis of wheat chloroplasts 1 photosynthesis and assimilate export at 5-degrees-c and 25-degrees-c. Biotechnol. Bioeng. 1984, 108, 481–487. [Google Scholar]
  60. Wu, C.; Wang, Z.; Sun, H.; Guo, S. Effects of different concentrations of nitrogen and phosphorus on chlorophyll biosynthesis, chlorophyll a fluorescence, and photosynthesis in Larix olgensis seedlings. Front. For. China 2006, 1, 170–175. [Google Scholar] [CrossRef]
  61. Wu, T.G.; Wu, M.; Liu, L.; Xiao, J.H.; He, J.S.; Han, X.G. Seasonal variations of leaf nitrogen and phosphorus stoichiometry of three herbaceous species in hangzhou bay coastal wetlands, China. Chin. J. Plant Ecol. 2010, 34, 23–28. [Google Scholar]
  62. Jackson, R.B.; Mooney, H.A.; Schulze, E.D. A global budget for fine root biomass, surface area, and nutrient contents. Proc. Natl. Acad. Sci. USA 1997, 94, 7362–7366. [Google Scholar] [CrossRef]
  63. Lovett Doust, J.; Lovett Doust, L. Plant reproductive ecology: Patterns and strategies. Evolution 1988, 93, 646–647. [Google Scholar]
  64. He, J.S.; Wang, L.; Flynn, D.F.; Wang, X.; Ma, W.; Fang, J. Leaf nitrogen:Phosphorus stoichiometry across chinese grassland biomes. Oecologia 2008, 155, 301–310. [Google Scholar] [CrossRef]
  65. Li, J. Functional Analysis of Potassium Channel Osaktl and Its Regulators in Rice k+ Uptake. Ph.D. Thesis, China Agricultural University, Guangzhou, China, 2014. [Google Scholar]
  66. Tester, M.; Leigh, R.A. Partitioning of nutrient transport processes in roots. J. Exp. Bot. 2001, 52, 445–457. [Google Scholar] [CrossRef]
  67. Güsewell, S. High nitrogen: Phosphorus ratios reduce nutrient retention and second-year growth of wetland sedges. New Phytol. 2005, 166, 537. [Google Scholar] [CrossRef]
  68. Ingestad, T.; Lund, A.B. Theory and techniques for steady state mineral nutrition and growth of plants. Scand. J. For. Res. 1986, 1, 439–453. [Google Scholar] [CrossRef]
  69. Suriyagoda, L.D.B.; Ryan, M.H.; Renton, M.; Lambers, H. Above- and below-ground interactions of grass and pasture legume species when grown together under drought and low phosphorus availability. Plant Soil 2011, 348, 281–297. [Google Scholar] [CrossRef]
  70. Evans, H.J.; Wildes, R.A. Potassium and its role in enzyme activation. In Proceedings of the 8th Colloquium of the International Potash Institute, Uppsala, Sweden, 14–17 June 1971. [Google Scholar]
  71. Wyn Jones, R.G.; Pollard, A. Proteins, enzymes and inorganic ions. Encycl. Plant Physiol. New 1983, 92, 528–562. [Google Scholar]
Figure 1. Dynamic changes in seedling height growth under different fertilization ratios and frequencies.
Forests 10 00065 g001
Figure 2. Dynamic changes in seedling root collar diameter growth under different fertilization ratios and frequencies.
Forests 10 00065 g002
Figure 3. Dynamic changes in the seedling chlorophyll content under different fertilization ratios and frequencies.
Forests 10 00065 g003
Figure 4. Vector diagram of relative changes in dry mass, N content, and N concentration at the end of the growing season after application of NPK fertilizer. Note that this vector diagram is based on the status of CK.
Forests 10 00065 g004
Figure 5. The nitrogen distribution in different vegetative tissues (Note: There are three linked bars: four fertilizer applications on the left, six fertilizer applications in the middle, and eight fertilizer applications on the right).
Forests 10 00065 g005
Figure 6. Vector diagram of relative changes in dry mass, P content, and P concentration at the end of the growing season after application of NPK fertilizer. Note that this vector diagram is based on the status of CK.
Forests 10 00065 g006
Figure 7. Phosphorus distribution in different vegetative tissues (Note: There are three linked bars: four fertilizer applications on the left, six fertilizer applications in the middle, and eight fertilizer applications on the right).
Forests 10 00065 g007
Figure 8. Vector diagram of relative changes in dry mass, K content, and K concentration at the end of the growing season after application of NPK fertilizer. Note that this vector diagram is based on the status of CK.
Forests 10 00065 g008
Figure 9. Potassium distribution in different vegetative tissues (Note: There are three linked bars: four fertilizer applications on the left, six fertilizer applications in the middle, and eight fertilizer applications on the right).
Forests 10 00065 g009
Table 1. Physical and chemical properties of cinnamon soil. BD for Bulk density; FC for field capacity; OM for organic matter; TN for total N; AP for available P; AK for available K; ST for soil texture.
BD
(g·cm−3)
FC
(%)
PHOM
(g·kg−1)
TN
(g·kg−1)
AP
(g·kg−1)
AK
(g·kg−1)
Sand
(%)
Silt
(%)
Clay
(%)
ST
1.6116.97.8619.230.370.474.0862.5136.890.60loam
Table 2. Fertilization treatments.
TreatmentN (mg·Plant−1)P (mg·Plant−1)K (mg·Plant−1)
A1B1C11608080
A1B2C2160160160
A1B3C3160320320
A2B1C232080160
A2B2C3320160320
A2B3C132032080
A3B1C348080320
A3B2C148016080
A3B3C2480320160
CK000
Table 3. The p values of the main effects of Fertilizer ratio (F), Application frequency (A), Time (T) and their interactions on seedling height, root collar diameter, and chlorophyll of M. wufengensis (Magnoliaceae) seedlings.
Source of VariationDegree of FreedomHeightRoot Collar DiameterChlorophyll
Fertilizer ratio (F)9<0.001<0.05<0.001
Application frequency (A)20.0870.058<0.001
Time (T)3<0.001<0.001<0.001
F × A18<0.05<0.05<0.001
F × T27<0.001<0.05<0.001
A × T60.9330.288<0.001
F × A × T540.9950.459<0.001
Table 4. Effects of different fertilization ratios and application frequencies on seedling height.
Treatments4 Applications6 Applications8 Applications
A1B1C148.10 ± 1.7985Bb61.22 ± 1.4316Abc58.52 ± 3.0447Aab
A1B2C241.36 ± 1.4511Bc52.12 ± 0.9281Ad52.82 ± 3.5309Abc
A1B3C350.34 ± 2.7899Ab49.70 ± 3.6003Ad37.26 ± 1.6238Bd
A2B1C268.42 ± 1.4302Aa67.60 ± 2.5977Aab66.84 ± 3.0336Aa
A2B2C347.98 ± 2.6299Bb61.40 ± 1.0569Abc52.44 ± 2.9115Bbc
A2B3C154.74 ± 1.7299Ab55.52 ± 2.2739Acd62.60 ± 3.6212Aa
A3B1C362.50 ± 1.1983Aa61.30 ± 2.5108Abc66.94 ± 2.4281Aa
A3B2C154.70 ± 2.0594Bb63.10 ± 1.1261Aab61.62 ± 2.7838Aa
A3B3C266.18 ± 3.4773Aa69.34 ± 2.4817Aa48.94 ± 1.3692Bc
CK34.24 ± 2.4667Ad34.24 ± 2.4667Ae34.24 ± 2.4667Ad
Note: Different small letters in different treatments indicate significant differences in different fertilization ratios; different capital letters indicate significant differences among different frequencies of the fertilization ratios (p = 0.05).
Table 5. Effects of different fertilization ratios and frequencies on root collar diameter.
Treatments4 Applications6 Applications8 Applications
A1B1C19.750 ± 0.3677Aa9.440 ± 0.4802Ab10.008 ± 0.5918Abc
A1B2C28.952 ± 0.6038Bab10.614 ± 0.2990Aab11.190 ± 0.6157Aab
A1B3C310.632 ± 0.7294Aa9.754 ± 0.7879Ab9.000 ± 0.5486Acd
A2B1C210.096 ± 0.6715Aa10.784 ± 0.4578Aab9.640 ± 0.4816Abc
A2B2C39.914 ± 0.5593Ba9.996 ± 0.3668Bab12.012 ± 0.8459Aa
A2B3C110.152 ± 0.7193Aa11.126 ± 0.5824Aab11.048 ± 0.6771Aab
A3B1C310.786 ± 0.4820Aa10.374 ± 0.6372Aab9.454 ± 0.2535Abcd
A3B2C110.744 ± 0.7254Aa11.672 ± 0.3132Aa10.980 ± 0.7005Aab
A3B3C210.518 ± 0.6523Aa11.138 ± 0.5604Aab10.768 ± 0.5180Aabc
CK7.674 ± 0.5501Ab7.674 ± 0.5501Ac7.674 ± 0.5501Ad
Note: Different small letters in different treatments indicate significant differences in different fertilization ratios; different capital letters indicate significant differences among different frequencies of the fertilization ratios (p = 0.05).
Table 6. The p values of the main effects of Fertilizer ratio (F), Application frequency (A) and their interactions on total biomass, root biomass, stem biomass and leaf biomass of M. wufengensis seedlings.
Source of VariationDegree of FreedomTotal BiomassRoot BiomassStem BiomassLeaf Biomass
Fertilizer ratio (F)9<0.001<0.001<0.001<0.001
Application frequency (A)20.7840.3220.1100.596
F × A18<0.050.167<0.050.333
Table 7. Effects of different fertilization ratios and frequencies on root biomass.
Treatments4 Applications6 Applications8 Applications
Root Biomass
(g·Plant−1)
Percentage of Total PlantsRoot Biomass
(g·Plant−1)
Percentage of Total PlantsRoot Biomass
(g·Plant−1)
Percentage of Total Plants
A1B1C19.79 ± 1.06Acde50.2%8.26 ± 0.66Acd44.0%7.95 ± 0.68Acd42.5%
A1B2C28.71 ± 0.30Ade47.3%11.38 ± 1.44Abc48.4%10.37 ± 1.16Abcd49.9%
A1B3C39.12 ± 0.94Ade44.4%9.68 ± 1.27Abcd47.5%11.57 ± 1.59Abc57.3%
A2B1C210.24 ± 0.81Abcde44.8%10.07 ± 1.73Abcd41.7%10.15 ± 0.58Abcd43.0%
A2B2C310.40 ± 2.03Abcde48.8%10.09 ± 1.03Abcd45.9%13.30 ± 1.01Aab48.3%
A2B3C112.46 ± 1.78Aabcd47.0%12.23 ± 1.64Abc44.1%13.89 ± 1.48Aab47.3%
A3B1C314.02 ± 1.53ABab48.6%11.64 ± 1.51Cbc47.8%17.04 ± 1.49Aa52.3%
A3B2C115.69 ± 1.07Aa52.3%13.05 ± 1.38Aab45.8%14.10 ± 1.48Aab49.9%
A3B3C213.48 ± 1.03Aabc45.3%16.33 ± 1.28Aa48.0%12.35 ± 1.82Ab55.0%
CK6.77 ± 0.79Ae54.2%6.77 ± 0.79Ad54.2%6.77 ± 0.79Ad54.2%
Note: Different small letters in different treatments indicate significant differences in different fertilization ratios; different capital letters indicate significant differences among different frequencies of the fertilization ratios (p = 0.05).
Table 8. Effects of different fertilization ratios and frequencies on stem biomass.
Treatments4 Applications6 Applications8 Applications
Stem Biomass
(g·Plant−1)
Percentage of Total PlantsStem Biomass
(g·Plant−1)
Percentage of Total PlantsStem Biomass
(g·Plant−1)
Percentage of Total Plants
A1B1C15.82 ± 0.60Ab29.9%6.36 ± 0.25Ac33.9%6.50 ± 0.37Abc34.8%
A1B2C25.42 ± 0.34Ab29.5%7.79 ± 1.39Abc33.1%6.76 ± 0.51Ab32.5%
A1B3C36.62 ± 0.67Ab32.2%6.21 ± 0.88Ac30.5%5.00 ± 0.31Ac24.8%
A2B1C28.38 ± 0.49Aa36.7%9.66 ± 0.65Aab40.0%8.78 ± 0.72Aa37.2%
A2B2C36.70 ± 0.56Bb31.5%7.38 ± 0.24ABbc33.6%8.40 ± 0.52Aa30.5%
A2B3C18.58 ± 0.53Aa32.3%8.98 ± 1.28Aab32.4%9.50 ± 0.44Aa32.4%
A3B1C38.56 ± 0.50Aa29.6%7.42 ± 0.80Abc30.4%9.24 ± 0.59Aa28.4%
A3B2C19.24 ± 0.59Aa30.8%9.88 ± 0.41Aab34.7%9.24 ± 0.77Aa32.7%
A3B3C29.47 ± 0.64Aa31.8%10.64 ± 0.71Aa31.3%6.04 ± 0.61Bbc26.9%
CK3.09 ± 0.33Ac24.7%3.09 ± 0.33Ad24.7%3.09 ± 0.33Ad24.7%
Note: Different small letters in different treatments indicate significant differences in different fertilization ratios; different capital letters indicate significant differences among different frequencies of the fertilization ratios (p = 0.05).
Table 9. Effects of different fertilization ratios and frequencies on leaf biomass.
Treatments4 Applications6 Applications8 Applications
Leaf Biomass
(g·Plant−1)
Percentage of Total PlantsLeaf Biomass
(g·Plant−1)
Percentage of Total PlantsLeaf Biomass
(g·Plant−1)
Percentage of Total Plants
A1B1C13.87 ± 0.42Abc19.9%4.16 ± 0.49Acd22.2%4.24 ± 0.42Abcd22.7%
A1B2C24.27 ± 0.41Abc23.2%4.35 ± 0.59Acd18.5%3.67 ± 0.56Acd17.6%
A1B3C34.82 ± 0.32Aabc23.4%4.51 ± 0.77Abcd22.1%3.61 ± 0.37Acd17.9%
A2B1C24.22 ± 0.93Abc18.5%4.39 ± 0.91Acd18.2%4.69 ± 0.63Aabc19.8%
A2B2C34.19 ± 0.38Bbc19.7%4.49 ± 0.61ABbcd20.5%5.83 ± 0.43Aab21.2%
A2B3C15.49 ± 0.41Aab20.7%6.54 ± 0.45Aab23.6%5.95 ± 0.58Aab20.3%
A3B1C36.29 ± 1.15Aab21.8%5.31 ± 0.65Aabc21.8%6.32 ± 0.82Aa19.4%
A3B2C15.08 ± 0.51Aabc16.9%5.55 ± 0.79Aabc19.5%4.93 ± 0.93Aabc17.4%
A3B3C26.81 ± 1.48Aa22.9%7.06 ± 0.50Aa20.8%4.07 ± 0.47Abcd18.1%
CK2.63 ± 0.60Ac21.1%2.63 ± 0.60Ad21.1%2.63 ± 0.60Ad21.1%
Note: Different small letters in different treatments indicate significant differences in different fertilization ratios; different capital letters indicate significant differences among different frequencies of the fertilization ratios (p = 0.05).
Table 10. Effects of different fertilization ratios and frequencies on whole plant biomass.
Treatments4 Applications6 Applications8 Applications
A1B1C119.48 ± 1.90Ad18.78 ± 0.68Acd18.70 ± 1.35Ad
A1B2C218.40 ± 0.63Ad23.53 ± 2.30Abc20.80 ± 1.73Ad
A1B3C320.56 ± 1.62Acd20.40 ± 2.46Ac20.18 ± 1.85Ad
A2B1C222.85 ± 1.71Abcd24.12 ± 3.08Abc23.63 ± 1.31Abcd
A2B2C321.30 ± 1.92Bcd21.96 ± 1.44Bbc27.53 ± 1.74Aabc
A2B3C126.52 ± 2.59Aabc27.74 ± 2.63Aab29.34 ± 1.98Aab
A3B1C328.87 ± 2.83Aab24.37 ± 2.65Abc32.60 ± 2.79Aa
A3B2C130.02 ± 2.00Aa28.49 ± 2.08Aab28.27 ± 2.89Aabc
A3B3C229.77 ± 2.54ABa34.03 ± 2.31Aa22.46 ± 2.85Bcd
CK12.50 ± 1.49Ae12.50 ± 1.49Ad12.50 ± 1.49Ae
Note: Different small letters in different treatments indicate significant differences in different fertilization ratios; different capital letters indicate significant differences among different frequencies of the fertilization ratios (p = 0.05).
Table 11. Effects of different fertilization ratios and frequencies on transport efficiency.
Fertilization FrequenciesTreatmentsTransport Efficiency
NRankingPRankingKRanking
4 ApplicationsA1B1C116.7%711.1%823.2%5
A1B2C218.4%411.4%716.7%7
A1B3C35.1%1026.6%120.9%6
A2B1C217.0%520.8%236.2%3
A2B2C325.8%218.4%311.0%8
A2B3C128.0%113.7%543.7%2
A3B1C316.9%613.1%610.5%9
A3B2C118.7%37.5%950.4%1
A3B3C215.0%83.7%1030.2%4
CK8.4%918.4%34.1%10
6 ApplicationsA1B1C115.7%721.3%627.9%5
A1B2C21.3%1031.7%220.6%8
A1B3C39.0%842.8%123.2%7
A2B1C223.3%621.9%525.7%6
A2B2C330.4%111.1%932.1%4
A2B3C127.7%323.5%441.8%2
A3B1C328.0%224.6%320.1%9
A3B2C127.0%412.5%858.3%1
A3B3C224.8%56.8%1038.6%3
CK8.4%918.4%74.1%10
8 ApplicationsA1B1C115.3%57.2%721.2%8
A1B2C214.6%629.8%20.8%10
A1B3C33.7%1051.8%139.4%3
A2B1C239.0%127.9%342.7%1
A2B2C321.6%46.9%835.7%5
A2B3C17.3%911.1%636.7%4
A3B1C39.3%713.0%530.4%6
A3B2C127.2%34.1%924.3%7
A3B3C231.1%24.0%1041.7%2
CK8.4%818.4%44.1%9
Table 12. Effects of different fertilization ratios and frequencies on nutrient uptake efficiency.
Fertilization FrequenciesTreatmentsNutrient Uptake Efficiency
NRankingPRankingKRanking
4 ApplicationsA1B1C157.9%4−23.6%957.3%2
A1B2C273.9%2−22.6%837.7%5
A1B3C3−54.4%926.5%150.3%3
A2B1C230.2%53.8%248.2%4
A2B2C372.9%3−0.1%310.2%8
A2B3C183.7%1−7.6%559.5%1
A3B1C319.8%7−4.3%44.8%9
A3B2C125.7%6−8.8%634.8%6
A3B3C213.8%8−11.9%719.6%7
6 ApplicationsA1B1C147.6%69.3%371.5%1
A1B2C2−91.9%942.8%249.6%4
A1B3C3−17.3%878.9%157.5%2
A2B1C260.6%35.7%532.4%7
A2B2C395.4%1−11.8%942.0%5
A2B3C182.0%28.2%456.7%3
A3B1C355.7%45.0%612.0%9
A3B2C152.5%5−4.8%740.7%6
A3B3C245.2%7−9.4%825.9%8
8 ApplicationsA1B1C144.6%3−36.0%951.4%3
A1B2C237.1%636.7%2−10.1%9
A1B3C3−68.2%949.2%155.0%2
A2B1C2136.9%115.4%358.0%1
A2B2C352.7%4−18.6%847.5%5
A2B3C1−16.8%7−11.9%749.0%4
A3B1C3−4.6%8−4.3%419.7%7
A3B2C153.1%5−11.6%515.1%8
A3B3C265.7%2−11.6%528.2%6
Table 13. Effects of different fertilization ratios and frequencies on soil nutrient contents.
Fertilization FrequenciesTreatmentsSoil Nutrient Contents
NPK
4 ApplicationsA1B1C12.76 ± 0.257ab1.45 ± 0.019a5.06 ± 0.101ab
A1B2C22.56 ± 0.015ab1.50 ± 0.015a5.01 ± 0.299ab
A1B3C32.93 ± 0.188ab1.59 ± 0.034a4.83 ± 0.133ab
A2B1C22.56 ± 0.107ab1.59 ± 0.009a4.49 ± 0.278ab
A2B2C32.64 ± 0.053ab1.36 ± 0.266a4.72 ± 0.328ab
A2B3C12.52 ± 0.097b0.66 ± 0.011b4.30 ± 0.089b
A3B1C32.65 ± 0.008ab0.83 ± 0.019b4.30 ± 0.123b
A3B2C12.96 ± 0.163a0.84 ± 0.017b6.22 ± 0.160a
A3B3C22.68 ± 0.057ab0.92 ± 0.018b4.07 ± 0.176b
CK2.62 ± 0.051ab0.89 ± 0.074b4.95 ± 0.112ab
6 ApplicationsA1B1C12.34 ± 0.027b1.00 ± 0.192b5.14 ± 0.112a
A1B2C24.28 ± 0.577a1.49±0.009a4.66 ± 0.276ab
A1B3C32.84 ± 0.048b1.48 ± 0.018a5.07 ± 0.05a
A2B1C22.52 ± 0.055b1.58 ± 0.007a4.72 ± 0.116ab
A2B2C32.71 ± 0.054b1.61 ± 0.027a4.22 ± 0.067bc
A2B3C12.50 ± 0.148b0.73± 0.025c3.98 ± 0.175c
A3B1C32.82 ± 0.036b0.77 ± 0.028c4.40 ± 0.177bc
A3B2C12.63 ± 0.086b0.86 ± 0.014bc4.07 ± 0.269c
A3B3C22.89 ± 0.082b0.87 ± 0.010bc4.70 ± 0.056ab
CK2.62 ± 0.051b0.89 ± 0.074bc4.95 ± 0.112a
8 ApplicationsA1B1C12.60 ± 0.082b1.49 ± 0.042b4.70 ± 0.154a
A1B2C24.53 ± 0.157a1.49 ± 0.002b5.03 ± 0.063a
A1B3C32.37 ± 0.022b1.57 ± 0.045ab4.87 ± 0.220a
A2B1C22.74 ± 0.050b1.61 ± 0.025a4.96 ± 0.198a
A2B2C32.77 ± 0.145b0.75 ± 0.025de4.66 ± 0.116a
A2B3C12.62 ± 0.081b0.72 ± 0.024e4.25 ± 0.283a
A3B1C32.82 ± 0.100b0.82 ± 0.012cde4.96 ± 0.707a
A3B2C12.56 ± 0.043b0.84 ± 0.020cd4.40 ± 0.178a
A3B3C22.84 ± 0.119b0.92 ± 0.043c4.70 ± 0.143a
CK2.62 ± 0.051b0.89 ± 0.074c4.95 ± 0.112a
Note: Different letters in the same column value indicate a significance of 5%, p < 0.05.
Table 14. Seedling quality index in each treatment.
Treatments4 Applications6 Applications8 Applications
QIRankingQIRankingQIRanking
A1B1C12.1281.8492.128
A1B2C22.3572.4152.157
A1B3C32.6952.3762.236
A2B1C21.9392.1472.049
A2B2C32.3562.1183.431
A2B3C12.7843.4212.802
A3B1C33.0112.4542.514
A3B2C12.7932.9232.603
A3B3C22.8423.1922.375
CK1.59101.59101.5910

