1. Introduction
Clinical episodes are normally registered by physicians or other health professionals using natural language. For every clinical episode, an electronic health record (EHR) is registered and stored in the patient’s clinical history. Since the clinical descriptions are recorded in natural language, there may be ambiguities, different denominations for the same pathology, symptoms, or therapies. Additionally, natural text is non-structured, so information is more difficult to retrieve than in structured databases. In order to facilitate procedures of text mining and information retrieval in electronic health records, an international encoding system was developed, where each pathology and symptom is assigned a unique code. The International Classification of Diseases (ICD) is a medical diagnostic and procedure coding system that was developed by the World Health Organization (WHO) in the 1970s. ICD has undergone several major revisions along the years, incorporating new scientific knowledge, expanding its scope and content, and improving its structure and format. In 2009, the U.S. Department of Health and Human Services (HHS) released a final ruling for the U.S. to adopt the ICD-10 code set. In 2014, HHS issued a final rule formally establishing 1 October 2015 as the ICD-10 compliance date and requiring the continued use of ICD-9 through 30 September 2015. The latest version of the ICD is ICD-11. It was adopted in 2019 by the 72nd World Health Assembly, and came into effect on 1 January 2022 [
1].
The dataset used in the present work, MIMIC-IV, does not provide ICD-11 codes, providing only ICD-9 and ICD-10 codes for the diagnosis and procedures of the patients. ICD-10 is still widely used to describe patient diagnostic information. Codification of EHR into ICD-10 codes is normally performed and audited by medical doctors with proper training in the process. The doctors read the clinical texts and assign the EHR the corresponding ICD-10 codes, so that retrieval procedures are facilitated in the future. This process of manually assigning the codes is very time consuming and prone to errors. For each illness mentioned in the EHR, the coders need to find the corresponding ICD-10 code and assign it to the episode. Totally automatic encoding could save time, improve efficiency and the quality of the work. Nonetheless, despite this being an area of heavy research, total automation is not expected to be feasible in the coming years, due to the complexity of the process and the rigour that is demanded in the task, where errors can have unexpected catastrophic consequences. Therefore, a more realistic and safer goal is to produce co-pilots that can help in the encoding process, leading the coders to the right codes with minimal errors and omissions.
Despite that many approaches were introduced to help the encoding process, only a few have been applied in practice, due to the difficulty and low precision. The present paper proposes a method where the Cosine text similarity method is used to improve the output of a pretrained language model (PLM).
The main contributions of this paper are:
Implementation of a strategy of multiple runs of the Cosine method, so that frequent words are eliminated in the latter runs, in order to let other words trigger additional codes;
Implementation of a strategy called “bucket category” selection, that considers all the ICD-10 codes in a given category;
Proposal of a method where the Cosine text similarity algorithm, with the contributions referred above, is used to improve the results of a PLM.
The remainder of this paper is organized as follows.
Section 2 presents related work on quality in clinical coding, natural language processing (NLP) in healthcare, PLMs, and the application of deep learning models in biomedical settings.
Section 3 presents the used datasets and
Section 4 the methodology.
Section 5 describes the experimental evaluation and
Section 6 discusses the main findings. Finally,
Section 7 presents the main conclusions and future work.
2. Related Work
This section describes a literature review of related works, namely the quality in clinical coding, application of NLP in the area of healthcare, PLMs, and use of deep learning models in biomedical applications.
2.1. Quality in Clinical Coding
Alonso, et al. (2020) [
2] explored the perception of medical coders regarding possible problems with clinical records that can impact the quality of coded data. The authors show that there are several problems in clinical records that influence the quality of coded data, namely the incomplete or lack of clearly documented information, the variability of the diagnosis description, “copy and paste”, lack of clarity in records, lack of readability, use of synonyms and abbreviations, lack of communication between the stakeholders, and the lack of solutions to solve these problems.
Lucyk, et al. (2017) [
3] explored the potential barriers that exist to quality coding. They elucidated the high mapping quota of codification by the medical doctors that originates additional pressure on coding, compromising its quality.
2.2. NLP in Healthcare
Kormilitzin, et al. (2021) [
4] used a NER model for NLP in the healthcare area. It was trained to classify seven categories, namely drug name, route of administration, frequency, dosage, robustness, form and duration. The process is composed by an initial pretrain of the model using MIMIC-III, followed by fine-tuning of the NER task. MIMIC is a popular EHR dataset in medical informatics.
Li, et al. (2022) [
5] described NLP methods in the healthcare area, emphasizing tasks like classification, prediction, word embedding and extraction. Architectures used in NLP, like autoencoders, convolutional neural networks (CNN), recurrent neural networks (RNN), and sequence-to-sequence models, were described.
2.3. Pretrained Language Models
Devlin, et al. (2018) [
6] presented a language representation model, BERT (Bidirectional Encoder Representations from Transformers), that is designed to pretrain deep bidirectional representations from unlabeled text. This model can be fine-tuned with just one additional output layer.
Lee, et al. (2020) [
7] introduced BioBERT (Bidirectional Encoder Representations from Transformers for Biomedical Text Mining), a domain-specific language representation model that is pretrained on large-scale biomedical corpora. In the same way Alsentzer, et al. (2019) [
8] presented ClinicalBERT, Gu, et al. (2021) [
9] the PubMed-BERT, and Lewis, et al. (2020) [
10] the RoBERTa-PM. These models are pretrained on domain-specific, crawled and processed for improvement of the downstream performance. These PLMs improved performance on tasks like text mining, named entity recognition, relation extraction, and question answering.
Zhang, et al. (2020) [
11] proposed an extension of BERT for ICD coding, BERT-XML. It was pretrained on a large corpora of EHRs with specific vocabulary. This model handles long input text by splitting into chunks and perform predictions for each chunk with a label attention mechanism.
Huang, et al. (2022) [
12] proposed a PLM to predict ICD codes (PLM-ICD) that tackles the challenges of previous pretrained models, namely the use of domain-specific pretraining, segment pooling for the long input sequence problem, and level attention for the large label set problem. Experiments were conducted over MIMIC-II and MIMIC-III datasets. PLM-ICD is the first transformer-based PLM that has a competitive performance on these MIMIC datasets.
Edin, et al. (2023) [
13] reproduced, compared, and analysed state-of-the-art machine learning models for automatic medical encoding, including PLM-ICD. The authors show that many models underperform due to poor configurations, poor train-test splits, and insufficient evaluation. The analysis shows that all models have difficulties with rare codes, while long documents have a negligible impact. They presented the first results on the newly released MIMIC-IV dataset.
2.4. Use of Deep Learning Models in Biomedical Applications
Falter, et al. (2024) [
14] used NLP algorithms, namely rule-based search, logistic regression, term frequency-inverse document frequency (TF-IDF), Extreme Gradient Boosting (XGBoost), and BioBERT, to automate the search for the diagnoses “atrial fibrillation (AF)” and “heart failure (HF)”. The algorithms were used on MIMIC-III dataset, but the best performing one was applied to a Belgian dataset. XGBoost on TF-IDF matrix resulted in an accuracy of 0.94 and 0.92 for AF and HF, respectively. The mismatches were due to a difference in data availability, differing definitions, incorrect labelling and erroneous ICD coding.
Silva, et al. (2023) [
15] presented a transformer-based ranking solution to the problem of the sequence of the main or primary diagnosed, and the order in which the secondary diagnoses are presented. The results show that using the TFR-BERT framework and adapting to the biomedical context using PTM, namely BioBERT, demonstrate superior performance.
Chen, et al. (2022) [
16] used BioBERT, clinical generalized autoregressive pretraining for language understanding (Clinical XLNet), label tree-based attention-aware deep model for high-performance extreme multilabel text classification (AttentionXLM), and word-to-vector (Word2Vec) to predict ICD-10-CM (clinical modification). Different preprocessing methods were introduced, namely the inclusion of discharge diagnoses (DD), medical history, and comorbidity and complication. The results show that BioBERT outperformed other models such as Clinical XLNet, AttentionXLM, and Word2Vec.
Silvestri, et al. (2020) [
17] presented a preliminary evaluation of the Cross-lingual Language Model (XLM) architecture, a multilingual transformer-based model, tested in ICD-10 multilabel classification. The XLM model was fine-tuned on English training data, and tested for ICD-10 codes prediction in an Italian test set, showing very promising results, and could be very useful for cases of low-resource languages.
Yu, et al. (2019) [
18] used the BioBERT model for automatic annotation of clinical problems. This method is initially pretrained on the corpus of medical related fields, by converting the text into a numerical vector. Afterwards, the BiLSTM-CRF model trains the processed vectors and finally complete the entity tagging. The results show that, for the I2B2 2010 challenge dataset, the method can improve the performance of the named entity recognition (NER) task.
Chen, et al. (2021) [
19] used a deep learning model for ICD-10 coding, to find the diagnosis and corresponding procedure codes on medical text. The process is composed by data processing, feature extraction and model training.
Choi, et al. (2016) [
20] developed a generic predictive model using RNN, called Doctor AI, to predict the diagnosis and medication categories for a patient’s visit. It assesses the history of patients to make multilabel predictions.
Li, et al. (2020) [
21] proposed a Multi-Filter Residual Convolutional Neural Network (MultiResCNN) for ICD automatic encoding, that uses a multi-filter convolutional layer to capture various text patterns with different lengths and a residual convolutional layer to enlarge the receptive field.
Mullenbach, et al. (2018) [
22] presented an attentional convolutional network that does the encoding of medical codes through the clinical text. It uses a convolutional neural network to aggregate information, and an attention mechanism to select segments that are more relevant among the possible codes.
Shi, et al. (2017) [
23] proposed a deep learning model with an attention mechanism for automatic codification of ICD codes for a diagnosis. The authors used character-aware models to generate hidden representations for the diagnosis records and ICD codes. An attention mechanism was also used to address the mismatch between numbers of descriptions and codes.
3. Datasets Used
ICD-10 ontology was used in the present research. The EHR used were a subset of MIMIC-IV.
3.1. ICD-10
ICD is a medical coding system, also known as medical ontology, that is popular and used worldwide [
24]. It follows a tree hierarchical structure, where the chapters are represented at the top, followed by categories, sub-categories and codes. The 10th revision of ICD was used in this work, but the latest version is the 11th revision. As an example, ref. [
19] used diagnosis records of the Taiwan University Hospital, applying NLP techniques on the deep neural network architecture, using the attention mechanism to extract keywords from diagnoses, for ICD-10 encoding.
3.2. MIMIC-IV
MIMIC-IV was the source of EHR used in the present work. This dataset contains data of patients that were admitted to the Beth Israel Deaconess Medical Center emergency department or ICU between 2008 and 2019, annotated with ICD-9 or ICD-10 codes [
25]. MIMIC-IV was released on 6 January 2023, and it is increasingly more popular for training and testing applications for automatic medical encoding.
MIMIC-IV contains information for each patient (257,000 distinct patients), namely the hospital stay, laboratory measurements, medication, and vital signs. It is composed by 524,000 admission records [
26].
In this dataset, subject ID identifies a patient, while hadm ID identifies an admission of a patient to the hospital. For example, the following text is part of a MIMIC-IV EHR, with subject ID “1000017” and hadm ID “22927623”: “She describes feeling as though food gets stuck in her neck when she eats. She put herself on a pureed diet to address this over the last 10 days. When she has food stuck in the throat, she almost feels as though she cannot breath, but she denies trouble breathing at any other time. She does not have any history of food allergies or skin rashes”. This excerpt shows an example of a text that is text somehow vague concerning the diagnosis and negated terms (no food allergies or skin rashes). Those are common difficulties when coding.
For the present work, the MIMIC-IV dataset was split into a training set composed by 73,381 discharge summaries (60%), a validation set consisting of 24,461 records (20%), and a test set consisting of 24,461 records (20%), following the partition method proposed in [
22].
For the sake of time, only a fraction of of the test set (4077 out of the 24,462) samples were used in the experiments described below.
4. Methodology
The Cosine text similarity method was used, in order to slightly improve PLM-ICD model results as an ICD-10 encoding aid.
4.1. Software and Hardware
The algorithms were developed in a Python programming environment, using SciPy libraries as needed.
Training and tests were performed on a cluster, made available by the INCD (
https://www.incd.pt/, accessed on 3 December 2023). The computer used was Stratus cloud computing service, which is an IaaS cloud infrastructure based on Openstack, which enables control of large pools of computing, storage, and networking resources.
4.2. Performance Metrics
The evaluation metrics used were micro-average Precision (P) (Equation (
1)), micro-average Recall (R) (Equation (
2)), and micro-average F1-score (F1) (Equation (
3)).
The equations are given for an example of a problem with two classes, class 1 and class 2. TP, FP and FN stand for True Positive, False Positive and False Negative, respectively.
The use of these metrics is justified when having an imbalanced dataset, where no class is more important than the others [
27].
4.3. Cosine Text Similarity Method
The Cosine similarity method measures the similarity between two vectors of an inner product space. It is measured by the Cosine of the angle between these two vectors, as given by Equation (
4), where
a and
b are two vectors and
the angle they form.
The method can be used to compare documents, as long as the documents are represented as vectors. A result of 0 means the two vectors are at 90 degrees and the documents they represent have no match. A result of 1 means the vectors representing the texts totally overlap, so the cosine is 1 and the documents are very similar. The closer to 1, the greater the overlap of the vectors and the greater the match between texts.
In order to encode the texts as vectors, one method that is popular and was used in the present work is the TF-IDF. TF-IDF representation tells how unique a word is across multiple text. It is computed by summing the TF-IDF for each query term and is given by the Equations (5)–(7).
In the equations, is the number of times the word appears in the document. is the total number of words in the document. is the number of documents in the corpus, and is the number of documents in the corpus that contain the term.
4.4. Text Pre-Processing for Cosine Method
For the Cosine method, preprocessing each EHR includes the removal of extra white spaces, leading spaces, stop words, punctuation, conversion to the base form and lower-case.
A blacklist of words, such as “patient” and “hospital”, was also created, because some words have high prevalence in some texts and they are irrelevant for the codification process. This is because some ICD-10 codes have for example the word “patient”, such as “Y92230–Patient room in hospital as the place of occurrence of the external cause”, or “Z911–Patient’s noncompliance with medical treatment and regimen”. Given the fact that those words are very prevalent in the EHRs, the Cosine method encodes them and they interfere with classification, despite the absence of meaning for the task.
A NER model “en_ner_bc5cdr_md”, from scispaCy (
https://allenai.github.io/scispacy/, accessed on 10 October 2023), a library of clinical and biomedical specific components that integrate with spaCy, was also used to identify disease entities and exclude tokens that are not disease entities.
The detection of clinical acronyms, using a regular expression and a dictionary containing its definitions, and replacement by its long form, was also used. Taking the example of EHR with subject ID “10002443” and hadm ID “21329021”, the short form word “afib” is present in the text, but not in any ICD-10 code description. After the long form replacement of “afib” by “atrial fibrillation”, the Cosine method could find the ICD-10 code “I480-Paroxysmal atrial fibrillation”. The acronym dictionary built contains 256 pairs of acronyms and their long form.
EHRs could contain recognized entities that are not present in ICD-10 code description. But some of those entities have synonyms, for example, “dyslipidemia” is an EHR disease entity that is not present in ICD-10 code description, but the synonym “hyperlipidemia” is. Hence, a dictionary was manually built in Python with entities and synonyms of those entities.
The manual dictionary was created as a proof of concept, based on the observation that sometimes the keywords in the ICD-10 code description do not match the equivalent keywords in the EHR text, because synonyms are used. For example, in the EHR with subject ID “1000017” and hadm ID “22927623”, the ICD-10 code “K31819—Angiodysplasia of stomach and duodenum without bleeding”, the disease entity “angiodysplasia” was not present in the EHR text. The synonym “angioectasia” is present instead. For this reason, the Cosine method could not properly detect the code. After implementation of the dictionary of disease synonyms, containing the pair “angiodysplasia/angioectasia”, the method was able to correctly detect the “K31819” ICD-10 code. The dictionary of synonyms, as a proof of concept, contains only four pairs of entities and their synonyms, and expansion is left for future work.
4.5. Improved Cosine Text Similarity Implementation
This section describes the implementation of the multiple runs algorithm as well as the bucket category concept, used to achieve an improved Cosine similarity (ICS) method.
4.5.1. Multiple Runs Algorithm
The algorithm of multiple runs was implemented to allow the elimination of words that are frequent in the text and superimpose to other important words. Between runs, the most common encoded words (i.e., words with frequency ≥ 2 occurrences in the top-5 ICD-10 codes, based on their similarity to a given EHR text) are included in the blacklist, thus allowing the encoding of other disease entities present in the EHR.
As an example, let us consider the case where for a single run, the top-5 similarity, between the ICD-10 codes and a given EHR text, is “J17—Pneumonia in diseases classified elsewhere” (0.63 similarity), “R0602—Shortness of breath” (0.62 similarity), “P23—Congenital pneumonia” (0.58), “P239—Congenital pneumonia, unspecified” (0.54) and “J1289—Other viral pneumonia” (0.49). The word “pneumonia” has frequency ≥ 2 occurrences among the top-5, so it will be included in the blacklist, and in the next run it will not be used for similarity calculation. If it was not removed, then the word “pneumonia” would superimpose, making it difficult to encode other ICD-10 codes which are still present but have lower similarity scores because of the influence of the word pneumonia. In the second run, after the removal of “pneumonia”, the encoded top-5 is “R0602—Shortness of breath”, “J44—Other chronic obstructive pulmonary disease”, “J81—Pulmonary edema”, “J449—Chronic obstructive pulmonary disease, unspecified” and “J811—Chronic pulmonary edema”. The next run may add the word “pulmonary” to the blacklist, thus providing a way to possibly find other ICD-10 codes.
Also, if the disease entity does not appear with frequency ≥ 2 occurrences in the top-5, but appears in the top-5 of two consecutive runs, it is also included in a temporary blacklist. To exemplify this fact, consider the previous example, where “R0602—Shortness of breath” appears in both runs. Its words are also included in the temporary blacklist, since it was already encoded. From the previous example, after the removal of “shortness of breath”, the third run does not find this ICD-10 code, thus allowing other codes to surface: “R11—Nausea and vomiting”, “R112—Nausea with vomiting, unspecified”, “R0603—Acute respiratory distress”, “R110—Nausea”, “R1111—Vomiting without nausea”.
4.5.2. Bucket Category Concept
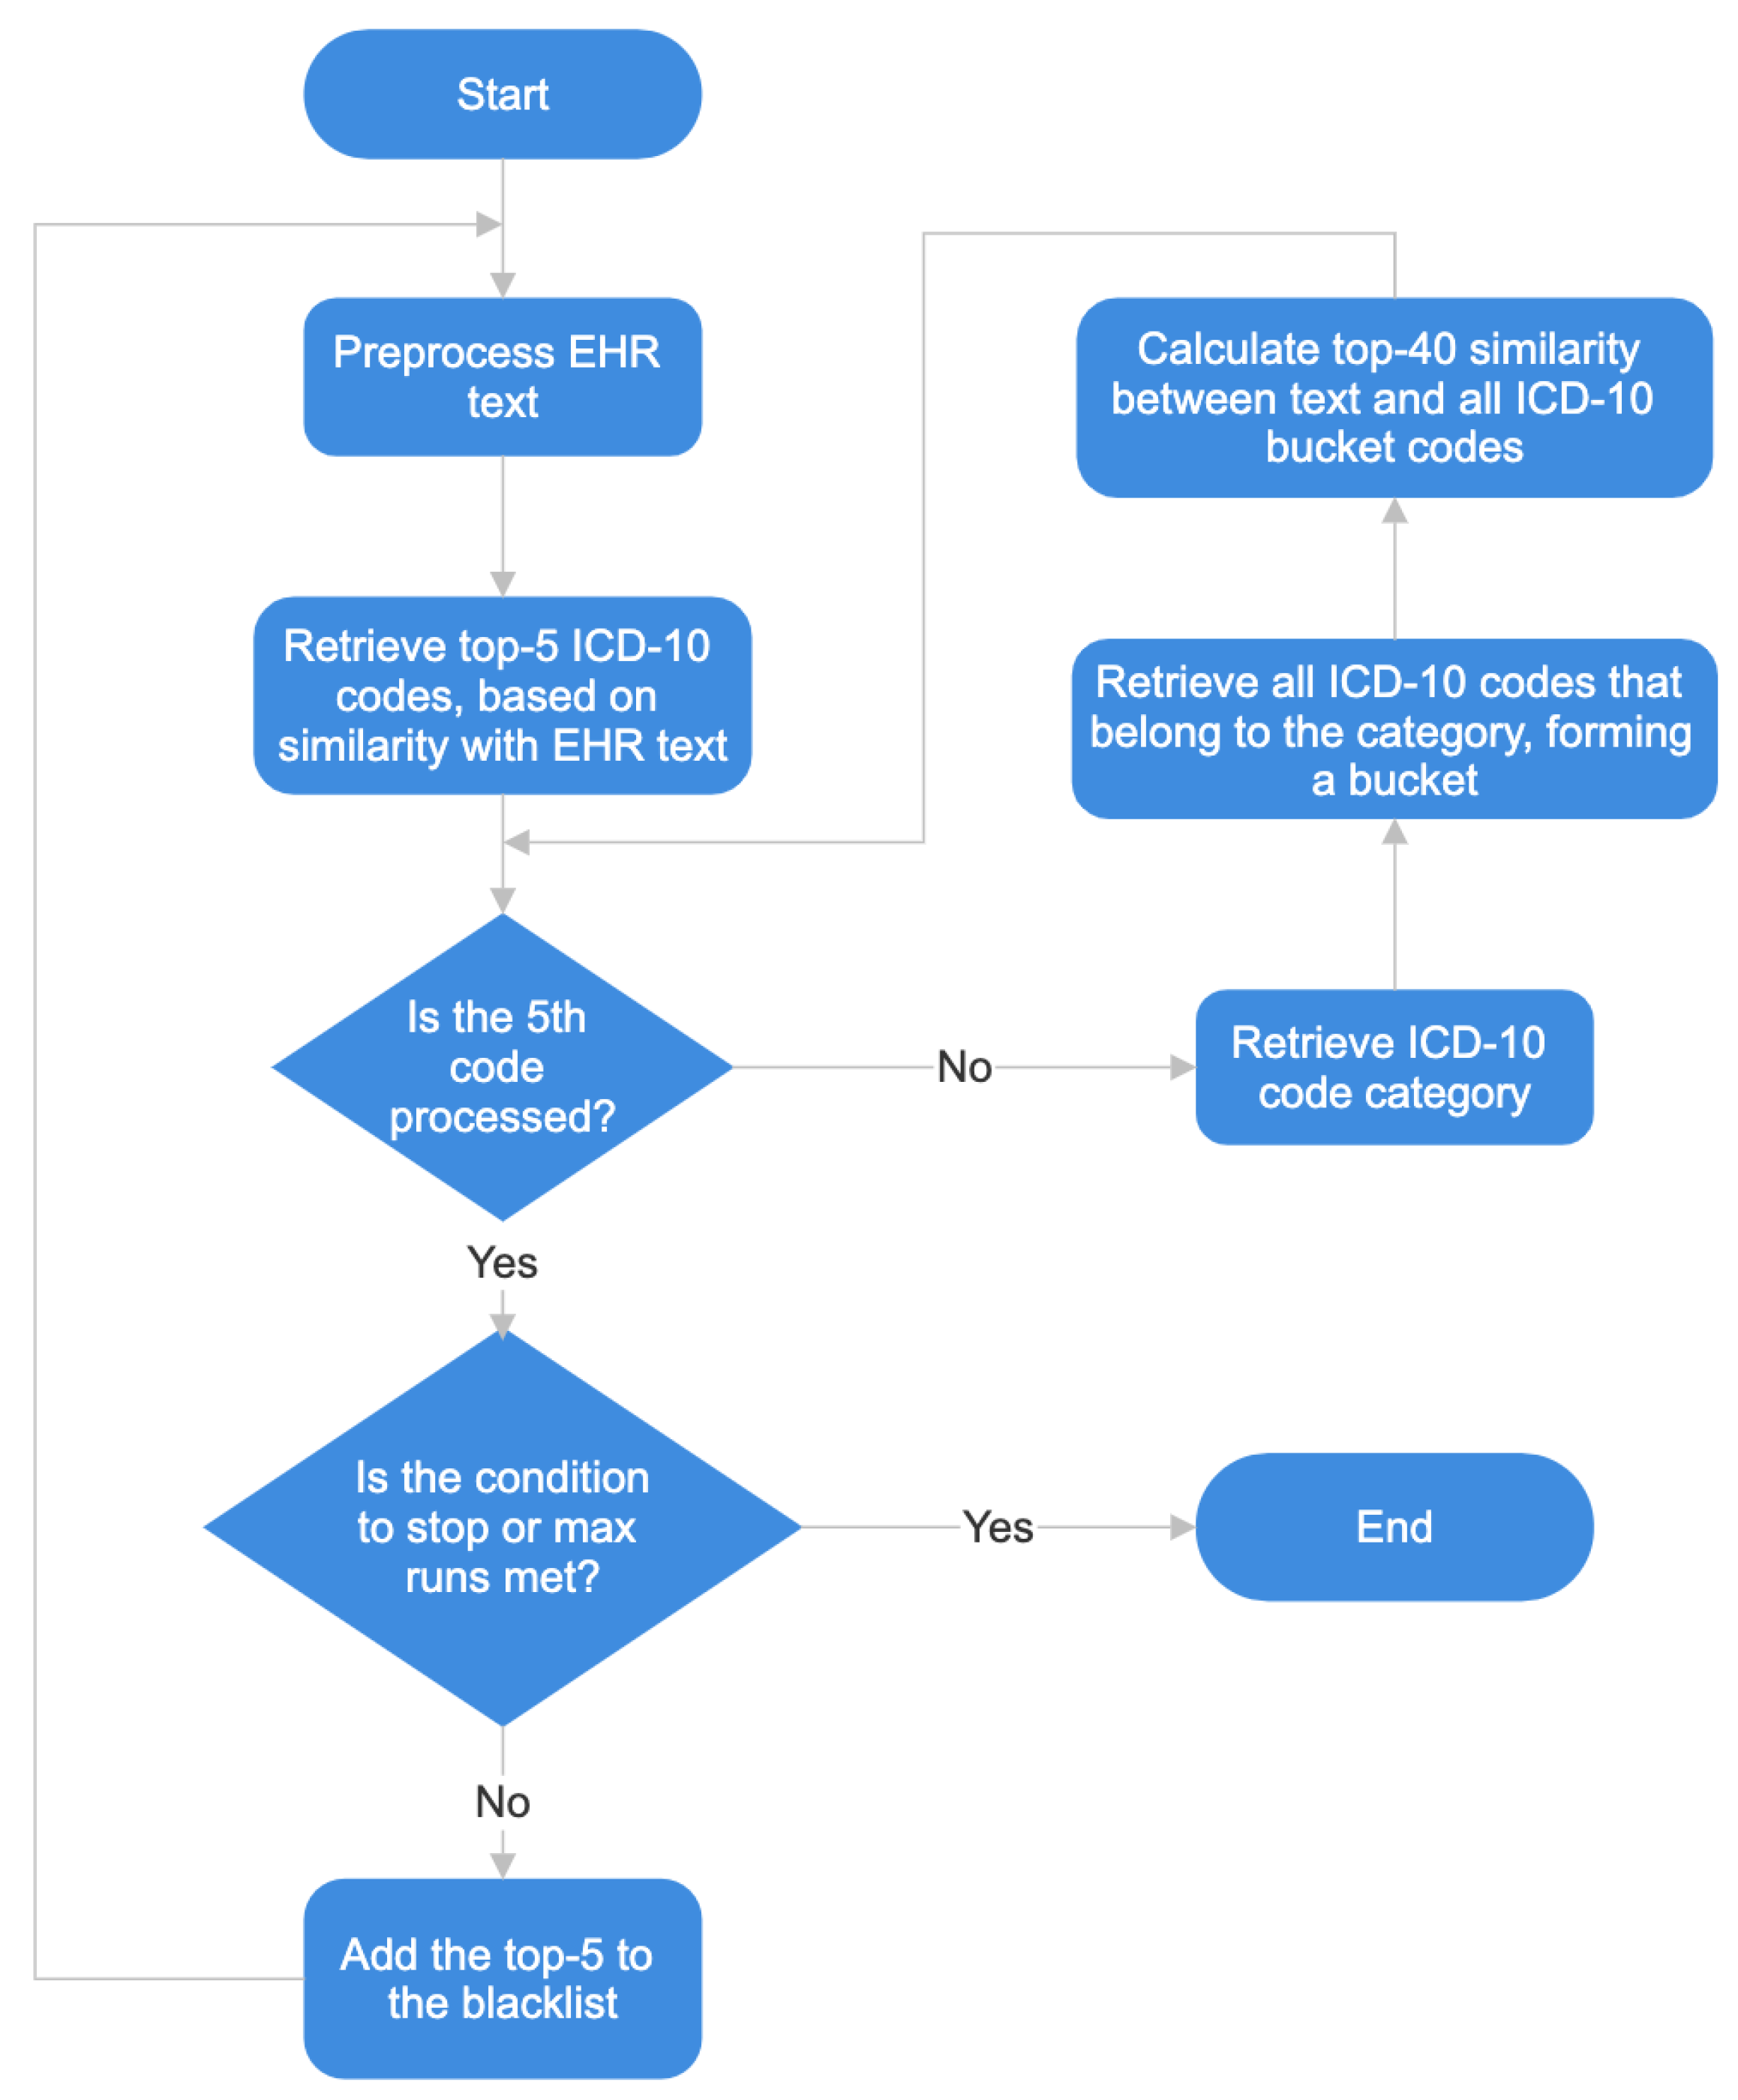
A new strategy was also designed, named bucket category selection, that extends and improves the multiple runs algorithm. In each run of the multiple runs algorithm, for each one of the top-5 ICD-10 codes retrieved, the parent ICD-10 category is also retrieved (one level above the ICD-10 code). Afterwards, the similarity is calculated between the EHR and all the ICD-10 codes that are under the ICD-10 code’s parent category, forming what we call a bucket of codes. The codes in the bucket are then sorted by similarity and up to 40 of them are considered positive candidates. Hence, the bucket selection works as a way of lowering the similarity threshold to codes of a given category, based on the observation that neighbouring codes are often found in EHR.
Figure 1 shows the flowchart of the algorithm, with the bucket category concept.
For clarification of how the bucket category concept works, let us consider the following case, where the ICD-10 codes source of truth are, “S72012A”, “W010XXA”, “Y93K1”, “Y92480”, “K219”, “E7800”, “I341”, “G43909”, “Z87891”, “Z87442”, “F419”, “M810”, “Z7901”.
When calculating the Cosine similarity between preprocessed text and ICD-10 code descriptions, “K21”, “I341”, “M2535” and “M21259”, were identified with the highest similarity. The ICD-10 categories where these codes belong to, namely “K20-K31”, “I30-I52” and “M20-25”, are retrieved, and form buckets with all the ICD-10 codes that belong to each category. With the codes that form each bucket, the Cosine similarity between the bucket codes description and the preprocessed text is calculated. After this, for the category “K20-K31”, it is found that “K219”, is included in the top-40 bucket similarity. And for category “I30-I52”, code “I341” is also retrieved. In this case there are two extra true positives.
4.6. PLM-ICD
PLM-ICD [
12] is a deep-learning based model for automatic encoding of clinical texts that contain biomedical terms into ICD-10 codes.
General PLMs are pretrained on large texts that may or may not contain biomedical text. PLM-ICD uses BioBERT [
7], PubMedBERT [
9], and RoBERTA-PM [
10] databases. This model uses these domain-specific PLMs and fine-tunes them on the automatic ICD coding.
PLM-ICD also tackles the long input text problem, proposing segment pooling by splitting the whole document into segments shorter than the maximum length, and encodes them into segment representations. These segments are inputted into PLMs separately to compute hidden representations, and after concatenated to obtain the hidden representations of all tokens.
This model also tries to solve the problem of large datasets with the label-aware attention mechanism proposed by [
28] to capture the important text fragments relevant to certain labels.
4.7. PLM-ICD-C
In the present project, a model named PLM-ICD-C was used, in order to improve PLM-ICD results based on the Cosine similarity method. Combining these two methods, it is possible to discover some more useful ICD-10 codes to suggest to the medical doctors that perform the classification. The results show that PLM-ICD-C performs better than just PLM-ICD or Cosine similarity alone.
4.7.1. PLM-ICD-C Rules
Three rules were defined for PLM-ICD-C. stands for similarity of PLM-ICD, stands for similarity of the improved Cosine algorithm. is a code determined as probable candidate to positive, and stands for candidate to negative. , and are similarity thresholds to be defined on each experiment. and are thresholds used for the PLM-ICD similarity levels and . is a threshold used for the ICS similarity level. The rules are as follows.
Rule number 1 states that when PLM-ICD finds a code with high probability of being a positive, it is accepted as a positive candidate without further screening by the improved Cosine method.
Rule number 2 brings ICS into play when PLM-ICD retrieves a code with just average confidence. That happens when the similarity is normally about 0.5, which means there is almost the same chance of a code being positive as it is of being negative. Hence, when is between and , then is calculated for that code and if it is above then the code is proposed as , otherwise it is proposed as .
Rule number 3 states that when PLM-ICD assigns very low probability to a code, it is also not screened by ICS, because chances of it being a true positive are very low, so it is immediately accepted as a negative candidate.
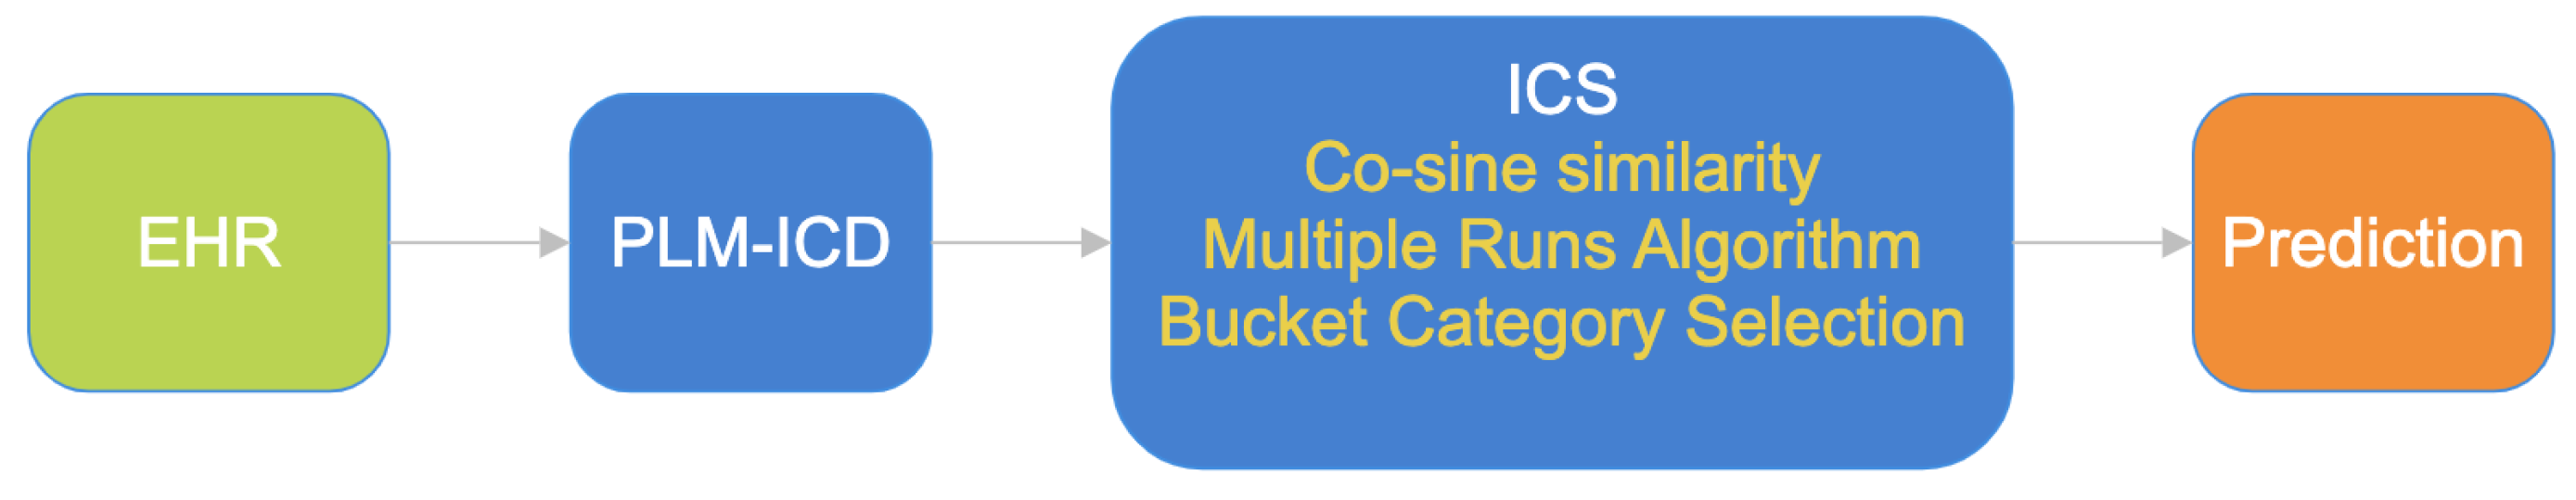
4.7.2. Architecture
Figure 2 contains a diagram showing the flow of data and components of the PLM-ICD-C. The EHR is fed to the PLM-ICD, whose output is then fed to the improved Cosine similarity module, where it is further processed and an improved prediction is output.
The ICS module applies the rules described in
Section 4.7.1. Therefore, if needed it will calculate the Cosine similarity between the input EHR and all ICD codes, performing multiple runs and bucket category selection if applicable, in order to optimise the prediction that is output.
4.7.3. Implementation of Rules
Table 1 clarifies how the truth values are determined for each code, according to the results of the PLM-ICD and ICS modules. Label is the desired result.
For the condition , only the similarity of PLM-ICD, , is considered—the prediction output is positive, based on PLM-ICD only. For the condition , the prediction is also just based on , but in this case it is assumed as negative.
When is in the interval , then ICS is activated and is also considered to determine the prediction. When , a positive is predicted, otherwise a negative is predicted.
5. Experimental Evaluation
In this section, the results are described for the Cosine similarity method, PLM-ICD, and PLM-ICD-C composed by the combination of the previous two.
5.1. Cosine Similarity Method
This section describes the results obtained for the Cosine similarity method, using the multiple runs algorithm and the bucket category concept, thus proving the usefulness of those improvements to reach the improved Cosine method used.
5.1.1. Multiple Runs Algorithm
Table 2 shows a summary of the main results, obtained using the multiple runs algorithm, but without the strategy of bucket category. Three different approaches were tried. In the first approach, a maximum of 11 runs was defined. Stop conditions were also defined, namely the algorithm would stop if 60% of the top-5 codes have a similarity below 0.197. If achieved a state in the run where it has a number of detected ICD-10 codes less than 12% of the total encoded so far, and the maximum number of 11 runs is not yet reached, the run is also stopped. This is performed to let prevail the codes found in the initial runs, which have a bigger similarity, thus a bigger probability of being correct, compared to codes in latter runs that are in less number. These values of percentages were defined empirically. More true positives may be found at a lower value of similarity, but at the same time, more possible false positives may be detected. On the other hand, if the value of the percentage is higher, it is likely that less true positives may be detected, but less false positives would be found. At the end it is a compromise between precision and recall.
The second approach used the same configuration as the first approach, but instead of using up to 11 runs, it uses just five runs.
The third approach uses the same configuration, but with up to 11 runs, and excludes any ICD-10 codes that have a similarity below 0.2.
As the table shows, the values of precision, recall and F1 are very modest, showing that the Cosine similarity with just these aids is insufficient to provide useful coding suggestions.
5.1.2. Bucket Category
In order to improve the algorithm, a new strategy was designed, that was named the bucket category, as explained in
Section 4.5.2.
Table 3 shows a summary of the main results with the Cosine similarity method using the multiple runs algorithm and the bucket category concept, obtained using the three different approaches too. The first, second and third approaches consider the bucket category concept for five, seven, and 11 runs, respectively.
Table 3 shows improvements on the previous results. Precision had a 5-fold improvement, while there are 2–3 fold improvements in recall and 4-fold improvements in F1, using the concept of bucket category. Therefore, this combination of multiple runs and bucked category search was adopted in the remainder of the project and is called ICS method.
5.2. PLM-ICD
Table 4 shows a summary of the results for PLM-ICD, obtained for test with threshold of 0.5, 0.4 and 0.2, and
of the test dataset, the same as used for the Cosine method.
As the table shows, PLM-ICD performs better than the Cosine method using the approaches described before. However, there is still room for improvement, especially considering the difficult trade-off between precision and recall. As the threshold decreases, PLM-ICD finds more codes, but many of them are false positives. So recall increases but precision is dramatically affected.
Edin, et al. (2023) [
13] reported a better F1-score on the test set (58.5% compared to 46.9% in the present work), using PLM-ICD on MIMIC-IV with ICD-10 labels. They used a bigger test set consisting of 24,461 records, following the partition method proposed in [
22]. In the present work, because of the lack of computational resources, the volume of data was smaller and that may justify the different results.
5.3. PLM-ICD-C
PLM-ICD-C is a proposal to enhance the PLM-ICD model using the ICS method, with the multiple runs and bucket category algorithms. So the results are presented and compared below.
5.3.1. Results with Different Thresholds
Table 5 and
Table 6 show a summary of the results for PLM-ICD-C, with the values of
= 0.5,
= 0.4,
= 0.002, which we call PLM-ICD-C (1), and
= 0.4,
= 0.2,
= 0.002, which we call PLM-ICD-C (2), respectively. The threshold values
,
and
were determined empirically. Therefore, they may be subject to optimisation in future work, even though, according to the experiments, they may be close to optimal.
Table 7 and
Table 8 show the comparison of results using PLM-ICD threshold 0.4 and PLM-ICD-C (1) with
≥ 0.5 and
≥ 0.002, and using PLM-ICD threshold 0.2 and PLM-ICD-C (2) with
≥ 0.4 and
≥ 0.002, respectively.
The results shown in
Table 7 and
Table 8 show that PLM-ICD-C (2) performs better than PLM-ICD-C (1), because it filters more FPs than loses TPs.
Table 9 and
Table 10 show the comparison of results using PLM-ICD threshold 0.4 and PLM-ICD (1) with
< 0.5,
≥ 0.4,
≥ 0.002, and using PLM-ICD threshold 0.2 and PLM-ICD (2) with
< 0.4,
≥ 0.2, and
≥ 0.002, respectively.
Again, the results show that PLM-ICD-C (2) in
Table 10 has a better performance that PLM-ICD-C (1) in
Table 9, because it filters more FPs than loses TPs.
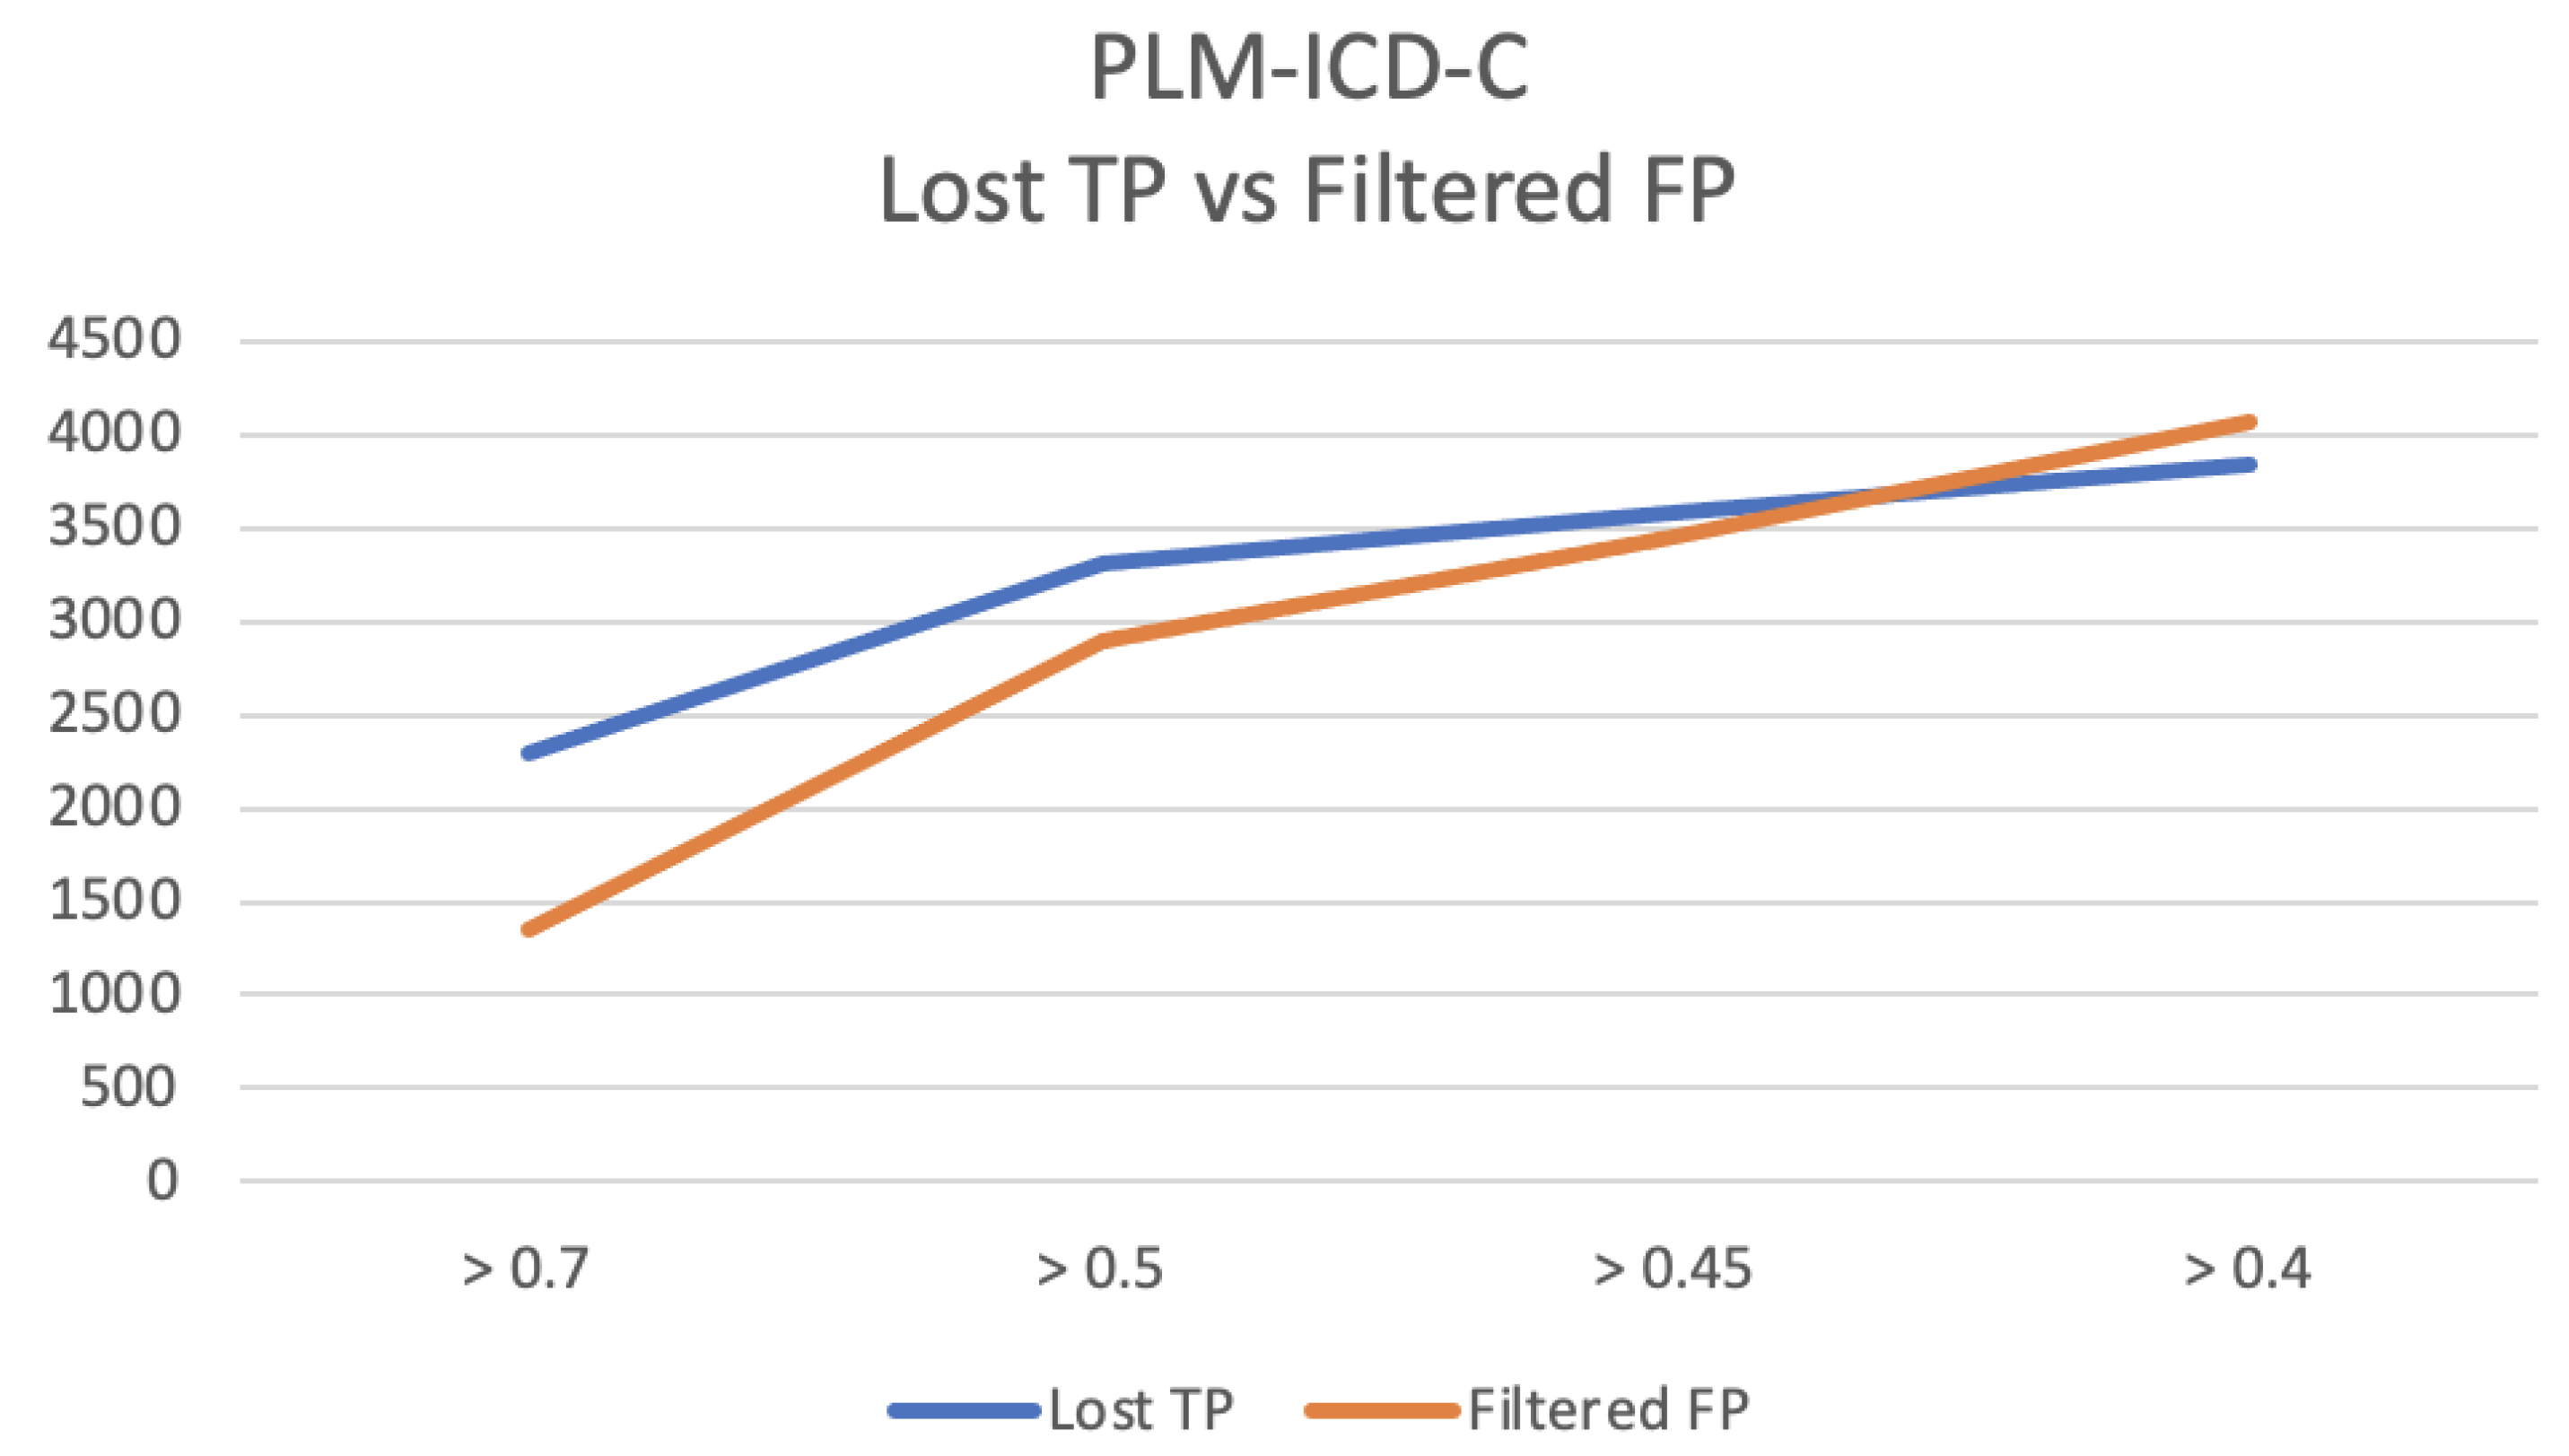
Figure 3 shows the dynamics of lost TP and filtered FP for samples with similarity
above
. The results were calculated for values of
above 0.7, 0.5, 0.45 and 0.4.
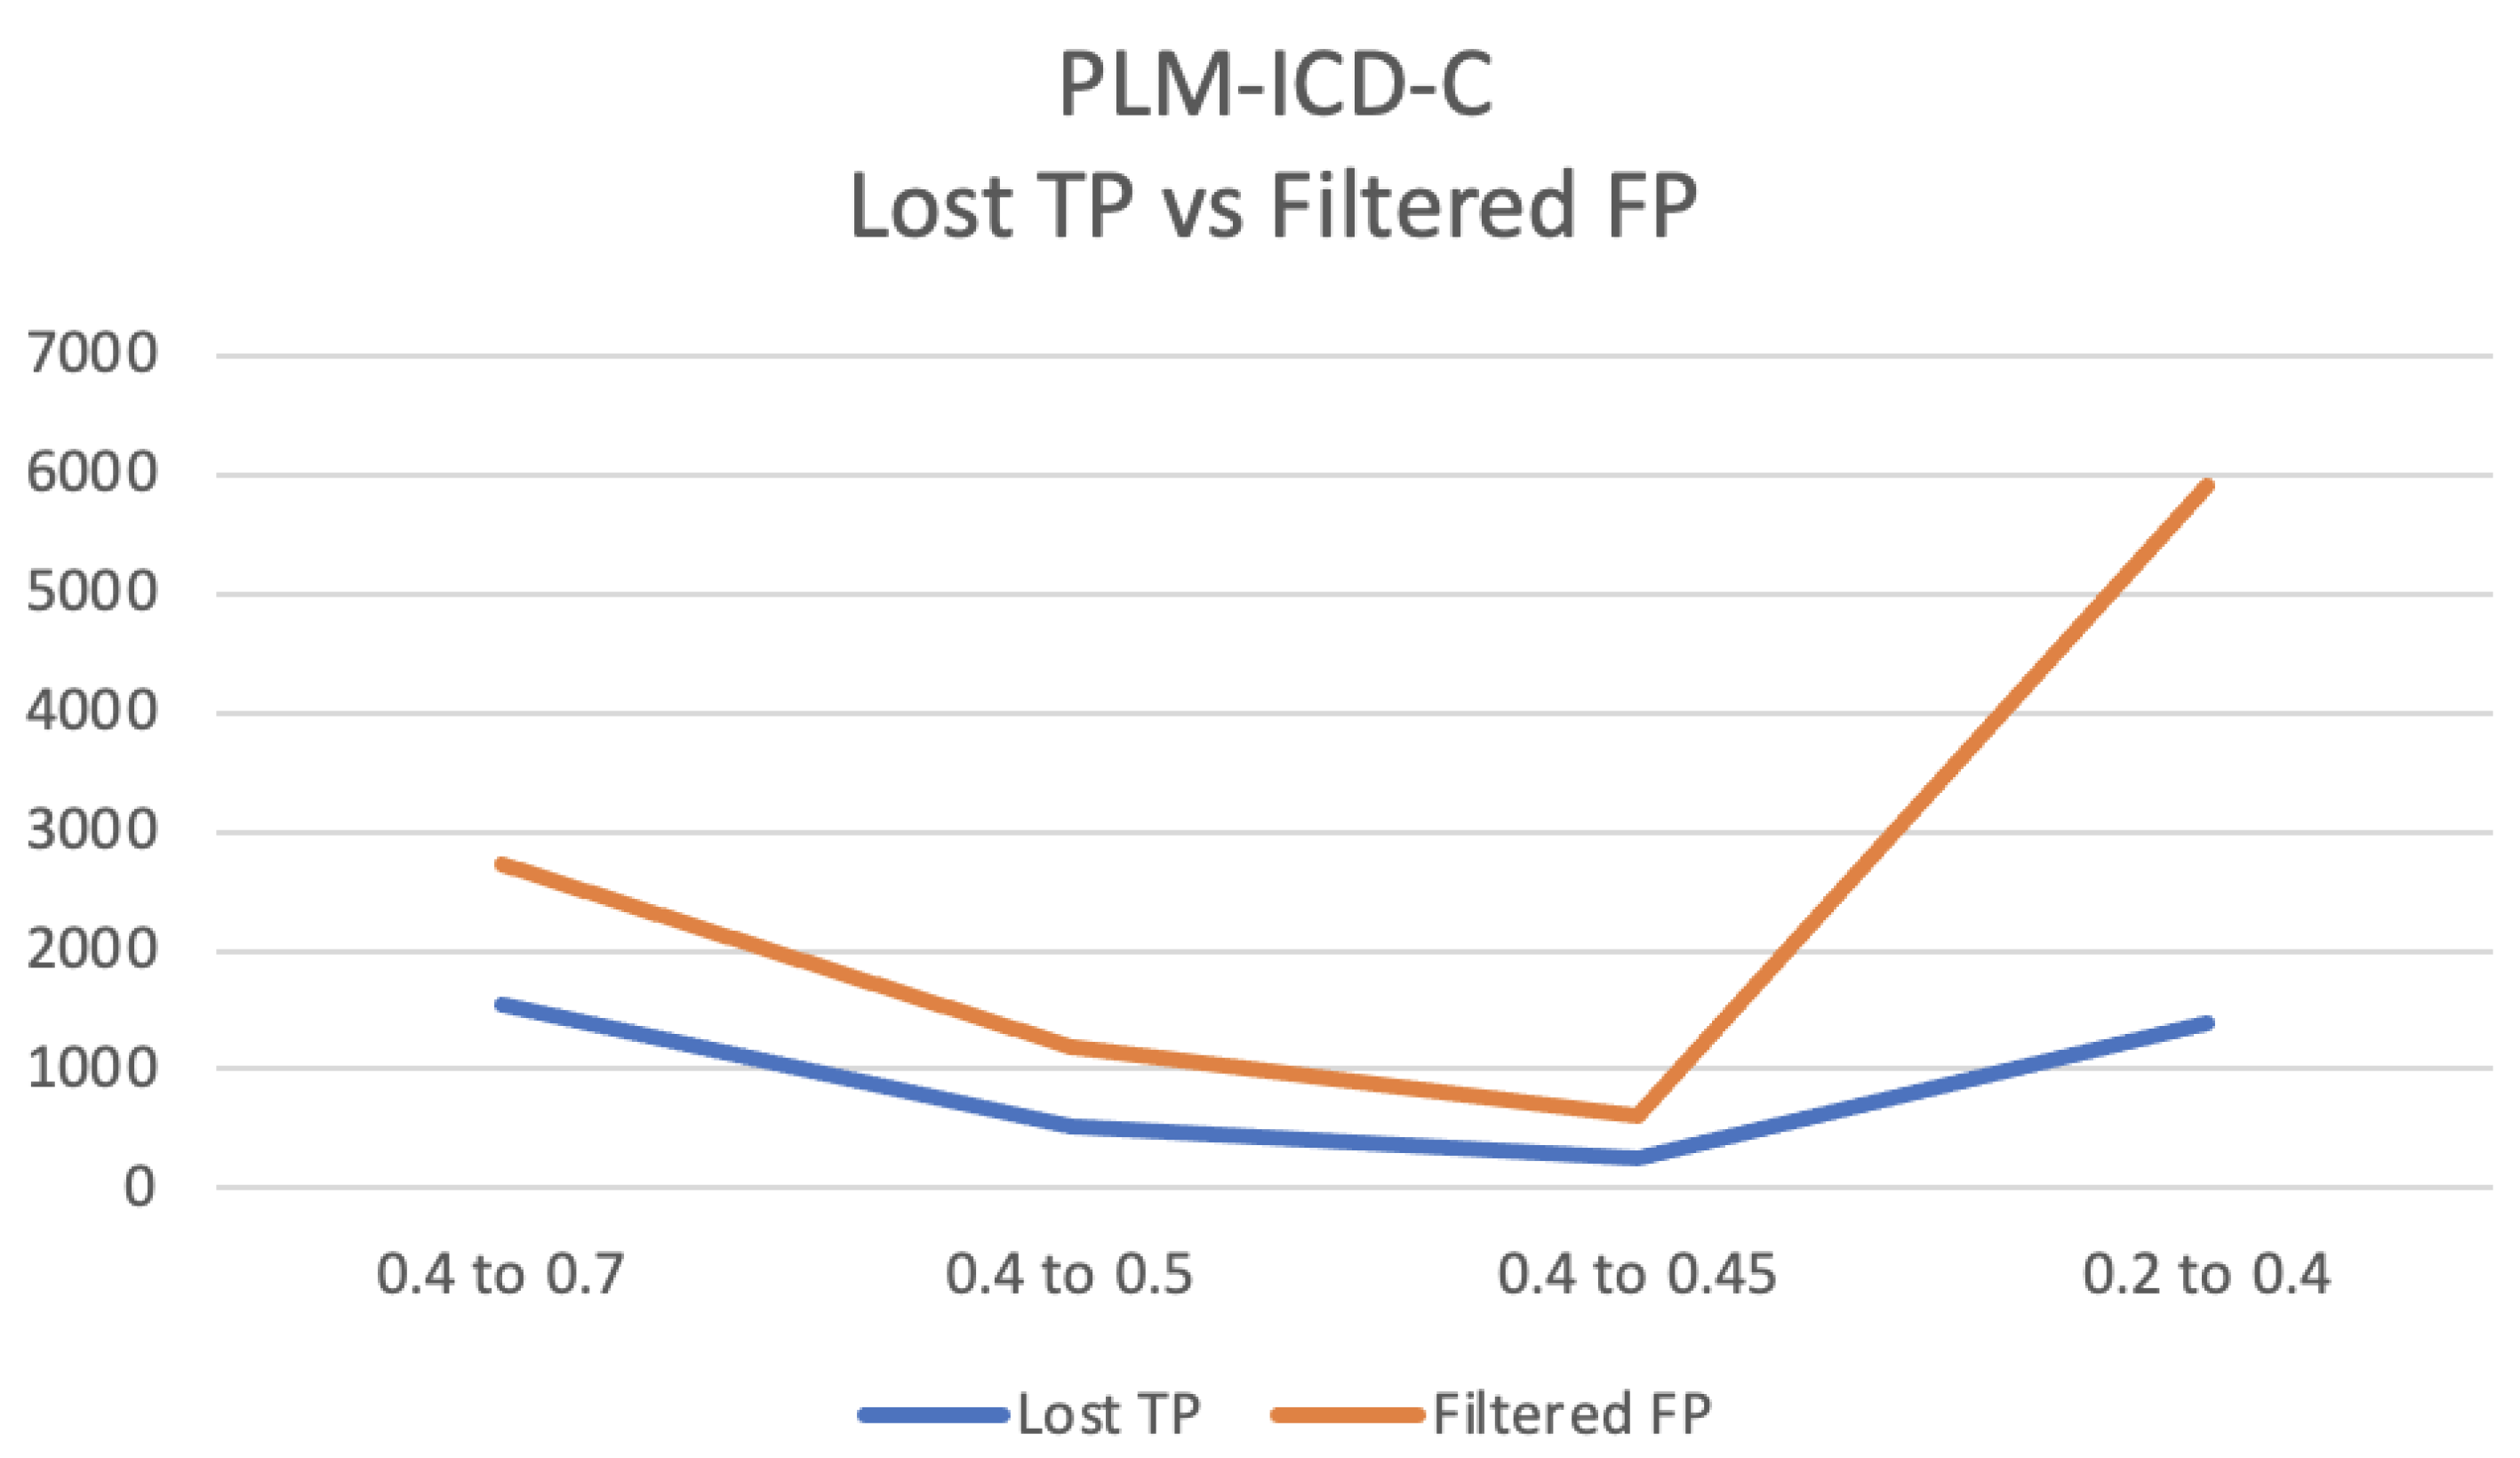
Figure 4 also shows the dynamics of lost TP and filtered out FP, but now the samples where
. Results are shown for different intervals between
and
, namely 0.4 and 0.7, 0.4 and 0.5, 0.4 and 0.45, and 0.2 and 0.4.
Figure 3 shows that the number of filtered FP decreases slightly faster than the loss of TP. The use of PLM-ICD-C is more advantageous for the interval where having
, i.e., where PLM-ICD’s confidence is lower, as can be seen in
Figure 4. PLM-ICD-C can still let through some TP, while filtering out false positives that PLM-ICD would be unable to filter out.
5.3.2. Performance Metrics
Table 11 shows the performance metrics for PLM-ICD and PLM-ICD-C.
For PLM-ICD, the threshold of 0.2 has a lower precision (0.46282) than the threshold of 0.4 (0.60596), but a much better recall (from 0.38264 to 0.47680), which translates into a slightly better F1-score.
For PLM-ICD-C, model (1) has a better precision (0.62031) than (2) (0.50008), but (2) has a much better recall (from 0.37370 to 0.45316), which translates into a better F1 for (2) (from 0.46641 to 0.47547).
In general, PLM-ICD-C (2) has the best F1-score (0.47547), in which it is slightly better than PLM-ICD threshold 0.2 (0.46970), but a much better precision (from 0.46282 to 0.50008), which may improve the code suggestions.
It is shown that the three rules defined for PLM-ICD-C improve the results. In the case of rule number 1, if PLM-ICD finds a code with high probability of being a positive, there is no need to screen it again, being immediately accepted as a positive. In the case of rule number 2, ICS is called to disambiguate, because PLM-ICD’s confidence is just borderline between positive or negative. Finally, rule number 3 determines that when PLM-ICD gives a very low probability of being positive to a code, it is not screened by ICS, being accepted as a negative candidate.
6. Discussion
In this section, a discussion of the results, regarding the use of the improved Cosine method and PLM-ICD-C, is presented.
6.1. Data Limitations
MIMIC-IV contains data from the emergency department and ICU of a single hospital [
13], which may also introduce bias in data. Additionally, it is easier to code shorter summaries from outpatient than for inpatient. Medical coding is prone to errors, and often there is also a degree of subjectivity in the matter. Ref. [
29] found an overall median accuracy of 83.2%, and [
30] concluded that 35% of the common codes in MIMIC-III, were under-coded.
6.2. Cosine Method
The Cosine method is penalized when there are few or no biomedical words in the text. This happens for the MIMIC-IV dataset, where it is found that many codes and their biomedical words do not appear in the EHR, making it hard to reach high similarity with the Cosine method. It is also very sensitive to words, such as “patient”, which are semantically empty for the purpose. These drawbacks were mitigated using strategies such as a blacklist of words, multiple runs and bucket category selection, leading to a novel algorithm called the Improved Cosine method.
6.3. PLM-ICD-C
While analysing
Table 5 and
Table 6 it can be seen that for samples where
, with values of
0.7, 0.5, 0.45, the use of PLM-ICD-C results in a loss of TPs greater than the FPs filtered out, compared to the use of PLM-ICD alone, except for
, which is exemplified in detail in
Figure 3.
On the other hand, in the interval between
and
, with values of 0.7, 0.5, 0.45 for
, and 0.4 for
, the balance is positive, as it can be seen in
Figure 4, where for the use of PLM-ICD-C, there is a loss of TPs inferior to filtered FPs. For
value of 0.4 and
value of 0.2, the balance is positive with a bigger margin.
The use of ICS along with PLM-ICD for , translates into better performance metrics, because it can filter more false positives than using PLM-ICD alone in that interval. In general, it was demonstrated that the use of PLM-ICD-C is more advantageous than using the PLM-ICD alone, due to the greatly improved precision.
6.4. Advantages and Limitations
As discussed above, with the optimised values for the thresholds and , the use of the improved Cosine method coupled to PLM-ICD can be advantageous, allowing to reach more TP while filtering out some possible FP that would slip through PLM-ICD alone and therefore affect precision.
The Cosine method has one important characteristic, that it does not require training to specific data, for it is a deterministic model, so there is no learning bias. The multiple runs and bucket category methods are also deterministic, even though specific parameters can be adjusted for better performance.
In future work, it will be useful to use not only the NER model for diseases and chemicals, as was performed, but for other biomedical terms too. The NER model used, “en_ner_bc5cdr_md” (
https://allenai.github.io/scispacy/, accessed on 10 October 2023), only recognizes entities of diseases and chemicals. For example, the entity “pregnancy” is neither a disease nor a chemical. Nonetheless, it is present in some ICD-10 code descriptions and may be important for accurate code retrieval. It is not recognized by this NER model, thus not contributing to retrieve important ICD-10 codes when calculating the similarity between the EHR text and ICD-10 descriptions.
In the Cosine method implementation, a few synonyms for diseases were considered, namely “angioectasia” as “angiodysplasia”, “dyslipidemia” as “hyperlipidemia”, “tobacco” as “nicotine”, and “smoking” as “nicotine”, making it limited in the vocabulary and consequently in the results. A more comprehensive list of synonyms will most probably lead to better results, but it was out of the scope of the current project.
Overall, PLM-ICD-C can be useful to provide code suggestions to the medical coders, and suggest more of the codes that the clinical record contains than PLM-ICD alone.
The computation required to perform experiments with MIMIC-IV makes it difficult to optimise the values of the thresholds used. Additionally, the experiments described were just performed with one part of the whole MIMIC-IV dataset. Therefore, there may still be room for improvement.
7. Conclusions
The classification of EHRs from text into diagnostic codes has been challenging to the NLP community. The proposed methodology relies on a method based on Cosine similarity between the clinical record and the ICD-10 code description, using a strategy of using the conceived multiple runs algorithm along with the concept of the bucket category.
Comparing the F1-score obtained with PLM-ICD for the test set used, it is inferior to the best obtained in the state-of-the-art (46.9% to 58.5%). Since no training or architectural changes were made to PLM-ICD in the current project, the only reasonable explanation for the different results is the difference in the test set used, because Edin et al. used a bigger test set consisting of 24,461 records [
13], in comparison to the 4077 used in this work because of limited computational resources.
The results show that the use of PLM-ICD-C, consisting of the improved Cosine method and PLM-ICD, improved the results, increasing the F1-score by 0.5%, but most important, by increasing the precision from 46.3% to 50%, which means a significant improvement on the code suggestions given to the medical doctors performing encoding functions.
The use of ICS is not advantageous for values of above or below , where it is more reliable to use only the PLM-ICD. For values of between and values, then PLM-ICD-C, with the use of ICS, is a better choice.
In future work, the improved Cosine method can be applied to other datasets that overcome the limitations that MIMIC-IV may have. The dictionary of synonyms, where only four pairs were used, just as a proof of concept, shall also be expanded. A more complete NER model can also be used, to detect other biomedical terms, and not only diseases.
Author Contributions
Conceptualization, M.M. (Mateus Mendes); Methodology, V.D. and M.M. (Mário Macedo); Software, H.S.; Validation, V.D.; Investigation, H.S.; Resources, M.M. (Mário Macedo); Data curation, H.S. and V.D.; Writing—original draft, H.S.; Writing—review & editing, M.M. (Mateus Mendes); Supervision, M.M. (Mário Macedo) and M.M. (Mateus Mendes). All authors have read and agreed to the published version of the manuscript.
Funding
This work was produced with the support of INCD funded by FCT and FEDER under the project 01/SAICT/2016 n° 022153. This work received financial support from the Polytechnic Institute of Coimbra within the scope of Regulamento de Apoio à Publicação Científica dos Estudantes do Instituto Politécnico de Coimbra (Despacho n.° 5545/2020).
Data Availability Statement
No new data were created or analyzed in this study. Data sharing is not applicable to this article.
Conflicts of Interest
The authors declare no conflicts of interest.
References
- International Classification of Diseases 11th Revision. Available online: https://www.who.int/standards/classifications/classification-of-diseases (accessed on 10 March 2024).
- Alonso, V.; Santos, J.V.; Pinto, M.; Ferreira, J.; Lema, I.; Lopes, F.; Freitas, A. Health records as the basis of clinical coding: Is the quality adequate? A qualitative study of medical coders’ perceptions. Health Inf. Manag. J. 2020, 49, 28–37. [Google Scholar] [CrossRef] [PubMed]
- Lucyk, K.; Tang, K.; Quan, H. Barriers to data quality resulting from the process of coding health information to administrative data: A qualitative study. BMC Health Serv. Res. 2017, 17, 766. [Google Scholar] [CrossRef]
- Kormilitzin, A.; Vaci, N.; Liu, Q.; Nevado-Holgado, A. Med7: A transferable clinical natural language processing model for electronic health records. Artif. Intell. Med. 2021, 118, 102086. [Google Scholar] [CrossRef]
- Li, I.; Pan, J.; Goldwasser, J.; Verma, N.; Wong, W.P.; Nuzumlalı, M.Y.; Rosand, B.; Li, Y.; Zhang, M.; Chang, D.; et al. Neural natural language processing for unstructured data in electronic health records: A review. Comput. Sci. Rev. 2022, 46, 100511. [Google Scholar] [CrossRef]
- Devlin, J.; Chang, M.W.; Lee, K.; Toutanova, K. Bert: Pre-training of deep bidirectional transformers for language understanding. arXiv 2018, arXiv:1810.04805. [Google Scholar]
- Lee, J.; Yoon, W.; Kim, S.; Kim, D.; Kim, S.; So, C.H.; Kang, J. BioBERT: A pre-trained biomedical language representation model for biomedical text mining. Bioinformatics 2020, 36, 1234–1240. [Google Scholar] [CrossRef]
- Alsentzer, E.; Murphy, J.R.; Boag, W.; Weng, W.H.; Jin, D.; Naumann, T.; McDermott, M. Publicly available clinical BERT embeddings. arXiv 2019, arXiv:1904.03323. [Google Scholar]
- Gu, Y.; Tinn, R.; Cheng, H.; Lucas, M.; Usuyama, N.; Liu, X.; Naumann, T.; Gao, J.; Poon, H. Domain-specific language model pretraining for biomedical natural language processing. ACM Trans. Comput. Healthc. (HEALTH) 2021, 3, 1–23. [Google Scholar] [CrossRef]
- Lewis, P.; Ott, M.; Du, J.; Stoyanov, V. Pretrained language models for biomedical and clinical tasks: Understanding and extending the state-of-the-art. In Proceedings of the 3rd Clinical Natural Language Processing Workshop, Online, 19 November 2020; pp. 146–157. [Google Scholar]
- Zhang, Z.; Liu, J.; Razavian, N. BERT-XML: Large scale automated ICD coding using BERT pretraining. arXiv 2020, arXiv:2006.03685. [Google Scholar]
- Huang, C.W.; Tsai, S.C.; Chen, Y.N. PLM-ICD: Automatic ICD coding with pretrained language models. arXiv 2022, arXiv:2207.05289. [Google Scholar]
- Edin, J.; Junge, A.; Havtorn, J.D.; Borgholt, L.; Maistro, M.; Ruotsalo, T.; Maaløe, L. Automated Medical Coding on MIMIC-III and MIMIC-IV: A Critical Review and Replicability Study. arXiv 2023, arXiv:2304.10909. [Google Scholar]
- Falter, M.; Godderis, D.; Scherrenberg, M.; Kizilkilic, S.E.; Xu, L.; Mertens, M.; Jansen, J.; Legroux, P.; Kindermans, H.; Sinnaeve, P. Using Natural Language Processing for Automated Classification of Disease and to Identify Misclassified ICD Codes in Cardiac Disease. Eur. Heart J. Digit. Health 2024, ztae008. [Google Scholar] [CrossRef]
- Silva, A.; Chaves, P.; Rijo, S.; Bone, J.; Oliveira, T.; Novais, P. Leveraging TFR-BERT for ICD Diagnoses Ranking. In Proceedings of the EPIA Conference on Artificial Intelligence, Horta, Portugal, 31 August–2 September 2023. [Google Scholar]
- Falter, M.; Godderis, D.; Scherrenberg, M.; Kizilkilic, S.E.; Xu, L.; Mertens, M.; Dendale, P. Automatic International Classification of Diseases Coding System: Deep Contextualized Language Model with Rule-Based Approaches; JMIR Publications Inc.: Toronto, ON, Canada, 2022. [Google Scholar]
- Silvestri, S.; Gargiulo, F.; Ciampi, M.; De Pietro, G. Exploit multilingual language model at scale for ICD-10 clinical text classification. In Proceedings of the 2020 IEEE Symposium on Computers and Communications (ISCC), Rennes, France, 7–10 July 2020. [Google Scholar]
- Yu, X.; Hu, W.; Lu, S.; Sun, X.; Yuan, Z. BioBERT based named entity recognition in electronic medical record. In Proceedings of the 2019 10th International Conference on Information Technology in Medicine and Education (ITME), Qingdao, China, 23–25 August 2019. [Google Scholar]
- Chen, P.F.; Wang, S.M.; Liao, W.C.; Kuo, L.C.; Chen, K.C.; Lin, Y.C.; Yang, C.Y.; Chiu, C.H.; Chang, S.C.; Lai, F.; et al. Automatic ICD-10 coding and training system: Deep neural network based on supervised learning. JMIR Med. Inform. 2021, 9, e23230. [Google Scholar] [CrossRef] [PubMed]
- Choi, E.; Bahadori, M.T.; Schuetz, A.; Stewart, W.F.; Sun, J. Doctor ai: Predicting clinical events via recurrent neural networks. In Proceedings of the Machine Learning for Healthcare Conference (PMLR), Los Angeles, CA, USA, 19–20 August 2016; pp. 301–318. [Google Scholar]
- Li, F.; Yu, H. ICD coding from clinical text using multi-filter residual convolutional neural network. In Proceedings of the AAAI Conference on Artificial Intelligence, New York, NY, USA, 7–12 February 2020; Volume 34, pp. 8180–8187. [Google Scholar]
- Mullenbach, J.; Wiegreffe, S.; Duke, J.; Sun, J.; Eisenstein, J. Explainable prediction of medical codes from clinical text. arXiv 2018, arXiv:1802.05695. [Google Scholar]
- Shi, H.; Xie, P.; Hu, Z.; Zhang, M.; Xing, E.P. Towards automated ICD coding using deep learning. arXiv 2017, arXiv:1711.04075. [Google Scholar]
- Teng, F.; Liu, Y.; Li, T.; Zhang, Y.; Li, S.; Zhao, Y. A review on deep neural networks for ICD coding. IEEE Trans. Knowl. Data Eng. 2022, 35, 4357–4375. [Google Scholar] [CrossRef]
- Johnson, A.E.; Bulgarelli, L.; Shen, L.; Gayles, A.; Shammout, A.; Horng, S.; Pollard, T.J.; Hao, S.; Moody, B.; Gow, B.; et al. MIMIC-IV, a freely accessible electronic health record dataset. Sci. Data 2023, 10, 1. [Google Scholar] [CrossRef]
- Gupta, M.; Gallamoza, B.; Cutrona, N.; Dhakal, P.; Poulain, R.; Beheshti, R. An extensive data processing pipeline for mimic-iv. In Proceedings of the Machine Learning for Health (PMLR), New Orleans, LA, USA, 28 November 2022; pp. 311–325. [Google Scholar]
- Guide to Classification on Imbalanced Datasets. Available online: https://resources.experfy.com/ai-ml/imbalanced-datasets-guide-classification/ (accessed on 10 March 2024).
- Vu, T.; Nguyen, D.Q.; Nguyen, A. A label attention model for icd coding from clinical text. arXiv 2020, arXiv:2007.06351. [Google Scholar]
- Burns, E.M.; Rigby, E.; Mamidanna, R.; Bottle, A.; Aylin, P.; Ziprin, P.; Faiz, O. Systematic review of discharge coding accuracy. J. Public Health 2012, 34, 138–148. [Google Scholar] [CrossRef]
- Searle, T.; Ibrahim, Z.; Dobson, R.J. Experimental evaluation and development of a silver-standard for the MIMIC-III clinical coding dataset. arXiv 2020, arXiv:2006.07332. [Google Scholar]
Figure 1.
Flowchart of the algorithm developed, showing the bucket category concept of ICS.
Figure 1.
Flowchart of the algorithm developed, showing the bucket category concept of ICS.
Figure 2.
PLM-ICD-C architecture.
Figure 2.
PLM-ICD-C architecture.
Figure 3.
Dynamics of lost TP and filtered FP for PLM-ICD-C for samples with , for different values of .
Figure 3.
Dynamics of lost TP and filtered FP for PLM-ICD-C for samples with , for different values of .
Figure 4.
Dynamics of lost TP and filtered FP for PLM-ICD-C for samples with similarity in the range , for different values of and .
Figure 4.
Dynamics of lost TP and filtered FP for PLM-ICD-C for samples with similarity in the range , for different values of and .
Table 1.
Summary of the truth values resulting from applying the PLM-ICD-C rules.
Table 1.
Summary of the truth values resulting from applying the PLM-ICD-C rules.
| | Prediction | Label | Result |
|---|
| - | Positive | Positive | TP |
| Negative | FP |
| | Positive | Positive | TP |
| Negative | FP |
| Negative | Positive | FN |
| Negative | TN |
| - | Negative | Positive | FN |
| Negative | TN |
Table 2.
Metric (micro-average) results for the Cosine method, without bucket category concept.
Table 2.
Metric (micro-average) results for the Cosine method, without bucket category concept.
| Micro-Avg | Precision | Recall | F1-Score |
|---|
| Approach 1 (11 runs) | 0.045 | 0.111 | 0.064 |
| Approach 2 (five runs) | 0.055 | 0.087 | 0.068 |
| Approach 3 (11 runs, similarity threshold 0.2) | 0.047 | 0.104 | 0.065 |
Table 3.
Metric (micro-average) results, for the Cosine method with bucket category concept.
Table 3.
Metric (micro-average) results, for the Cosine method with bucket category concept.
| Micro-Avg | Precision | Recall | F1-Score |
|---|
| Approach 1 (5 runs) | 0.291 | 0.206 | 0.241 |
| Approach 2 (7 runs) | 0.271 | 0.239 | 0.254 |
| Approach 3 (11 runs) | 0.247 | 0.265 | 0.256 |
Table 4.
Metric (micro-average) results, for PLM-ICD test.
Table 4.
Metric (micro-average) results, for PLM-ICD test.
| Micro-Avg | Precision | Recall | F1-Score |
|---|
| Test (threshold 0.5) | 0.65614 | 0.34544 | 0.45260 |
| Test (threshold 0.4) | 0.60596 | 0.38264 | 0.46907 |
| Test (threshold 0.2) | 0.46282 | 0.47680 | 0.46970 |
Table 5.
Summary of the correct and incorrect results for PLM-ICD-C (1).
Table 5.
Summary of the correct and incorrect results for PLM-ICD-C (1).
| | Result | PLM-ICD | PLM-ICD-C |
|---|
| | TP | 20,280 | 16,969 |
| FP | 10,628 | 7741 |
| FN | - | 3311 |
| TN | - | 2887 |
| | | TP | 2184 | 1659 |
| FP | 3980 | 2801 |
| FN | - | 525 |
| TN | - | 1179 |
| - | FN | 36,244 | - |
| TN | 396,337,471 | - |
Table 6.
Summary of the correct and incorrect results for PLM-ICD-C (2).
Table 6.
Summary of the correct and incorrect results for PLM-ICD-C (2).
| | Result | PLM-ICD | PLM-ICD-C |
|---|
| | TP | 22,464 | 18,628 |
| FP | 14,608 | 10,542 |
| FN | - | 3836 |
| TN | - | 4066 |
| | | TP | 5528 | 4140 |
| FP | 17,882 | 11,987 |
| FN | - | 1388 |
| TN | - | 5895 |
| - | FN | 30,716 | - |
| TN | 396,319,589 | - |
Table 7.
Comparison of results while using PLM-ICD threshold 0.4, and PLM-ICD-C (1) with ≥ 0.5 and ≥ 0.002.
Table 7.
Comparison of results while using PLM-ICD threshold 0.4, and PLM-ICD-C (1) with ≥ 0.5 and ≥ 0.002.
| Result | PLM-ICD | PLM-ICD-C | Difference |
|---|
| TP | 20,280 | 16,969 | Lost 3311 |
| FP | 10,628 | 7741 | Filtered 2887 |
Table 8.
Comparison of results while using PLM-ICD threshold 0.2, PLM-ICD-C (2) with ≥ 0.4 and ≥ 0.002.
Table 8.
Comparison of results while using PLM-ICD threshold 0.2, PLM-ICD-C (2) with ≥ 0.4 and ≥ 0.002.
| Result | PLM-ICD | PLM-ICD-C | Difference |
|---|
| TP | 22,464 | 18,628 | Lost 3836 |
| FP | 14,608 | 10,542 | Filtered 4066 |
Table 9.
Comparison of results while using PLM-ICD threshold 0.4 and PLM-ICD (1) with < 0.5, ≥ 0.4 and ≥ 0.002.
Table 9.
Comparison of results while using PLM-ICD threshold 0.4 and PLM-ICD (1) with < 0.5, ≥ 0.4 and ≥ 0.002.
| Result | PLM-ICD | PLM-ICD-C | Difference |
|---|
| TP | 2184 | 1659 | Lost 525 |
| FP | 3980 | 2801 | Filtered 1179 |
Table 10.
Comparison of results while using PLM-ICD threshold 0.2 and PLM-ICD (2) with , ≥ 0.2 and ≥ 0.002.
Table 10.
Comparison of results while using PLM-ICD threshold 0.2 and PLM-ICD (2) with , ≥ 0.2 and ≥ 0.002.
| Result | PLM-ICD | PLM-ICD-C | Difference |
|---|
| TP | 5528 | 4140 | Lost 1388 |
| FP | 17,882 | 11,987 | Filtered 5895 |
Table 11.
Micro-average results, for PLM-ICD thresholds of 0.4 and 0.2, and for PLM-ICD-C (1) and (2).
Table 11.
Micro-average results, for PLM-ICD thresholds of 0.4 and 0.2, and for PLM-ICD-C (1) and (2).
| Micro-Avg | Precision | Recall | F1-Score |
|---|
| PLM-ICD (threshold 0.4) | 0.60596 | 0.38264 | 0.46907 |
| PLM-ICD (threshold 0.2) | 0.46282 | 0.47680 | 0.46970 |
| PLM-ICD-C (1) | 0.62031 | 0.37370 | 0.46641 |
| PLM-ICD-C (2) | 0.50008 | 0.45316 | 0.47547 |
| Disclaimer/Publisher’s Note: The statements, opinions and data contained in all publications are solely those of the individual author(s) and contributor(s) and not of MDPI and/or the editor(s). MDPI and/or the editor(s) disclaim responsibility for any injury to people or property resulting from any ideas, methods, instructions or products referred to in the content. |
© 2024 by the authors. Licensee MDPI, Basel, Switzerland. This article is an open access article distributed under the terms and conditions of the Creative Commons Attribution (CC BY) license (https://creativecommons.org/licenses/by/4.0/).


