
An Experimental Outlook on Quality Metrics for Process Modelling: A Systematic Review and Meta Analysis

Abstract
:
1. Introduction
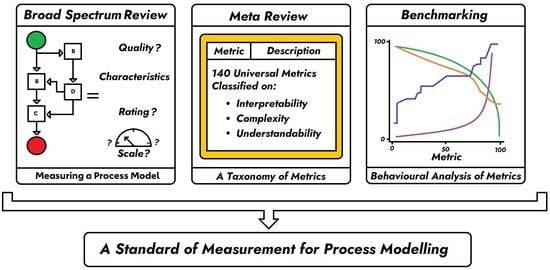
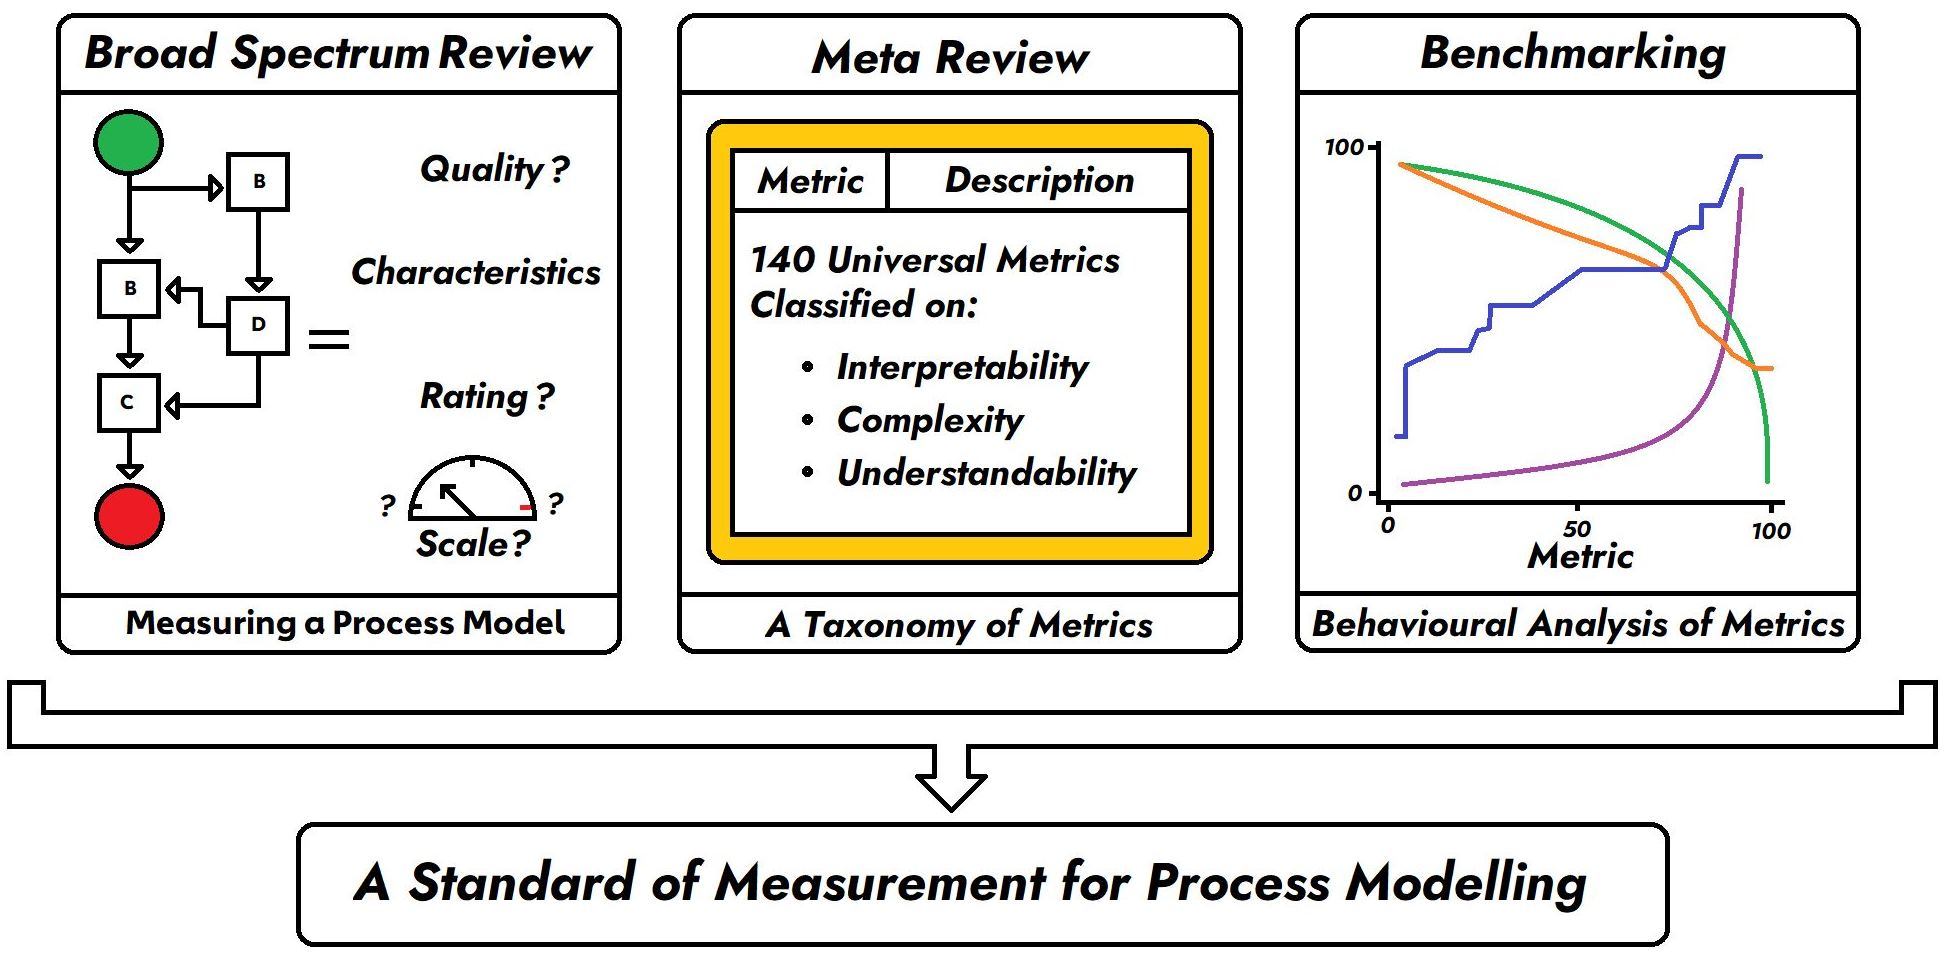
- OBJ 1: To propose a concise solution to the vast amount of metrics in the scientific community;
- OBJ 2: To demonstrate the use of metrics aimed to showcase the evaluation of process models.
2. Literature
2.1. Background
- RQ1: What are the methods to evaluate a process model?;
- RQ2: How has process model evaluation progressed over the years?;
- RQ3: How do we measure the understandability, complexity and interpretability of process models using metrics?
2.2. What Are the Methods to Evaluate a Process Model?
- Guidelines for business process modelling (2000) (GoM) [49]: This is one of the first foundational guidelines and frameworks developed to create an approach to measure the qualities of process models;
- The 7PMG (2010) [30]: A revised and pinpointed version of conditions that a quality dimension or a measure should aim to fulfill in order to generate a process model of good quality;
- Pragmatic guidelines for business process modelling (2014) [29]: A detailed approach to understand the logical and model generation part of quality defintion;
- Quality assessment strategy (2017) [50]: A quality assessment strategy proposed to create evaluation criteria to assess new models;
- Process modelling guidelines (2018) [31]: This is a systematic literature review and experiment showcasing the various metrics, summarised using an internal relevance.
2.3. Meta Review and Evolution
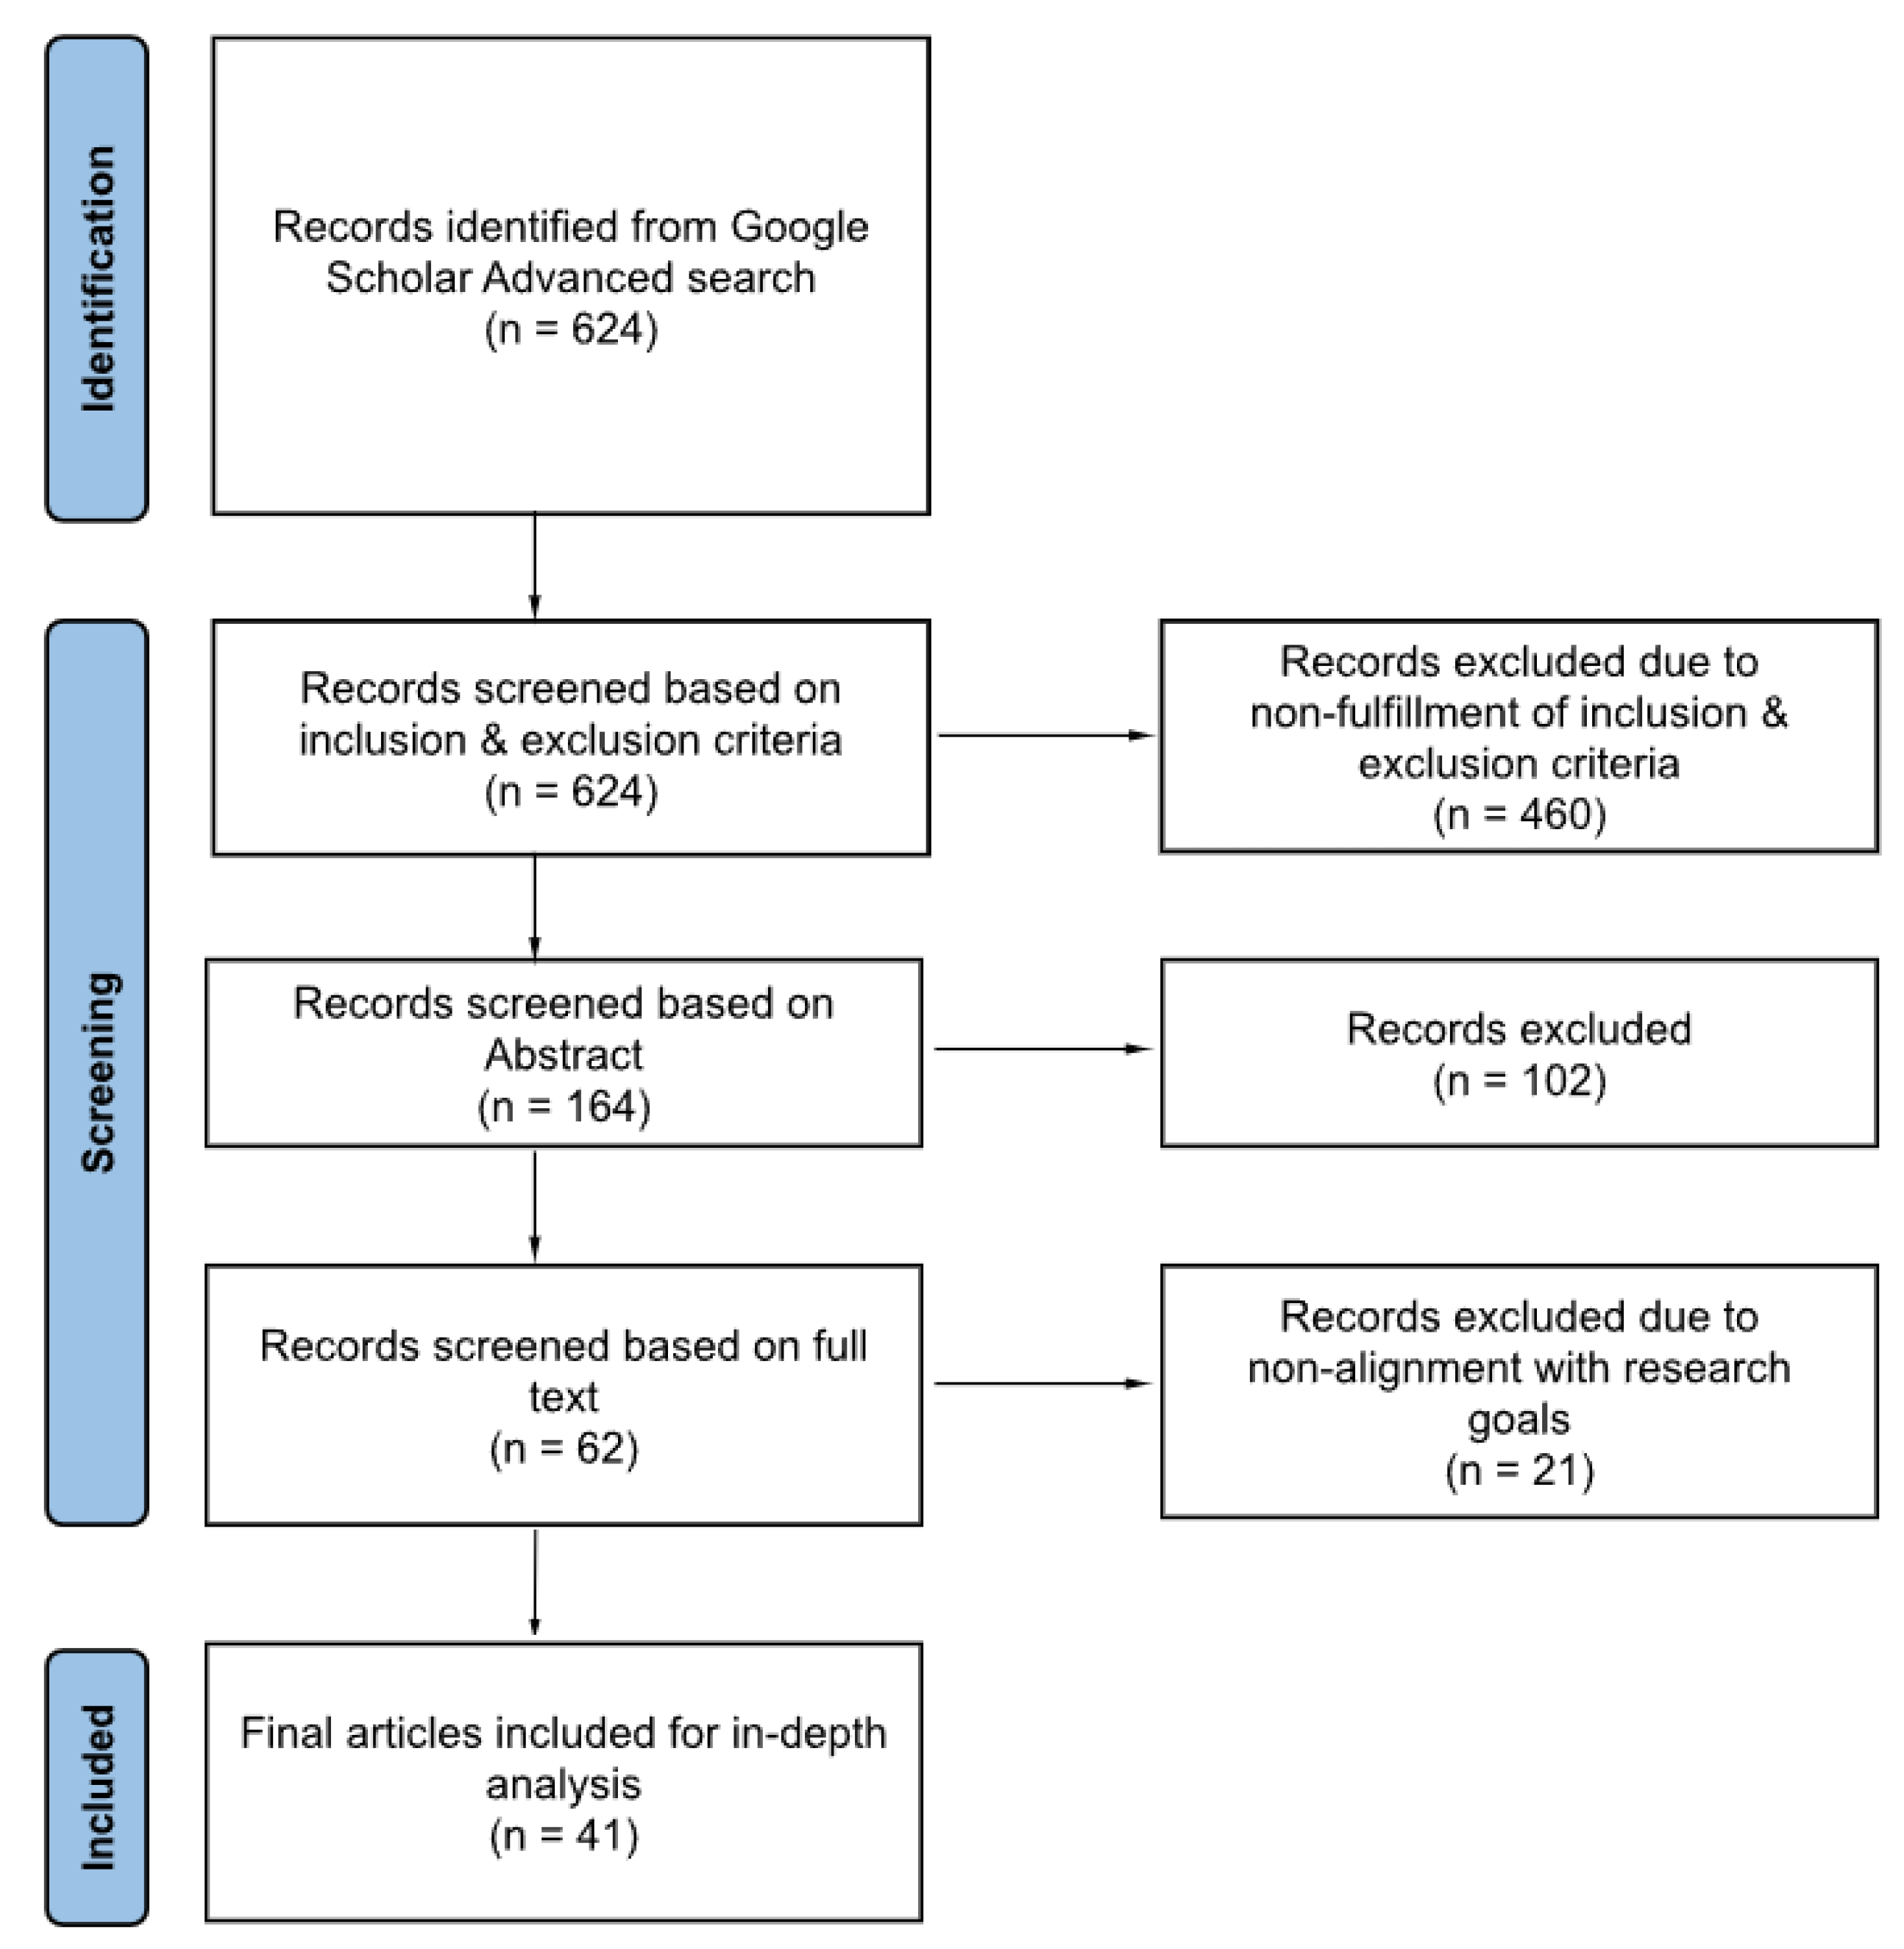
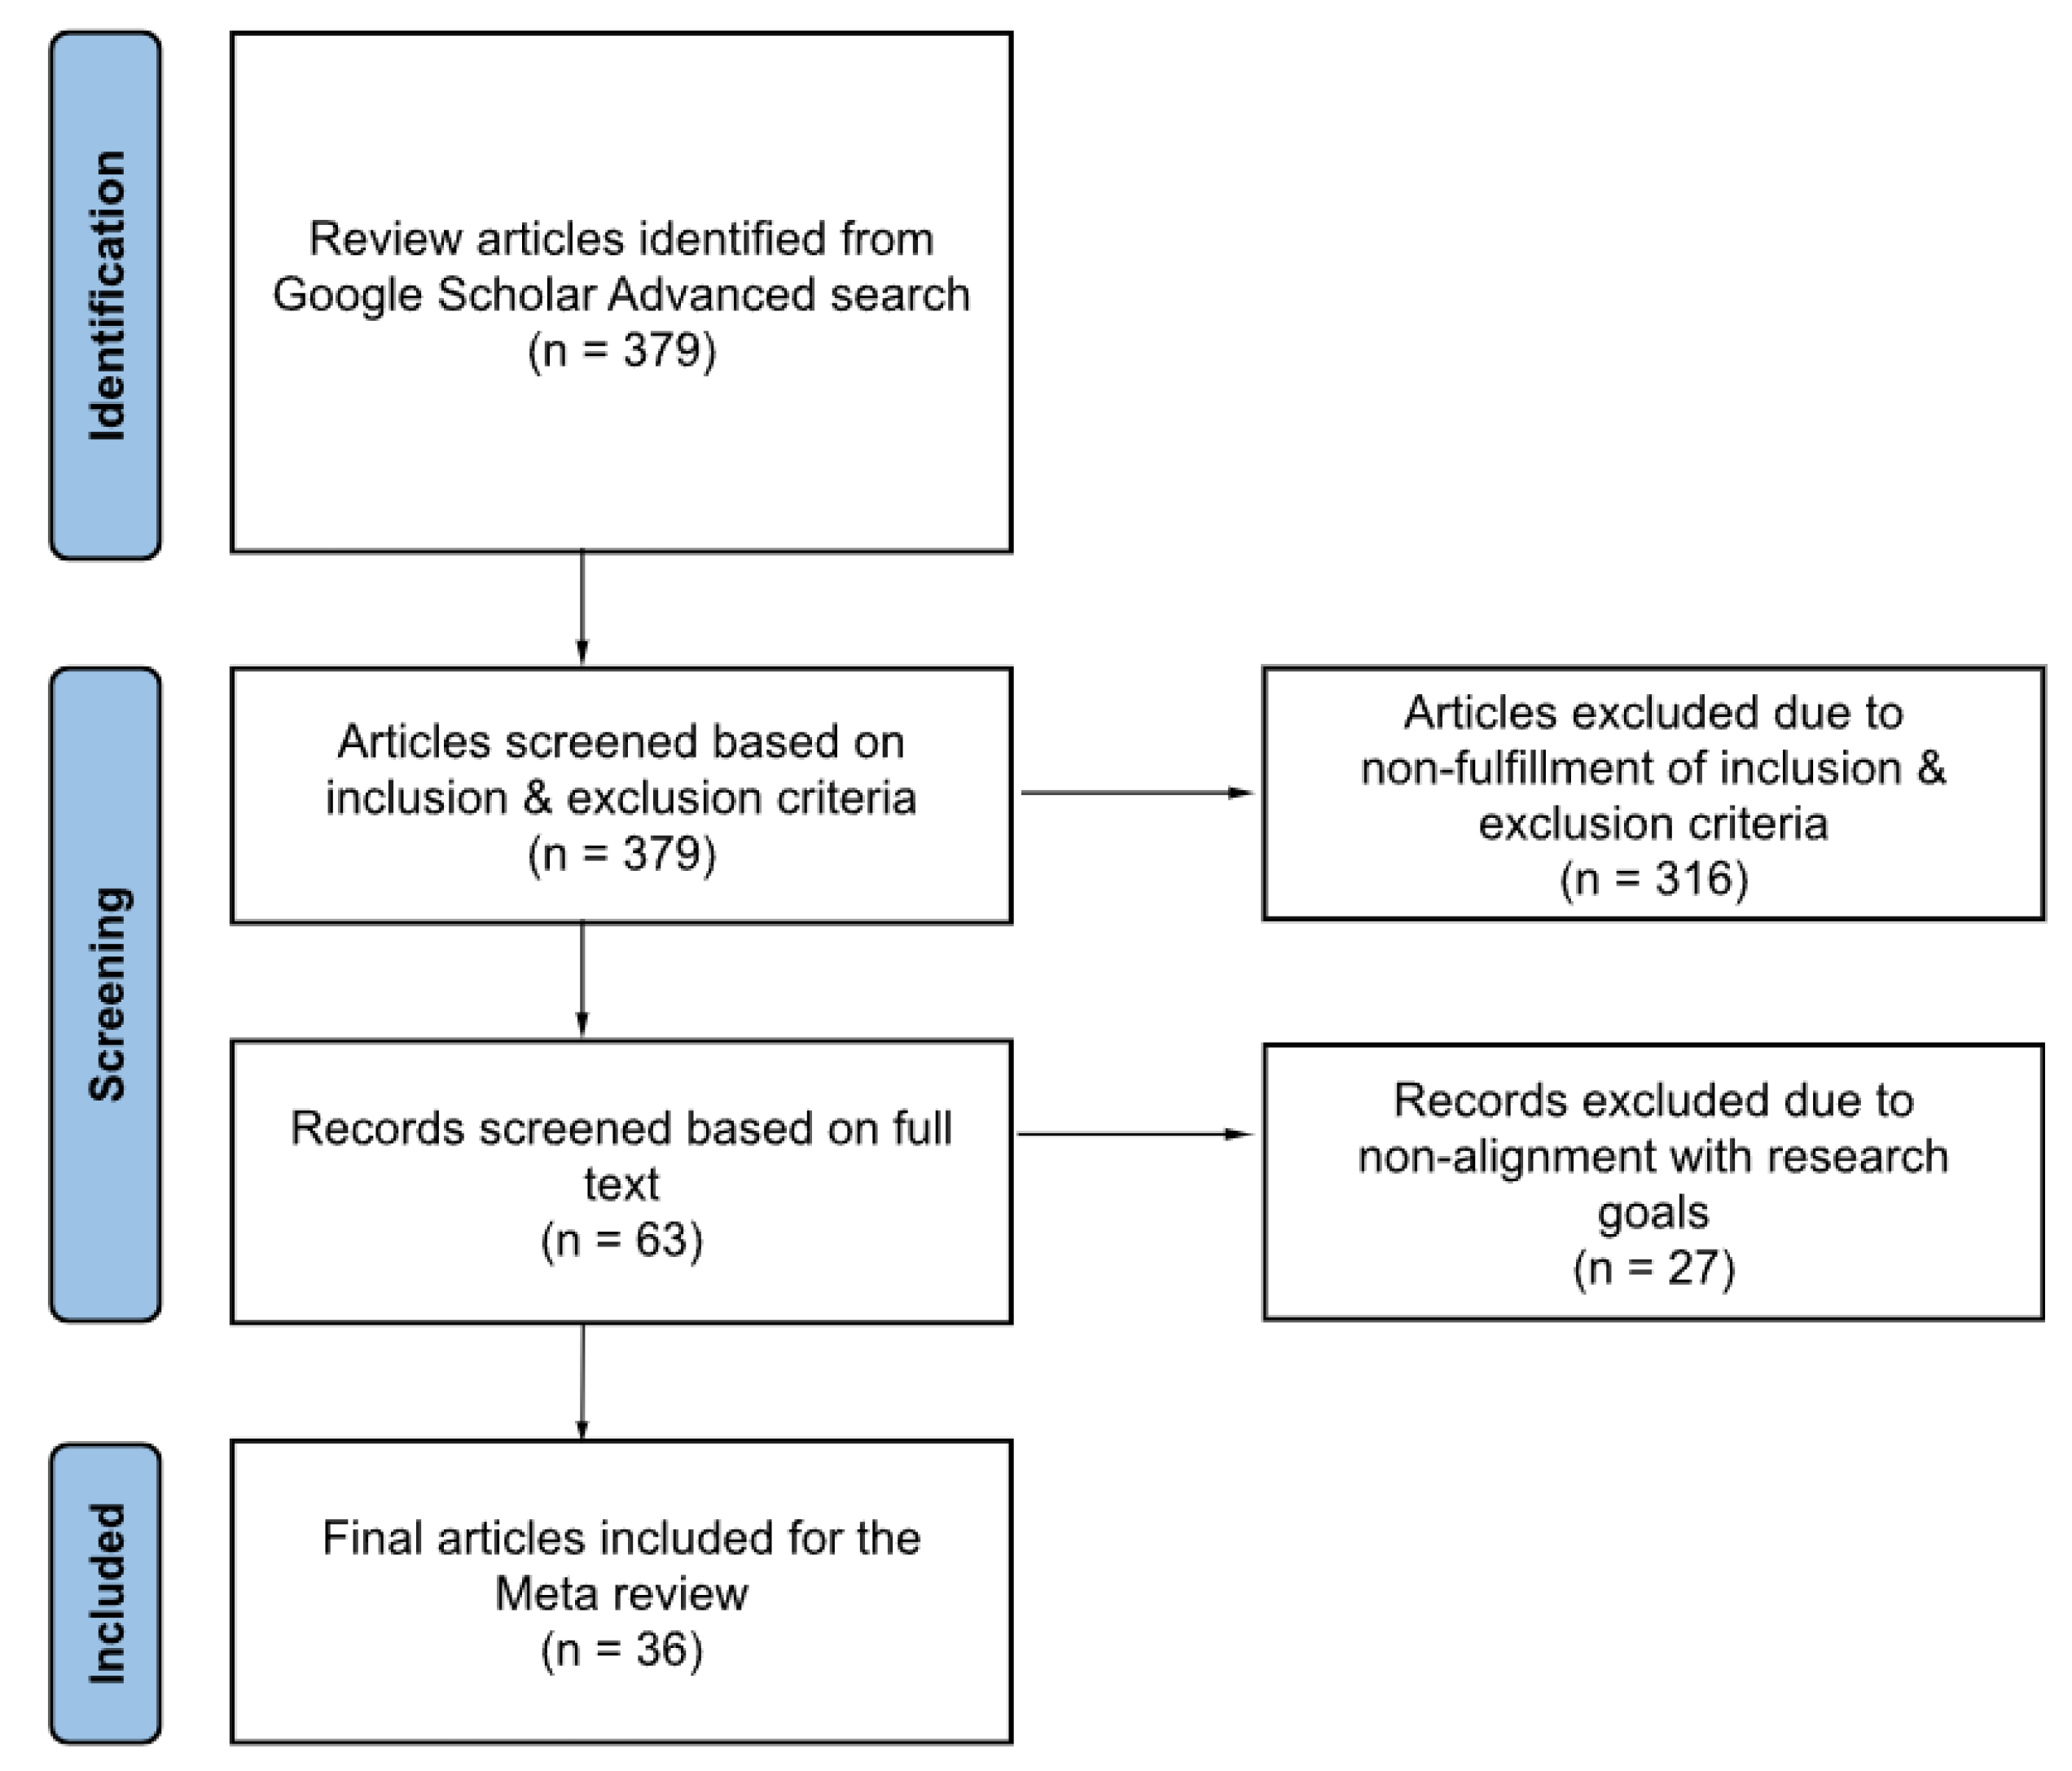
- Should be a review paper;
- Should have been published between 1997 and 2023 (when performing this study, articles published until January 2023 were considered for analysis);
- Should be relevant to process mining and business process modelling;
- Should be aimed at quality, measurement, modularity, evaluation, metrics and complexity for process models or modelling.
- Works that focus on topics other than evaluation (e.g., process algorithms, languages, tools or mining approaches, visualisations, oncology);
- Works that focus only on one metric or one characteristic;
- Works not in English.
- The Name of the metric (Metric);
- The Year of proposal (Year);
- Authors of the metric (Auth);
- Working Definition (Def.);
- Status of Demonstration by the authors (Yes/No) (Demo):
- Yes (Y)—A demonstration of the metric has been provided by the authors in their works;
- No (N)—A demonstration of the metric has not been provided by the authors;
- Type of Metric (Type):
- Scratch (S)—Metrics that are completely designed by the author(s);
- Partially Derived (PD)—Metrics that borrow ideologies but have their own mechanism;
- Derived (D)—Metrics implemented based on existing concepts and measures;
- Source to Original paper (Src).
- Ensure the metrics listed were within the scope of modelling qualities: understandability, complexity and interpretability;
- Link metrics that were conceptually the same but with different authors and explicitly mention them;
- Perform a viability check of the measures (metrics listed should be ideal for universal application, i.e., should utilize the basic three);
- Scrutinise and check if the proposed metric is demonstrated by the author and can be replicated by prospective researchers;
- Mention redundant metrics where necessary;
- Include a mini description to improve readability;
- List the original source of the metric.
3. Methodology
3.1. The QUAD Metrics
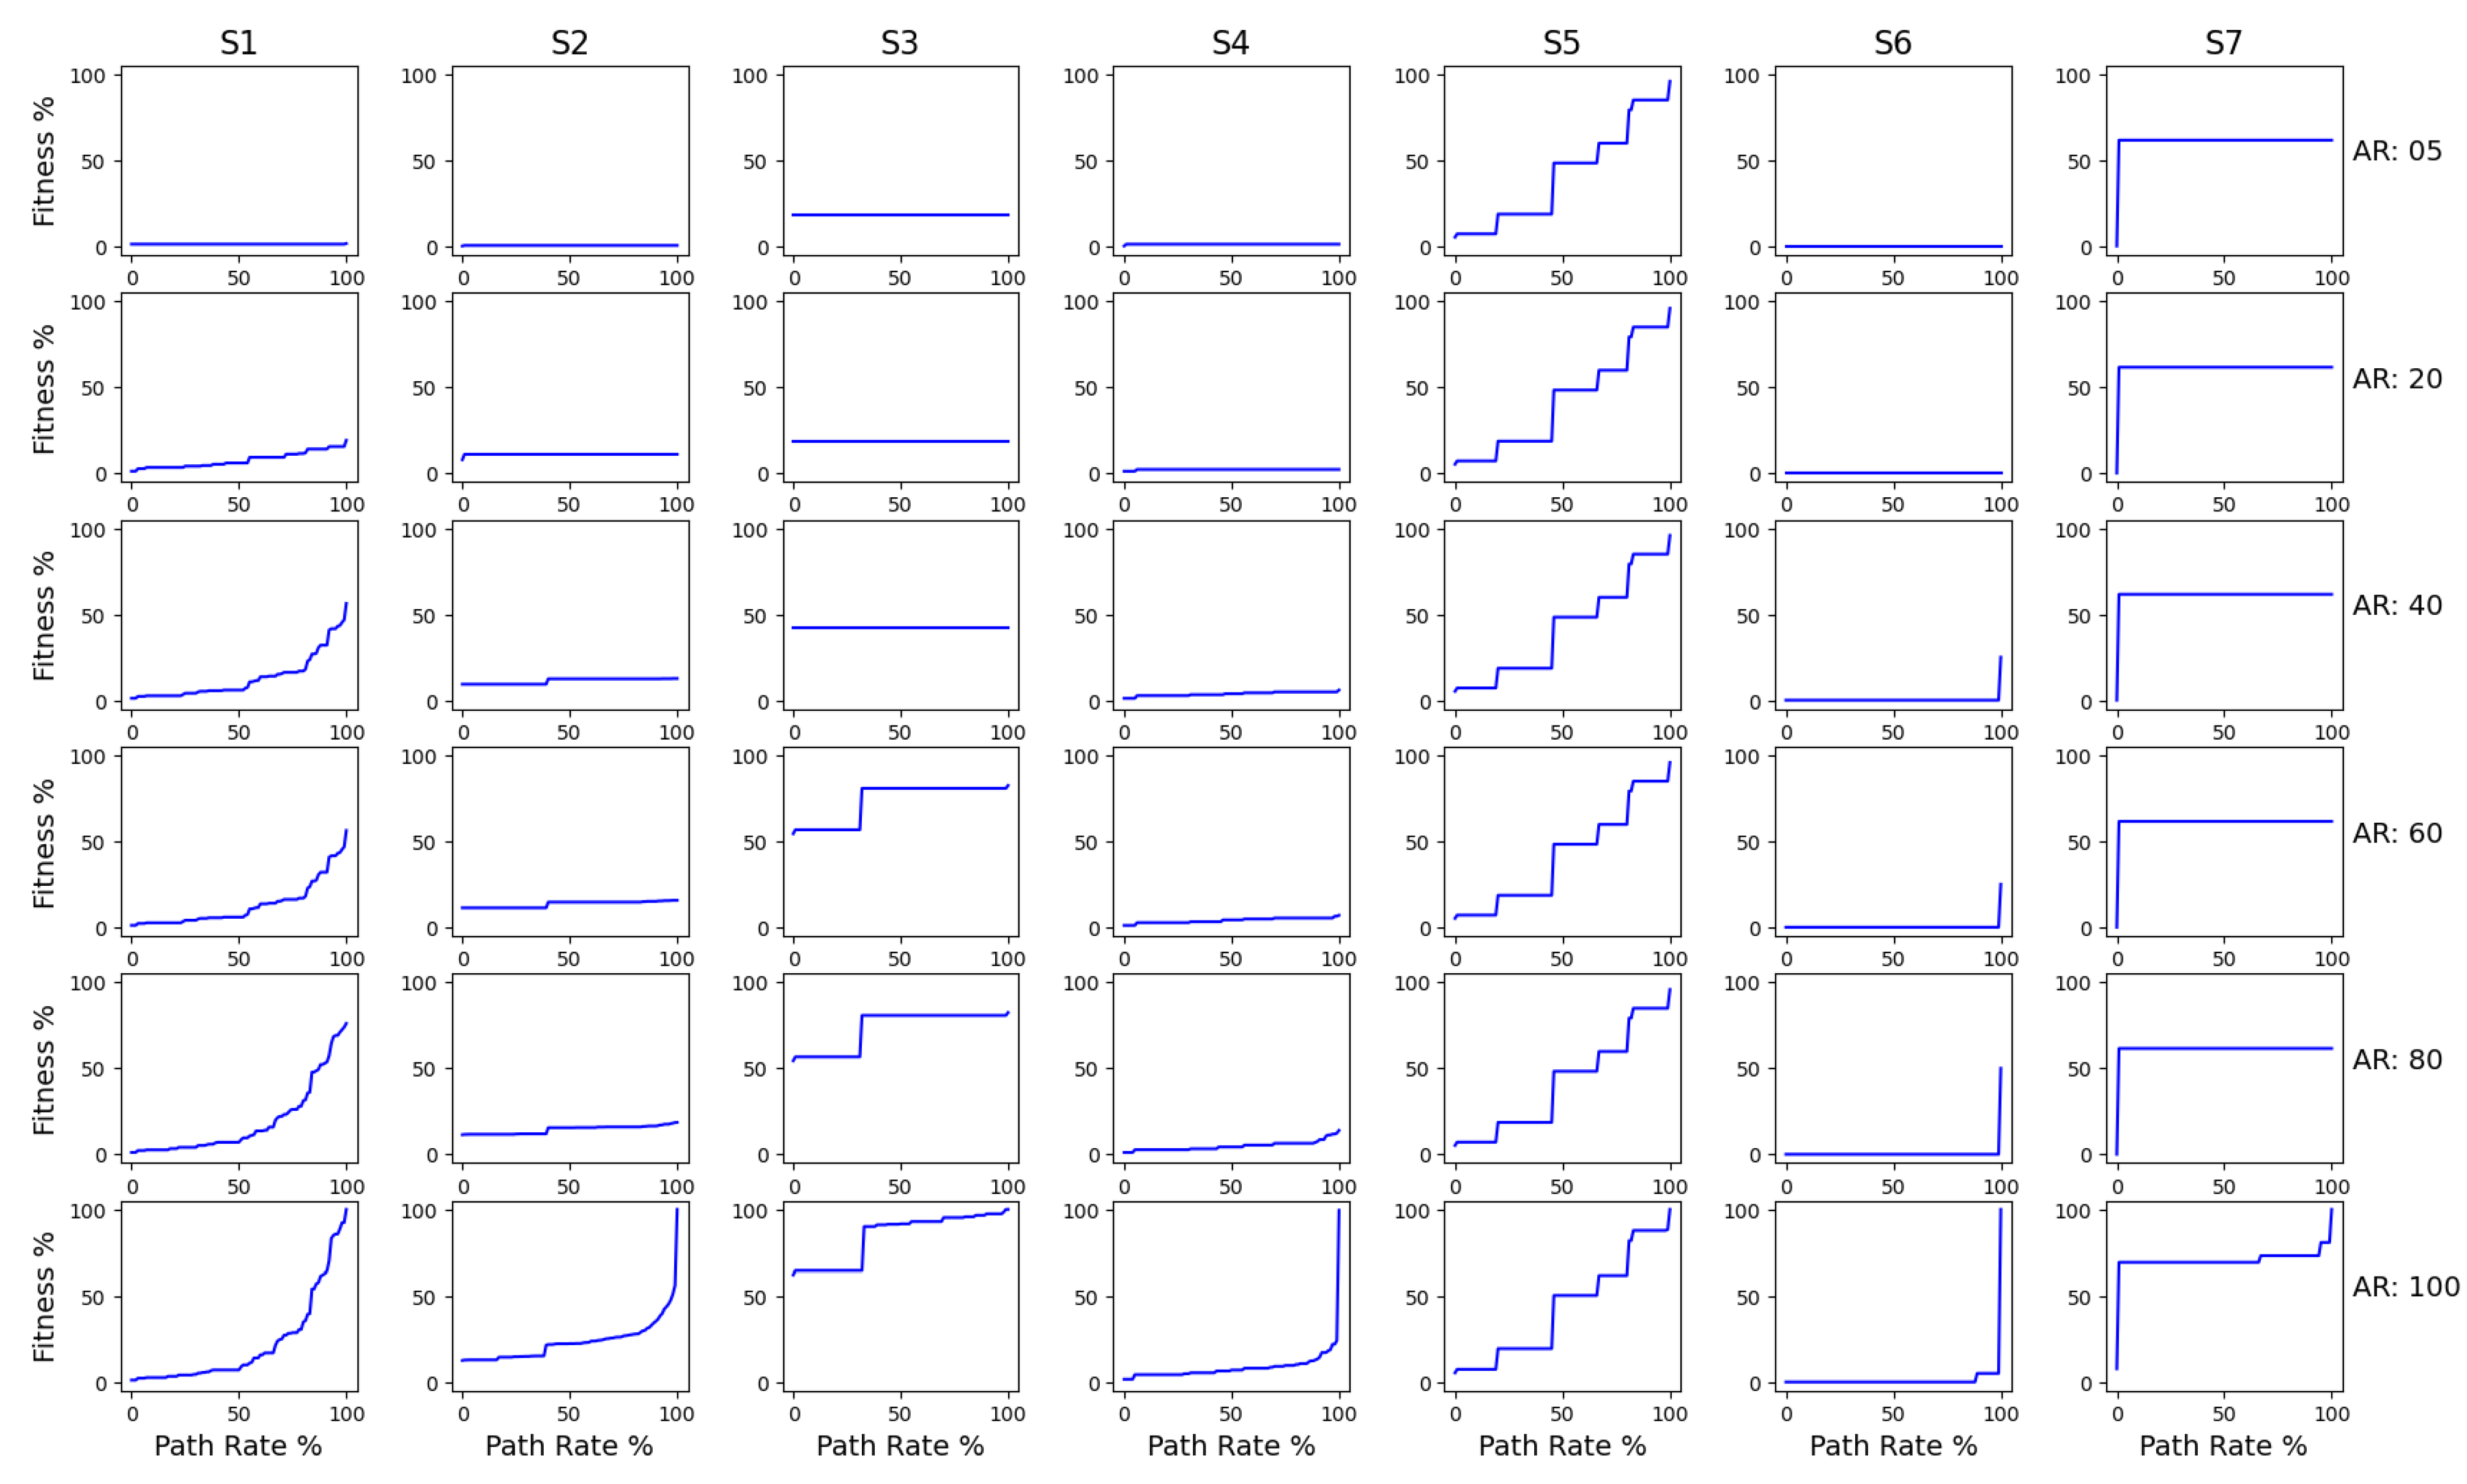
- Replay Fitness: Fitness is a measure that denotes how much of the behaviour present in the event log can be reproduced by the process model. It can be elaborated as the extent to which the model can reproduce the traces recorded in the event log. We have based replay fitness of the work [86]. They have used an alignment-based approach to identify the fitness of process models. This technique aligns as many events as possible from the trace with activities in a single execution of the model. The formulation is as follows:where, is the traces from the event log, is the traces from the process model, is the number of traces, that occur in event log and process model and is the unique cases of events in the event log.In our implementation, the numerator is calculated by aligning every case ID in the event log from start to end and observing if the model can align all of them. In simpler terms, we determine if the process model can replay every single trace as in the event log. The denominator here is the total number of unique case IDs present in the event log. On calculating, we obtain a rating between 0–1, where 1 indicates the process model can fully replay every single trace present in the event log via the generated process model and vice versa. This metric is measured on a scale of 0 to 100%, where 100% indicates the complete alignment of the traces in the event log to that of the model;
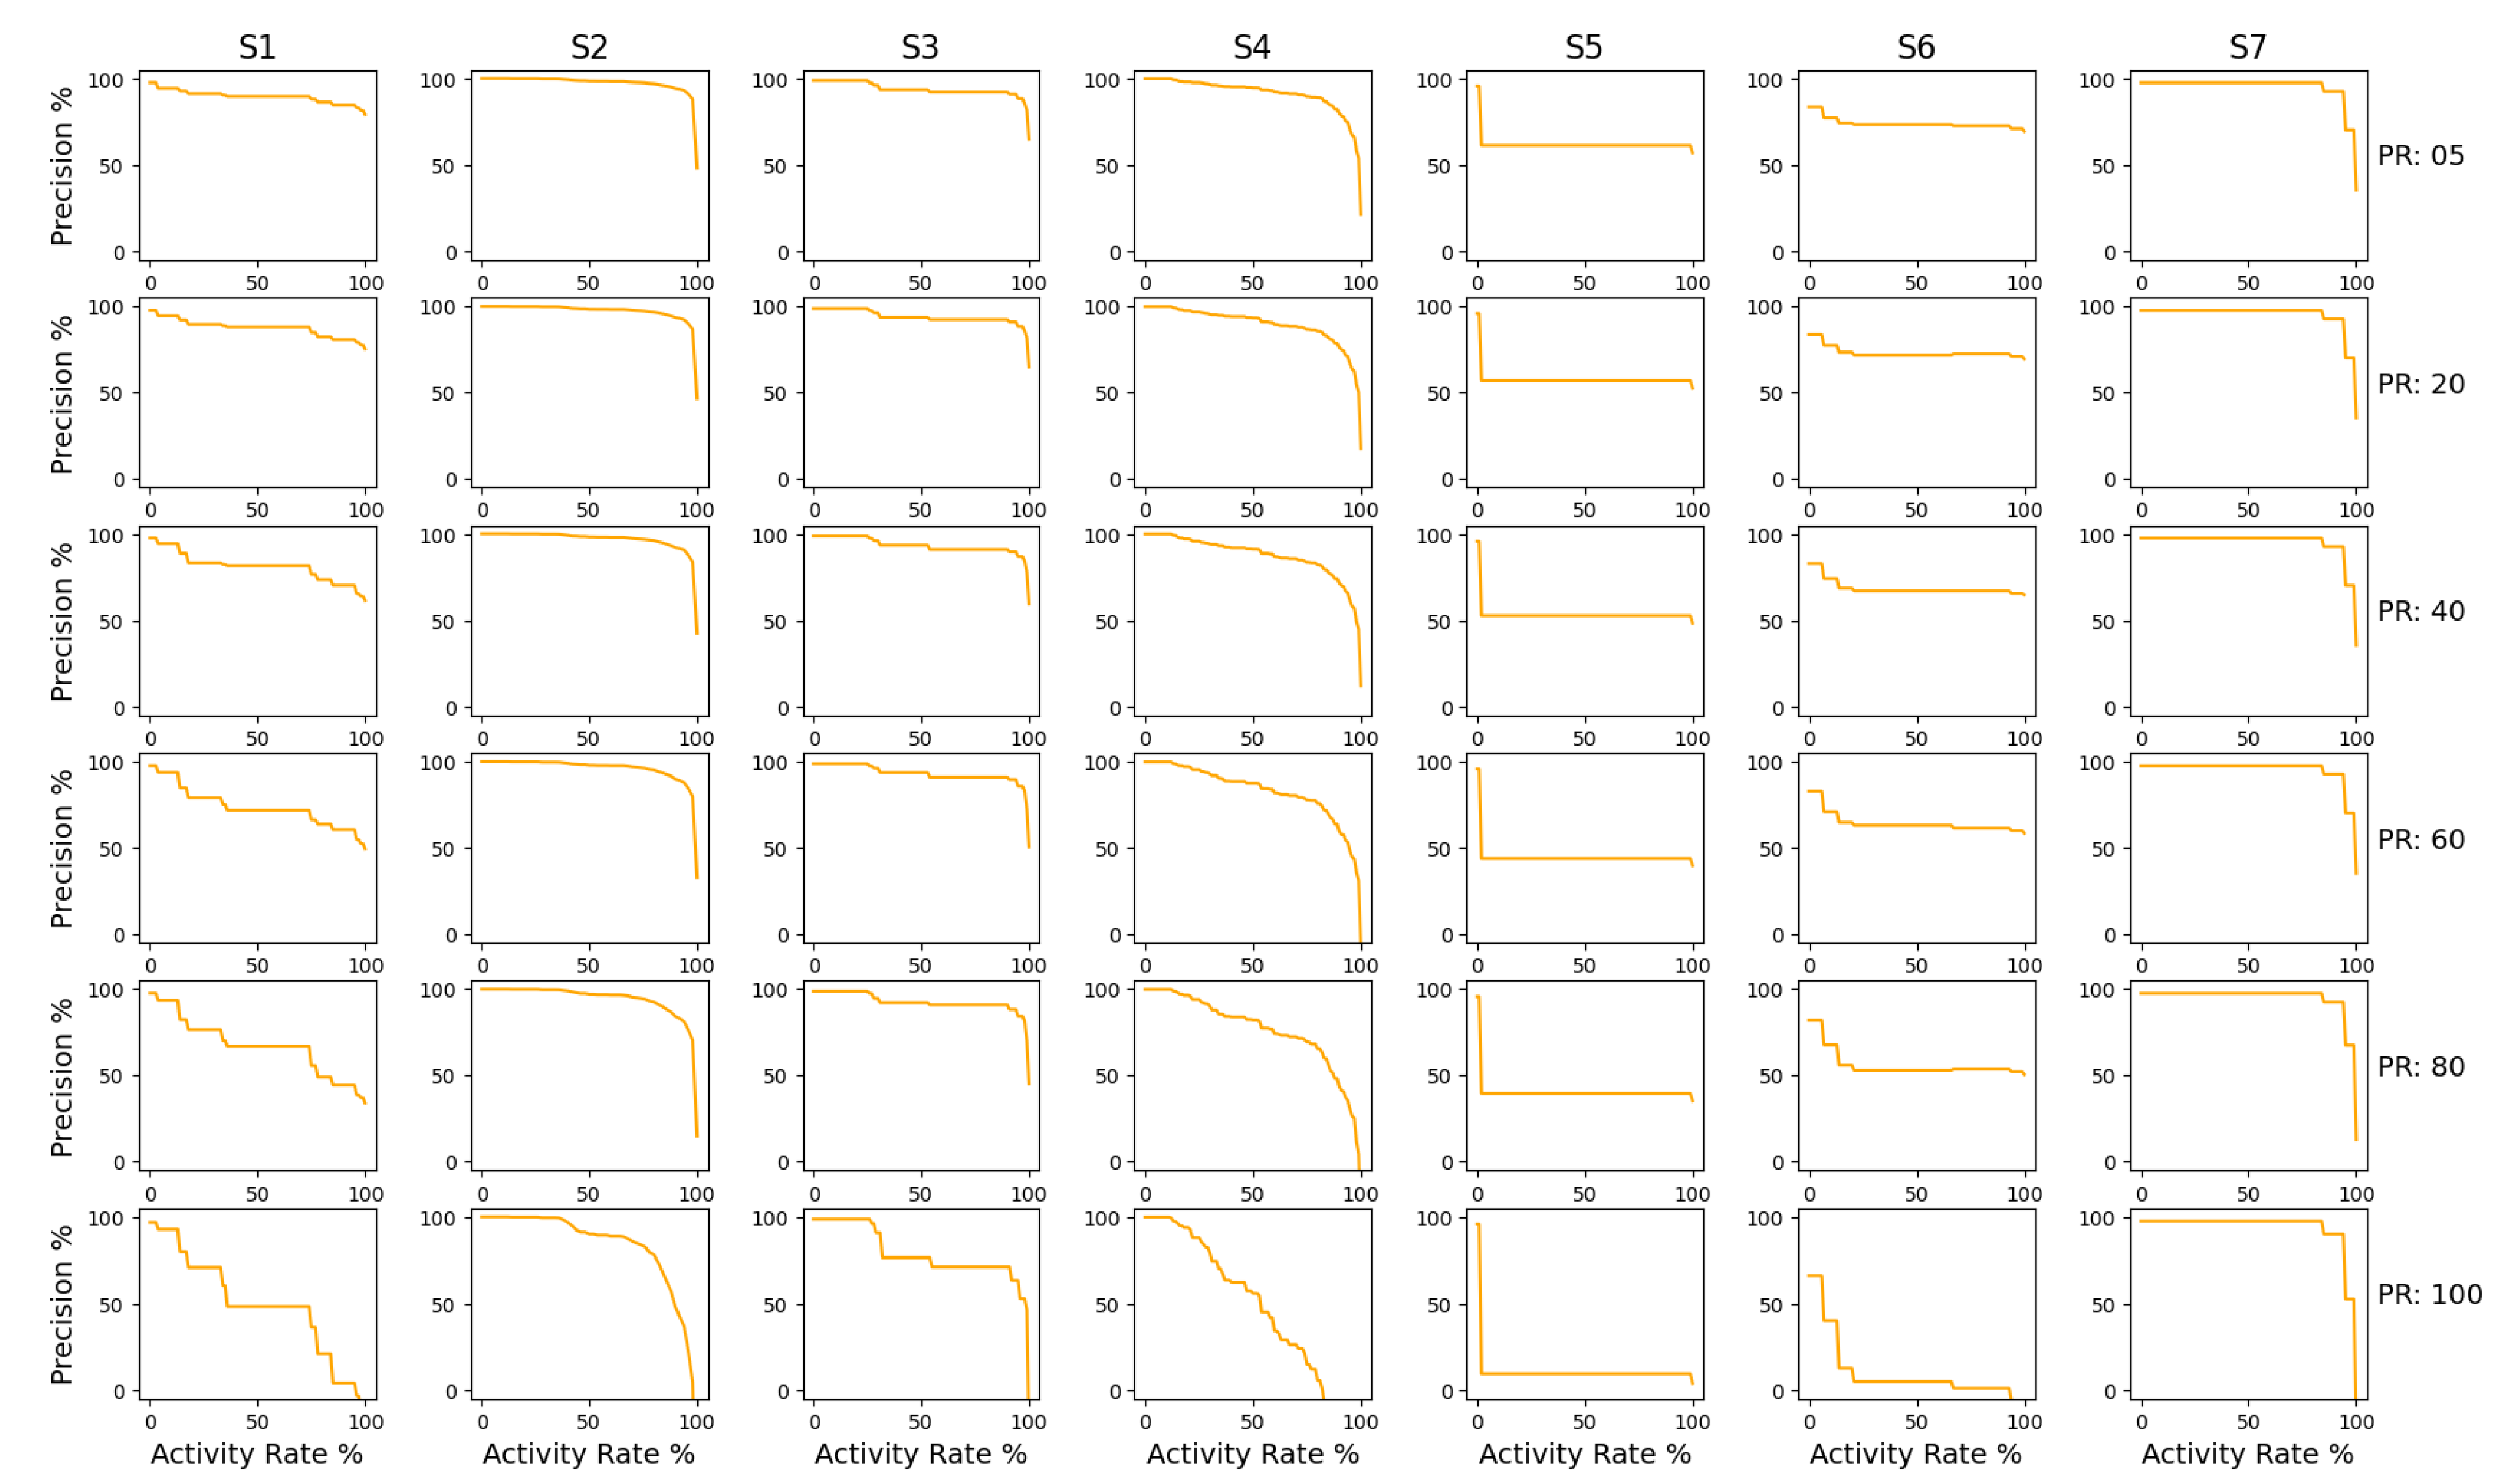
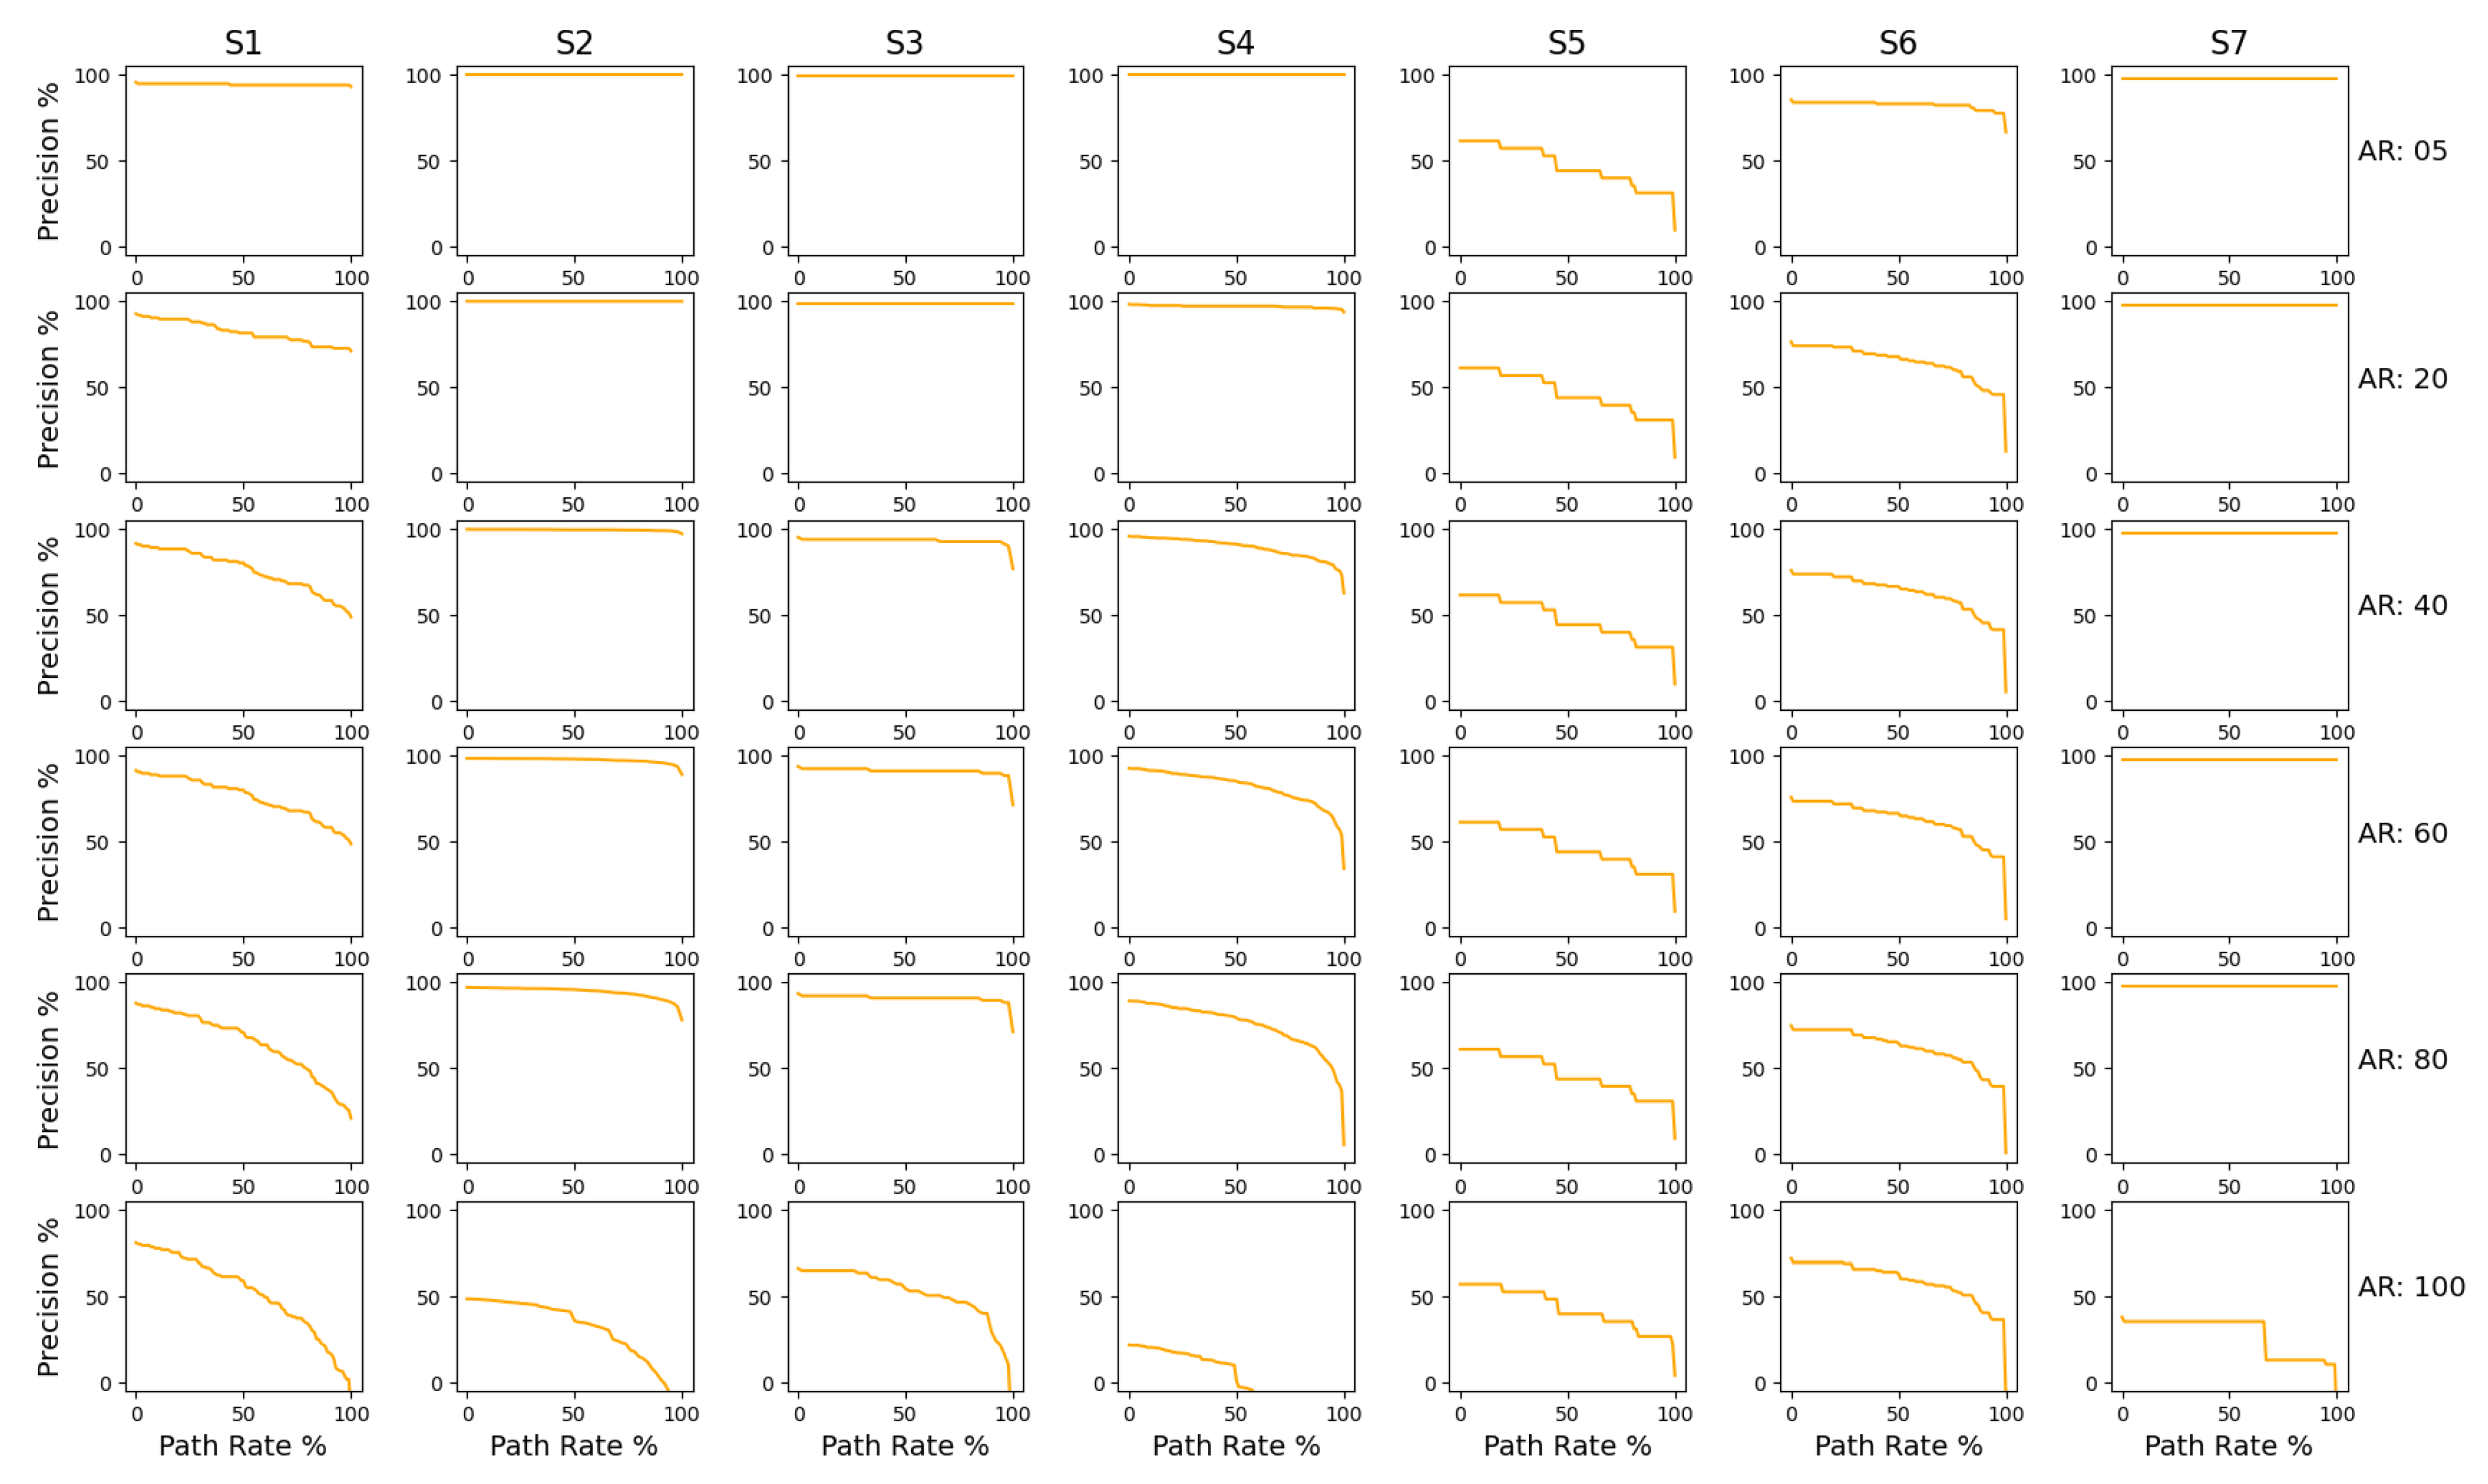
- Precision: Precision is a measure used to show how clearly the process behaviour depicted in the event logs can be captured by the model without oversimplifying the model [86]. The metric aims to find out if there exist decisions that are possible in the model but never made in the log. At first glance, it may seem rather odd, as any mining tool by definition would not intentionally add additional behaviour or, rather, what is not given as input cannot be obtained as output. However, we found that it is possible to have behaviour that is not seen in the event log since there is always a possibility of not including every combination of edges and activities within the log. The measure here is inspired by the so-called escaping edges concept [87,88], where escaping edges are representations of decisions that are not made in the log but exist only in the model. In situations when there are no escaping edges, the model is precise (state = 1). It is formulated as follows:where represents the traces from the event log, represents the traces from the process model, is the number of traces that occur in exclusively in the process model and not the event log and is the unique cases of events in the event log.In our adaption, the numerator is calculated by checking if the process model has additional behaviour which does not exist in the log. Additional behaviour is analysed using individual traces from the event log. The denominator is calculated as the total number of traces in the event log. When new data observed in the process model is not seen in the event log, the model is considered not precise for that respective trace. It is rated between 0 and 1, where 1 signifies the model has high precision. This metric is measured on a scale of 0 to 100%, where 100% indicates no existence of unseen behaviour in the model, as per the log. There is also a contradiction with calculating precision that we have addressed in the discussions in Section 4. Another approach for precision is seen in [89];
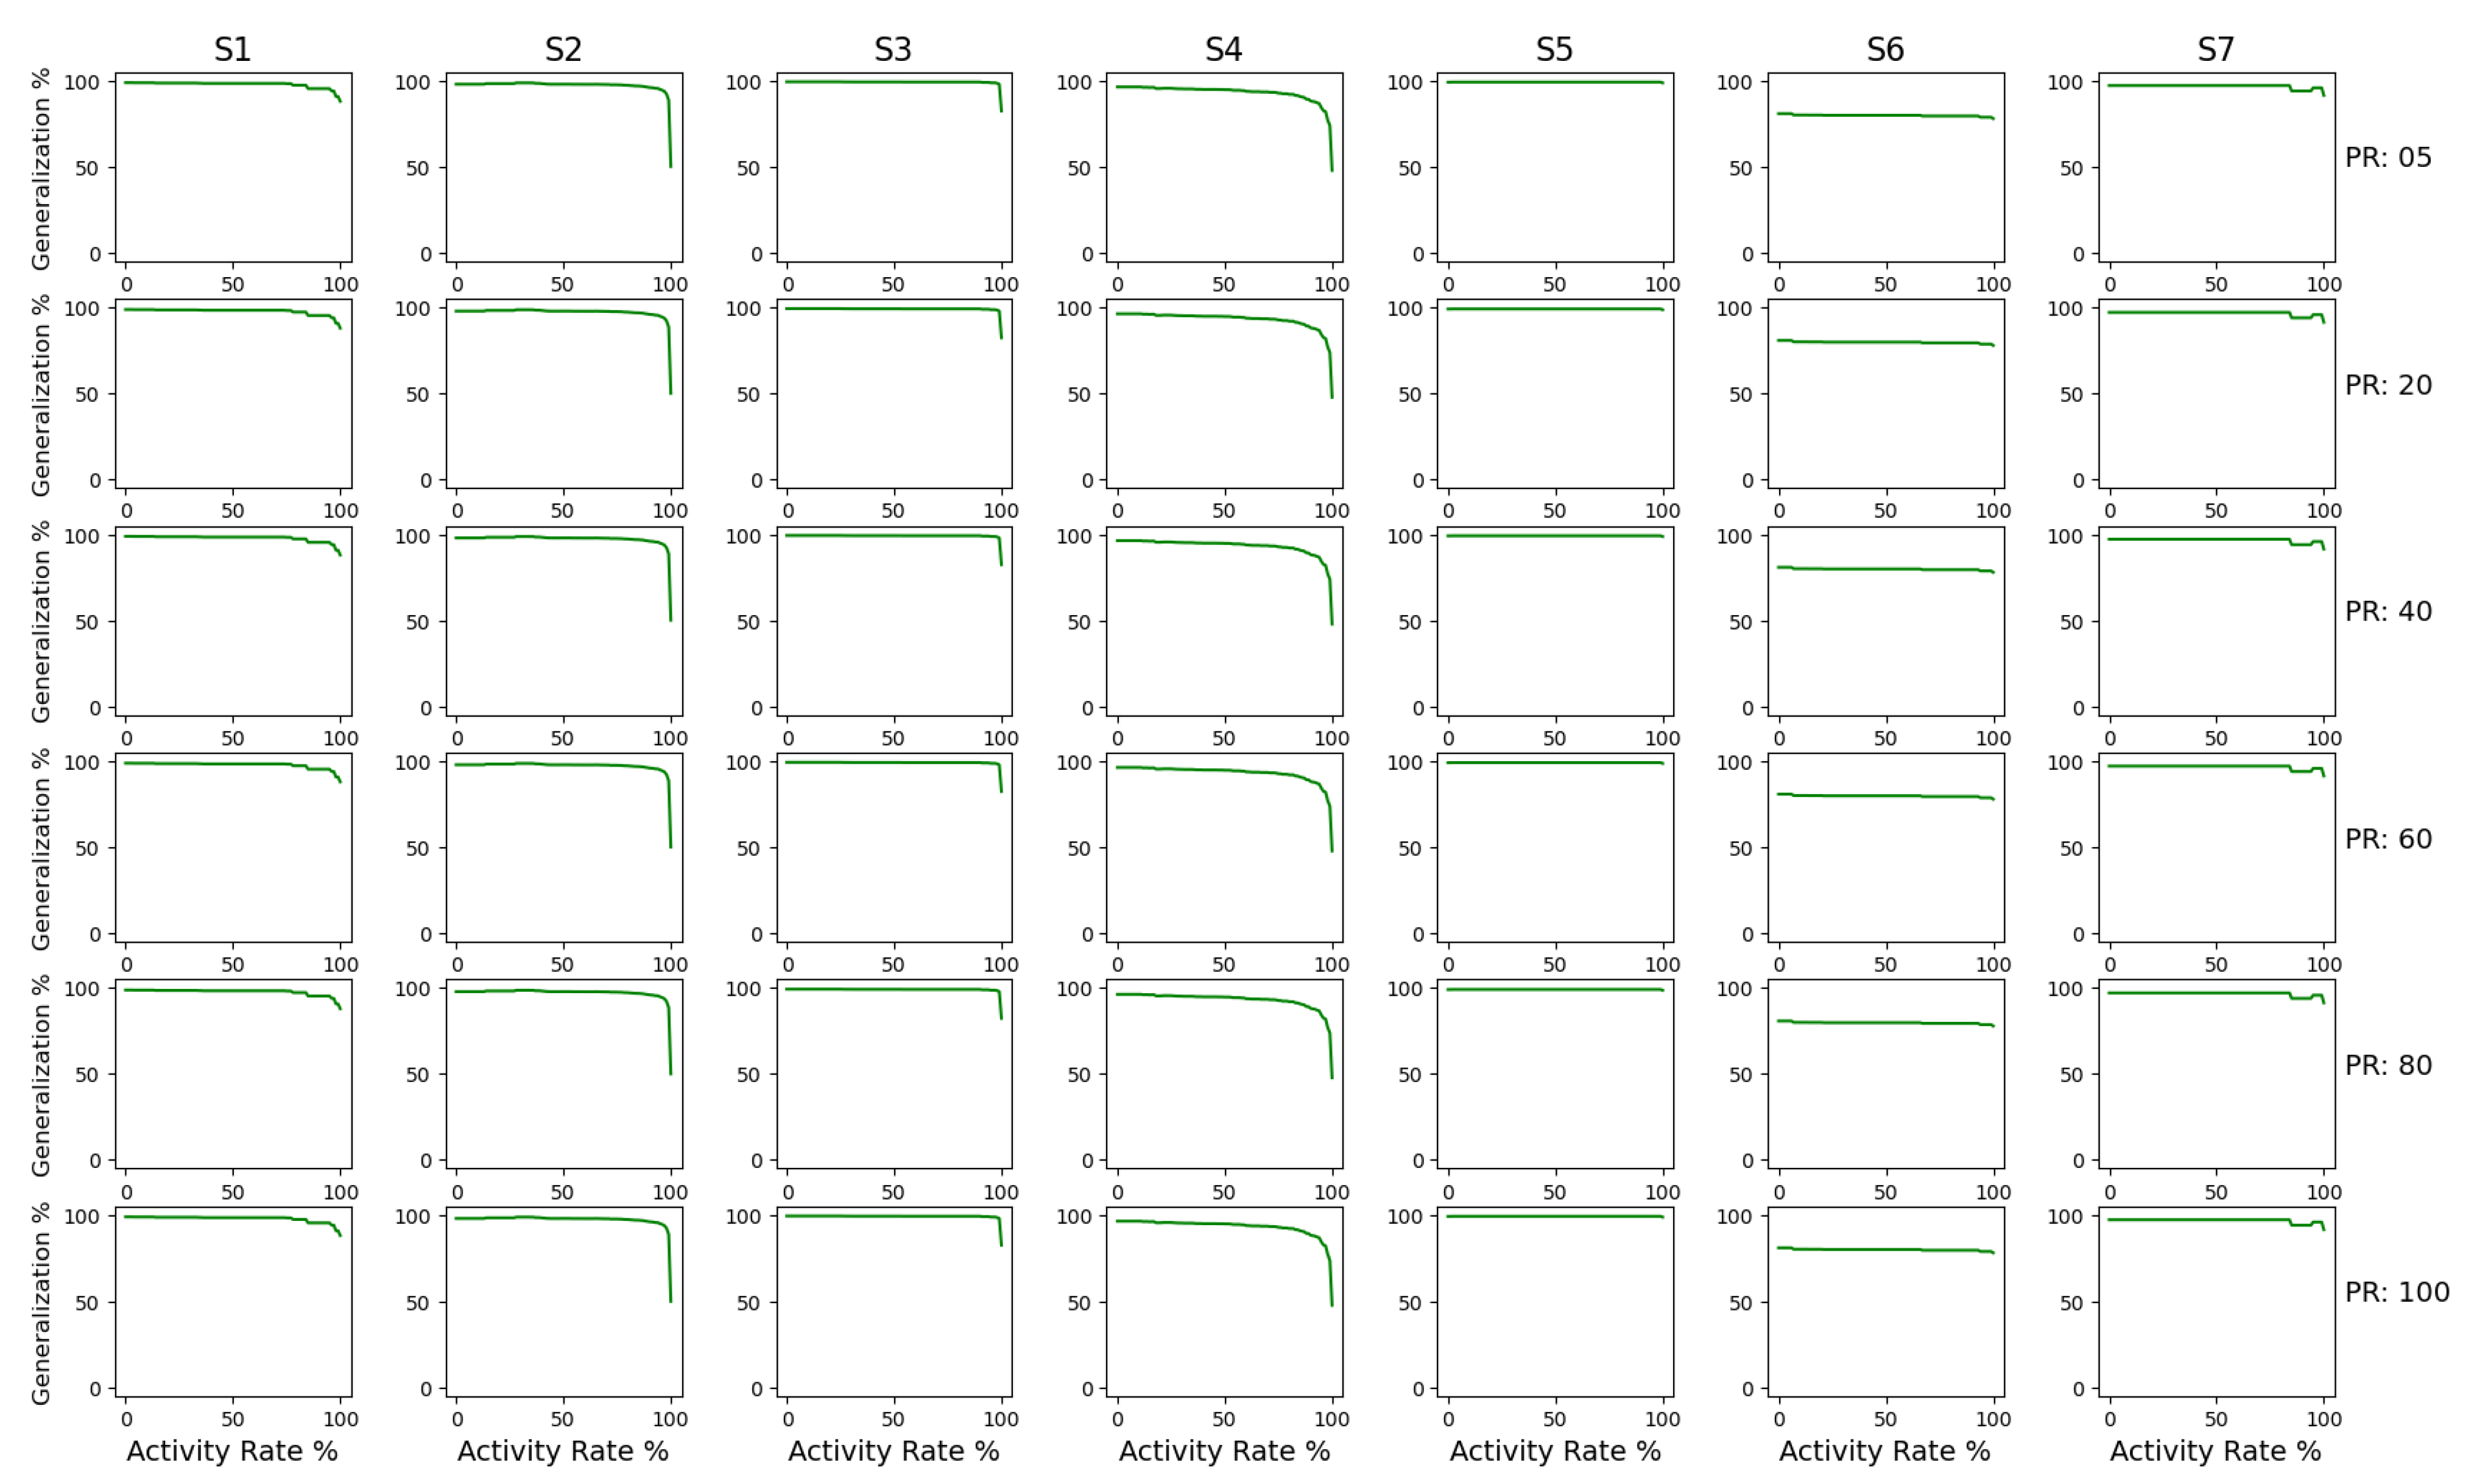
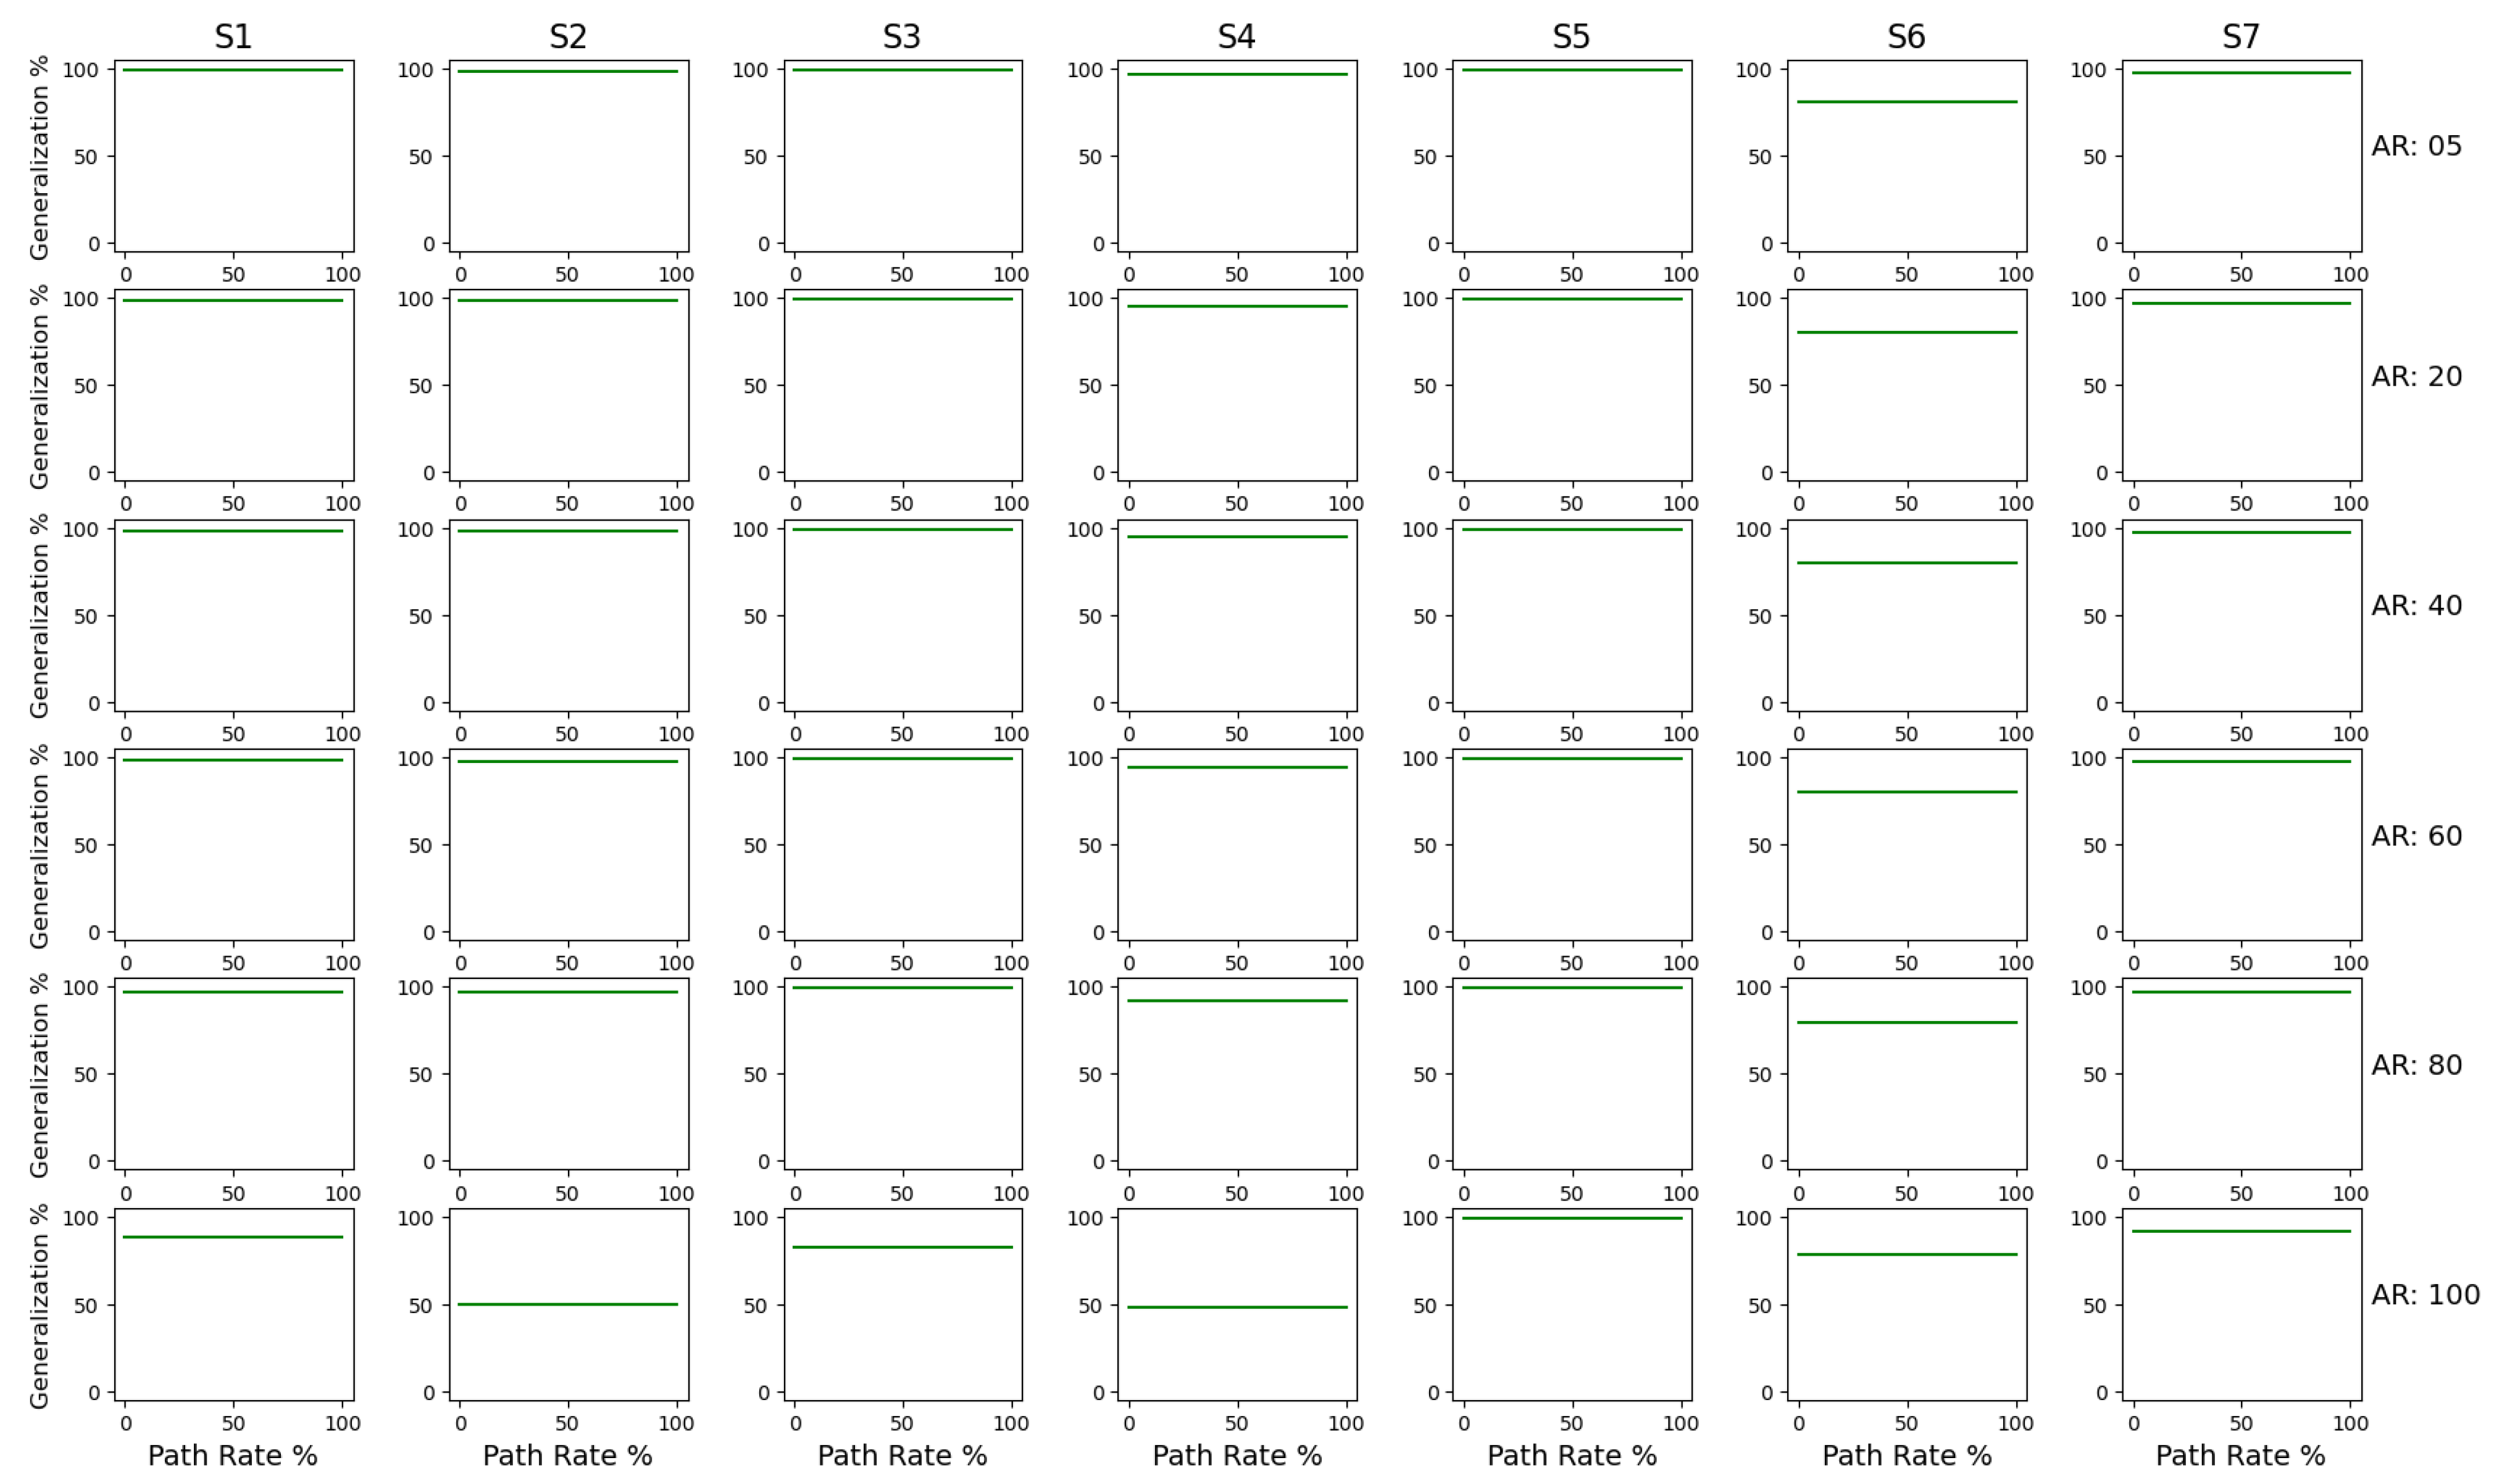
- Generalisation: Generalisation is a measure of the level of abstraction in a process model. It deals with overly precise models and tries to make sure over-abstraction is not performed. It estimates how well the process model describes an unknown system and not only the existing activities. If all parts of the process model are frequently used, then the process model is likely to be generic, i.e., generalisation is high. If parts of the model are infrequently visited then the generalisation is low. The authors [86] have based generalisation off replay fitness. They use the data obtained from fitness as a leading edge towards generalisation. The authors explain that, if a node is visited more often, then it is certain that the behaviour is more frequent and, hence, more generalised. However, if some parts of the process model are less frequently visited, then the generalisation is bad. Our adaption is based on the same concept. The formulation is as follows:where a denotes activities, is the activities present in the model and is the number of executions of each activity referred.In our version of generalisation, the numerator is calculated by determining the number of times an activity in the model has been executed. The root inverse of the value is generated and a cumulative sum of all individual unique events is calculated. This metric is measured on a scale of 0 to 100%, where 100% indicates a generalised model in which all parts are used equally;
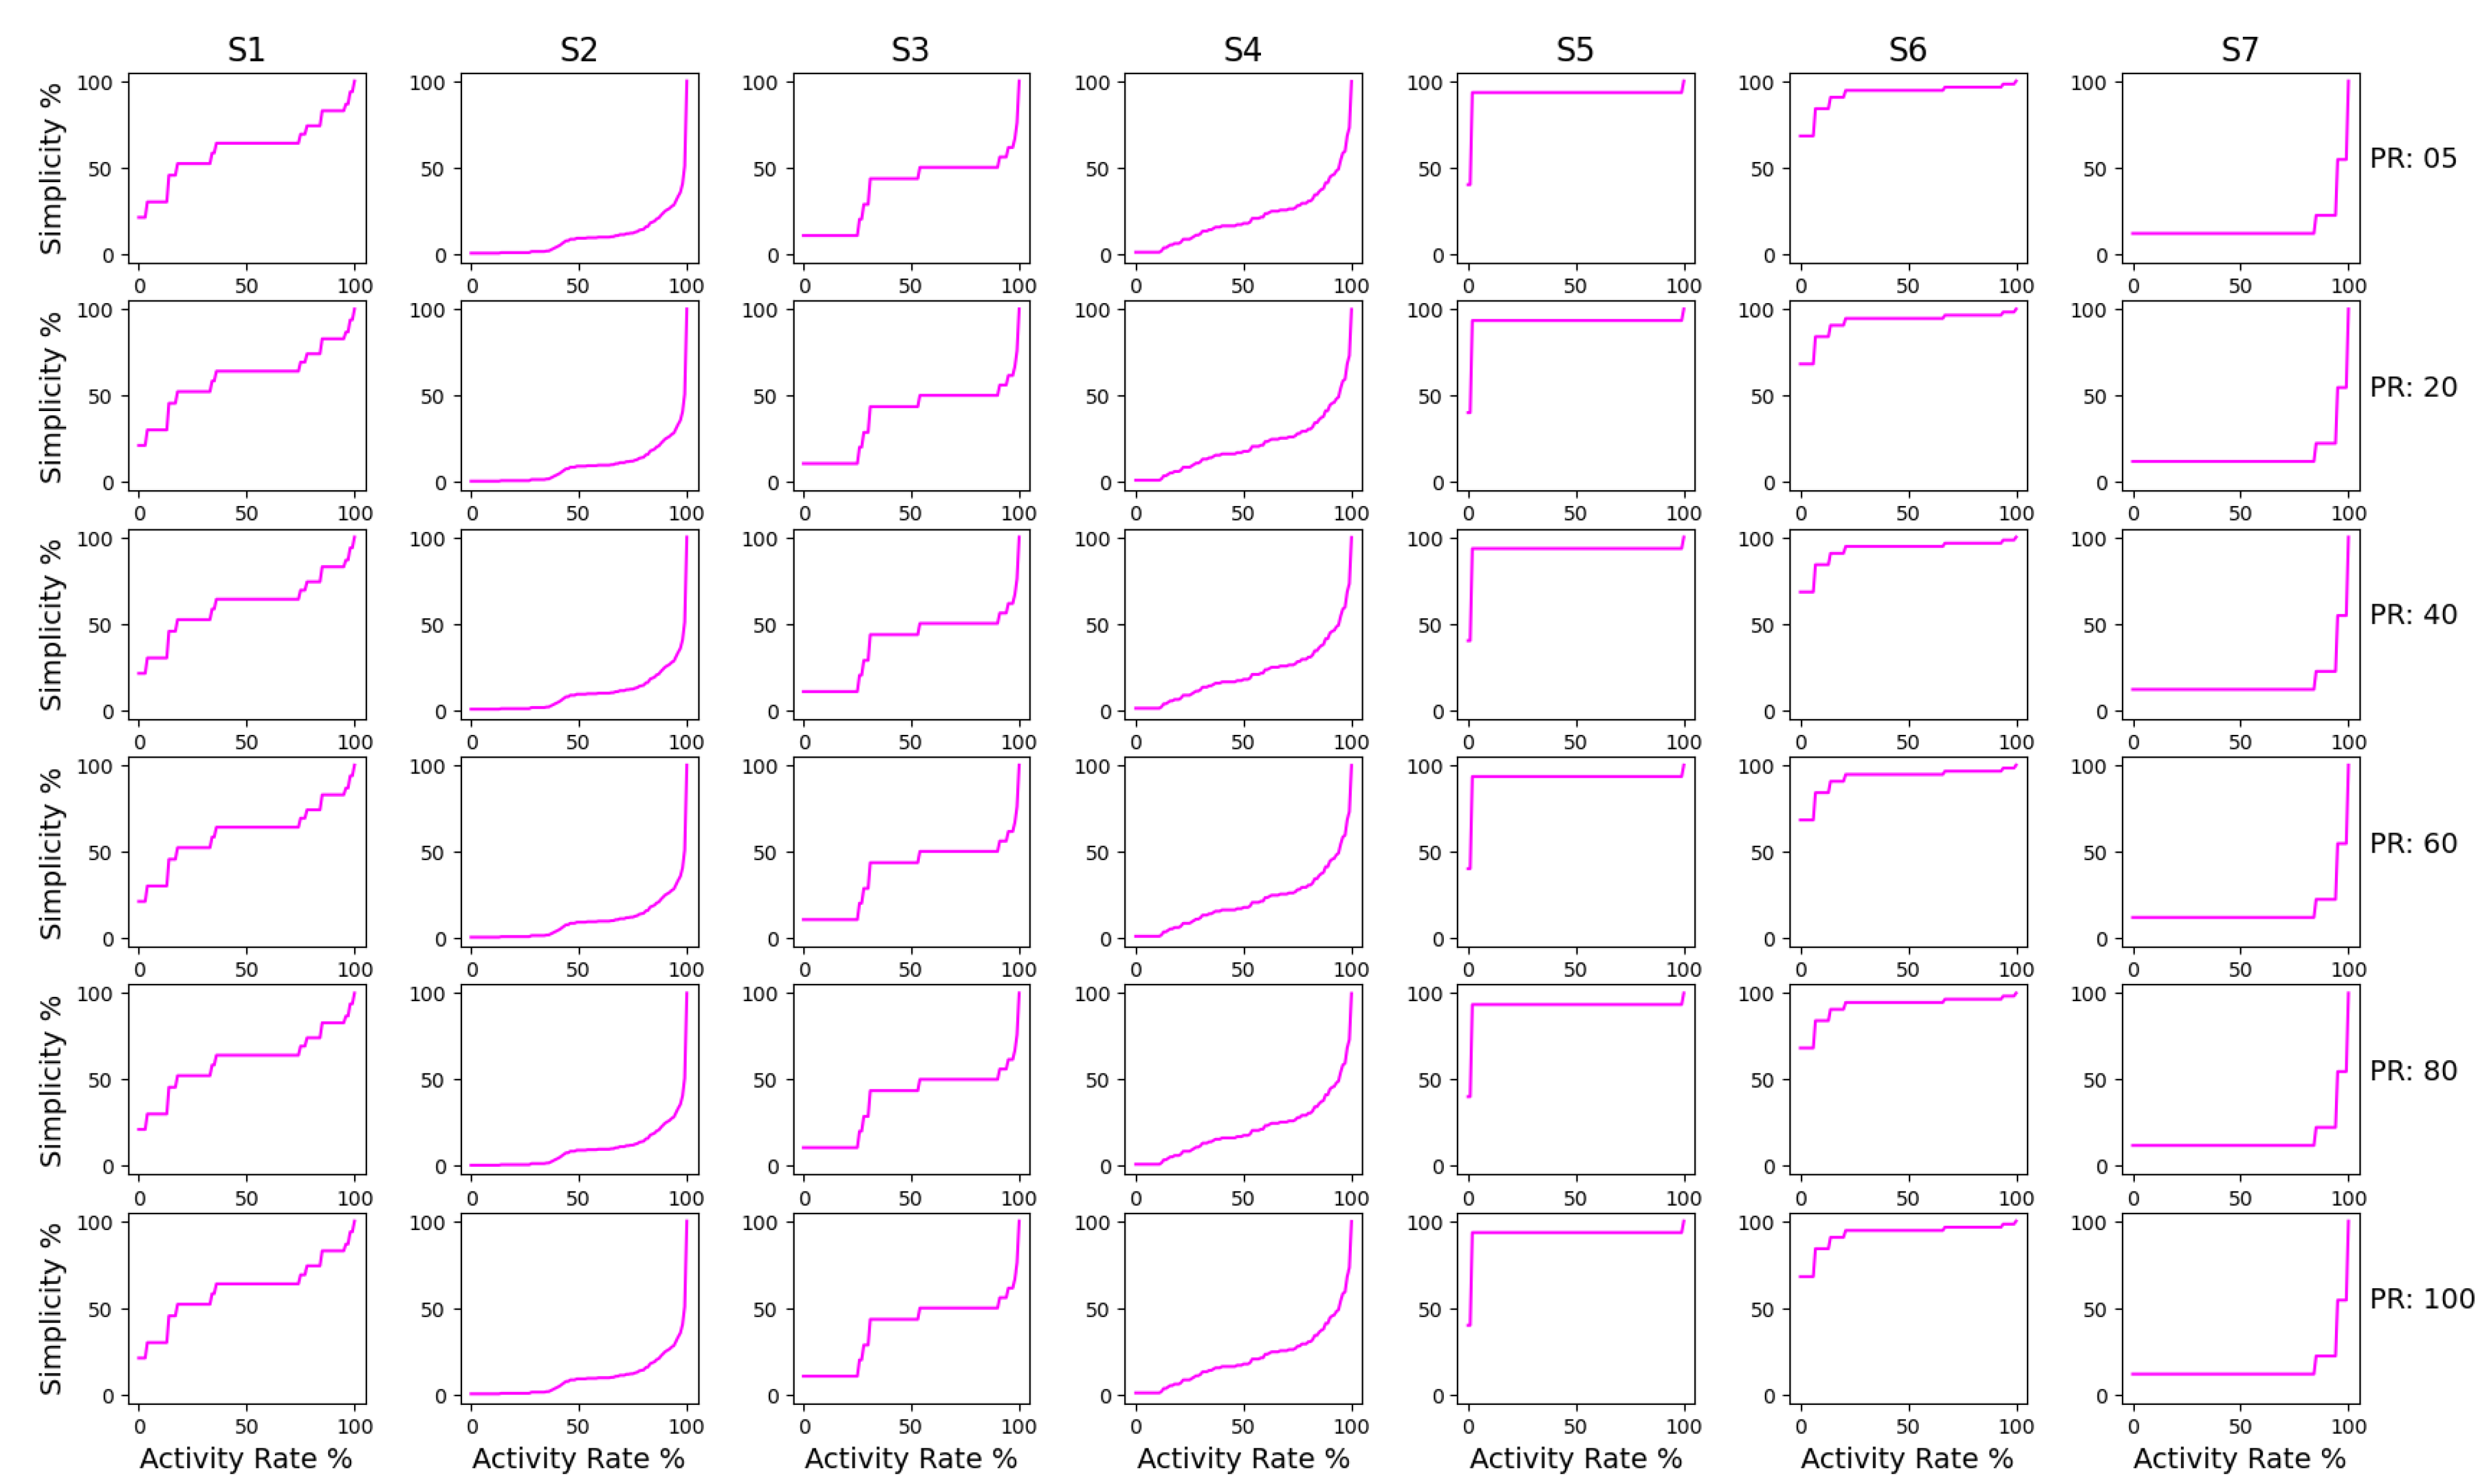
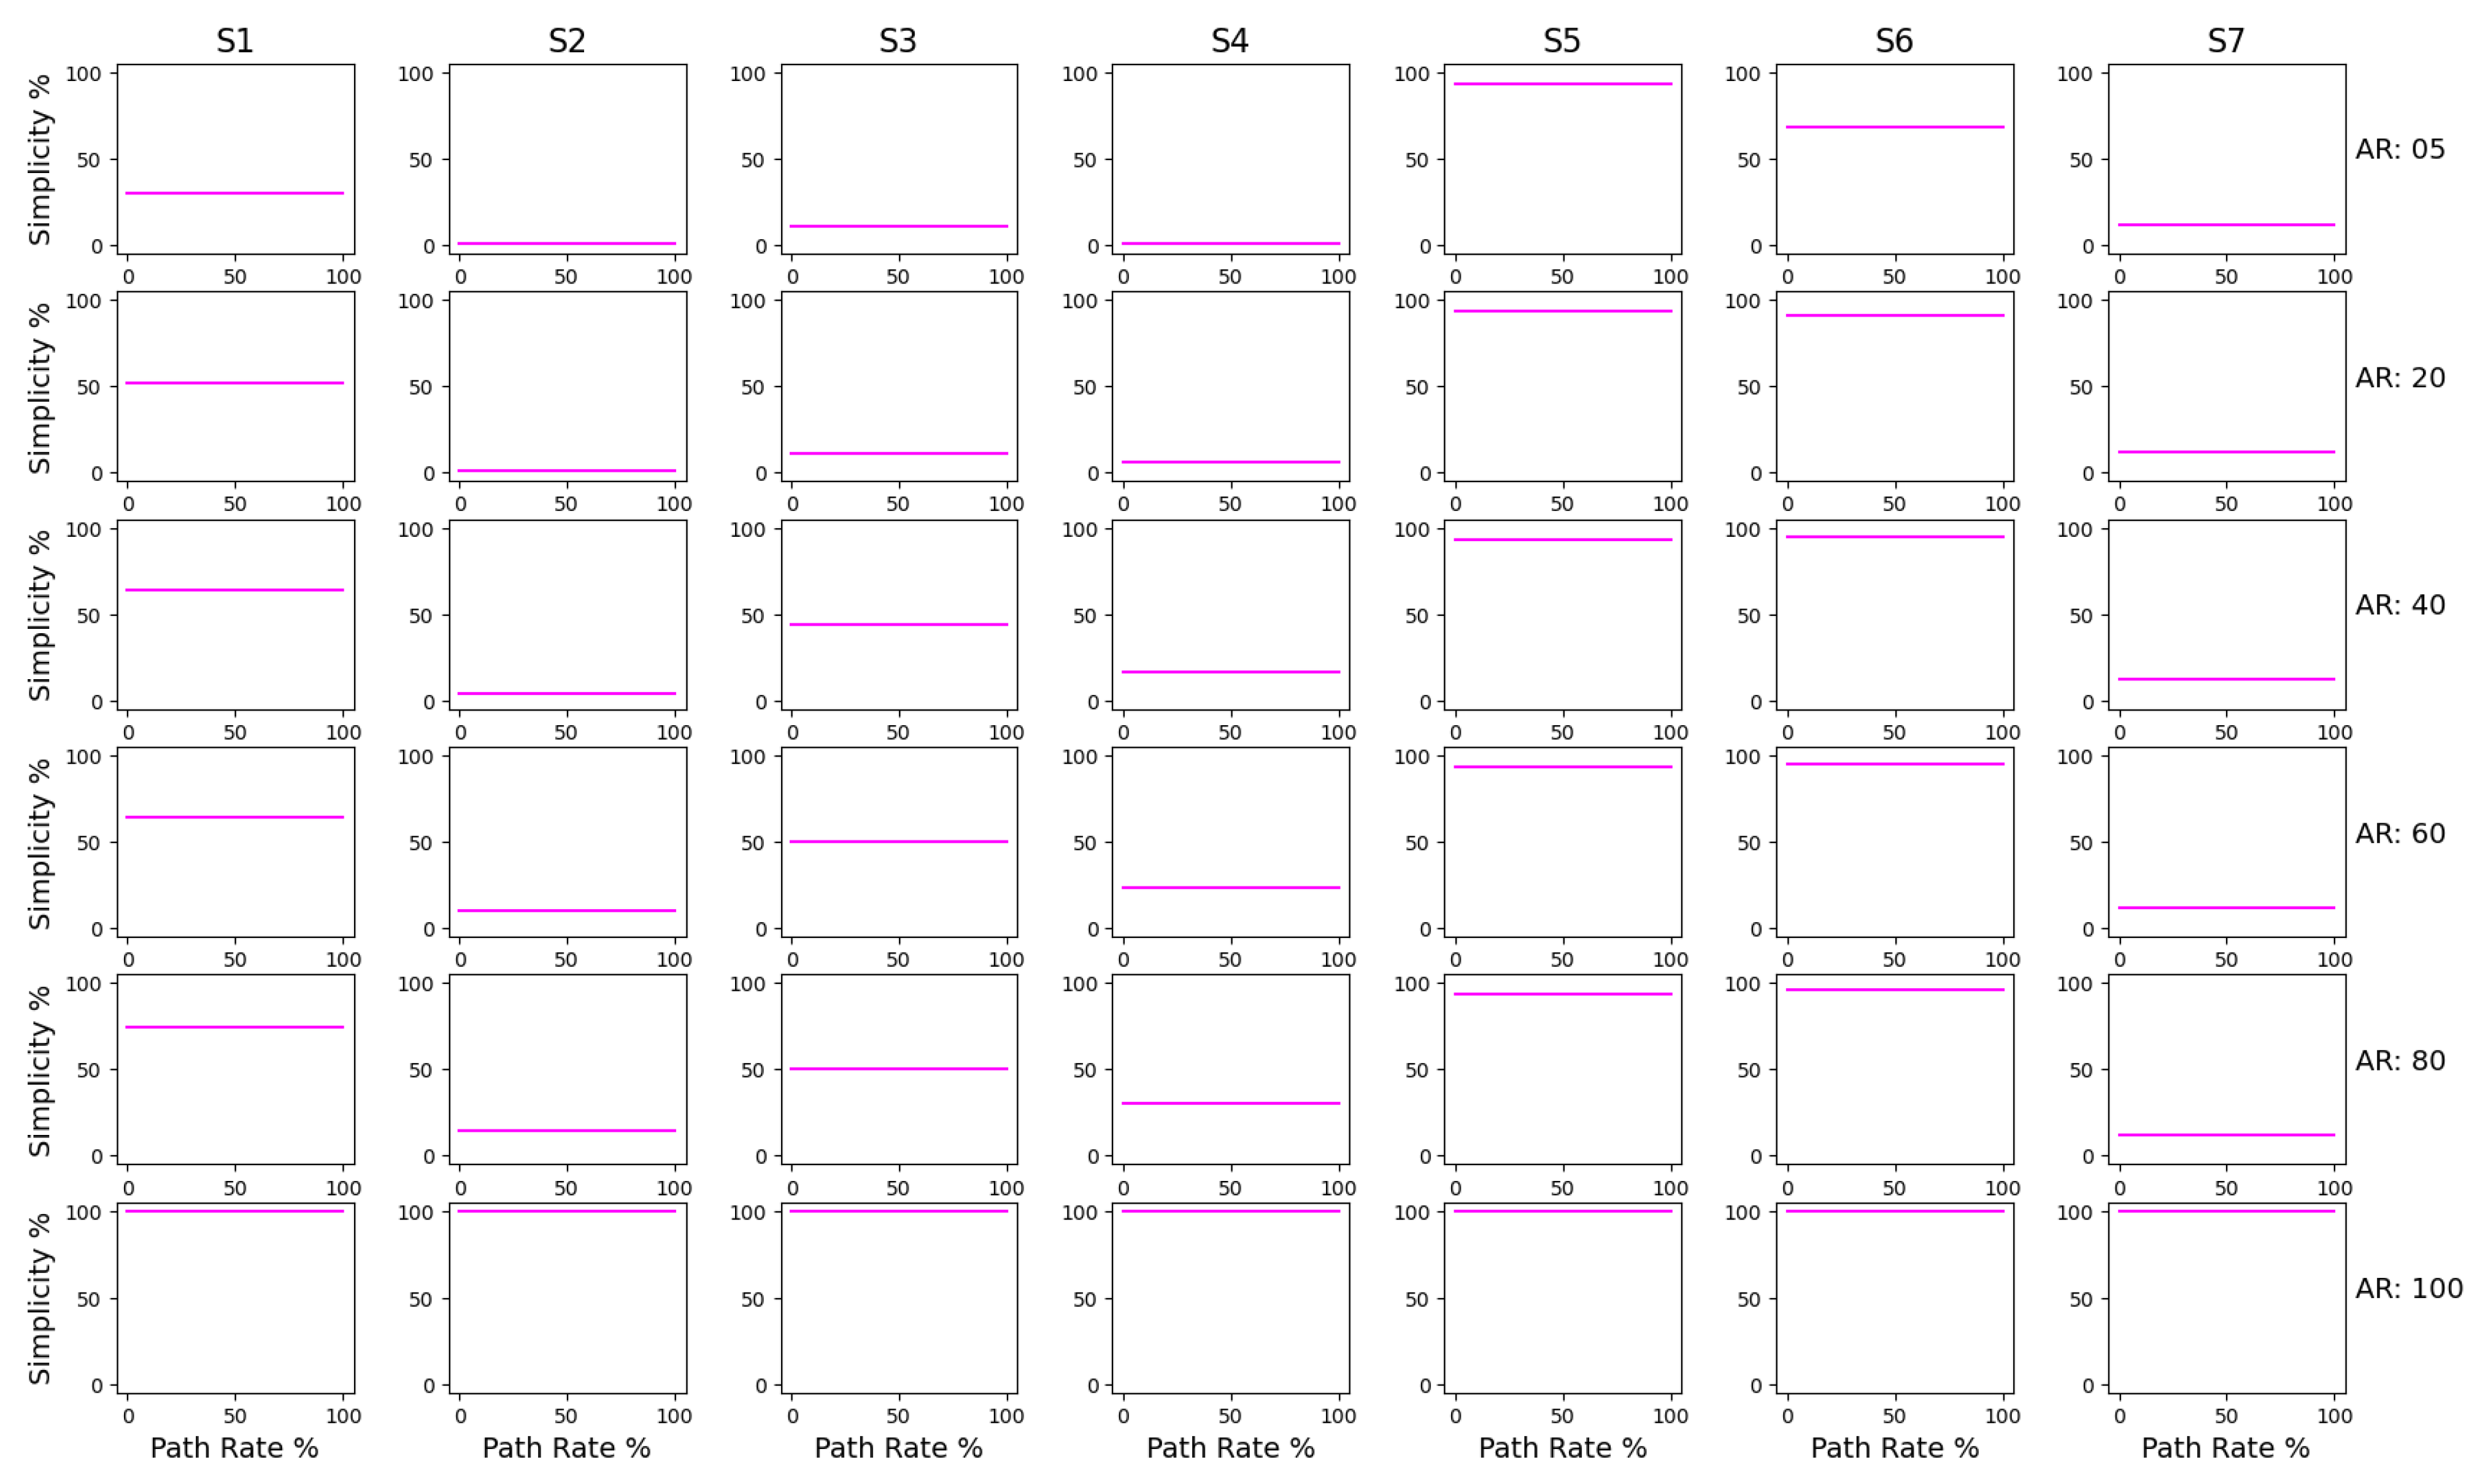
- Simplicity: Simplicity is a measure that describes how easily a model can be perceived by a human subject. It can parallelly be termed model complexity. Simplicity is measured by comparing the size of the model with the number of activities in the log. Using the information from the model itself, simplicity is defined on the following principle: if each activity is represented exactly once in the process graph, then that graph is considered to be as simple as possible [86]. Therefore, simplicity is calculated as follows:where is the duplicate activities present in the model, is the unique activities present in the event log, is the unique activities present in the process model and is the number of missing events in the model w.r.t to the log.The numerator is calculated as the sum of the count of duplicate activities present in the model and the count of missing activities in the model when compared to the event log. The denominator is calculated as the sum of unique activities present in the model and the unique activities present in the event log. This metric is also measured on a scale of 0 to 100%, where 100% indicates a complex model with many events and a lower value represents a simpler model.
3.2. Experimentation
3.2.1. Datasets Background and Information
- Should be a medical/healthcare domain dataset;
- Datasets should be open source;
- Should have sufficient events, activities and samples to generate sizeable process maps.
- Remote Patient Monitoring Data—Almazov Institute: This dataset was provided by PMT online (an online patient healthcare monitoring system). It contains events triggered by in-home blood pressure measurements made by patients suffering from arterial hypertension [90];
- Hospital Records of Dutch Hospital—Eindhoven University: This dataset was published by Eindhoven University of Technology. The dataset consists of real-life event logs of a Dutch academic hospital [91];
- Hospital Billing Log—Eindhoven University: This event log was sourced from Eindhoven University of Technology. The event log was obtained from the financial modules of the ERP system of a regional hospital [92];
- Nurse Work Flow—Almazov Institute: This event log was provided by Almazov National Research centre. It consists of data from the hospital access control system concerning staff activities, laboratory procedures, branch communications. etc. [93];
- Data Driven Process Discovery (An Artificial Event log)—Eindhoven University: This dataset was generated by Eindhoven University. It is a synthetic event log that simulates an artificial process log of a hospital (we have used the dataset with 0% noise) [94];
- Central Venous Catheter Process—Conformance checking challenge 2019: This is a dataset produced by Eindhoven University. It is also the dataset used for a Conformance checking challenge in 2019. The dataset describes the procedure to perform central venous catheter with ultrasound [95];
- Sepsis Treatment Pathway Dataset—Eindhoven University: This dataset was sourced from Eindhoven University. It is a real-life event log consisting of events of sepsis cases from a hospital and its treatment [96].
- Stage 1: This stage involved sparsely overseeing the various attributes of the process model and filtering fields that may not be useful to our application (e.g., Dataset 2 had 128 fields of information, such as “special code”, “diagnosis index”, etc.). These additional fields were excluded and the basic three were retained in all datasets;
- Stage 2: In this stage, process models were visualised using Python3 and ProFIT. The Activity field in all the datasets was cleaned and made uniform with respect to all event logs. The filtering and cleaning were performed using a self-built Python script which removed all unnecessary elements in the event data (e.g., ‘.’, ‘-’, ‘_’, etc.).
3.2.2. Setup
3.2.3. Metric Calculation
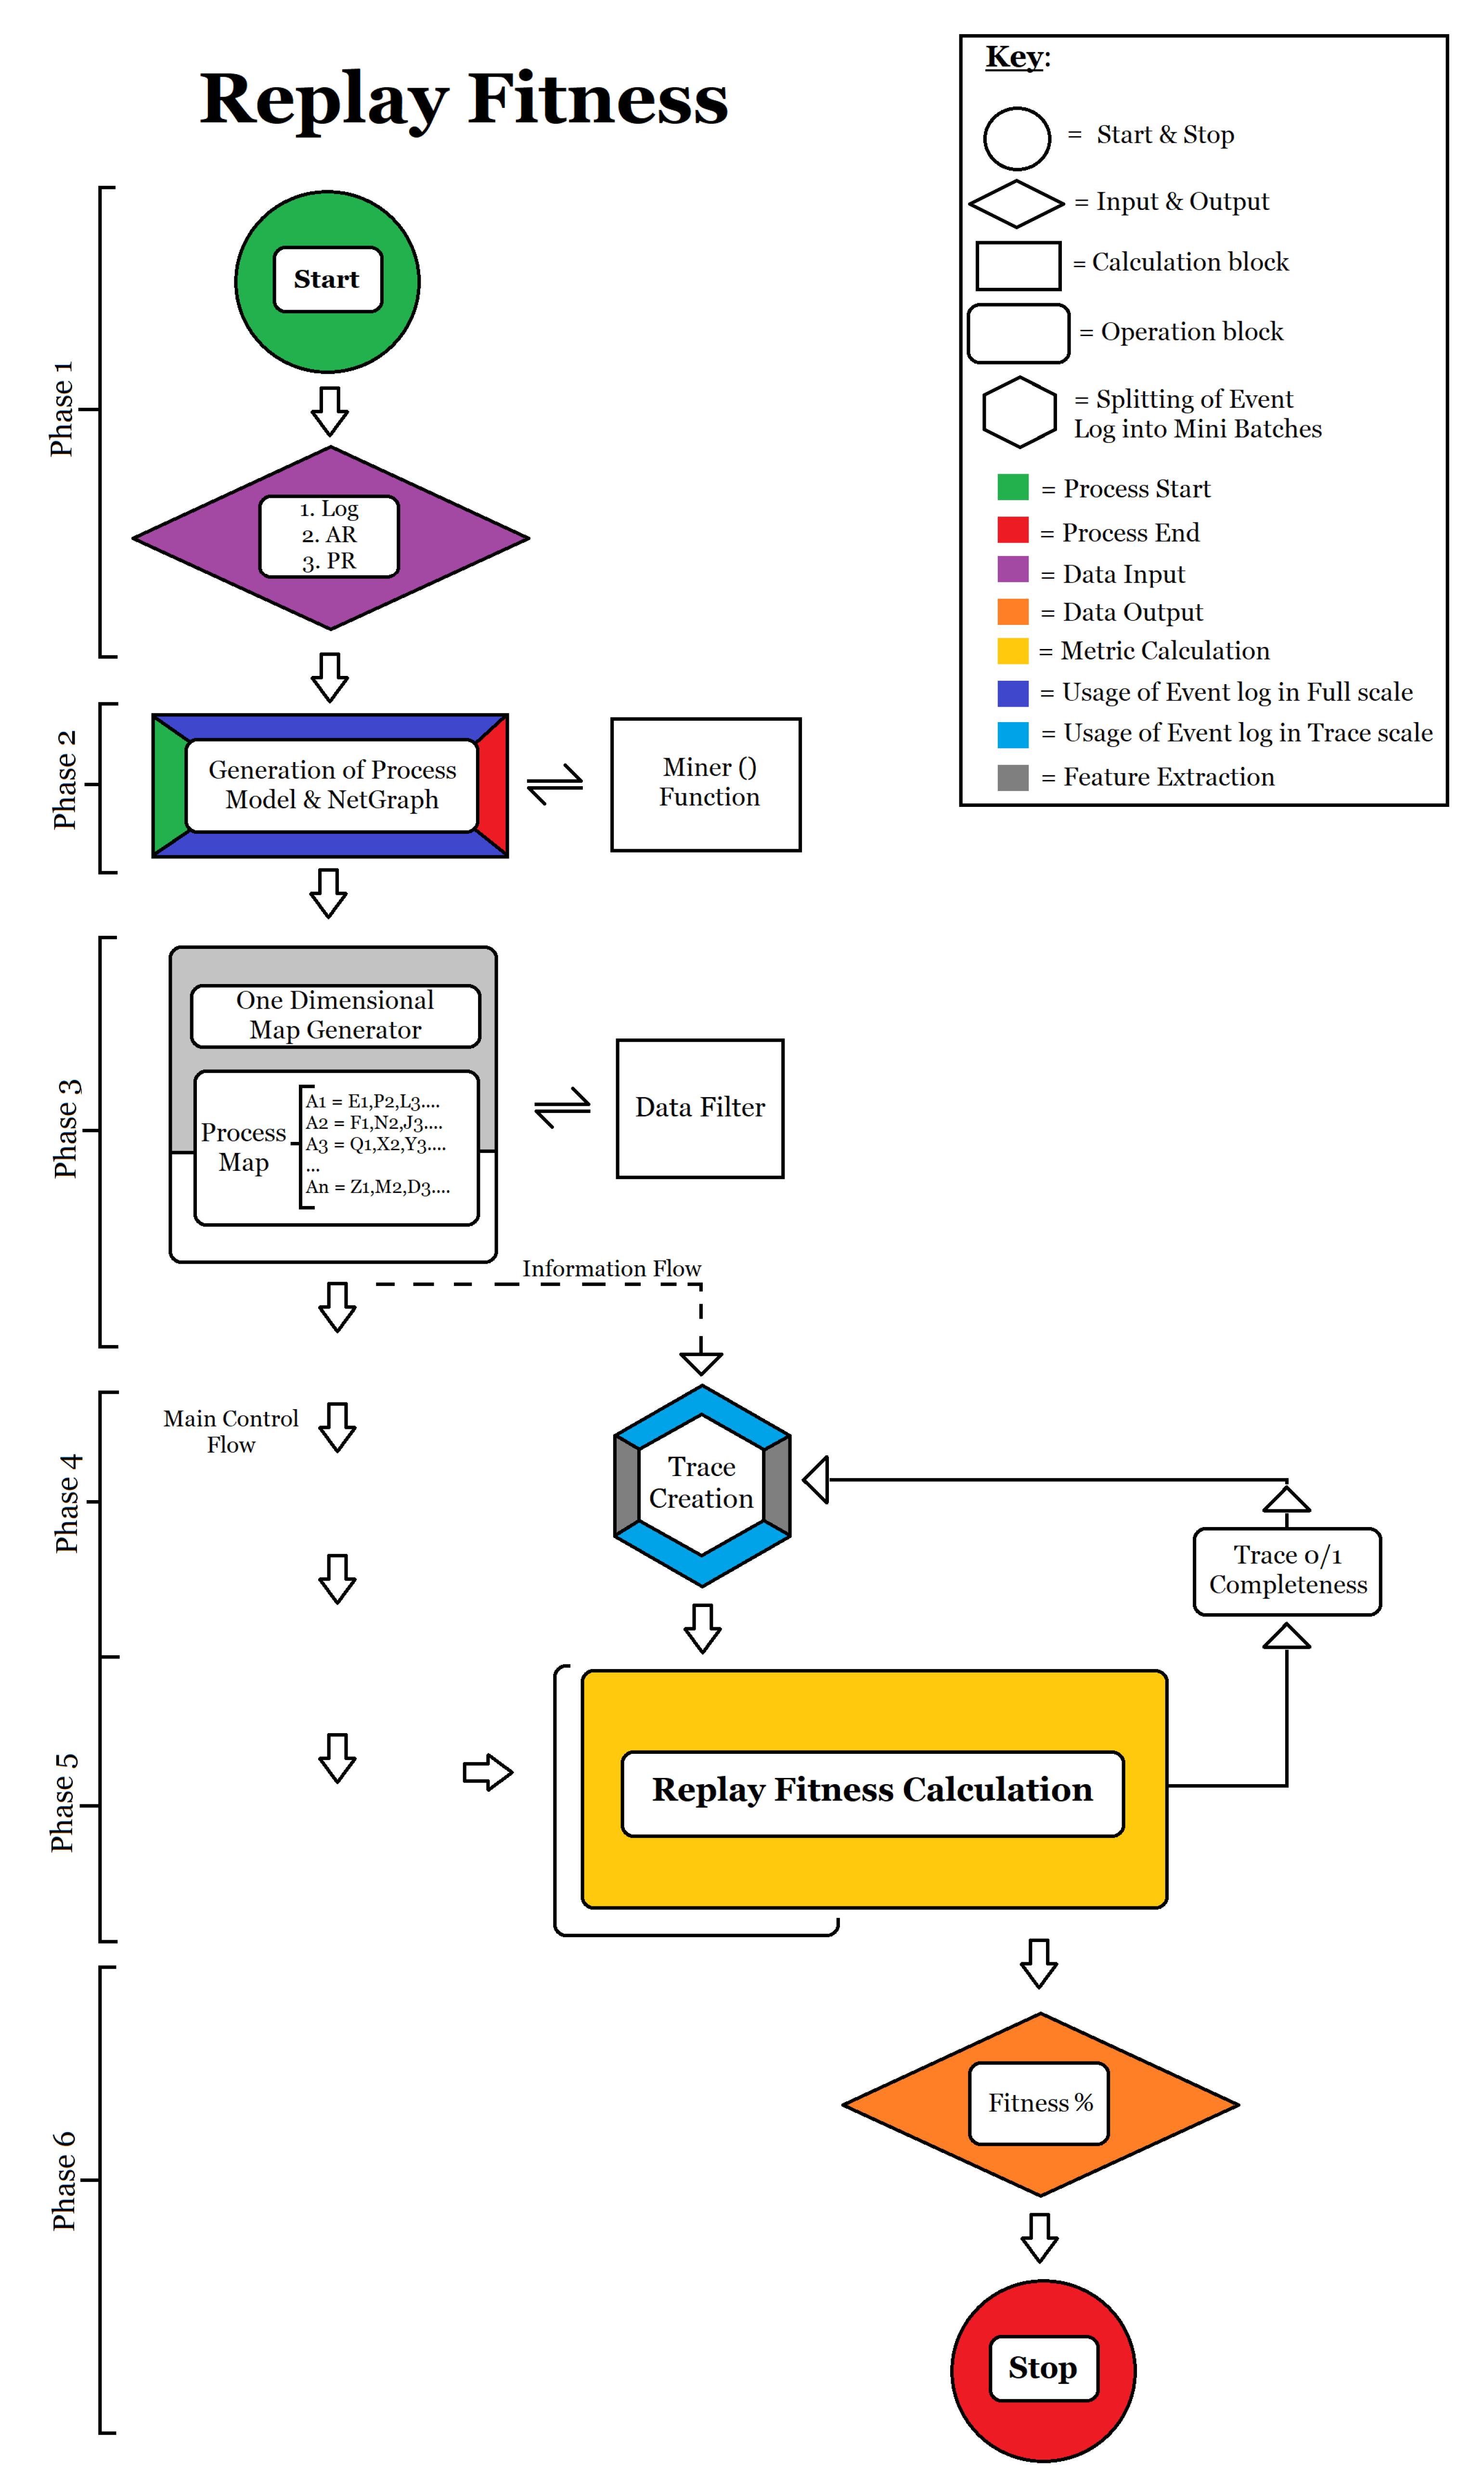
- Calculation of Fitness: Fitness is calculated according to Formula (1). The full flow of fitness calculation can be seen in Figure A1:
- Phase 1: Input of event log, activity rate and path rate;
- Phase 2: The event log is mined and the process model is generated. (The miner function performs filtering and cleaning of the netgraph for metric calculation);
- Phase 3: Generation of a one-dimensional dictionary containing the source and destination of all activities in the model;
- Phase 4: Generation of individual traces for each caseID and verification of replay via the process model. E.g., a trace is chosen from the event log and is traversed per caseID throughout the generated process model. If the trace is completely retractable from start to end, then the respective caseID is deemed fit (1), else it is deemed not fit (0);
- Phase 5: Once all the caseIDs have been checked for replayability, the final formula of fitness is applied where the total number of traces that can be aligned with the model and log is contrasted against the total number of unique caseIDs in the log;
- Phase 6: Generation of the percentage of fitness and output of final fitness.
- 2.
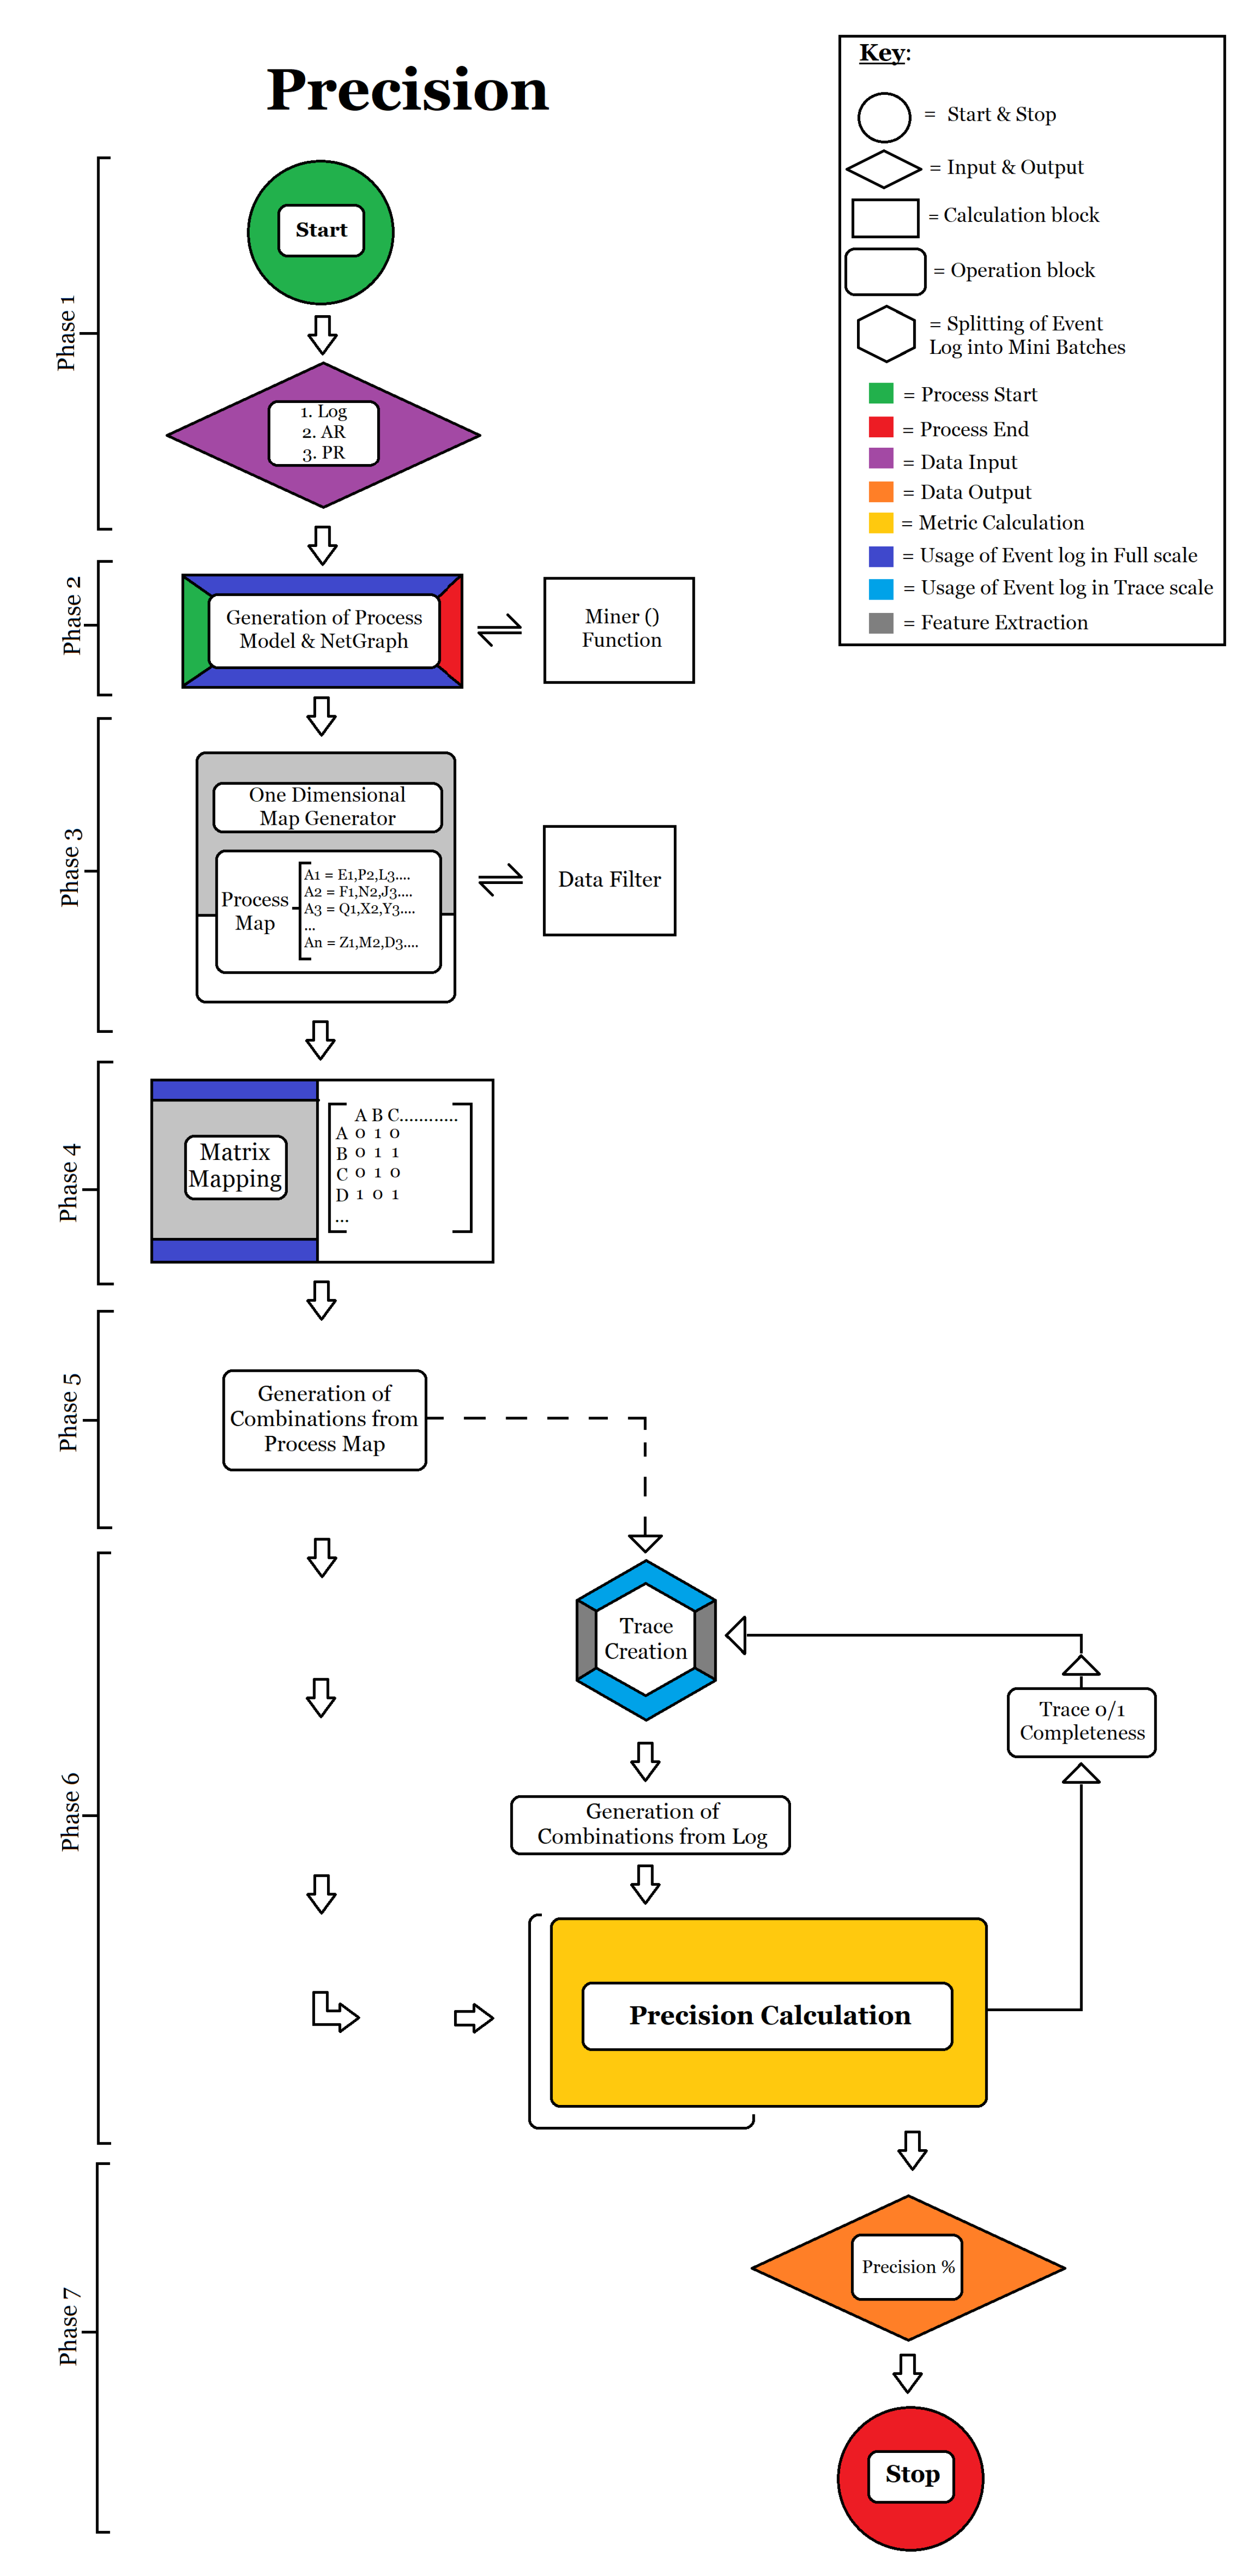
- Calculation of Precision: The precision of a model is by far the most complicated metric to be calculated, as there is a lot of ambiguity to deal with. The full flow of precision calculation can be seen in Figure A2. It is generated as follows:
- Phase 1: Input of event log, activity rate and path rate;
- Phase 2: The event log is mined and the process model is generated. (The miner function performs filtering and cleaning of the netgraph for metric calculation);
- Phase 3: Generation of a one-dimensional dictionary containing the source and destination of all activities in the model;
- Phase 4: Conversion of the one-dimensional matrix into a path matrix which uses 0s and 1s to indicate the existence of “Path" and “No Path" between all activities in the model. The matrix is used to generate all possible combinations from the model to verify existing and imaginary paths in the process model;
- Phase 5: Generation of all possible combinations of traces in the process model. A permutation algorithm generates them in sets of two activities (AB, BC, AC, AA, BB, CC, etc.). Duplicates and redundancies are filtered before proceeding to phase 6;
- Phase 6: The trace creator, generates all possible combinations of traces from the event log in pairs of two (AB, BC, AC, AA, BB, CC, etc.). Duplicates and redundancies are filtered. The generated results are used to check combinations that occur only in the process model and not in the log. This value is evaluated against the total number of traces in the event log. The raw precision value of the model is generated using Formula (2). As in Fitness, for every iteration of path rate and activity rate, the algorithm is executed from phase 1 to 6. The precision is likewise calculated at every iteration;
- Phase 7: Generation of the percentage of precision and output of final model precision.
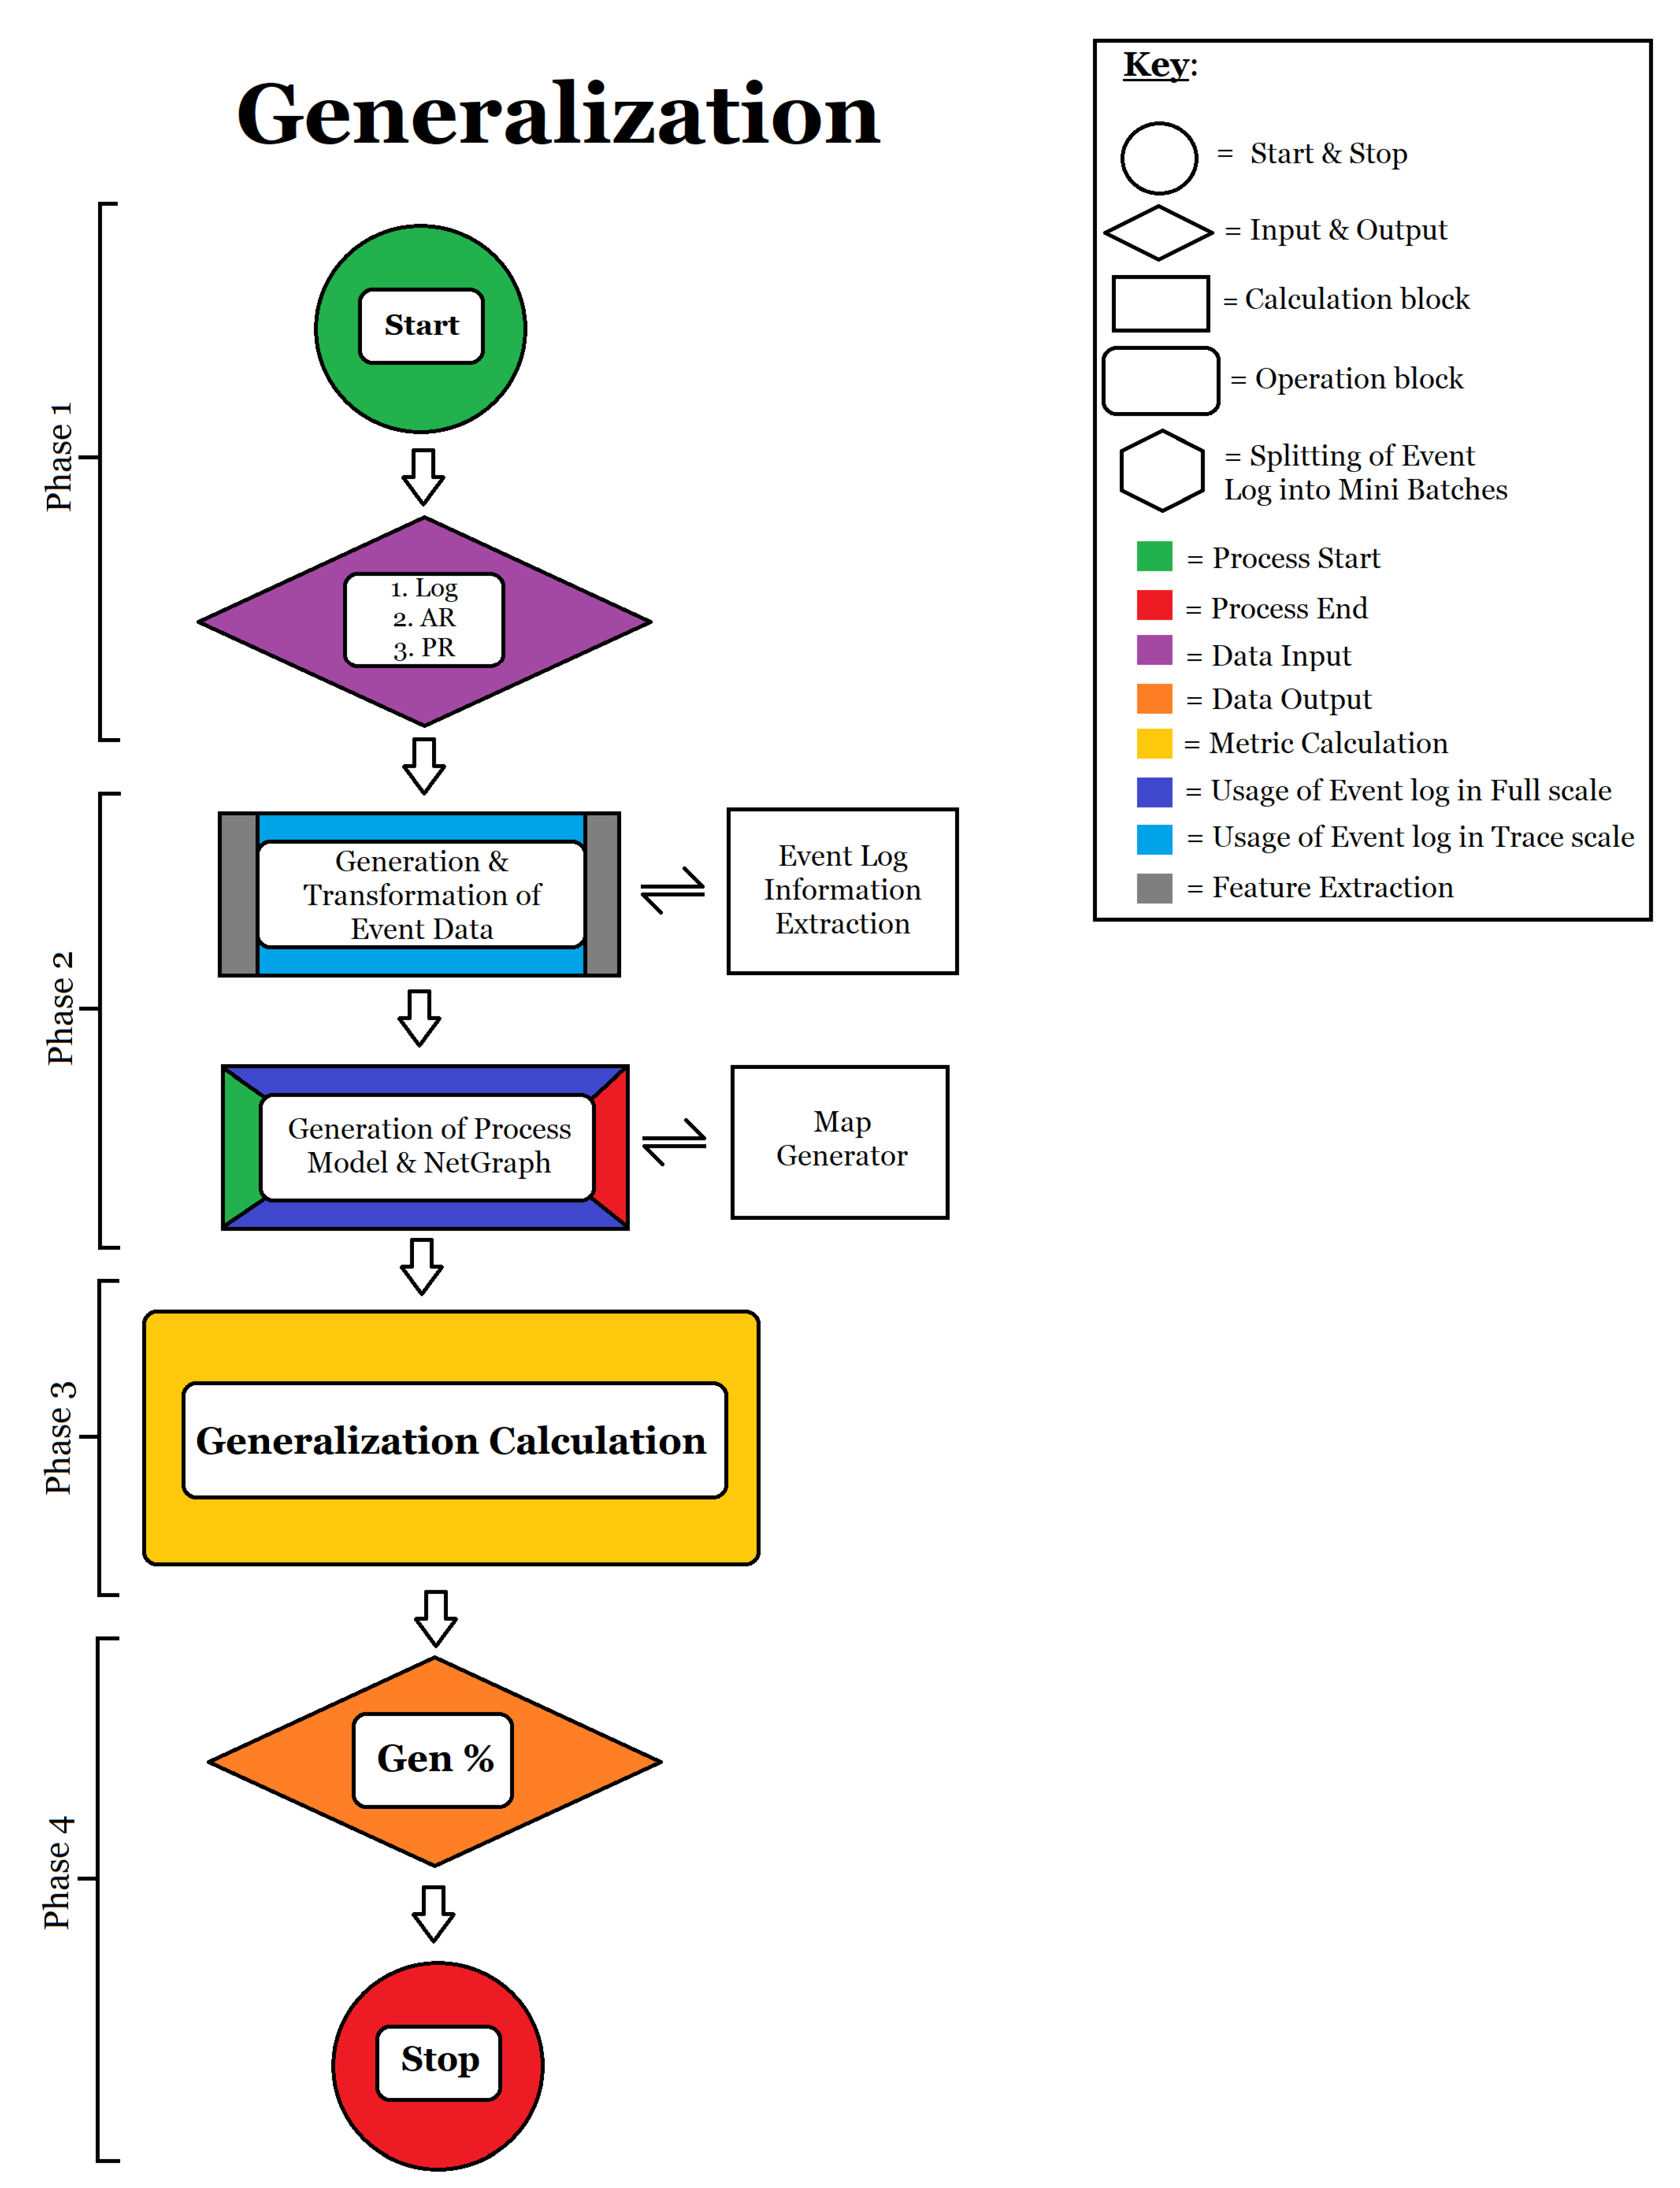
- Calculation of Generalisation: Generalisation is calculated according to Formula (3). The full flow of generalisation calculation can be seen in Figure A3. It is calculated as follows:
- Phase 1: Input of event log, activity rate and path rate;
- Phase 2: Data extraction of all activities in the event log and all activities in the process model.;
- Phase 3: Information from phase 2 is used to calculate the number of executions of each event in the process model and the total number of events present in the process map. These values are then used in Formula (3) to calculate the raw generalisation;
- Phase 4: Generation of the percentage of generalisation and output of final model generalisation.
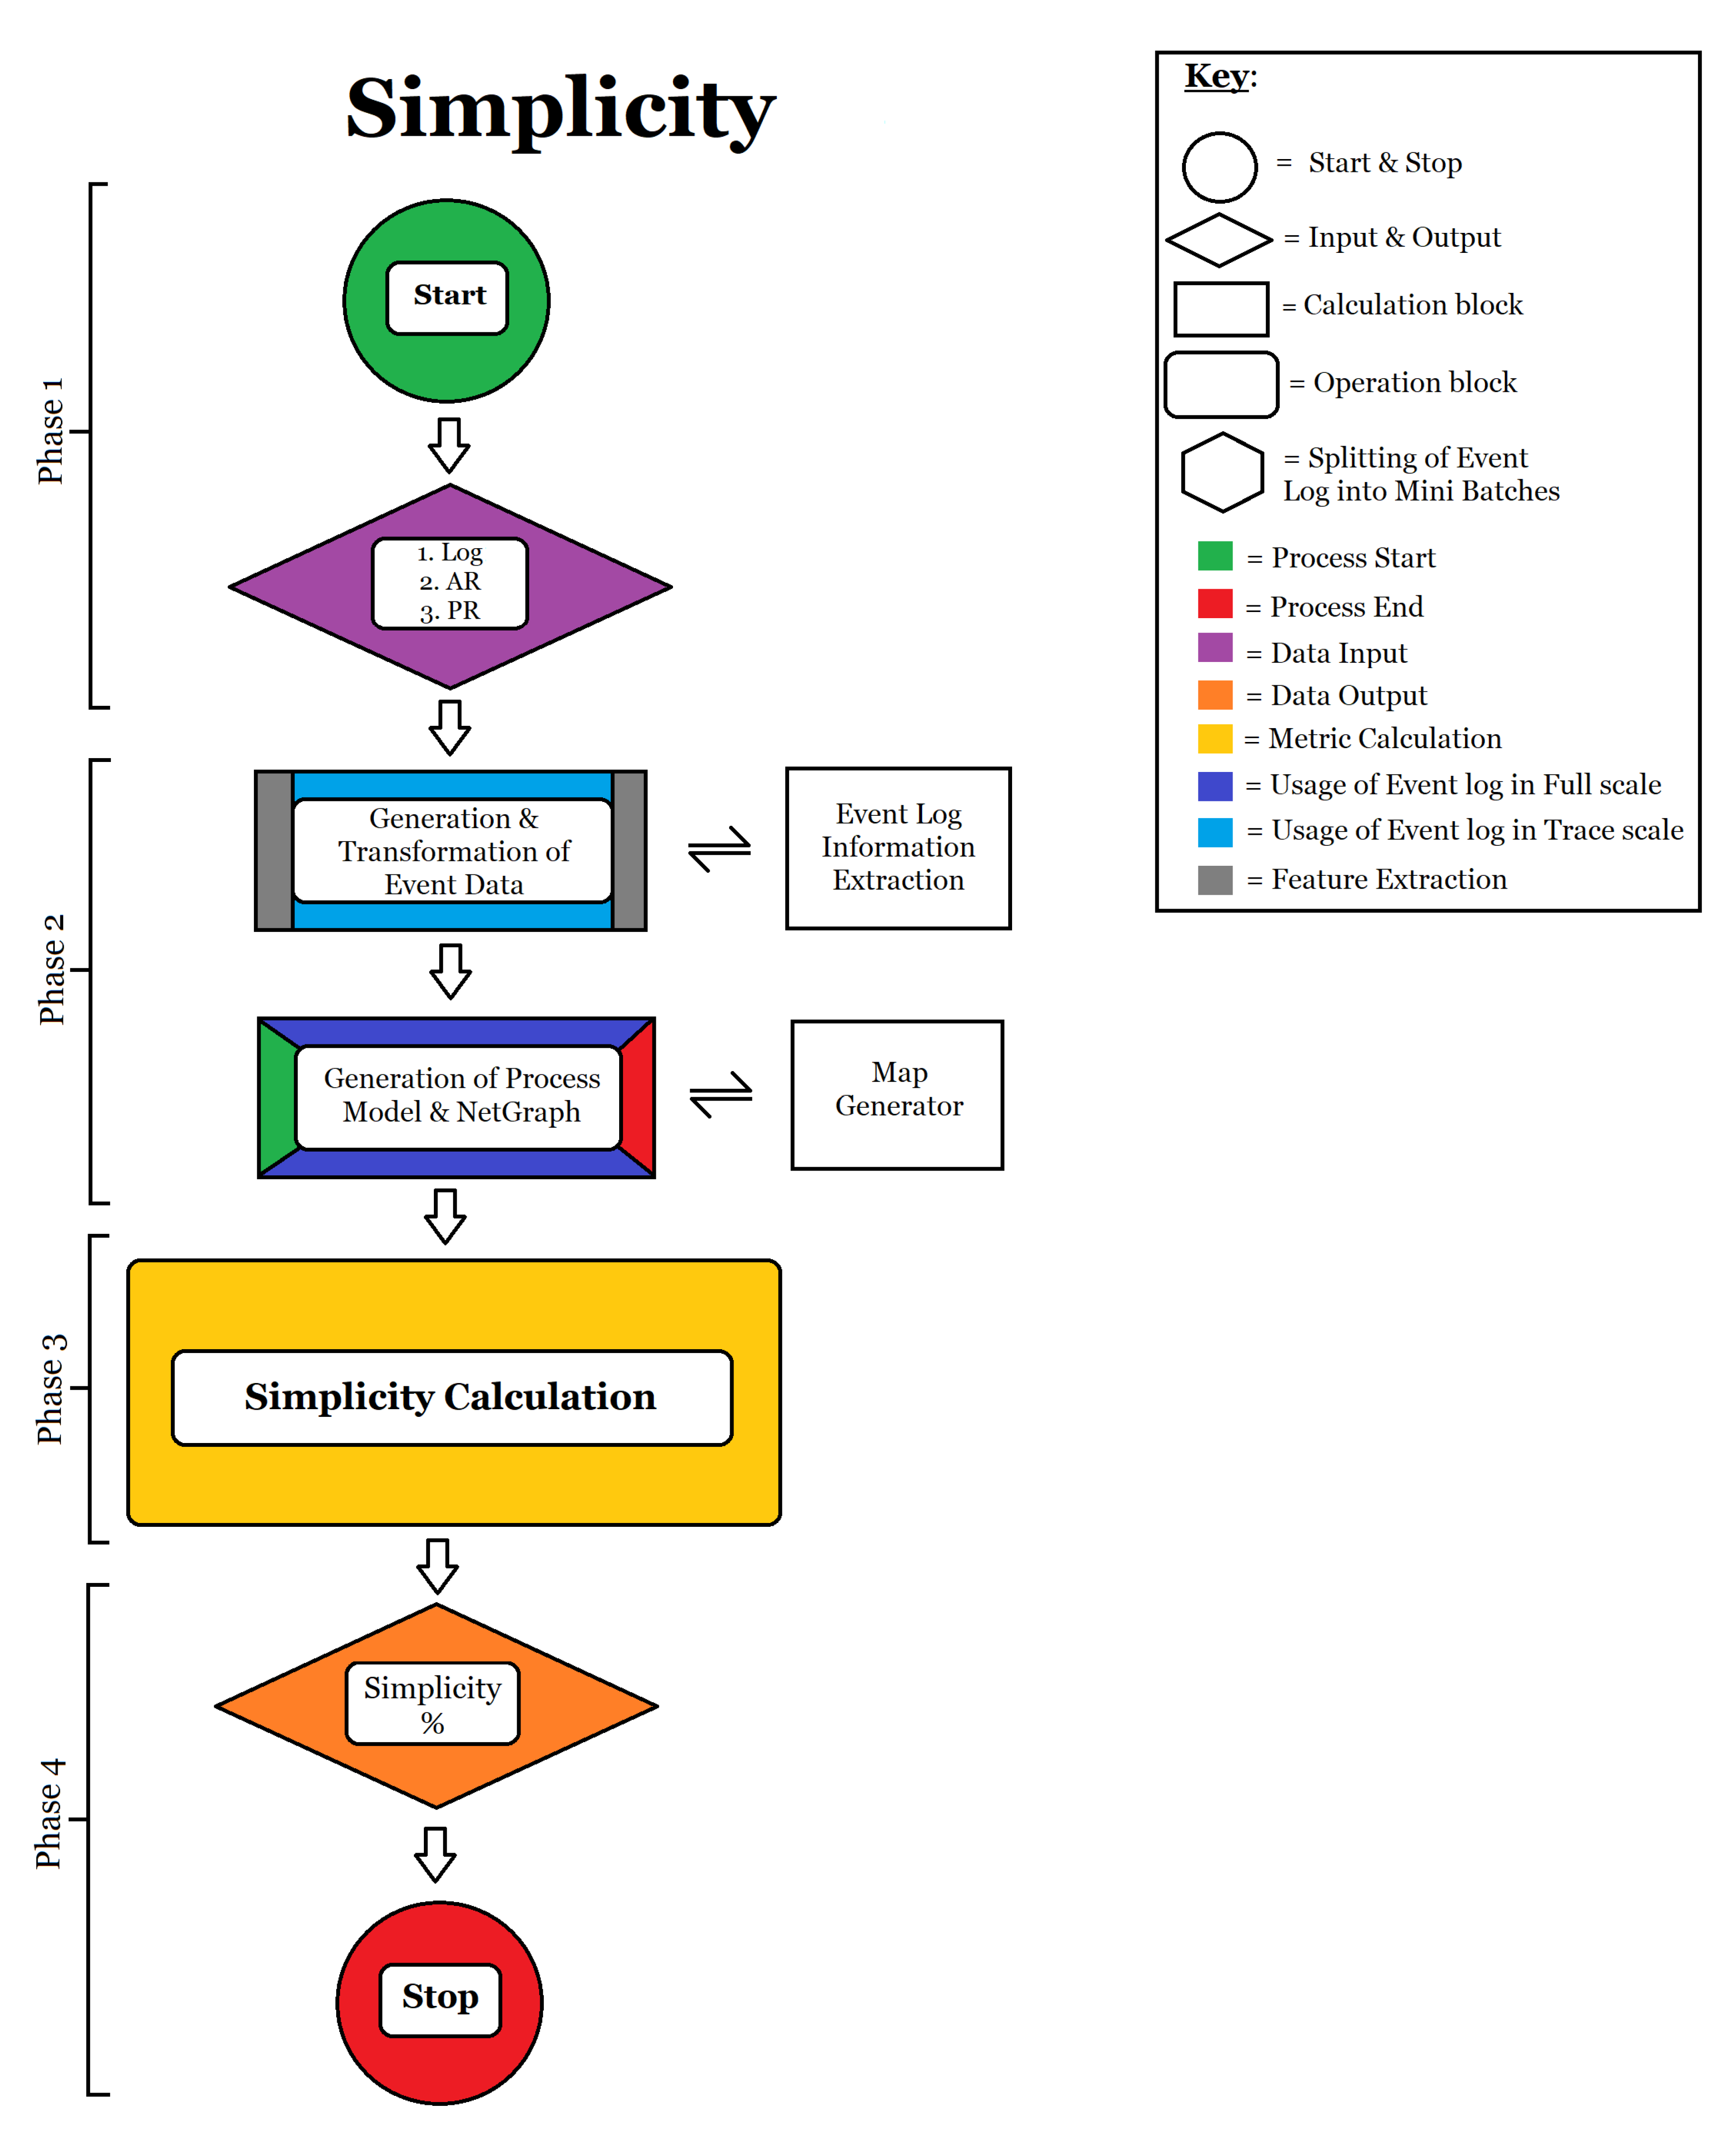
- Calculation of Simplicity: The simplicity of a model is calculated as per Fromula (4). The full flow of simplicity calculation can be seen in Figure A4. It is calculated as follows:
- Phase 1: Input of event log, activity rate and path rate;
- Phase 2: Data extraction of all activities in the event log and all activities in the process model;
- Phase 3: Information generated from phase 2 is used to calculate The sum of all duplicate and missing activities. It is evaluated against the sum of all events in the process model and the event log;
- Phase 4: The percentage of simplicity is generated for the model.
3.3. Results
4. Discussion
- The traces are uniform for universal analysis;
- Traces begin and end with activities from the log, resulting in directly analyzable pure information;
- By excluding START and STOP, instances of measurement are scaled exactly to their logs and not the collective size.
- In datasets without the keywords, traces have to be explicitly extracted and modified, thereby increasing pre-processing time;
5. Conclusions and Future Work
Author Contributions
Funding
Institutional Review Board Statement
Informed Consent Statement
Data Availability Statement
Conflicts of Interest
Appendix A. Metric Methodology Flowcharts


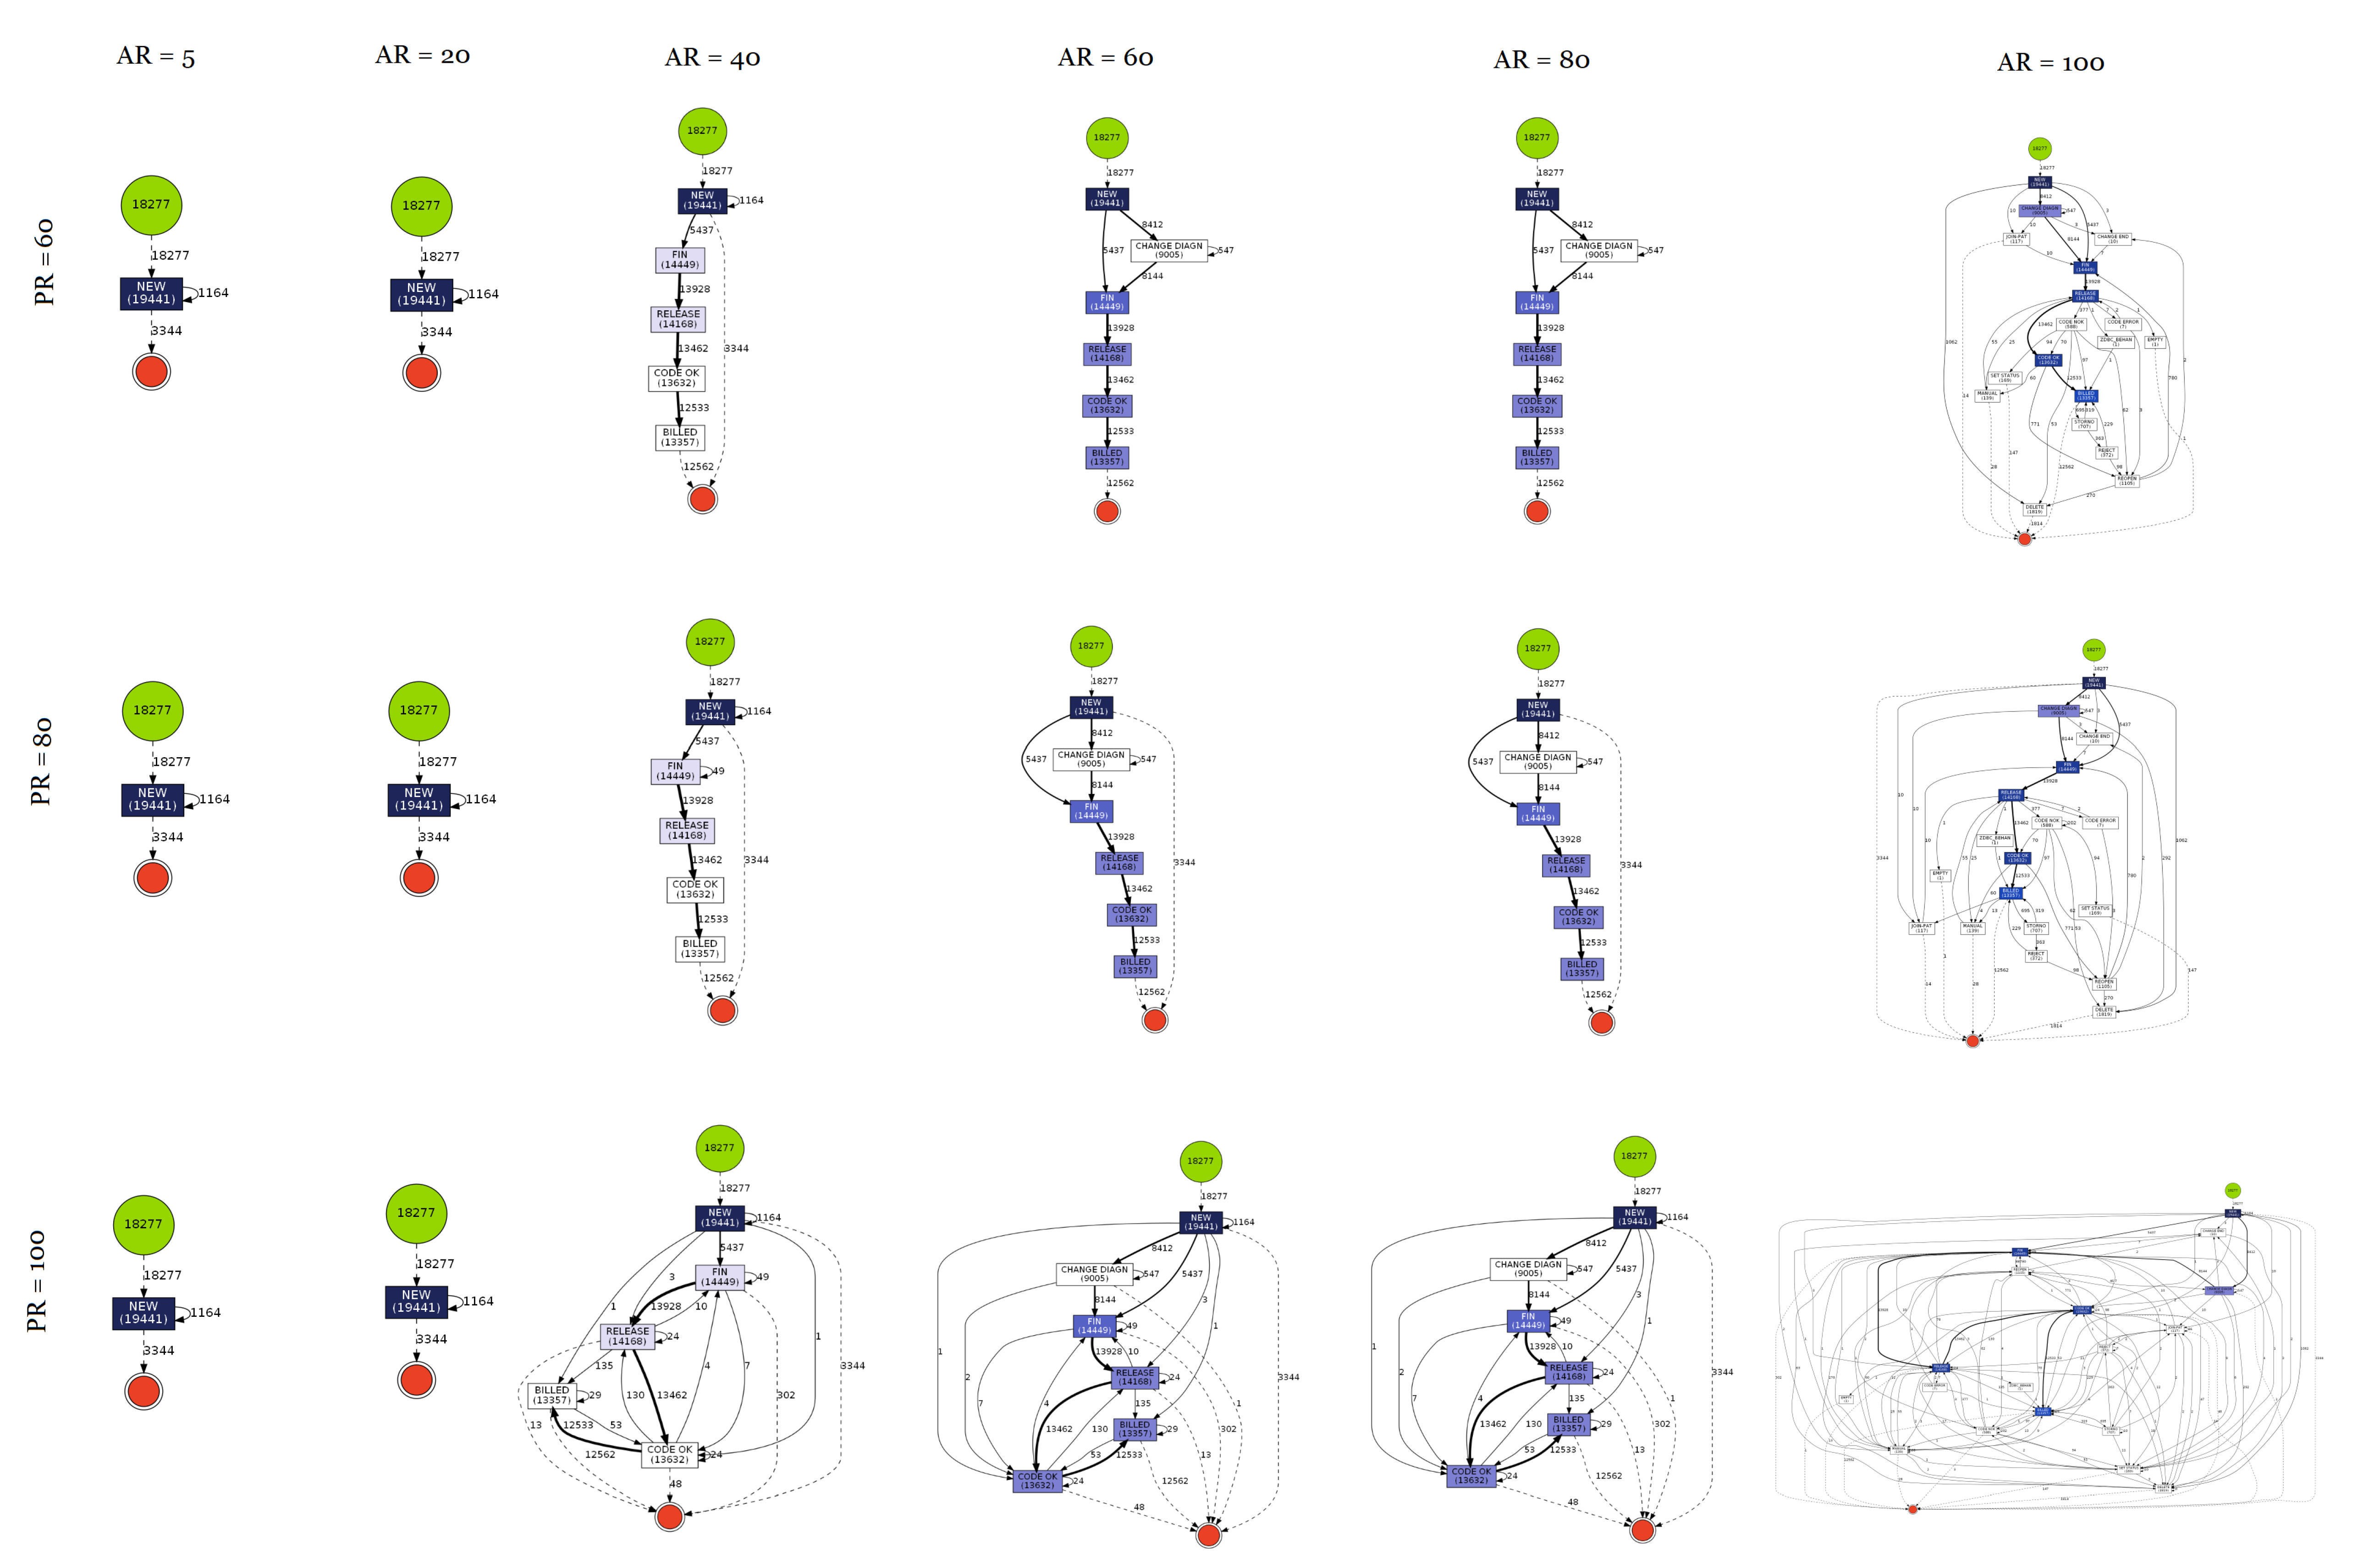
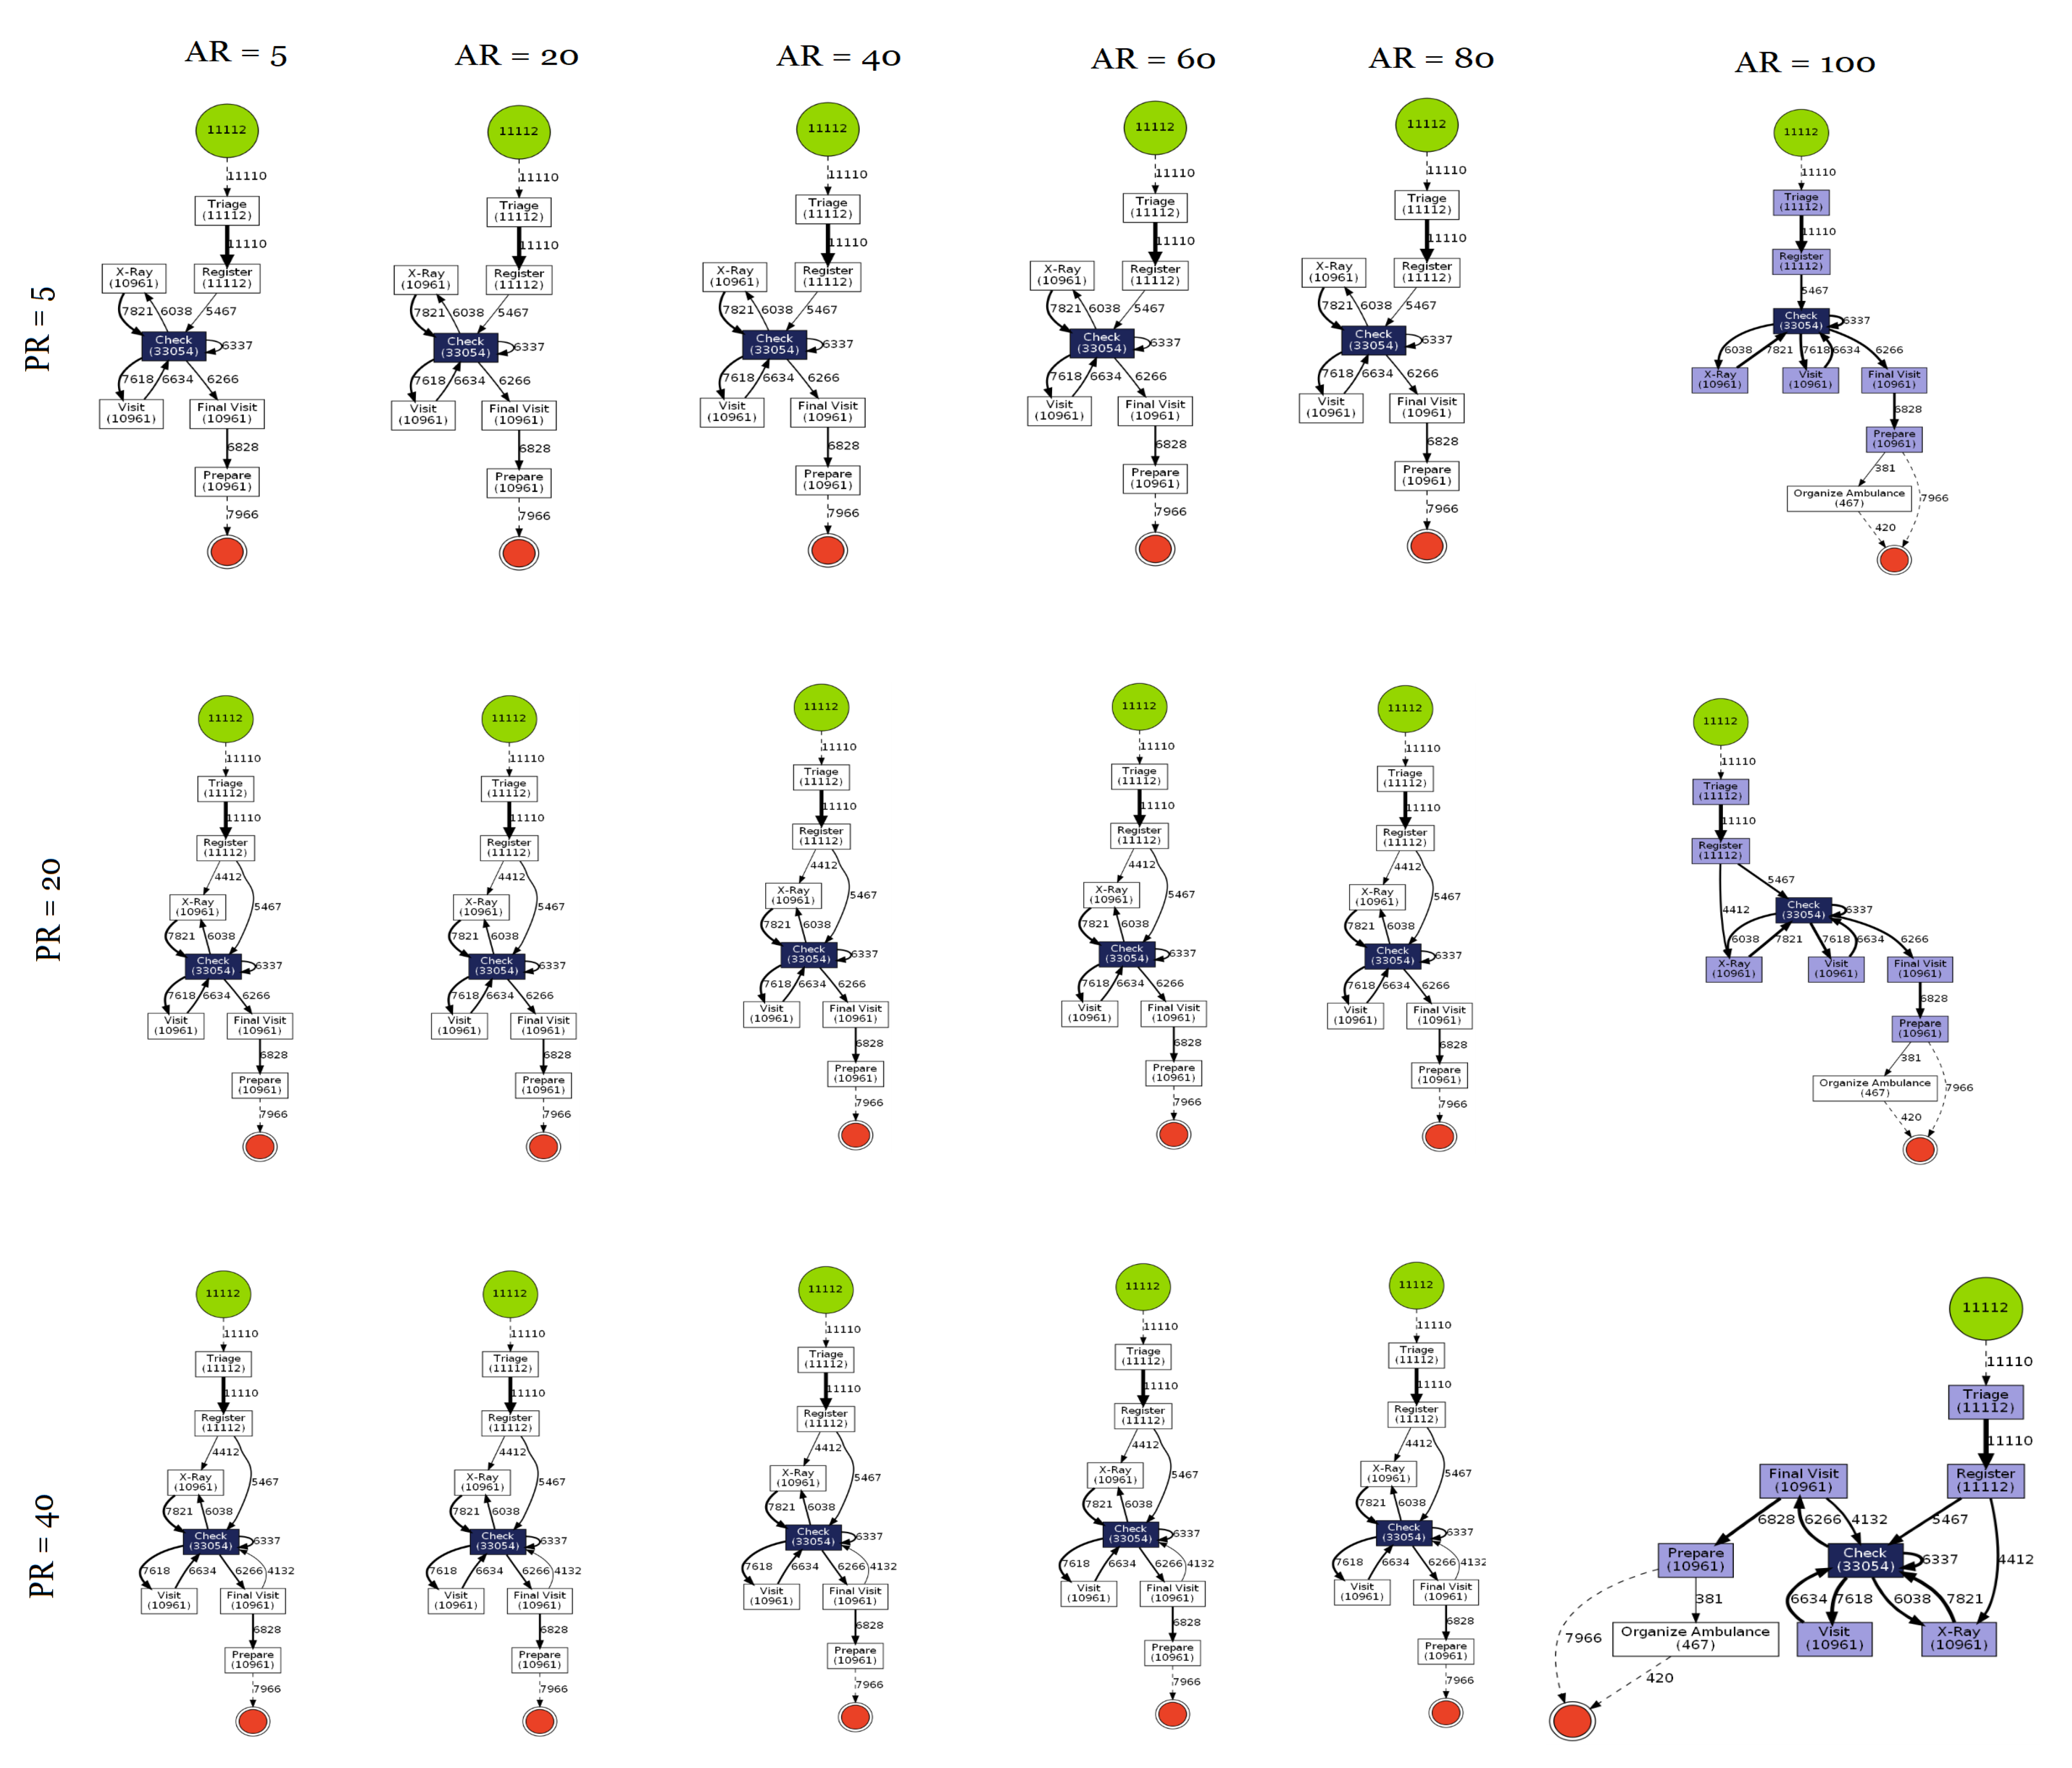
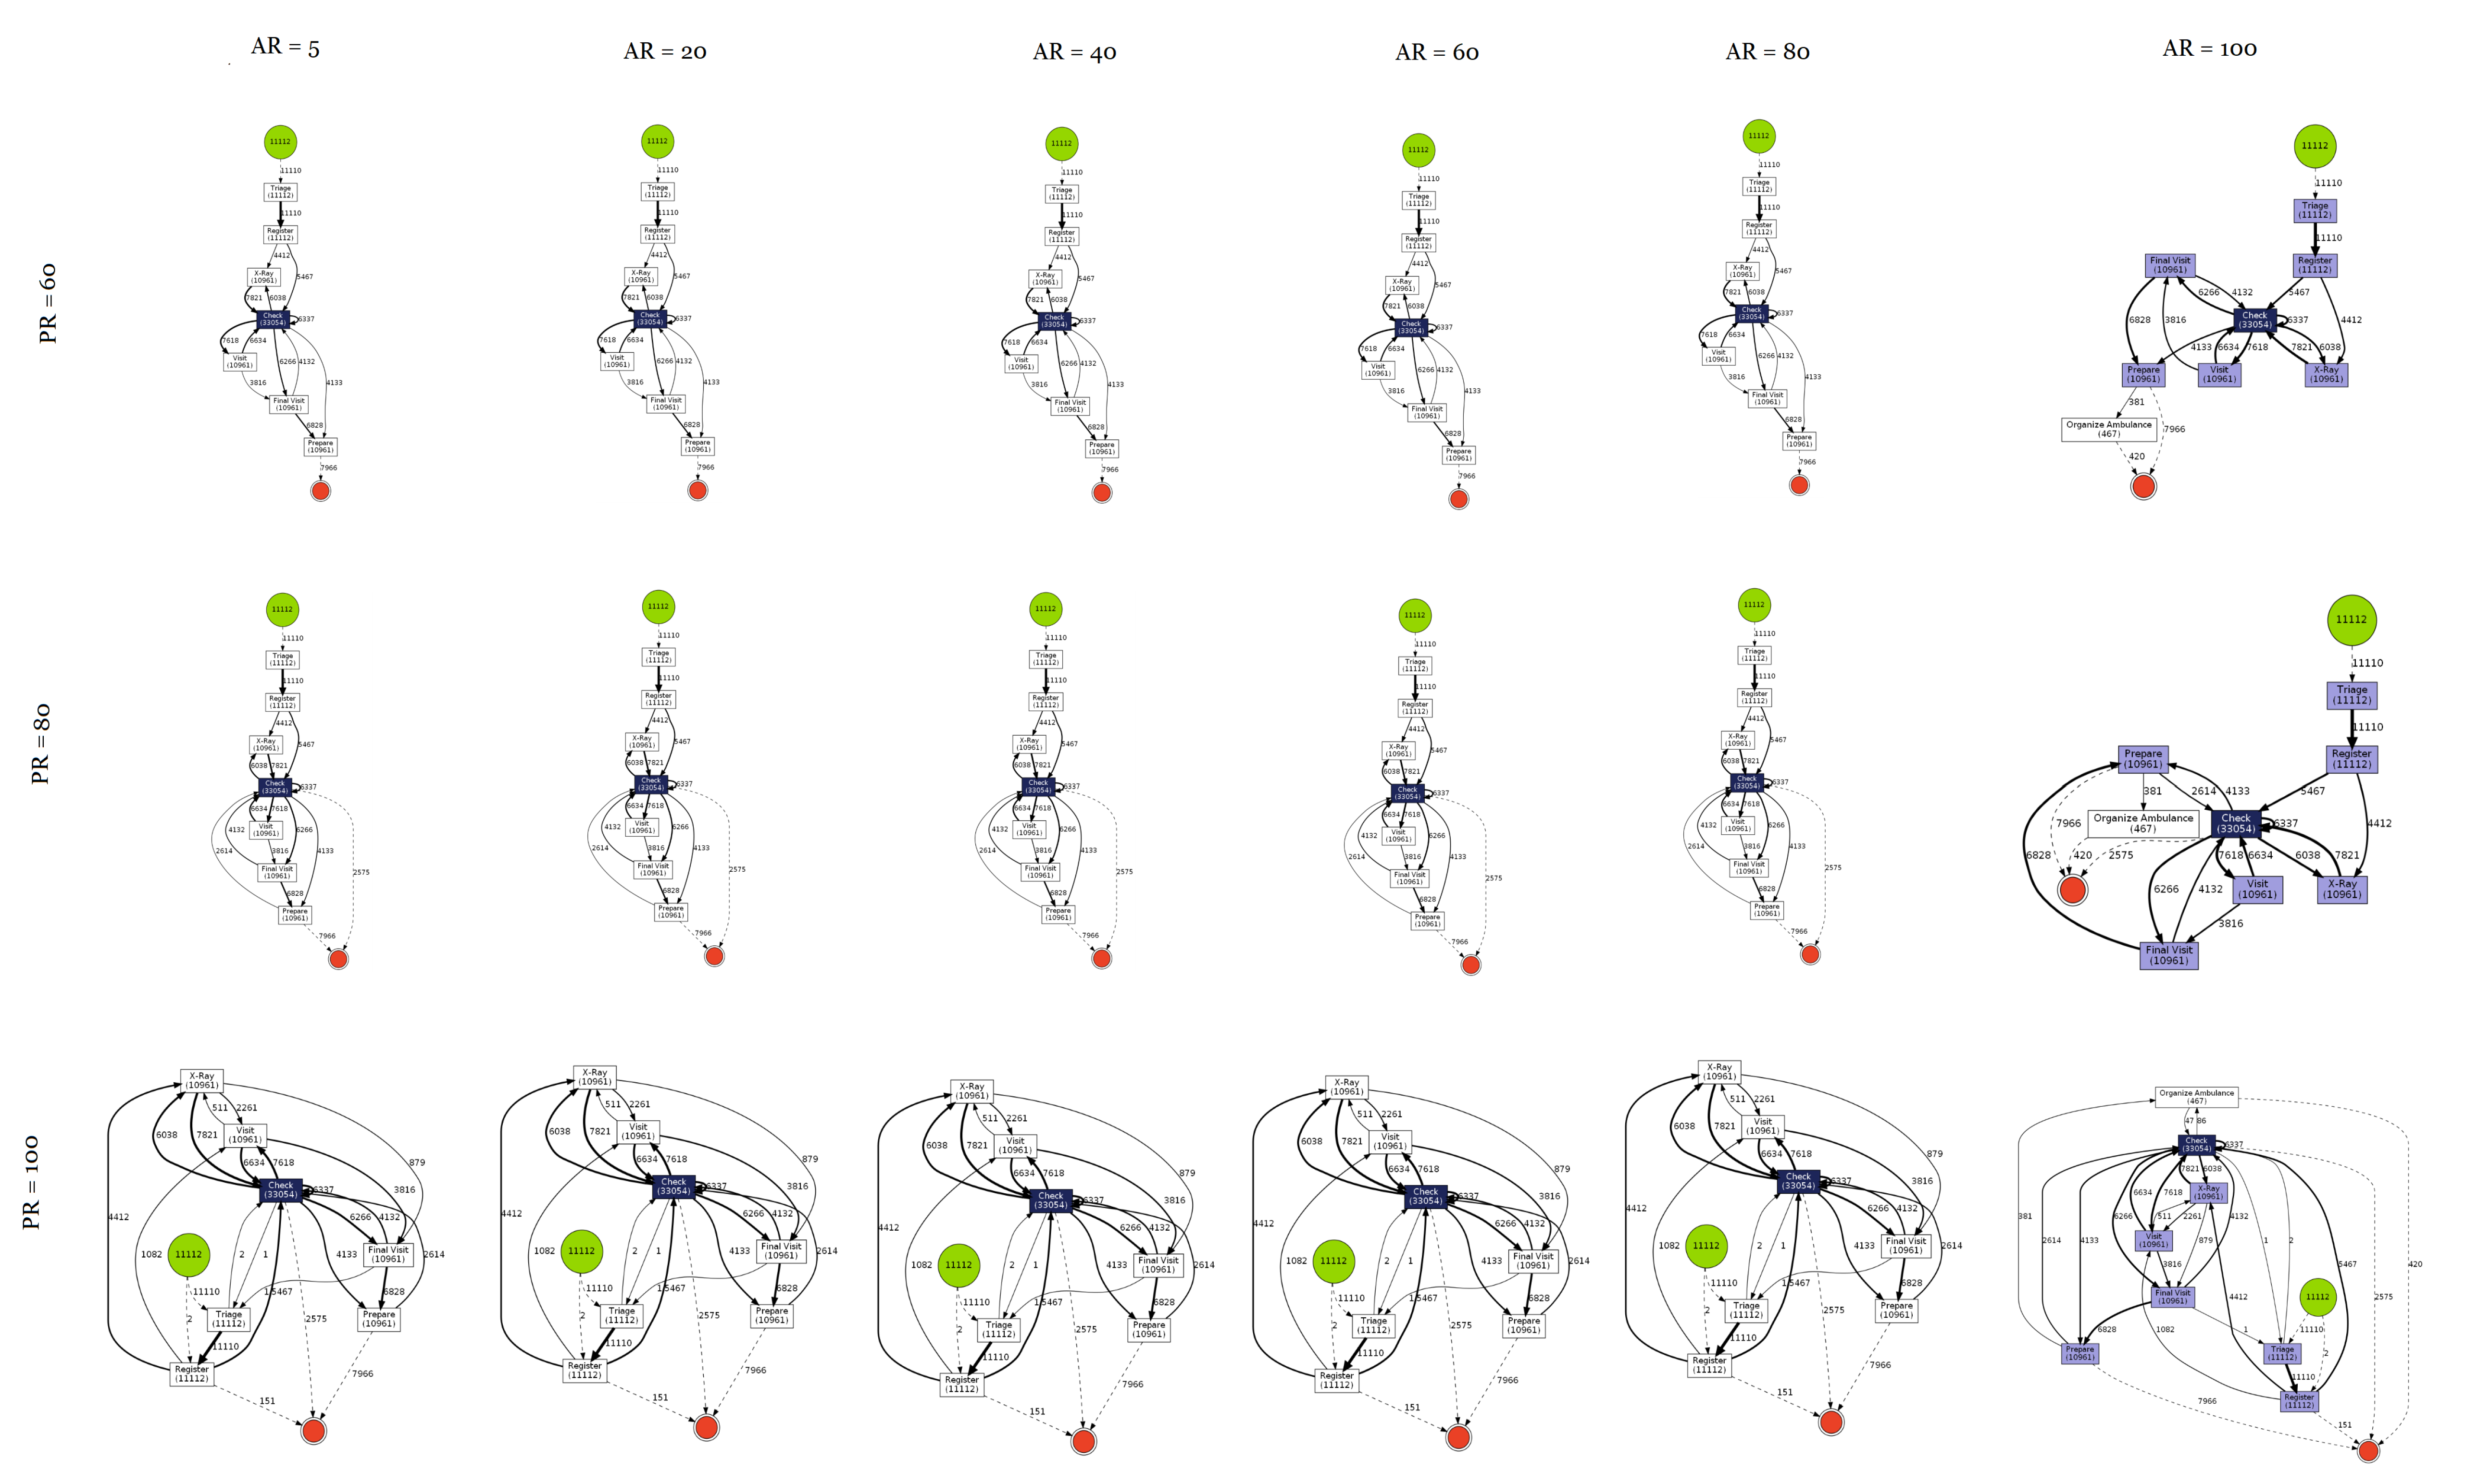
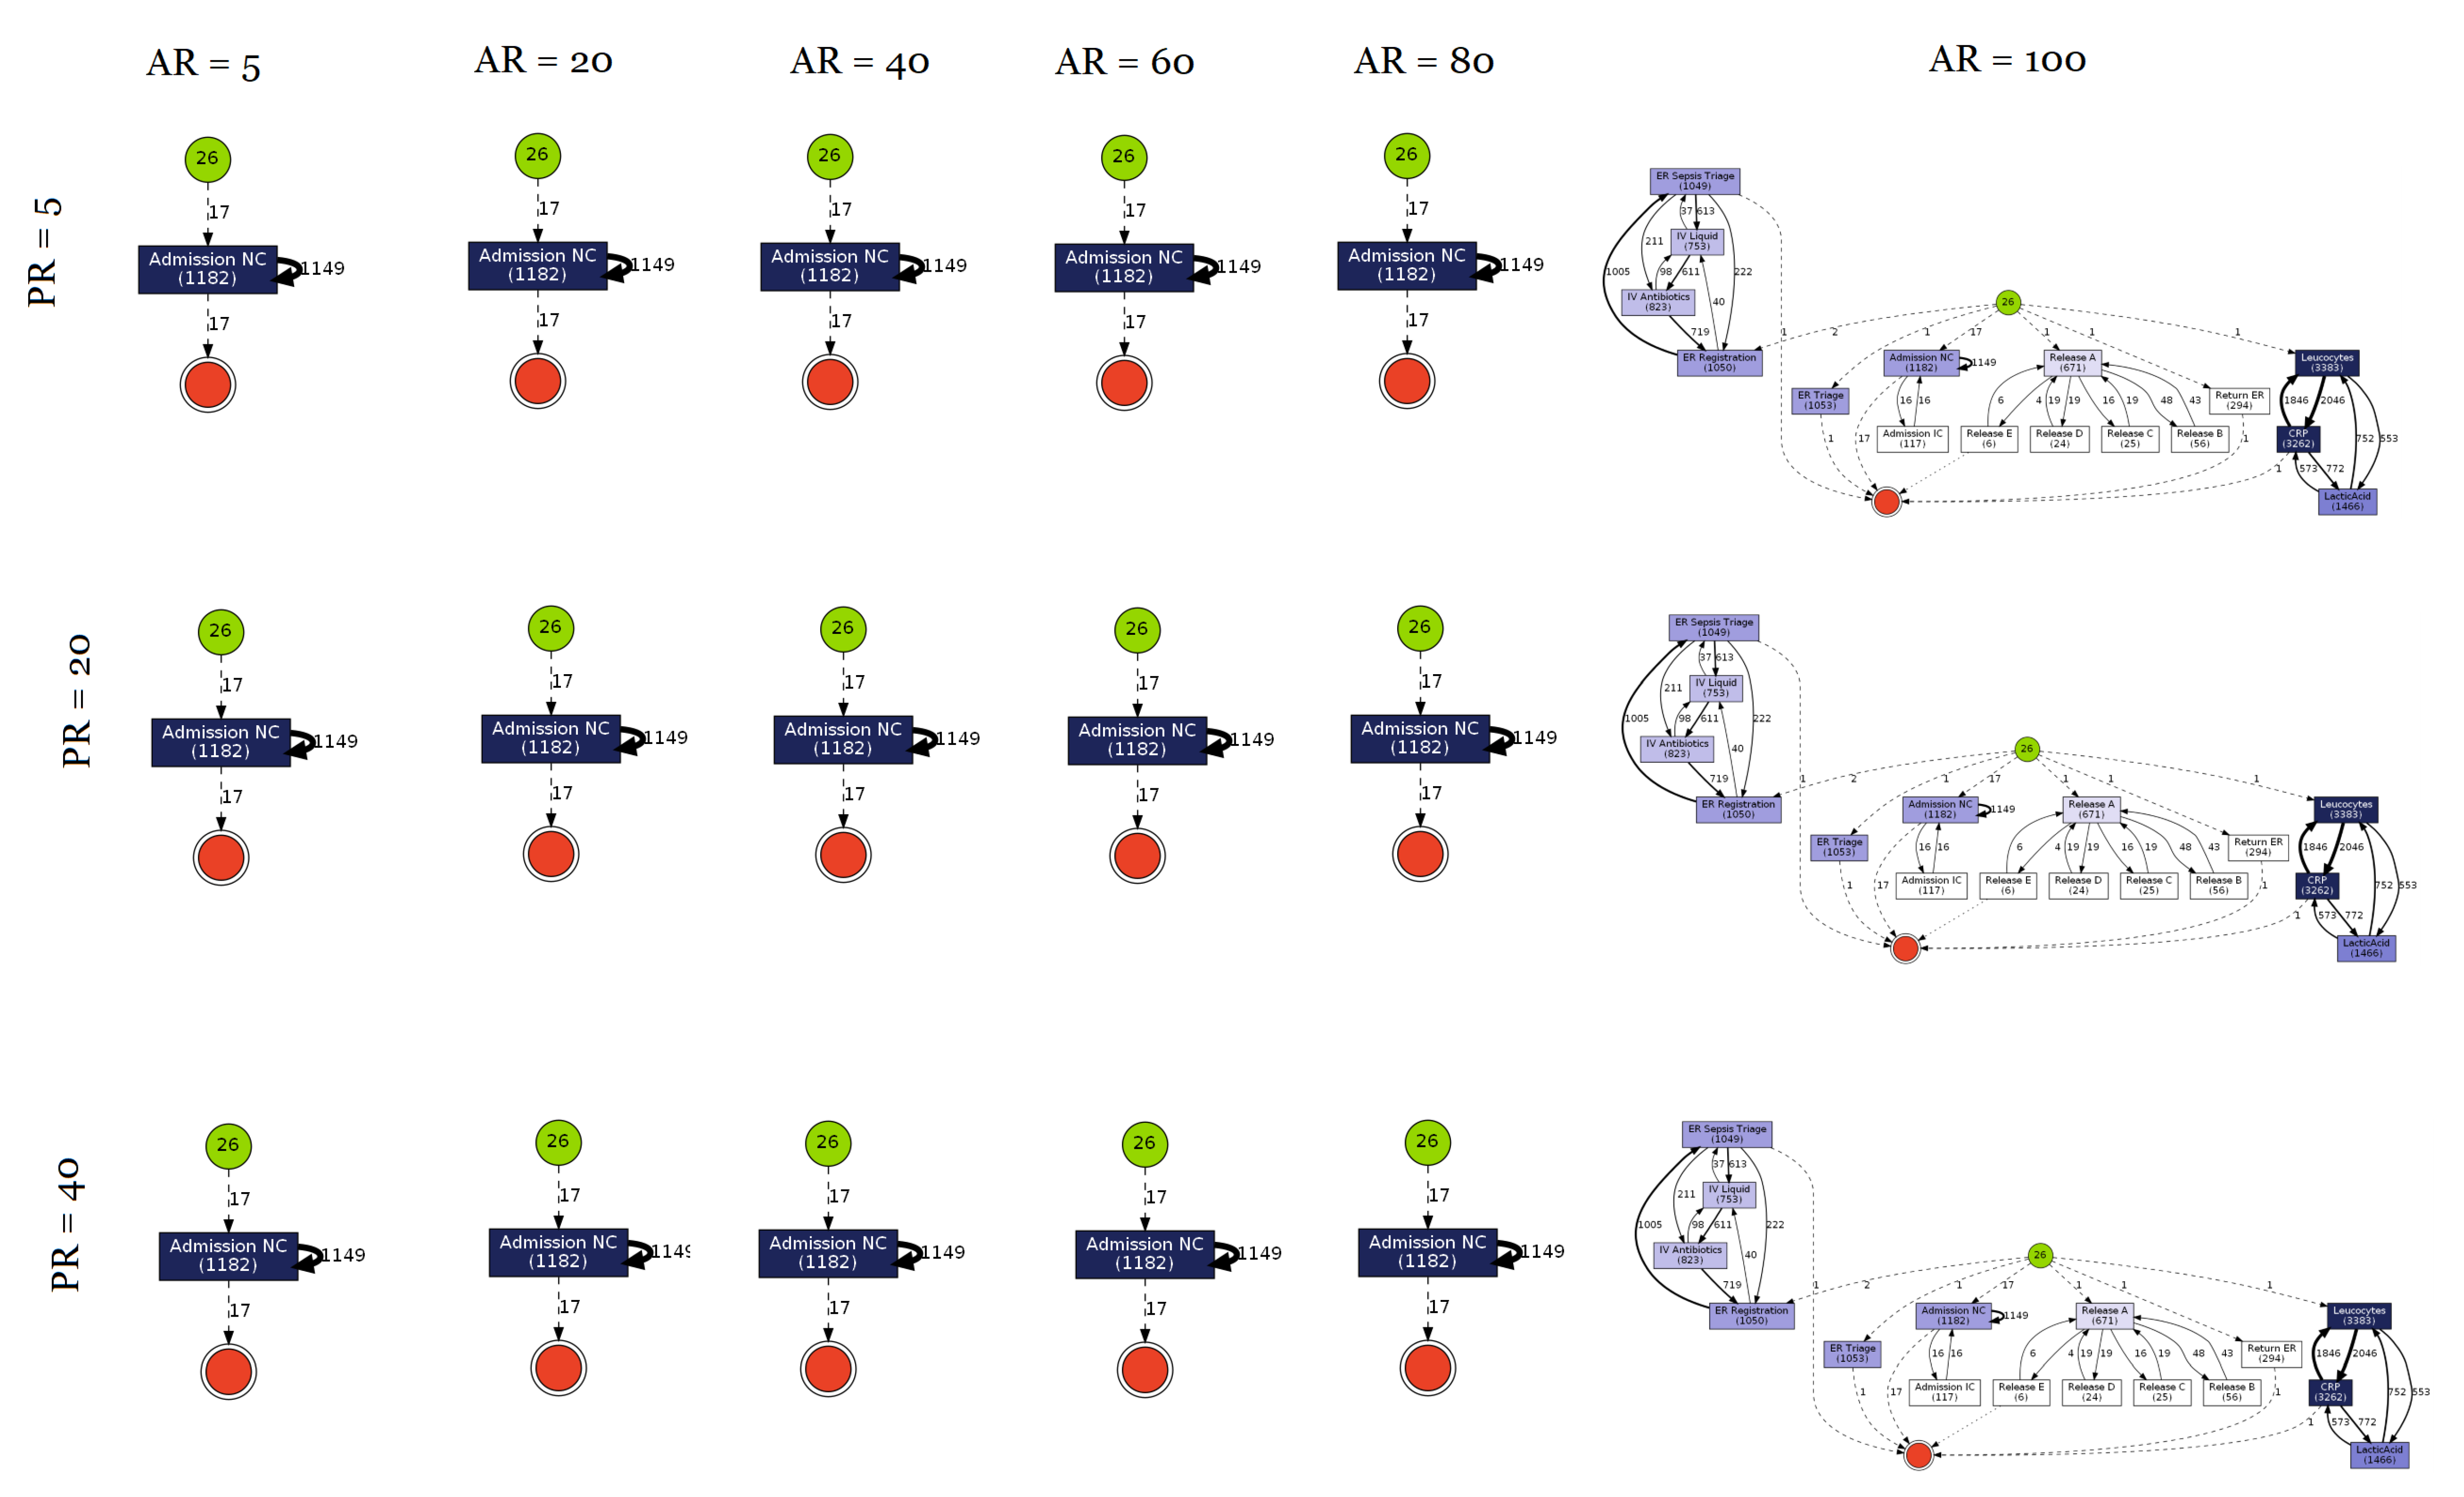
Appendix B. Process Model Graphs


Appendix C. Taxonomy of Metrics
| # | Metric | Year | Auth | Def. | Demo | Type | Src |
| 1 | Number of Activities (NOA) | 2006 | J. Cardoso et al. | Counts the number of activities in a process. | Y | D | [83] |
| 2 | Number of Activities and Control flow elements (NOAC) | 2006 | J. Cardoso et al. | Counts the number of activities and control flow elements in a process. | Y | D | [83] |
| 3 | Number of Activities, Joins and Splits (NOAJS) | 2006 | J. Cardoso et al. | Counts the number of activities, splits and joins in a process. (XOR, OR, AND) | Y | D | [83] |
| 4 | Cyclomatic Complexity (CYC) | 1976 | T.J. McCabe | Indicates the process’s control flow complexity by counting number of edges (e) and nodes (n) in the process graph. | Y | D | [105] |
| 5 | Control Flow Complexity (CFC) | 2005 | J. Cardoso | The metric is calculated by adding the CFC’s of all split constructs (XOR, OR, AND). | Y | PD | [106,107] |
| 6 | Process Volume (HPC_V) | 2006 | J. Cardoso et al. | Calculates the volume of a process using number of nodes and edges. | Y | D | [83] |
| 7 | Process Length (HPC_N) | 2006 | J. Cardoso et al. | Calculates a length of the process using number of nodes and edges. | Y | D | [83] |
| 8 | Process Difficulty (HPC_D) | 2006 | J. Cardoso et al. | Calculates a difficulty of the process using number of nodes and edges. | Y | D | [83] |
| 9 | Complexity of a Procedure (PC) | 1981 | S. Henry, D. Kafura | Using the number of calls to/from the module the metric is evaluated as PC = length * (fan-in * fan-out)⌃2. | Y | D | [108] |
| 10 | Interface Complexity (IC) | 2006 | S. Henry, D. Kafura | Using the number of inputs and outputs of an activity, the metric is evaluated as IC = length * (number of inputs * number of outputs)⌃2. | Y | D | [108] |
| 11 | Coefficient of Network Complexity (CNC) | 2006 | Antti M. Latva-Koivisto | Complexity CNC is calculated by dividing the number of arcs by the number of activities, joins and splits. (No of arcs / (No of activities, joins, and splits)). | N | D | [1] |
| 12 | Restrictiveness estimator (RT) | 2006 | Antti M. Latva-Koivisto | The metric calculates the number of sequences in the graph. | N | D | [1] |
| 13 | Complexity index (CI) | 2006 | J. Cardoso et al. | The metric performs an algorithmic calculation of the minimal number of node reductions required to reduce the process graph into a single node. | N | D | [83] |
| 14 | Cognitive Complexity Metrics (Weights) | 2006 | V Gruhn, R Laue | Using a pre-defined cognitive weight scale for BPM, the individual weight of the model is generated. | N | PD | [109] |
| 15 | Cognitive Functionality Size (CFS ) | 2003 | Shau and WangJ Shao, Y Wang | Evaluated using the cognitive functional size of the model. | Y | S | [110] |
| 16 | Extended Cardoso Metrics (EcaM) | 2009 | KB Lassen, WMP van der Aalst | The metric follows Cardoso approach for petri nets. It works by penalizing direct successor states in the model. | Y | D | [77] |
| 17 | Extended Cyclomatric Metrics (EcyM) | 2009 | KB Lassen, WMP van der Aalst | The behavioural complexity of the graph is calculated by creating and analysing a reachability matrix. | Y | D | [77] |
| 18 | Structuredness Metric (SM) | 2009 | KB Lassen, WMP van der Aalst | The structuredness of a model is a combination of behavioural and syntax complexity together. | Y | PD | [77] |
| 19 | Coupling | 2015 | J Cardoso et al. | Measured by counting the number of interconnections between modules. (If two activities have one ore more common data elements then they are termed as a ‘couple’). | Y | PD | [111] |
| 20 | Cohesion (Activity and Process Cohesion) | 2015 | J Cardoso et al. | The relativity between elements of a module is evaluated by determining the mean of all activity cohesion values. (i.e., sum of all cohesion values divided by the number of activities). | Y | PD | [111,112] |
| 21 | Modularity | 2015 | J Cardoso et al. | A black box approach defined by authors. It utilises any visual component of process model graphs to measure overall modularity. | Y | S | [111] |
| 22 | Size and Complexity Size | 2015 | J Cardoso et al. | Direct measurement of the size of the process model using all available features of the model. Similar to LOC metrics. | Y | D | [111] |
| 23 | Cross Connectivity Metric (CC) | 2008 | I Vanderfeesten et al. | Measures the strength of connections between nodes in a model and provides a relation between tightly knit nodes vs weakest link. | Y | D | [113] |
| 24 | Separability | 2007 | J Mendling, G Neumann | Calculated by obtaining a ratio of the number of cut vertices to the number of nodes. | Y | D | [114] |
| 25 | Sequentiality | 2007 | J Mendling, G Neumann | Calculated as the ratio of arcs of a sequence to the total number of arcs. | Y | PD | [114] |
| 26 | Structuredness | 2007 | J Mendling, G Neumann | Calculated as the numerical ratio of the number of nodes in the reduced process graph to the number of nodes in the original graph. | Y | PD | [114] |
| 27 | Cyclicity | 2007 | J Mendling, G Neumann | Calculated as the ratio between the number of nodes in any cycle in the model to the total number of nodes. | Y | PD | [114] |
| 28 | Parallelism | 2007 | J Mendling, G Neumann | The number of concurrent paths obtained after introduction of new control nodes such as AND or OR. | Y | PD | [114] |
| 29 | Precision | 2016 | HT Yang et al. | The number of correctly retrieved relationships divided by the total number of retrieved relationships. | Y | PD | [115] |
| 30 | Recall | 2016 | HT Yang et al. | The number of correctly retrieved relationships divided by the total number of correct relationships possible. | Y | PD | [115] |
| 31 | F-Measure | Generic harmonic mean of precision and recall. | |||||
| 32 | Precision at k | 2017 | WJ Vlietstra et al. | The number of reference compounds found up to rank k, divided by k (where k is the subset of compounds in the process graph). | Y | PD | [116] |
| 33 | Recall at k | 2017 | WJ Vlietstra et al. | The fraction of reference compounds found up to rank k (where k is the subset of compounds in the process graph). | Y | PD | [116] |
| 34 | Average Precision | 2014 | N Shang et al. | The average of the precision values measured at the point at which each correct results is retrieved for one example/trace. | Y | PD | [117] |
| 35 | Mean Average Precision | 2014 | N Shang et al. | The mean of average precision across all examples/samples. | Y | PD | [117] |
| 36 | Precision over time | 2006 | M Yetisgen-Yildiz, W Pratt | Precision calculated at time intervals which coincide with the time of event log data. | Y | PD | [118] |
| 37 | Recall over time | 2006 | M Yetisgen-Yildiz, W Pratt | Recall calculated at time intervals which coincide with the time of event log data. | Y | PD | [118] |
| 38 | 11-point average interpolated precision | 2009 | M Yetisgen-Yildiz, W Pratt | Relational evaluation to check how precision changes as recall levels increase for different log based datasets. | Y | S | [119] |
| 39 | Area Under Curve | Generic plot of metric operating characteristics for Models. | |||||
| 40 | Accuracy | 2015 | S Sang et al. | Amount of activity that is not supposed to be observed in the event log (similar to precision). | N | D | [120] |
| 41 | Cumulative Gain | 2017 | WJ Vlietstra et al. | Calculated by dividing the number of the weight points found up to rank k by k. | Y | D | [116] |
| 42 | Mean Reciprocal Rank | The mean of the reciprocal rank of the highest ranking correct answer. | |||||
| 43 | Correlation Analysis | Generic approach to relate one metric against another. | |||||
| 44 | Density Metric | 2008 | J Mendling | A structural metric calculated as a ratio of total number of arcs to the maximum number of arcs. | Y | PD | [84] |
| 45 | Imported Coupling of a Process metric (ICP) | 2009 | W Khlif et al. | The number of messages per subprocess divided by the sequence flows sent by the task of the subprocess or the subprocess itself. | N | PD | [121] |
| 46 | Exported Coupling of a Process metric (ECP) | 2009 | W Khlif et al. | The number of messages per subprocess divided by the sequence flows Received by the task of the subprocess or the subprocess itself. | N | PD | [121] |
| 47 | Fan-in/Fan-out metric (FIO) | 2006 | V Gruhn, R Laue | The count of all incoming and outgoing edges in a module of a graph evaluated using the formulation: ((fan-in)×(fan-out)). | N | PD | [122] |
| 48 | Diameter | 2008 | J Mendling | The length of the longest path from a start node to an end node in a process model. | Y | S | [84] |
| 49 | Number of nodes metric (Sn(G)) | 2008 | J Mendling | Number of nodes in a process model graph. | Y | S | [84] |
| 50 | Degree of connectors | 2008 | J Mendling | The average number of nodes a connector is connected to. | Y | S | [84] |
| 51 | Sequentiality metric (S(G)) /Sequentiality ratio | 2008 | J Mendling | The ratio between the number of arcs between none connector nodes divided by the total number of arcs. | Y | D | [84] |
| 52 | Max depth | 2008 | J Mendling | The maximum depth of all nodes. | Y | D | [84] |
| 53 | Concurrency | 2008 | J Mendling | The sum of the output—degree of AND-joins and OR-joins minus one. | Y | D | [84] |
| 54 | Heterogeneity | 2008 | J Mendling | The entropy of the model over different connector types. | Y | D | [84] |
| 55 | Cognitive complexity measure (W) | 2006 | V Gruhn, R Laue | A cognitive weight that measures the effort needed for comprehending the model. | Y | D | [109] |
| 56 | Fitness | 2012 | JCAM Buijs et al. | The ability of a model to reproduce the behaviour contained in a log. | Y | S | [86] |
| 57 | Generalization K fold cross validation | 1995 | R Kohavi | The ability of an automated discovery algorithm to discover process models that generate traces that are not present in the log, but can be produced by the business process during operation. | N | S | [123] |
| 58 | Generalization | 2012 | JCAM Buijs et al. | The extent to which the resulting model will be able to reproduce future behaviour of the process. | Y | PD | [86] |
| 59 | Alignment based Precision | 2012 | JCAM Buijs et al. | The ability of a model to generate only the behaviour found in the log or the amount of behaviour that is present only in the log and not made in the model. | Y | S | [86] |
| 60 | Simplicity | 2012 | JCAM Buijs et al. | The number of activities in the log is used to measure the perceived complexity of the model. | Y | S | [86] |
| 61 | Soundness | 1997 | WMP Van der Aalst | Evaluates the behavioural quality of a model by checking for incomplete criteria such as option to complete, proper completion and absence of dead transitions. | Y | S | [124] |
| 62 | Number of sub processes | 2018 | N Wang et al. | The total number of subprocesses in the model. | Y | S | [125] |
| 63 | Place/Transition degree (P/T – CD) | 2018 | N Wang et al. | The weighted sum of average number of arcs per transition to the average number of arcs per place. | Y | S | [125] |
| 64 | Cyclomatic Number (CN) | 2018 | N Wang et al. | The number of linearly independent paths in a process model where directions of the arcs are ignored (A measure of branching). | Y | D | [125] |
| 65 | Average Connector Degree (ACD) | 2018 | N Wang et al. | Measures the average number of connecting nodes by calculating the average count of incoming and outgoing arcs of places/ transitions per connector. | Y | PD | [125] |
| 66 | Average number of activities per sub process | 2018 | N Wang et al. | The metric is evaluated as the average number of activities per subprocess for different levels of process model abstraction. | Y | PD | [125] |
| 67 | Number of event classes and variants | 2018 | N Wang et al. | A count of unique process variants and unique activity classes. | Y | PD | [125] |
| 68 | Split-join ratio | 2006 | V Gruhn, R Laue | Evaluates the number of incoming and outgoing elements at splits (XOR, OR, AND). | Y | D | [122] |
| 69 | Nesting Depth (ND) | 2006 | V Gruhn, R Laue | The number of decisions in the control flow necessary to perform an activity. | Y | PD | [122] |
| 70 | Cognitive Complexity (CC) | 2006 | Y Wang, J Shao | Using derived weights for control structures, It is a measure of difficulty of understandability of a process model. | Y | S | [126] |
| 71 | Average Gateway Degree (AGD) | 2012 | L Sánchez-González et al. | The average number of incoming and outgoing edges of gateway nodes in a process model. | Y | S | [127] |
| 72 | Maximum Gateway Degree (MGD) | 2012 | L Sánchez-González et al. | The maximum sum of incoming and outgoing edges of the gateways. | Y | S | [127] |
| 73 | Gateway Mismatch (GM) | 2012 | L Sánchez-González et al. | The sum of gateway pairs that do not have match with each other. | Y | S | [127] |
| 74 | Gateway Heterogeneity (GH) | 2012 | L Sánchez-González et al. | The extent to which different types of gateways are used in the model. | Y | S | [127] |
| 75 | Total Number of Sequence Flows (TNSF) | 2006 | E Rolón et al. | Total number of sequence flows in a graph. | Y | D | [128,129] |
| 76 | Total Number of Events (TNE) | 2006 | E Rolón et al. and L Sánchez-González et al. | Total number of events in the model. | Y | D | [120,128] |
| 77 | Total Number of Gateways (TNG) | 2006 | E Rolón et al. | Total number of gateways in the model. | Y | D | [128] |
| 78 | Number of Sequence Flows from Events (NSFE) | 2006 | E Rolón et al. | Number of sequence flows incoming from an event. | Y | D | [128] |
| 79 | Number of Message Flows (NMF) | 2006 | E Rolón et al. | Number of message flows between participants in the process. | Y | D | [128] |
| 80 | Number of Sequence Flows from Gateways (NSFG) | 2006 | E Rolón et al. | Number of sequence flows incoming from gateway. | Y | D | [128] |
| 81 | Connectivity Level between Pools (CLP) | 2006 | E Rolón et al. | Connectivity level between pools of activities. | Y | D | [128] |
| 82 | Total Number of Data Objects (TNDO) | 2006 | E Rolón et al. | Total number of data objects in the process model. | Y | D | [128] |
| 83 | Number of Inclusive Decisions (NID) | 2006 | E Rolón et al. | Indicates the number of points of inclusive decision, and merging of the model. | Y | D | [128] |
| 84 | Number of Parallel Forking (NPF) | 2006 | E Rolón et al. | Indicates the number of points of parallel forking and joining of the process. | Y | D | [128] |
| 85 | Number of Pools (NP) | 2006 | E Rolón et al. | Number of pools in the process. | Y | D | [128] |
| 86 | Number of Complex Decisions (NCD) | 2006 | E Rolón et al. | Indicates the number of points of complex decision merging of the model. | Y | D | [128] |
| 87 | Number of Exclusive gateways based on Data (NEDDB) | 2006 | E Rolón et al. | Indicates the number of points of exclusive decision and merging based on data of the model. | Y | D | [128] |
| 88 | Number of Exclusive gateways based on Events (NEDEB) | 2006 | E Rolón et al. | Indicates the number of points of exclusive decision and merging based on events of the model. | Y | D | [128] |
| 89 | Number of Intermediate Message Events (NIMsE) | 2006 | E Rolón et al. | Number of intermediate messages between events. | Y | D | [128] |
| 90 | Number of End Message Events (NEMsE) | 2006 | E Rolón et al. | Number of end message events. | Y | D | [128] |
| 91 | Total Number of Collapsed processes (TNCS) | 2006 | E Rolón et al. | Total number of collapsed sub-process of the model. | Y | D | [128] |
| 92 | Connectivity Level between Activities (CLA) | 2006 | E Rolón et al. | Connectivity level between activities. | Y | D | [128] |
| 93 | Anti-patterns | 2000 | J Paakki et al. | Commonly occurring solutions to a problem that are known to have negative consequences is evaluated. | Y | S | [18,130] |
| 94 | Knot count | 2007 | V Gruhn et al. and MR Woodward et al. | A measure of the number of paths associated when transfer of control intersect (overlap). | Y | PD | [18,131] |
| 95 | Log-Based Complexity (LBC) | 2007 | J Cardoso | The number of unique log traces that can be generated from the execution of a workflow. | Y | S | [132] |
| 96 | Average Vertex degree ((A)VG) | 2008 | J Mendling | Summarises whether vertices are connected to many or to few other vertices, where degree d(v) of a vertex is the number of edges that are connected to it. | Y | S | [84] |
| 97 | Quantity of Decisions to be made per pool/participant (CUDP) | 2010 | N Debnath et al. | Evaluates the quantity of decision nodes inside a pool in the model. | Y | S | [133] |
| 98 | Quantity of tasks executed in a specific pool/participant (CTP) | 2010 | N Debnath et al. | Evaluates the the load level for each pool. | Y | S | [133] |
| 99 | Quantity of tasks of a swim-lane of a pool (CTSP) | 2010 | N Debnath et al. | Evaluates the organization and distribution of tasks inside a pool. | Y | S | [133] |
| 100 | Proportion of task distribution per Participant (PTP) | 2010 | N Debnath et al. | Evaluates the proportion of tasks for one task in relation to the total of process tasks. | Y | S | [133] |
| 101 | Proportion of tasks per swim-lane of a Specific Pool (PTSP) | 2010 | N Debnath et al. | Calculated as the proportion of tasks per actor (swim-lane) of a specific participant (pool). | Y | S | [133] |
| 102 | Quantity of Subprocesses per pool (NSBPart) | 2010 | N Debnath et al. | The number of sub-processes per participant. | Y | S | [133] |
| 103 | Quantity of Message Flows between two pools (NFPart) | 2010 | N Debnath et al. | The number of messages (Flowing) between two participants. | Y | S | [133] |
| 104 | Durfee Square Metric (DSP) | 2012 | K Kluza, GJ Nalepa | Calculates the relation between occurrence, frequency and threshold of an element. | Y | D | [134] |
| 105 | Perfect Square Metric (PSM) | 2012 | K Kluza, GJ Nalepa | It is Pth (unique) largest number such that the top element occurs at least (P×2) times. | Y | D | [134] |
| 106 | Structural complexity by Cheng | 2008 | Cheng, Chen-Yang | The expected amount of information required for defining the state of the process flow. | Y | S | [135] |
| 107 | Interaction Complexity by Cheng | 2008 | Cheng, Chen-Yang | The relation between average information in the model and complexity of the same model. | Y | S | [135] |
| 108 | Usability Complexity by Cheng | 2008 | Cheng, Chen-Yang | The relation between the number of interactions in the model vs the operators required to complete a task in consideration. | Y | S | [135] |
| 109 | Total Operational Complexity by Cheng | 2008 | Cheng, Chen-Yang | The euclidean norm of the structural, interactional and usability complexities used according to their weightage. | Y | S | [135] |
| 110 | GQM-based Complexity Metrics | 2008 | AAA Ghani et al. | Used to asses the understandability and maintainability of the process model by designing a set of questions aimed to fulfil the goal and adapting the metrics to them. | Y | D | [136] |
| 111 | Gateway Complexity Indicator (GCI) | 2012 | L Sánchez-González et al. | It is the weighted sum of (CFC, GM, GH, AGD, MGD, TNG). | Y | D | [20] |
| 112 | Trace based L2M precision and recall | 2019 | AF Syring et al. | Recall is defined as the number of traces occurring in both event log and model divided by the number of traces in the log, The precision is defined as the number of traces occurring in both log and model divided by the number of traces in the model. | N | PD | [137] |
| 113 | Frequency based L2M recall | 2019 | AF Syring et al. | The number of times a unique trace occurs in both event log and model divided by the length of the trace. | N | PD | [137] |
| 114 | Causal footprint recall | 2019, 2004 | AF Syring et al. and WMP Van der Aalst et al. | The causal dependency between two activities. (If activity X is followed by Y but Y is never followed by X then, there is a causal dependency between X and Y.) | Y | D | [3,137] |
| 115 | Token replay recall | 2019, 2008 | AF Syring et al. and A Rozinat et al. | The recall is calculated by replaying the log on the model and counting the mismatches as missing and remaining tokens. | Y | D | [3,137] |
| 116 | Alignment recall | 2012 | WMP Van der Aalst et al. | The metric maps steps taken in the event log to that of the model and tracks the deviations occurring between them during replay of the logs. | Y | D | [138] |
| 117 | Behavioural recall | 2009 | S Goedertier et al. | The metric is determined using true positive and false negative conditions between event log and process model (i.e. Transitional state of activities). | Y | PD | [139] |
| 118 | Projected recall | 2018 | SJJ Leemans et al. | Calculated by projecting the event log and model on all possible subsets of activities of size k and solving the fraction of behaviour allowed by the minimal log-automaton, then divided by the allowed minimal model-automaton per projection. | Y | PD | [140] |
| 119 | Continued parsing measure | 2006 | A Weijters et al. | Calculated by counting the number of input and output activities, in active and inactive state w.r.t the model and the event log. | Y | PD | [141] |
| 120 | Eigenvalue recall | 2018 | A Polyvyanyy et al. | Calculated by evaluating the relational eigenvalues of event log and metric and setting them in relation. | Y | PD | [142] |
| 121 | Simple behavioural appropriateness | 2008 | A Rozinat et al. | The mean number of enabled/used transitions for each unique trace in relation to the visible traces in the process model. | Y | PD | [143] |
| 122 | Advanced behavioural appropriateness | 2008 | A Rozinat et al. | Calculated by describing the relation between event log and process model by analysing whether activities follow each other or precede each other. | Y | PD | [143] |
| 123 | ETC-one/ETC-rep | 2010 | J Munoz-Gama et al. | Evaluates the states of the model visited by the event log. For each, state the precision, which is calculated as the weighted sum of non escaping edges to the total edges. | Y | PD | [144] |
| 124 | Behavioural specificity (precM) and Behavioural precision | 2009 | S Goedertier et al. | Calculated by generating a confusion matrix of true positive, false positive and true negative relations between model and event log. | Y | PD | [139] |
| 125 | Weighted negative event precision | 2013 | SKLM vanden Broucke et al. | Calculated by generating matching subsets of preceding events in the log and finding their occurrence frequency. | Y | PD | [145] |
| 126 | Projected precision | 2018 | SJJ Leemans et al. | Calculated by analysing the conjunction of behaviour between model and event log. The final numeric is attained by making subsets of activities and averaging against the total number of subsets. | Y | PD | [140] |
| 127 | Anti-alignment precision | 2016 | BF van Dongenm et al. | The anti-alignment of each trace averaged by the total number of traces, where a single trace removed from the log makes it impossible for the rest of the log and model, to be precise. | Y | PD | [146] |
| 128 | Eigenvalue precision | 2018 | A Polyvyanyy et al. | Calculated as the relational behavioural eigenvalues of log and metric when in relation. | Y | PD | [142] |
| 129 | Weighted negative event generalization | 2013 | SKLM vanden Broucke et al. | The weightage of events that could be replayed without errors that confirm the model is general. | Y | PD | [145] |
| 130 | Anti-alignment generalization | 2016 | BF van Dongenm et al. | The maximum distance between the states visited by the log and the states visited by the anti-alignment log (i.e., the subset of log without a trace). | Y | PD | [146] |
| 131 | Completeness | 2009 | C Batini et al. | Calculated as the number of NOT null values divided by the total number of values in event log or model (values can be activities or edges). | N | D | [147] |
| 132 | Consistency | 2009 | C Batini et al. | Calculated as the number of consistent values divided by the number of total values (values can be activities or edges). | N | D | [147] |
| 133 | Uniqueness | 2009 | C Batini et al. | Calculated as the number of duplicates in the log or model. | N | D | [147] |
| 134 | Appropriate amount of data | 2009 | C Batini et al. | The number of data units needed to represent a trace or log divided by the number of data units provided in the model. | N | D | [147] |
| 135 | Tasks | 2008 | H Reijers, J Mendling | Total number of tasks in the model or event log. | Y | PD | [148] |
| 136 | Nodes | 2008 | H Reijers, J Mendling | Total number of nodes in the process model. | Y | PD | [148] |
| 137 | Arcs | 2008 | H Reijers, J Mendling | Total number of arcs in the model. | Y | PD | [148] |
| 138 | Subproc | 2008 | H Reijers, J Mendling | Total number of subprocesses in model. | Y | PD | [148] |
| 139 | To | 1992 | LG Soo, Y Jung-Mo | Average number of outgoing edges from transitions (tasks). | Y | PD | [149] |
| 140 | Po | 1992 | LG Soo, Y Jung-Mo | Average number of outgoing edges from places (milestones). | Y | PD | [149] |
References
- Latva-Koivisto, A.M. Finding a Complexity Measure for Business Process Models; Research Report; Helsinki University of Technology: Espoo, Finland, 13 February 2001. [Google Scholar]
- Rozinat, A.; De Medeiros, A.A.; Günther, C.W.; Weijters, A.; Van der Aalst, W.M. Towards an Evaluation Framework for Process Mining Algorithms; BPM Center Report BPM-07-06; BPMcenter. org; Eindhoven University of Technology: Eindhoven, The Netherlands, 2007; Volume 123, p. 142. [Google Scholar]
- Van der Aalst, W.; Weijters, T.; Maruster, L. Workflow mining: Discovering process models from event logs. IEEE Trans. Knowl. Data Eng. 2004, 16, 1128–1142. [Google Scholar] [CrossRef]
- Kueng, P.; Kawalek, P. Goal-based business process models: Creation and evaluation. Bus. Process. Manag. J. 1997, 3, 17–38. [Google Scholar] [CrossRef]
- Hommes, B.J.; Van Reijswoud, V. Assessing the quality of business process modelling techniques. In Proceedings of the 33rd Annual Hawaii International Conference on System Sciences, Maui, HI, USA, 7 January 2000; p. 10. [Google Scholar]
- Rozinat, A.; Medeiros, A.; Günther, C.; Weijters, A.; Aalst, W. The Need for a Process Mining Evaluation Framework in Research and Practice In Business Process Management Workshops: BPM 2007 International Workshops, BPI, BPD, CBP, ProHealth, RefMod, semantics4ws, Brisbane, Australia, 24 September 2007; Springer: Berlin/Heidelberg, Germany, 2007; Volume 4928, pp. 84–89. [Google Scholar] [CrossRef] [Green Version]
- Turner, C.J.; Tiwari, A.; Olaiya, R.; Xu, Y. Process mining: From theory to practice. Bus. Process. Manag. J. 2012, 18, 493–512. [Google Scholar] [CrossRef] [Green Version]
- Born, A.; Dorsan, N.; Therese Lalor, U.; Özkan, D.; Signore, M. Recent developments in the Generic Statistical Business Process Model: Revisions and Quality Indicators; European Conference on Quality in Official Statistics: Krakow, Poland, 2018. [Google Scholar]
- Heidari, F.; Loucopoulos, P. Quality evaluation framework (QEF): Modeling and evaluating quality of business processes. Int. J. Account. Inf. Syst. 2014, 15, 193–223. [Google Scholar] [CrossRef]
- Dani, V.S.; Freitas, C.M.D.S.; Thom, L.H. Ten years of visualization of business process models: A systematic literature review. Comput. Stand. Interfaces 2019, 66, 103347. [Google Scholar] [CrossRef]
- Van Der Aalst, W. Process Mining: Discovery, Conformance and Enhancement of Business Processes; Springer: Heidelberg/Berlin, Germany, 2011; Volume 2. [Google Scholar]
- Van Der Aalst, W. Process Mining: Data Science in Action; Springer: Heidelberg/Berlin, Germany, 2016; Volume 2. [Google Scholar]
- Reinkemeyer, L. Process Mining in Action Principles, Use Cases and Outlook: Principles, Use Cases and Outlook; Springer: Cham, Switzerland, 2020. [Google Scholar] [CrossRef]
- Günther, C.W. Process Mining in Flexible Environments; Technische Universiteit Eindhoven: Eindhoven, The Netherlands, 2009. [Google Scholar] [CrossRef]
- Burattin, A. Process Mining Techniques in Business Environments; Lecture Notes in Business Information Processing; Springer: Cham, Swizterland, 2015; Volume 207. [Google Scholar]
- Fernandez-Llatas, C. Interactive Process Mining in Healthcare; Springer: Cham, Swizterland, 2021. [Google Scholar] [CrossRef]
- Van der Aalst, W.M.; Weijters, A.J. Process mining: A research agenda. Comput. Ind. 2004, 53, 231–244. [Google Scholar] [CrossRef] [Green Version]
- Gruhn, V.; Laue, R. Approaches for business process model complexity metrics. In Technologies for Business Information Systems; Springer: Dordrecht, The Netherlands, 2007; pp. 13–24. [Google Scholar]
- Mendling, J.; Recker, J.; Reijers, H.A. Process Modeling Quality: A Framework and Research Agenda; BPM Center Report BPM-09-02, BPM Center Report. org; Technische Universiteit Eindhoven: Eindhoven, The Netherlands, 2009; Available online: https://www.win.tue.nl/~hreijers/H.A.%20Reijers%20Bestanden/TechnicalReport.pdf (accessed on 30 April 2023).
- Sánchez-González, L.; García, F.; Ruiz, F.; Mendling, J. Quality indicators for business process models from a gateway complexity perspective. Inf. Softw. Technol. 2012, 54, 1159–1174. [Google Scholar] [CrossRef] [Green Version]
- Dijkman, R.; Dumas, M.; Van Dongen, B.; Käärik, R.; Mendling, J. Similarity of business process models: Metrics and evaluation. Inf. Syst. 2011, 36, 498–516. [Google Scholar] [CrossRef] [Green Version]
- Augusto, A.; Armas-Cervantes, A.; Conforti, R.; Dumas, M.; La Rosa, M. Measuring fitness and precision of automatically discovered process models: A principled and scalable approach. IEEE Trans. Knowl. Data Eng. 2020, 34, 1870–1888. [Google Scholar] [CrossRef]
- Sadowska, M. An approach to assessing the quality of business process models expressed in BPMN. E-Inform. Softw. Eng. J. 2015, 9, 57–77. [Google Scholar]
- Wynn, D.C.; Clarkson, P.J. Process models in design and development. Res. Eng. Des. 2018, 29, 161–202. [Google Scholar] [CrossRef] [Green Version]
- Martin, N.; De Weerdt, J.; Fernández-Llatas, C.; Gal, A.; Gatta, R.; Ibáñez, G.; Johnson, O.; Mannhardt, F.; Marco-Ruiz, L.; Mertens, S.; et al. Recommendations for enhancing the usability and understandability of process mining in healthcare. Artif. Intell. Med. 2020, 109, 101962. [Google Scholar] [CrossRef]
- Kubrak, K.; Milani, F.; Nolte, A. Process mining for process improvement-an evaluation of analysis practices. In Proceedings of the Research Challenges in Information Science: 16th International Conference, RCIS 2022, Barcelona, Spain, 17–20 May 2022; Springer: Cham, Switzerland, 2022; pp. 214–230. [Google Scholar]
- SáNchez-GonzáLez, L.; GarcíA, F.; Ruiz, F.; Piattini, M. Towards a quality framework for business process models. Int. J. Coop. Inf. Syst. 2013, 22, 1350003. [Google Scholar] [CrossRef]
- Overhage, S.; Birkmeier, D.Q.; Schlauderer, S. Quality marks, metrics, and measurement procedures for business process models: The 3QM-framework. Bus. Inf. Syst. Eng. 2012, 4, 229–246. [Google Scholar] [CrossRef]
- Moreno-Mones de Oca, I.; Snoeck, M. Pragmatic Guidelines for Business Process Modeling; FEB Research Report KBI_1509; KU Leuven, Faculty of Economics and Business (FEB), Department of Decision Sciences and Information Management: Leuven, Belgium, 2015. [Google Scholar]
- Mendling, J.; Reijers, H.A.; van der Aalst, W.M. Seven process modeling guidelines (7PMG). Inf. Softw. Technol. 2010, 52, 127–136. [Google Scholar] [CrossRef] [Green Version]
- Avila, D.T. Process Modeling Guidelines: Systematic Literature Review and Experiment. Masters Dissertation, Federal University of Rio Grande do Sul, Farroupilha, Brazil, 2018. Available online: https://www.lume.ufrgs.br/handle/10183/175028 (accessed on 30 April 2023).
- Kahloun, F.; Ghannouchi, S.A. Improvement of quality for business process modeling driven by guidelines. Procedia Comput. Sci. 2018, 126, 39–48. [Google Scholar] [CrossRef]
- Muketha, G.M.; Abd Ghani, A.; Selamat, M.; Atan, R. A Survey of Business Processes Complexity Metrics; Asian Network for Scientific Information: Faisalabad, Pakistan, 2010. [Google Scholar] [CrossRef] [Green Version]
- John, T.; Kundisch, D.; Szopinski, D. Visual Languages for Modeling Business Models: A Critical Review and Future Research Directions. In Proceedings of the ICIS, Seoul, Republic of Korea, 10–13 December 2017. [Google Scholar]
- Jun, G.T.; Ward, J.; Morris, Z.; Clarkson, J. Health care process modelling: Which method when? Int. J. Qual. Health Care 2009, 21, 214–224. [Google Scholar] [CrossRef] [Green Version]
- La Rosa, M.; Wohed, P.; Mendling, J.; Ter Hofstede, A.H.; Reijers, H.A.; van der Aalst, W.M. Managing process model complexity via abstract syntax modifications. IEEE Trans. Ind. Inform. 2011, 7, 614–629. [Google Scholar] [CrossRef] [Green Version]
- La Rosa, M.; ter Hofstede, A.H.M.; Wohed, P.; Reijers, H.A.; Mendling, J.; van der Aalst, W.M.P. Managing Process Model Complexity via Concrete Syntax Modifications. IEEE Trans. Ind. Inform. 2011, 7, 255–265. [Google Scholar] [CrossRef] [Green Version]
- Kluza, K. Measuring complexity of business process models integrated with rules. In Proceedings of the Artificial Intelligence and Soft Computing: 14th International Conference, ICAISC 2015, Zakopane, Poland, 14–18 June 2015; Part II 14. Springer: Cham, Switzerland, 2015; pp. 649–659. [Google Scholar]
- Augusto, A.; Conforti, R.; Dumas, M.; La Rosa, M.; Maggi, F.M.; Marrella, A.; Mecella, M.; Soo, A. Automated discovery of process models from event logs: Review and benchmark. IEEE Trans. Knowl. Data Eng. 2018, 31, 686–705. [Google Scholar] [CrossRef] [Green Version]
- Ghasemi, M.; Amyot, D. Process mining in healthcare: A systematised literature review. Int. J. Electron. Healthc. 2016, 9, 60–88. [Google Scholar] [CrossRef] [Green Version]
- dos Santos Garcia, C.; Meincheim, A.; Junior, E.R.F.; Dallagassa, M.R.; Sato, D.M.V.; Carvalho, D.R.; Santos, E.A.P.; Scalabrin, E.E. Process mining techniques and applications—A systematic mapping study. Expert Syst. Appl. 2019, 133, 260–295. [Google Scholar] [CrossRef]
- Yahya, F.; Boukadi, K.; Ben-Abdallah, H. Improving the quality of Business Process Models: Lesson learned from the State of the Art. Bus. Process. Manag. J. 2019, 25, 1357–1376. [Google Scholar] [CrossRef]
- ISO/IEC 25010; 2011 Systems and Software Engineering—Systems and Software Quality Requirements and Evaluation (SQuaRE)—System and Software Quality Models. International Organization for Standardization: Geneva, Switzerland, 2013.
- Carmona, J.; van Dongen, B.; Solti, A.; Weidlich, M. Conformance Checking; Springer: Cham, Switzerland, 2018. [Google Scholar]
- Munoz-Gama, J. Conformance Checking and Diagnosis in Process Mining; Springer: Cham, Switzerland, 2016. [Google Scholar]
- Rozinat, A. Process Mining: Conformance and Extension; Technische Universiteit Eindhoven: Eindhoven, The Netherlands, 2010. [Google Scholar] [CrossRef]
- Fani Sani, M.; Boltenhagen, M.; van der Aalst, W. Prototype selection using clustering and conformance metrics for process discovery. In Proceedings of the Business Process Management Workshops: BPM 2020 International Workshops, Seville, Spain, 13–18 September 2020; Revised Selected Papers 18. Springer: Cham, Switzerland, 2020; pp. 281–294. [Google Scholar]
- De Meyer, P.; Claes, J. An overview of process model quality literature-the comprehensive process model quality framework. arXiv 2018, arXiv:1808.07930. [Google Scholar]
- Becker, J.; Rosemann, M.; Von Uthmann, C. Guidelines of business process modeling. In Business Process Management: Models, Techniques, and Empirical Studies; Springer: Heidelberg/Berlin, Germany, 2002; pp. 30–49. [Google Scholar]
- Corradini, F.; Ferrari, A.; Fornari, F.; Gnesi, S.; Polini, A.; Re, B.; Spagnolo, O. Quality Assessment Strategy: Applying Business Process Modelling Understandability Guidelines; University of Camerino: Camerino, Italy, 2017. [Google Scholar]
- Krogstie, J.; Sindre, G.; Jørgensen, H. Process models representing knowledge for action: A revised quality framework. Eur. J. Inf. Syst. 2006, 15, 91–102. [Google Scholar] [CrossRef]
- Lindland, O.; Sindre, G.; Solvberg, A. Understanding quality in conceptual modeling. IEEE Softw. 1994, 11, 42–49. [Google Scholar] [CrossRef]
- Nelson, H.J.; Poels, G.; Genero, M.; Piattini, M. A conceptual modeling quality framework. Softw. Qual. J. 2012, 20, 201–228. [Google Scholar] [CrossRef]
- Reijers, H.A.; Mendling, J.; Recker, J. Business process quality management. In Handbook on Business Process Management 1: Introduction, Methods, and Information Systems; Springer: Heidelberg/Berlin, Germany, 2015; pp. 167–185. [Google Scholar]
- Van Mersbergen, M. A Framework for Business Process Model Quality and an Evaluation of Model Characteristics as Predictors for Quality; Technische Universiteit Eindhoven: Eindhoven, The Netherlands, 2013. [Google Scholar]
- van der Aalst, W.M.; Carmona, J. Process Mining Handbook; Springer: Cham, Switzerland, 2022. [Google Scholar]
- ProFIT: Process Flow Investigation Tool-ITMO University. Available online: https://github.com/itmo-escience/ProFIT (accessed on 30 April 2023).
- PM4PY: State of the Art Process Mining Toolkit-Institute for Applied Technology Fraunhofer. Available online: https://pm4py.fit.fraunhofer.de/ (accessed on 30 April 2023).
- Elkhovskaya, L.O.; Kshenin, A.D.; Balakhontceva, M.A.; Ionov, M.V.; Kovalchuk, S.V. Extending Process Discovery with Model Complexity Optimization and Cyclic States Identification: Application to Healthcare Processes. Algorithms 2023, 16, 57. [Google Scholar] [CrossRef]
- Mendling, J.; Reijers, H.A.; Cardoso, J. What makes process models understandable? In Proceedings of the Business Process Management: 5th International Conference, BPM 2007, Brisbane, Australia, 24–28 September 2007; Proceedings 5. Springer: Heidelberg/Berlin, Germnay, 2007; pp. 48–63. [Google Scholar]
- Reijers, H.A.; Mendling, J. A study into the factors that influence the understandability of business process models. IEEE Trans. Syst. Man-Cybern.-Part Syst. Humans 2010, 41, 449–462. [Google Scholar] [CrossRef] [Green Version]
- Dikici, A.; Turetken, O.; Demirors, O. Factors influencing the understandability of process models: A systematic literature review. Inf. Softw. Technol. 2018, 93, 112–129. [Google Scholar] [CrossRef] [Green Version]
- Hornix, P.T. Performance Analysis of Business Processes through Process Mining. Master’s Thesis, Eindhoven University of Technology, Eindhoven, The Netherlands, 2007. [Google Scholar]
- Laue, R.; Gadatsch, A. Measuring the understandability of business process models-Are we asking the right questions? In Proceedings of the Business Process Management Workshops: BPM 2010 International Workshops and Education Track, Hoboken, NJ, USA, 13–15 September 2010; Revised Selected Papers 8. Springer: Heidelberg/Berlin, Germany, 2011; pp. 37–48. [Google Scholar]
- Imran, M.; Ismail, M.A.; Hamid, S.; Nasir, M.H.N.M. Complex process modeling in Process mining: A systematic review. IEEE Access 2022, 10, 101515–101536. [Google Scholar] [CrossRef]
- Dzepina, A.; Lehner, F. Business Process Model Quality–Results from A Structured Literature Review. In Proceedings of the Twenty-Sixth European Conference on Information Systems (ECIS2018), Portsmouth, UK, 23–28 June 2018. [Google Scholar]
- de Oca, I.M.M.; Snoeck, M.; Reijers, H.A.; Rodríguez-Morffi, A. A systematic literature review of studies on business process modeling quality. Inf. Softw. Technol. 2015, 58, 187–205. [Google Scholar] [CrossRef] [Green Version]
- Thilakaratne, M.; Falkner, K.; Atapattu, T. A systematic review on literature-based discovery workflow. PeerJ Comput. Sci. 2019, 5, e235. [Google Scholar] [CrossRef] [Green Version]
- Polančič, G.; Cegnar, B. Complexity metrics for process models–A systematic literature review. Comput. Stand. Interfaces 2017, 51, 104–117. [Google Scholar] [CrossRef]
- Sánchez González, L.; García Rubio, F.; Ruiz González, F.; Piattini Velthuis, M. Measurement in business processes: A systematic review. Bus. Process. Manag. J. 2010, 16, 114–134. [Google Scholar] [CrossRef]
- Van Der Aalst, W.; Adriansyah, A.; De Medeiros, A.K.A.; Arcieri, F.; Baier, T.; Blickle, T.; Bose, J.C.; Van Den Brand, P.; Brandtjen, R.; Buijs, J.; et al. Process mining manifesto. In Proceedings of the Business Process Management Workshops: BPM 2011 International Workshops, Clermont-Ferrand, France, 29 August 2011; Revised Selected Papers, Part I 9. Springer: Heidelberg/Berlin, Germany, 2012; pp. 169–194. [Google Scholar]
- Myung, I.J. The importance of complexity in model selection. J. Math. Psychol. 2000, 44, 190–204. [Google Scholar] [CrossRef] [Green Version]
- Agrawal, R.; Gunopulos, D.; Leymann, F. Mining process models from workflow logs. In Proceedings of the Advances in Database Technology—EDBT’98: 6th International Conference on Extending Database Technology, Valencia, Spain, 23–27 March 1998; Proceedings 6. Springer: Heidelberg/Berlin, Germany, 1998; pp. 467–483. [Google Scholar]
- Ferreira, D.R. A Primer on Process Mining: Practical Skills with Python and Graphviz; Springer: Cham, Switzerland, 2017. [Google Scholar]
- Kummer, T.F.; Recker, J.; Mendling, J. Enhancing understandability of process models through cultural-dependent color adjustments. Decis. Support Syst. 2016, 87, 1–12. [Google Scholar] [CrossRef] [Green Version]
- Blum, F.R. Metrics in Process Discovery; Technical Report TR/DCC-2015–6; Computer Science Department, University of Chile: Santiago, Chile, 2015. [Google Scholar]
- Lassen, K.B.; van der Aalst, W.M. Complexity metrics for workflow nets. Inf. Softw. Technol. 2009, 51, 610–626. [Google Scholar] [CrossRef]
- Cardoso, J. Complexity analysis of BPEL web processes. Softw. Process. Improv. Pract. 2007, 12, 35–49. [Google Scholar] [CrossRef]
- Vergidis, K.; Tiwari, A.; Majeed, B. Business process analysis and optimization: Beyond reengineering. IEEE Trans. Syst. Man, Cybern. Part (Appl. Rev.) 2007, 38, 69–82. [Google Scholar] [CrossRef]
- Tiwari, A.; Turner, C.; Majeed, B. A review of business process mining: State-of-the-art and future trends. Bus. Process. Manag. J. 2008, 14, 5–22. [Google Scholar] [CrossRef]
- Wang, W.; Ding, H.; Dong, J.; Ren, C. A comparison of business process modeling methods. In Proceedings of the 2006 IEEE International Conference on Service Operations and Logistics, and Informatics, Shanghai, China, 21–23 June 2006; pp. 1136–1141. [Google Scholar]
- Aguilar-Savén, R.S. Business process modelling: Review and framework. Int. J. Prod. Econ. 2004, 90, 129–149. [Google Scholar] [CrossRef] [Green Version]
- Cardoso, J.; Mendling, J.; Neumann, G.; Reijers, H.A. A discourse on complexity of process models. In Proceedings of the Business Process Management Workshops, Berlin, Germany, 5–7 September 2006; Volume 4103, pp. 117–128. [Google Scholar] [CrossRef]
- Mendling, J. Metrics for Process Models: Empirical Foundations of Verification, Error Prediction, and Guidelines for Correctness; Springer Science & Business Media: New York, NY, USA, 2008; Volume 6. [Google Scholar]
- Buijs, J.C.; van Dongen, B.F.; van der Aalst, W.M. Quality dimensions in process discovery: The importance of fitness, precision, generalization and simplicity. Int. J. Coop. Inf. Syst. 2014, 23, 1440001. [Google Scholar] [CrossRef] [Green Version]
- Buijs, J.C.; Van Dongen, B.F.; van Der Aalst, W.M. On the Role of Fitness, Precision, Generalization and Simplicity in Process Discovery. In Proceedings of the OTM Conferences (1), Rome, Italy, 10–14 September 2012; Volume 7565, pp. 305–322. [Google Scholar]
- Adriansyah, A.; Munoz-Gama, J.; Carmona, J.; van Dongen, B.F.; van der Aalst, W.M. Alignment based precision checking. In Proceedings of the Business Process Management Workshops: BPM 2012 International Workshops, Tallinn, Estonia, 3 September 2012; Revised Papers 10. Springer: Heidelberg/Berlin, Germany, 2013; pp. 137–149. [Google Scholar]
- Adriansyah, A.; Munoz-Gama, J.; Carmona, J.; Van Dongen, B.F.; Van Der Aalst, W.M. Measuring precision of modeled behavior. Inf. Syst.-Bus. Manag. 2015, 13, 37–67. [Google Scholar] [CrossRef] [Green Version]
- Mannhardt, F.; De Leoni, M.; Reijers, H.A.; Van Der Aalst, W.M. Measuring the precision of multi-perspective process models. In Proceedings of the Business Process Management Workshops: BPM 2015, 13th International Workshops, Innsbruck, Austria, 31 August–3 September 2015; Revised Papers 13. Springer: Cham, Switzerland, 2016; pp. 113–125. [Google Scholar]
- Remote Patient Monitoring Dataset-PMT Online. Available online: https://github.com/itmo-escience/ProFIT/blob/master/demo/log_examples/remote_monitoring_eng.csv (accessed on 30 April 2023).
- van Dongen, B. Real-Life Event Logs-Hospital Log. 2011. Available online: https://data.4tu.nl/articles/_/12716513/1 (accessed on 30 April 2023).
- Mannhardt, F. Hospital Billing-Event Log. 2017. Available online: https://data.4tu.nl/articles/_/12705113/1 (accessed on 30 April 2023).
- Nurse Workflow in Hospitals-Almazov National Medical Research Centre. Available online: https://github.com/itmo-escience/ProFIT/blob/master/demo/log_examples/nurse_workflow.csv (accessed on 30 April 2023).
- Mannhardt, F. Data-Driven Process Discovery-Artificial Event Log. 2016. Available online: https://data.4tu.nl/articles/_/12688325/1 (accessed on 30 April 2023).
- Munoz-Gama, J.; de la Fuente, R.R.; Sepúlveda, M.M.; Fuentes, R.R. Conformance Checking Challenge 2019 (CCC19). 2019. Available online: https://data.4tu.nl/articles/_/12714932/1 (accessed on 30 April 2023).
- Mannhardt, F. Sepsis Cases-Event Log. 2016. Available online: https://data.4tu.nl/articles/_/12707639/1 (accessed on 30 April 2023).
- Tax, N.; Lu, X.; Sidorova, N.; Fahland, D.; van der Aalst, W.M. The imprecisions of precision measures in process mining. Inf. Process. Lett. 2018, 135, 1–8. [Google Scholar] [CrossRef] [Green Version]
- Mendling, J.; Neumann, G.; Van Der Aalst, W. Understanding the occurrence of errors in process models based on metrics. Lect. Notes Comput. Sci. 2007, 4803, 113–130. [Google Scholar]
- Munoz-Gama, J.; Carmona, J. Enhancing precision in process conformance: Stability, confidence and severity. In Proceedings of the 2011 IEEE Symposium on Computational Intelligence and Data Mining (CIDM), IEEE, Paris, France, 11–15 April 2011; pp. 184–191. [Google Scholar]
- van Zelst, S.J.; Mannhardt, F.; de Leoni, M.; Koschmider, A. Event abstraction in process mining: Literature review and taxonomy. Granul. Comput. 2021, 6, 719–736. [Google Scholar] [CrossRef]
- Rojas, E.; Munoz-Gama, J.; Sepúlveda, M.; Capurro, D. Process mining in healthcare: A literature review. J. Biomed. Inform. 2016, 61, 224–236. [Google Scholar] [CrossRef] [PubMed]
- Munoz-Gama, J.; Martin, N.; Fernandez-Llatas, C.; Johnson, O.A.; Sepúlveda, M.; Helm, E.; Galvez-Yanjari, V.; Rojas, E.; Martinez-Millana, A.; Aloini, D.; et al. Process mining for healthcare: Characteristics and challenges. J. Biomed. Inform. 2022, 127, 103994. [Google Scholar] [CrossRef]
- Richetti, P.H.P.; Baião, F.A.; Santoro, F.M. Declarative process mining: Reducing discovered models complexity by pre-processing event logs. In Proceedings of the Business Process Management: 12th International Conference, BPM 2014, Haifa, Israel, 7–11 September 2014; Proceedings 12. Springer: Cham, Switzerland, 2014; pp. 400–407. [Google Scholar]
- van der Aalst, W.M. Process discovery: Capturing the invisible. IEEE Comput. Intell. Mag. 2010, 5, 28–41. [Google Scholar] [CrossRef] [Green Version]
- McCabe, T. A Complexity Measure. IEEE Trans. Softw. Eng. 1976, SE-2, 308–320. [Google Scholar] [CrossRef]
- Cardoso, J. Evaluating the process control-flow complexity measure. In Proceedings of the IEEE International Conference on Web Services (ICWS’05), Orlando, FL, USA, 11–15 July 2005; p. 804. [Google Scholar] [CrossRef]
- Cardoso, J. Control-flow complexity measurement of processes and Weyuker’s properties. In Proceedings of the 6th International Enformatika Conference, Budapest, Hungary, 26–28 October 2005; Volume 8, pp. 213–218. [Google Scholar]
- Henry, S.; Kafura, D. Software Structure Metrics Based on Information Flow. IEEE Trans. Softw. Eng. 1981, SE-7, 510–518. [Google Scholar] [CrossRef]
- Gruhn, V.; Laue, R. Adopting the cognitive complexity measure for business process models. In Proceedings of the 2006 5th IEEE International Conference on Cognitive Informatics, Beijing, China, 17–19 July 2006; Volume 1, pp. 236–241. [Google Scholar]
- Shao, J.; Wang, Y. A new measure of software complexity based on cognitive weights. Can. J. Electr. Comput. Eng. 2003, 28, 69–74. [Google Scholar] [CrossRef]
- Cardoso, J.; Vanderfeesten, I.; Reijers, H.A. Computing Coupling for Business Process Models. 2012. Available online: https://www.academia.edu/2895186/Computing_coupling_for_business_process_models (accessed on 30 April 2023).
- Reijers, H.A.; Vanderfeesten, I.T. Cohesion and coupling metrics for workflow process design. In Proceedings of the Business Process Management: Second International Conference, BPM 2004, Potsdam, Germany, 17–18 June 2004; Proceedings 2. Springer: Heidelberg/Berlin, Germany, 2004; pp. 290–305. [Google Scholar]
- Vanderfeesten, I.; Reijers, H.A.; Mendling, J.; van der Aalst, W.M.; Cardoso, J. On a quest for good process models: The cross-connectivity metric. In Proceedings of the Advanced Information Systems Engineering: 20th International Conference, CAiSE 2008, Montpellier, France, 16–20 June 2008; Proceedings 20. Springer: Heidelberg/Berlin, Germany, 2008; pp. 480–494. [Google Scholar]
- Mendling, J.; Neumann, G. Error Metrics for Business Process Models. In Proceedings of the CAiSE Forum, Trondheim, Norway, 11–15 June 2007; pp. 53–56. [Google Scholar]
- Yang, H.T.; Ju, J.H.; Wong, Y.T.; Shmulevich, I.; Chiang, J.H. Literature-based discovery of new candidates for drug repurposing. Briefings Bioinform. 2017, 18, 488–497. [Google Scholar] [CrossRef]
- Vlietstra, W.J.; Zielman, R.; van Dongen, R.M.; Schultes, E.A.; Wiesman, F.; Vos, R.; Van Mulligen, E.M.; Kors, J.A. Automated extraction of potential migraine biomarkers using a semantic graph. J. Biomed. Inform. 2017, 71, 178–189. [Google Scholar] [CrossRef]
- Shang, N.; Xu, H.; Rindflesch, T.C.; Cohen, T. Identifying plausible adverse drug reactions using knowledge extracted from the literature. J. Biomed. Inform. 2014, 52, 293–310. [Google Scholar] [CrossRef] [Green Version]
- Yetisgen-Yildiz, M.; Pratt, W. Using statistical and knowledge-based approaches for literature-based discovery. J. Biomed. Inform. 2006, 39, 600–611. [Google Scholar] [CrossRef] [PubMed] [Green Version]
- Yetisgen-Yildiz, M.; Pratt, W. A new evaluation methodology for literature-based discovery systems. J. Biomed. Inform. 2009, 42, 633–643. [Google Scholar] [CrossRef] [PubMed] [Green Version]
- Sánchez-González, L.; García, F.; Ruiz, F.; Mendling, J. A Study of the Effectiveness of Two Threshold Definition Techniques. In Proceedings of the 16th International Conference on Evaluation and Assessment in Software Engineering (EASE 2012), IET Seminar Digest, Ciudad Real, Spain, 14–15 May 2012. [Google Scholar]
- Vanderfeesten, I.; Cardoso, J.; Mendling, J.; Reijers, H.A.; Van der Aalst, W. Quality metrics for business process models. BPM Work. Handb. 2007, 144, 179–190. [Google Scholar]
- Laue, R.; Gruhn, V. Complexity Metrics for business Process Models. In Proceedings of the Business Information Systems, 9th International Conference on Business Information Systems, BIS 2006, Klagenfurt, Austria, 31 May–2 June 2006; Abramowicz, W., Mayr, H.C., Eds.; Volume P-85, pp. 1–12. [Google Scholar]
- Kohavi, R. A study of cross-validation and bootstrap for accuracy estimation and model selection. In Proceedings of the Ijcai, Montreal, Canada, 20 August 1995; Volume 14, pp. 1137–1145. [Google Scholar]
- Van der Aalst, W.M. Verification of workflow nets. In Proceedings of the ICATPN, 23 June 1997; Volume 97, pp. 407–426. [Google Scholar]
- Wang, N.; Sun, S.; OuYang, D. Business process modeling abstraction based on semi-supervised clustering analysis. Bus. Inf. Syst. Eng. 2018, 60, 525–542. [Google Scholar] [CrossRef]
- Wang, Y.; Shao, J. Measurement of the cognitive functional complexity of software. In Proceedings of the The Second IEEE International Conference on Cognitive Informatics, London, UK, 20 August 2003; pp. 67–74. [Google Scholar]
- Sánchez-González, L.; García, F.; Mendling, J.; Ruiz, F. Quality assessment of business process models based on thresholds. In Proceedings of the On the Move to Meaningful Internet Systems: OTM 2010: Confederated International Conferences: CoopIS, IS, DOA and ODBASE, Hersonissos, Crete, Greece, 25–29 October 2010; Proceedings, Part I. Springer: Heidelberg/Berlin, Germany, 2010; pp. 78–95. [Google Scholar]
- Rolón, E.; Ruiz, F.; García, F.; Piattini, M. Applying software metrics to evaluate business process models. CLEI-Electron. J. 2006, 9, 5. [Google Scholar] [CrossRef]
- Rolón, E.; García, F.; Ruiz, F.; Piattini, M.; Visaggio, C.A.; Canfora, G. Evaluation of BPMN models quality-a family of experiments. In Proceedings of the International Conference on Evaluation of Novel Approaches to Software Engineering, SCITEPRESS, Funchal, Madeira, Portugal, 4–7 May 2008; Volume 2, pp. 56–63. [Google Scholar]
- Paakki, J.; Karhinen, A.; Gustafsson, J.; Nenonen, L.; Verkamo, A.I. Software metrics by architectural pattern mining. In Proceedings of the International Conference on Software: Theory and Practice (16th IFIP World Computer Congress), Beijing, China, 5–9 August 2000; pp. 325–332. [Google Scholar]
- Woodward, M.R.; Hennell, M.A.; Hedley, D. A measure of control flow complexity in program text. IEEE Trans. Softw. Eng. 1979, 45–50. [Google Scholar] [CrossRef]
- Cardoso, J. Business process quality metrics: Log-based complexity of workflow patterns. In Proceedings of the on the Move to Meaningful Internet Systems 2007: CoopIS, DOA, ODBASE, GADA, and IS: OTM Confederated International Conferences CoopIS, DOA, ODBASE, GADA, and IS 2007, Vilamoura, Portugal, 25–30 November 2007; Proceedings, Part I. Springer: Heidelberg/Berlin, Germany, 2007; pp. 427–434. [Google Scholar]
- Debnath, N.; Salgado, C.; Peralta, M.; Riesco, D.; Montejano, G. Optimization of the Business Process metrics definition according to the BPDM standard and its formal definition in OCL. In Proceedings of the ACS/IEEE International Conference on Computer Systems and Applications-AICCSA 2010, Hammamet, Tunisia, 16–19 May 2010; pp. 1–8. [Google Scholar]
- Kluza, K.; Nalepa, G.J. Proposal of square metrics for measuring business process model complexity. In Proceedings of the 2012 Federated Conference on Computer Science and Information Systems (FedCSIS), Wroclaw, Poland, 9–12 September 2012; pp. 919–922. [Google Scholar]
- Cheng, C.Y. Complexity and Usability Models for Business Process Analysis; The Pennsylvania State University: State College, PA, USA, 2008. [Google Scholar]
- Ghani, A.A.A.; Wei, K.; Muketha, G.M.; Wen, W.P. Complexity Metrics for Measuring the Understandability and Maintainability of Business Process Models Using Goal-Question-metric (GQM); International Journal of Computer Science and Network Security; May 2008. Available online: http://paper.ijcsns.org/07_book/200805/20080533.pdf (accessed on 30 April 2023).
- Syring, A.F.; Tax, N.; van der Aalst, W.M. Evaluating conformance measures in process mining using conformance propositions. TTransactions on Petri Nets and Other Models of Concurrency XIV; Springer: Berlin/Heidelberg, Germany, 2019; Volume 11790, pp. 192–221. [Google Scholar]
- Van der Aalst, W.; Adriansyah, A.; Van Dongen, B. Replaying history on process models for conformance checking and performance analysis. Wiley Interdiscip. Rev. Data Min. Knowl. Discov. 2012, 2, 182–192. [Google Scholar] [CrossRef]
- Goedertier, S.; Martens, D.; Vanthienen, J.; Baesens, B. Robust process discovery with artificial negative events. J. Mach. Learn. Res. 2009, 10, 1305–1340. [Google Scholar]
- Leemans, S.J.; Fahland, D.; Van der Aalst, W.M. Scalable process discovery and conformance checking. Softw. Syst. Model. 2018, 17, 599–631. [Google Scholar] [CrossRef] [Green Version]
- Weijters, A.; van Der Aalst, W.M.; De Medeiros, A.A. Process mining with the heuristics miner-algorithm. Tech. Univ. Eindh. Tech. Rep. WP 2006, 166, 1–34. [Google Scholar]
- Polyvyanyy, A.; Solti, A.; Weidlich, M.; Di Ciccio, C.; Mendling, J. Behavioural Quotients for Precision and Recall in Process Mining; Technical Report; University of Melbourne: Melbourne, Australia, 2018. [Google Scholar]
- Rozinat, A.; Van der Aalst, W.M. Conformance checking of processes based on monitoring real behavior. Inf. Syst. 2008, 33, 64–95. [Google Scholar] [CrossRef]
- Munoz-Gama, J.; Carmona, J. A fresh look at precision in process conformance. In Proceedings of the Business Process Management: 8th International Conference, BPM 2010, Hoboken, NJ, USA, 13–16 September 2010; Proceedings 8. Springer: Heidelberg/Berlin, Germany, 2010; pp. 211–226. [Google Scholar]
- vanden Broucke, S.K.; De Weerdt, J.; Vanthienen, J.; Baesens, B. Determining process model precision and generalization with weighted artificial negative events. IEEE Trans. Knowl. Data Eng. 2013, 26, 1877–1889. [Google Scholar] [CrossRef]
- van Dongen, B.F.; Carmona, J.; Chatain, T. A unified approach for measuring precision and generalization based on anti-alignments. In Proceedings of the Business Process Management: 14th International Conference, BPM 2016, Rio de Janeiro, Brazil, 18–22 September 2016; Proceedings 14. Springer: Cham, Switzerland, 2016; pp. 39–56. [Google Scholar]
- Batini, C.; Cappiello, C.; Francalanci, C.; Maurino, A. Methodologies for data quality assessment and improvement. ACM Comput. Surv. (CSUR) 2009, 41, 1–52. [Google Scholar] [CrossRef] [Green Version]
- Reijers, H.; Mendling, J. Modularity in process models: Review and effects. In Proceedings of the Business Process Management: 6th International Conference, BPM 2008, Milan, Italy, 2–4 September 2008; Proceedings 6. Springer: Heidelberg/Berlin, Germany, 2008; pp. 20–35. [Google Scholar]
- Soo, L.G.; Jung-Mo, Y. An empirical study on the complexity metrics of petri nets. Microelectron. Reliab. 1992, 32, 323–329. [Google Scholar] [CrossRef]


| # | Dataset Name | Number of Entries | Number of Unique Traces | Average Trace length | Max Trace Size | Min Trace Size | Number of Unique Events |
|---|---|---|---|---|---|---|---|
| 1 | Remote Patient Monitoring Data | 35,358 | 272 | 130 | 673 | 3 | 17 |
| 2 | Real-Life Event logs | 150,291 | 1143 | 131 | 1814 | 1 | 615 |
| 3 | Hospital Billing Event Log | 89,088 | 18,278 | 5 | 217 | 1 | 18 |
| 4 | Nurse Work Flow Event log | 13,644 | 187 | 73 | 440 | 1 | 228 |
| 5 | Data Driven Process Discovery—Artificial Event log | 99,589 | 11,112 | 9 | 11 | 2 | 8 |
| 6 | Central Venous Catheter Process | 697 | 20 | 35 | 59 | 26 | 29 |
| 7 | Sepsis Treatment Careflow Dataset | 15,214 | 26 | 586 | 8111 | 1 | 16 |
Disclaimer/Publisher’s Note: The statements, opinions and data contained in all publications are solely those of the individual author(s) and contributor(s) and not of MDPI and/or the editor(s). MDPI and/or the editor(s) disclaim responsibility for any injury to people or property resulting from any ideas, methods, instructions or products referred to in the content. |
© 2023 by the authors. Licensee MDPI, Basel, Switzerland. This article is an open access article distributed under the terms and conditions of the Creative Commons Attribution (CC BY) license (https://creativecommons.org/licenses/by/4.0/).
Share and Cite
Ireddy, A.T.S.; Kovalchuk, S.V. An Experimental Outlook on Quality Metrics for Process Modelling: A Systematic Review and Meta Analysis. Algorithms 2023, 16, 295. https://doi.org/10.3390/a16060295
Ireddy ATS, Kovalchuk SV. An Experimental Outlook on Quality Metrics for Process Modelling: A Systematic Review and Meta Analysis. Algorithms. 2023; 16(6):295. https://doi.org/10.3390/a16060295
Chicago/Turabian StyleIreddy, Ashish T. S., and Sergey V. Kovalchuk. 2023. "An Experimental Outlook on Quality Metrics for Process Modelling: A Systematic Review and Meta Analysis" Algorithms 16, no. 6: 295. https://doi.org/10.3390/a16060295