1. Introduction
Functional near-infrared spectroscopy (fNIRS) [
1] has gained interest in recent years as a noninvasive neuroimaging technique to investigate cortical activity, along with techniques such as functional magnetic resonance imaging (fMRI) and electroencephalography.
fNIRS is thought to indirectly reflect neural activity through neurovascular coupling by detecting changes in light scattering and absorption within the tissue caused by changes in the concentration of oxyhemoglobin (ΔHbO) and deoxyhemoglobin (ΔHb). Besides fNIRS’ many practical advantages such as portability, compatibility with other techniques, no requirements for a special environment, and no restriction on the subject population, its technical advantages lie in its temporal resolution (~25 to 100 Hz) of hemoglobin concentration measurements (practically only restricted by the hemodynamic response function itself) and the ability to distinguish between both chromophores, oxyhemoglobin, and deoxyhemoglobin. However, major challenges include (1) relatively poor spatial resolution (1 to 3 cm
3) caused by the scattering of light in tissue and the geometry of the light sources and detectors on the surface of the head which can only be alleviated with a dense cluster of overlapping channels; (2) the limited penetration depth (1 cm of cerebral cortex [
2]); and (3) contamination from noise sources including instrumental noise, experimental noise, and physiological artifacts [
3]. Hence, one of the greatest challenges in fNIRS research is the accurate delineation of the masking effects of the noise sources from the desired “neuronal” brain signal.
Functional magnetic resonance imaging (fMRI) has long been the gold standard of non-invasive brain imaging due to its high spatial resolution over the whole head. Since the development of multiband/simultaneous multislice (SMS) acquisition [
4,
5], simultaneous high spatial (1–2 mm isotropic) and temporal resolution (~0.7 s) are now possible. fMRI exploits the effect of blood oxygenation on the magnetic properties of hemoglobin, just as fNIRS uses the effect on its optical properties, to make inferences about underlying neuronal activity changes in the brain; however, it lacks the ability to separately quantify oxyhemoglobin and deoxyhemoglobin changes and still struggles to approach the temporal resolution of fNIRS (resulting in the poor quantification of cardiac effects). Due to the complementary strengths of fNIRS and fMRI in temporal and spatial resolution, respectively, multimodal studies often utilize fNIRS and fMRI simultaneously which has shed light on various aspects of each method [
6].
Since fNIRS optodes are directly positioned on the scalp of the participant, fNIRS is in general considered less sensitive to head motion artifacts than fMRI, which depend on stationary sensors. However, motion artifacts are still a problem for fNIRS because the coupling between the optodes and the skin is altered when the optode is displaced. This introduces a strong external noise which produces spurious differences that can mask patterns arising from neural activity. Therefore, despite the relative insensitivity of fNIRS to head motion, it is still necessary to apply processing strategies that eliminate these artifacts. A wide variety of motion artifact elimination techniques have been proposed ([
7,
8]). These techniques can be categorized based on the temporal or spatial characteristics of the signal and methods that use external signals for movement artifact removal by adaptive filtering.
The motion-correction algorithms, which have been developed for fNIRS data, suffer from different drawbacks. For example, some of the wavelet-based methods (e.g., [
9,
10]) are well equipped to remove motion spikes; however, exacerbate baseline shifts artifacts. Especially, methods relying on global temporal characteristics (such as PCA-based methods) require a certain number of channels to perform accurate delineation between the noise and signal, as do spatially based methods. Other methods such as the Movement Artifact Reduction Algorithm (MARA) [
11] rely on several parameters that must be supplied by the user to detect artifacts, which is usually disadvantageous. AMARA (acceleration-based movement artifact reduction algorithm) [
12] is one of those methods but also one of the most promising automatic motion correction methods for fNIRS analysis. The method identifies motion artifacts using an accelerometer and combines two previous motion detection and removal methods, MARA [
11] and ABAMAR [
13]. It has been tested on long fNIRS sleep study acquisitions (~8 h) and compares favorably to both MARA and ABAMAR.
Motion displacement parameters can be easily acquired from fMRI with FSL MCFLIRT [
14,
15] or AFNI 3dvolReg [
16,
17], two standard pre-processing programs for fMRI data. The second derivative of the motion time courses of fMRI can therefore be used to determine the acceleration-based movement in fNIRS. However, here, the relatively low temporal resolution of fMRI is problematic; it would be highly advantageous if the acceleration time courses could be derived at the same, much higher temporal resolution of the fNIRS data.
Here, we propose a new way to increase the temporal resolution of acceleration data derived from the fMRI motion measurements. We do so by adapting and expanding a method we developed for increasing the time resolution of motion data in fMRI by taking into account the slice acquisition time and reconstructing high-resolution motion time courses [
18]. Similar techniques have been proposed using slice-wise motion correction [
19] and have been applied for real-time motion correction [
20,
21] with slice-to-volume registration in which guided breath-hold at 0.34 Hz could be observed in one subject [
20]. These techniques, such as the one by Hoinkiss et al. [
20], rely on advanced iterative algorithms. Our technique was developed to reconstruct respiration, as a complement to our cardiac waveform reconstruction method [
22] using slice sorted averaging and a deep learning reconstruction filter. Although a deep learning approach was highly successful in our previous work and our current method might benefit from that, in this situation, unlike the cardiac waveform generation, we did not have ground truth high-frequency motion data. However, this method performs very well, reconstructing respiration, cardiac, and high-resolution motion without requiring any advanced modeling and instead by simply reorganizing slices according to their acquisition times [
18]. Machine learning is especially useful for extrapolating information which is not directly available in a particular dataset by automatically finding patterns and interrelationships within datasets in the absence of a model, and then applying this to fill in missing information. However, when there are known characteristics of the system (in this case, that the head is a rigid structure and motion of one part of the head means that the rest of the head undergoes similar motion), it is always preferable to incorporate this information to minimize the degree to which the other parts of the system need to “learn” these relationships.
Here, we incorporate this information into deriving a better motion time course, so that AMARA is more firmly within the regime that it was developed to handle (that certain types of motion cause transients in fNIRS data that can be removed). In the following, we show how this method can be used in conjunction with automatic motion correction methods in fNIRS such as AMARA in order to enhance signal detection.
2. Materials and Methods
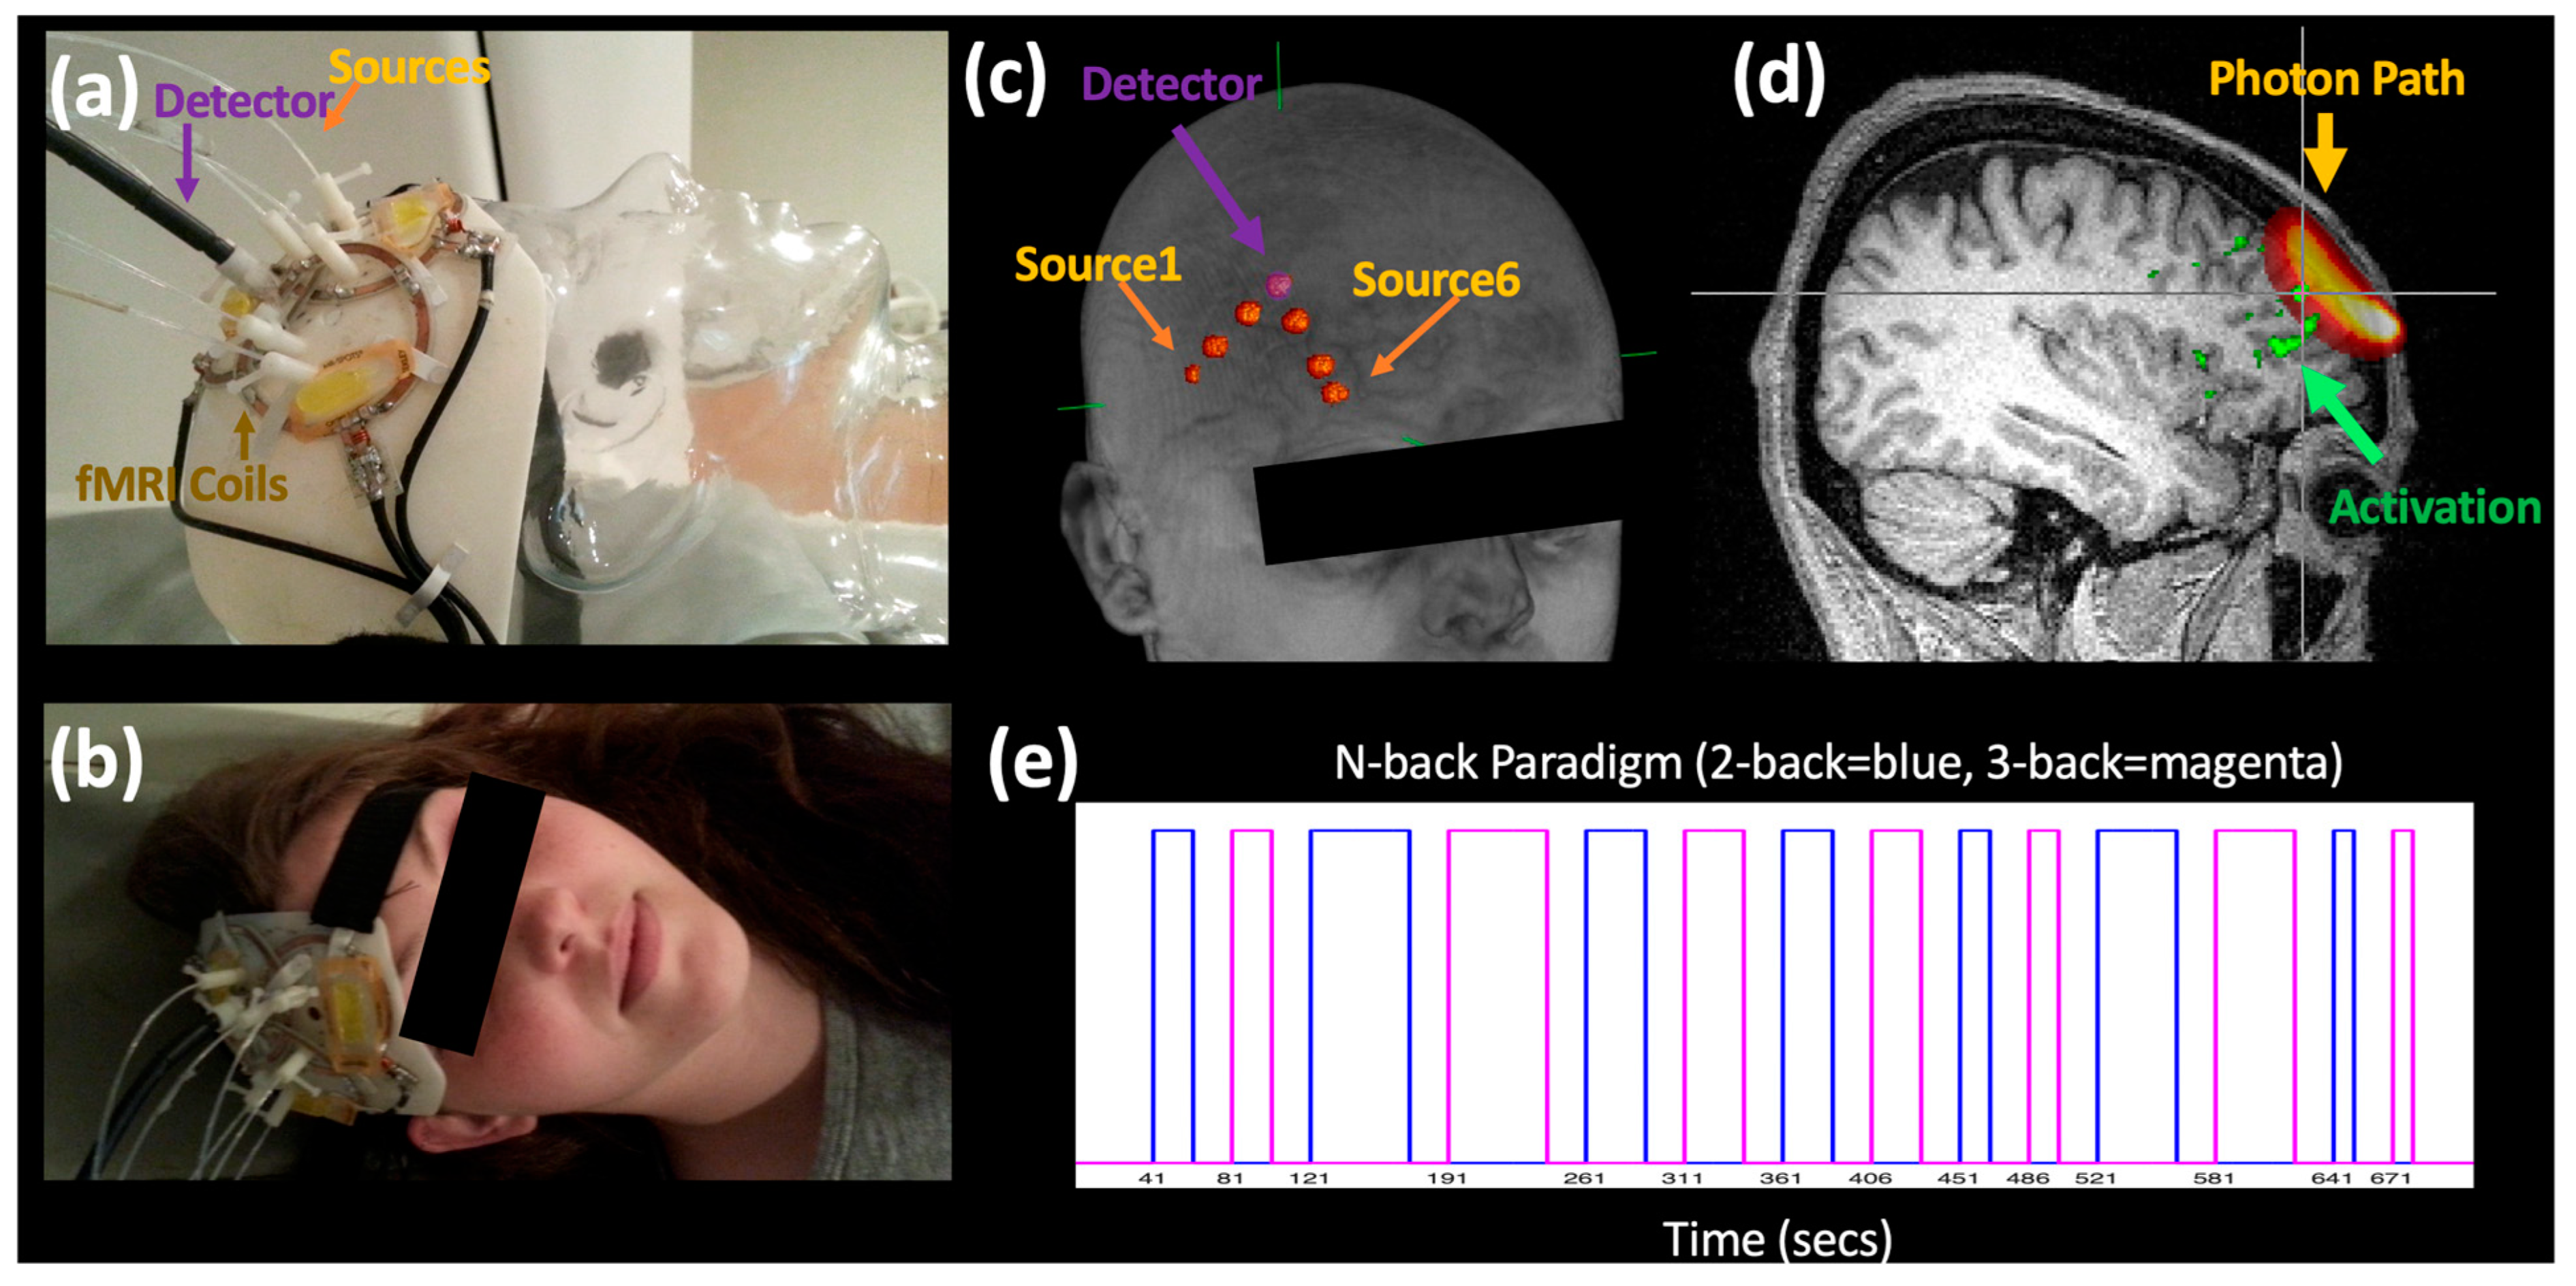
We measured fNIRS and fMRI simultaneously in 10 participants during a 2- and 3-back memory task (720 s,
Figure 1e). All subjects gave their informed consent for inclusion before they participated in the study. The McLean Hospital institutional review board approved all human experimental acquisitions, and participants were compensated for their participation.
Six fNIRS source–detector fibers were directly integrated into purpose-built 3D printed receive-only phased array RF coils [
23], enabling close contact between the probe and the head and thus the precise alignment between the modalities, facilitating localization of the fNIRS probes with respect to the activations detected by fMRI (
Figure 1a–c).
All MR data were acquired on a Siemens TIM Trio 3T scanner (Siemens Medical Systems, Malvern, PA, USA). The multimodal probe included a 3-element receive-only phased array probe (8 × 4.5 cm with depth sensitivity of ~5 cm) [
23] which was positioned over the prefrontal cortex and used to acquire high spatial (1.8 mm isotropic resolution over a 172 × 172 × 59.4 mm FOV) and temporal resolution fMRI data (TR = 0.72 s, Multiband Factor = 4). fNIRS data were acquired with an ISS Imagent (ISS, Champaign, IL, USA) at 6.25 Hz with six channels (~35, 27, and 13 mm source–detector separation,
Table 1) above the target area.
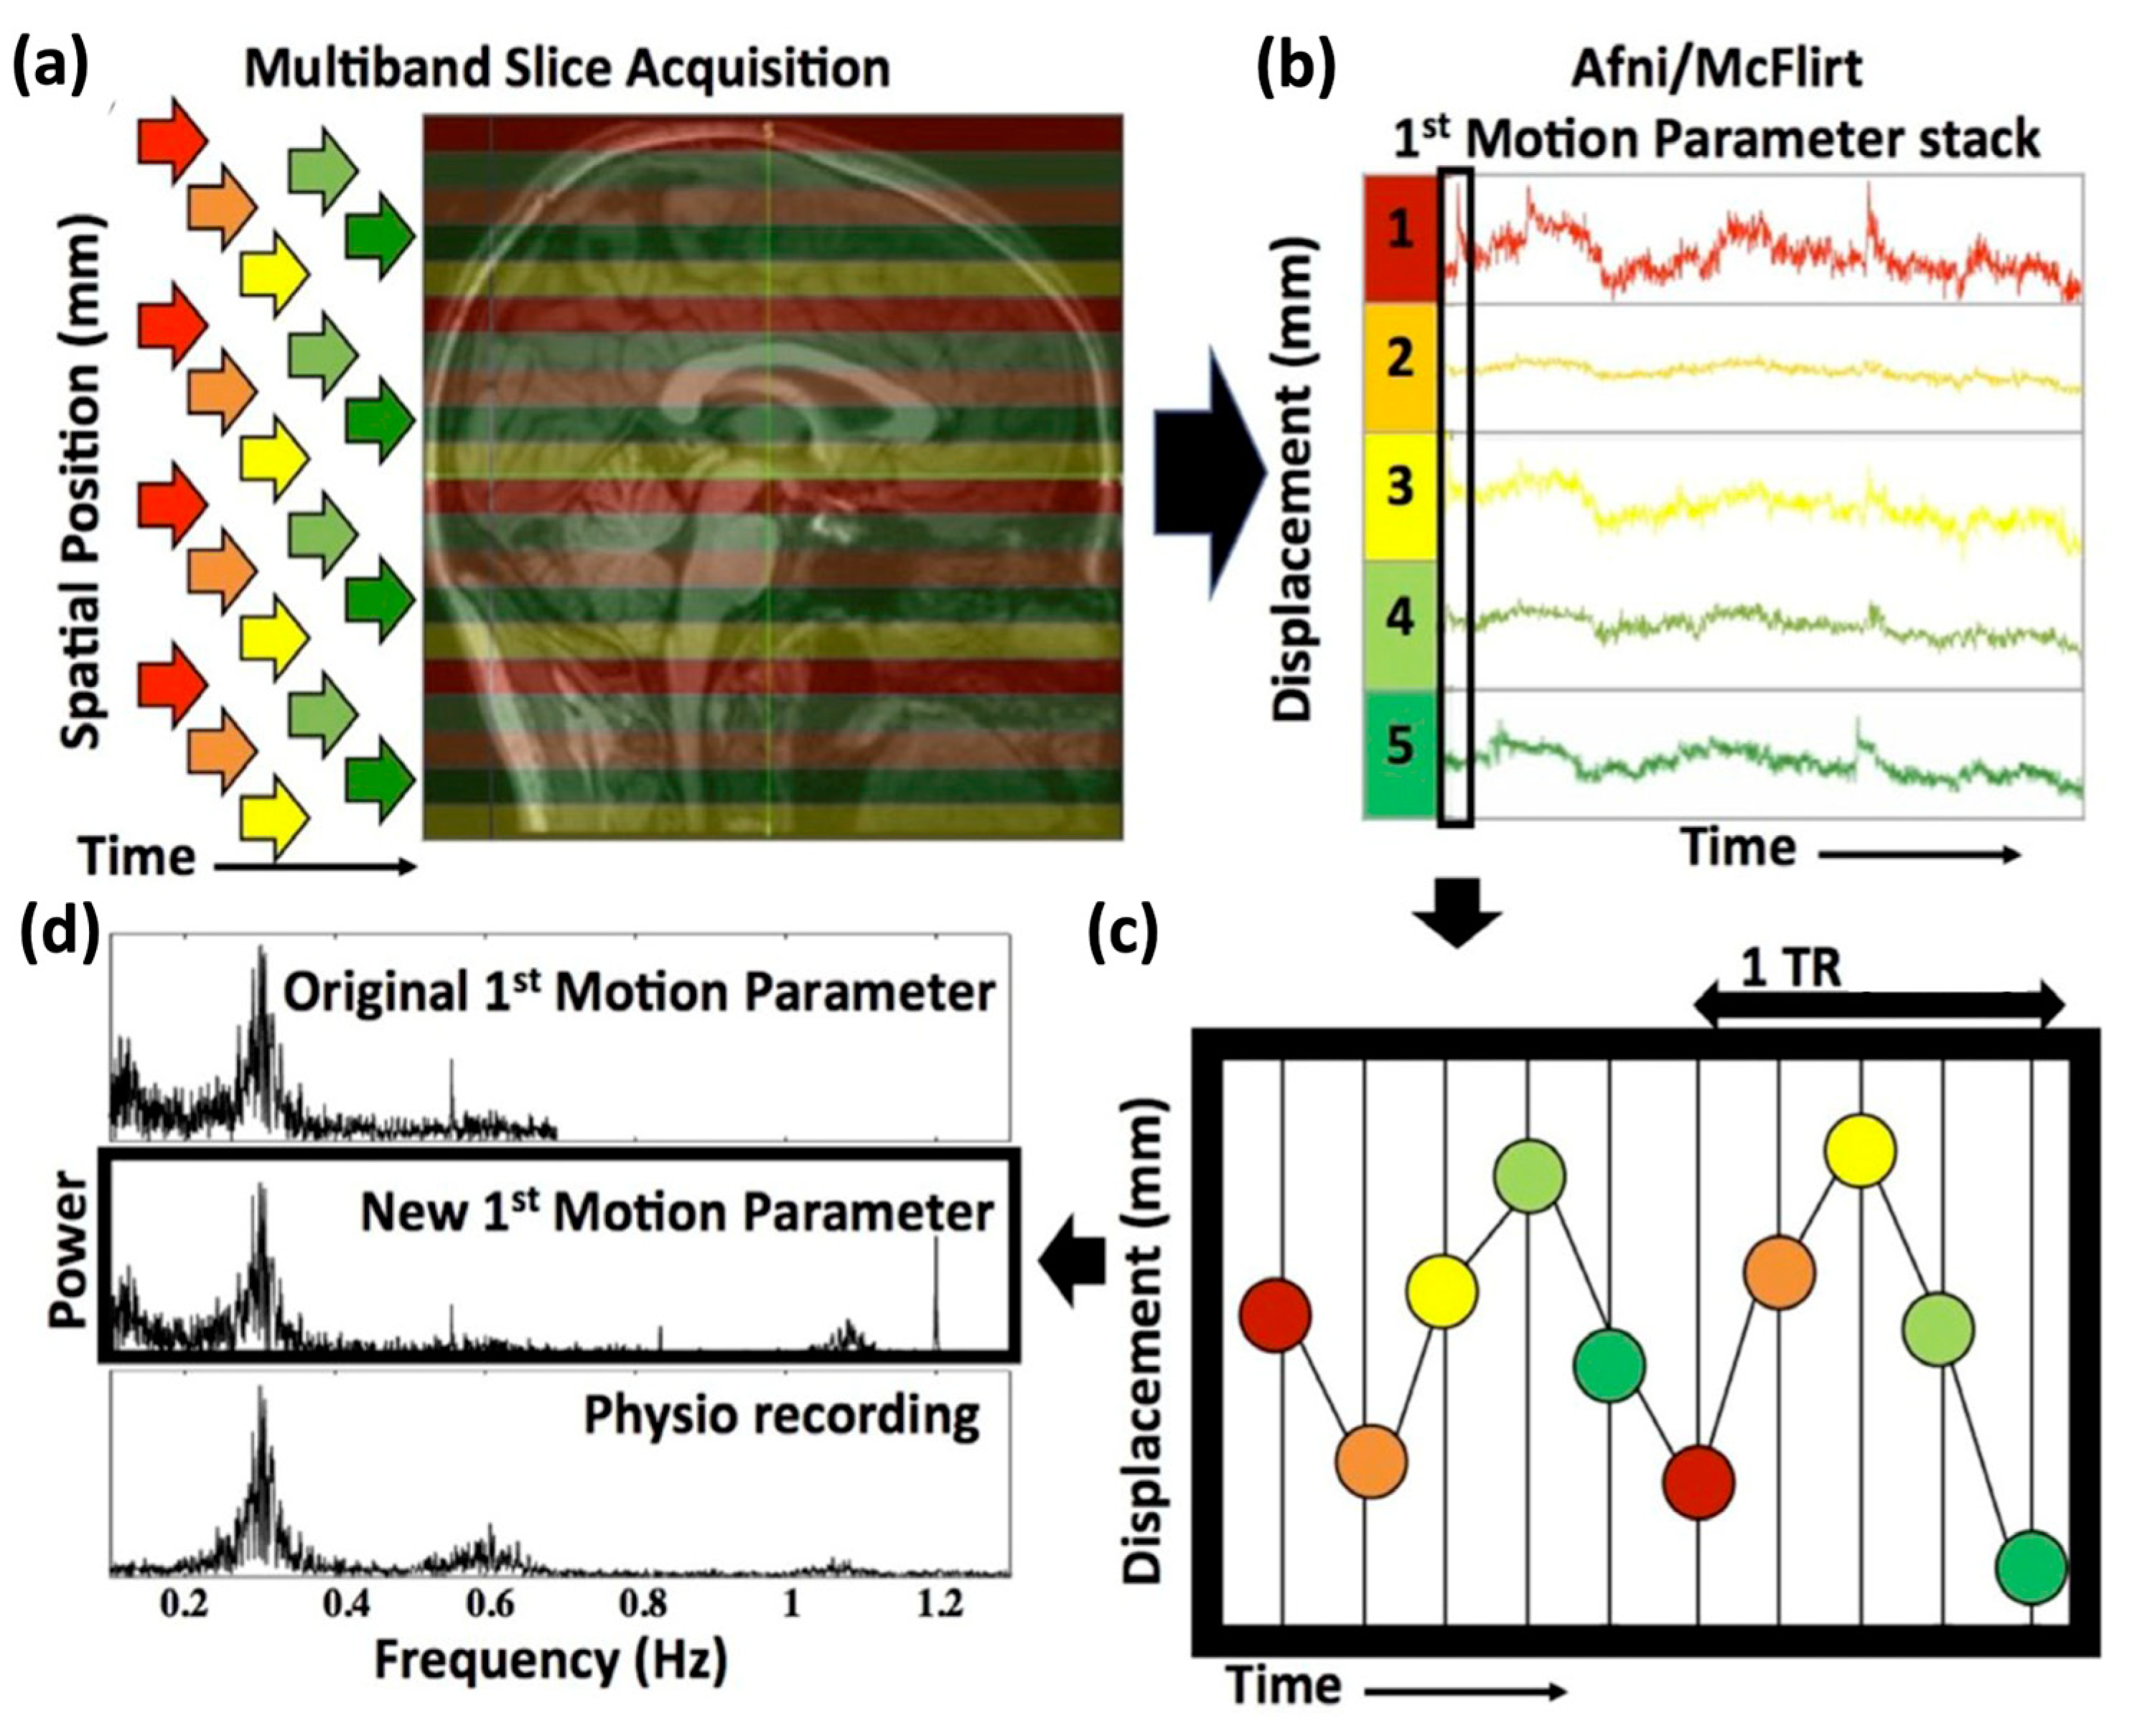
High-resolution motion traces were calculated using our previously described method (for a detailed description of the steps and commands see Hocke et al. [
18]). In short, since multiband data have several spatially separated slices acquired at the same time, the exact acquisition time or slice timing information of each slice (indicated by different colors in
Figure 2a) can be used to split a single fMRI volume into “stacks” of simultaneously acquired slices. In the simplified example of
Figure 2, 20 slices are taken at 5 different acquisition times with a multiband factor of 4, resulting in 5 stacks with the same acquisition time, as illustrated in different colors in
Figure 2a. Standard motion estimation programs for fMRI data (e.g., FSL [
24], MCFLIRT) are then applied to each new stack of acquisition–time matched slices (
Figure 2b). Lastly, the various motion traces (six directions for each stack) can then be merged according to their respective slice timing (
Figure 2c). A comparison with simultaneously acquired physiological monitoring confirmed the accuracy of this method, recovering even signals beyond the original frequency range such as cardiac (
Figure 2d). A software package deriving these high-resolution motion parameters, as described above and in Hocke et al. [
18], can be found as open source by P. Bloom [
25]. A notch filter at the original sampling rate was also applied.
Acceleration data were derived from the second derivative of the motion traces of the high-resolution fMRI data. We used MCFLIRT (FSL [
24], FLIRT [
14,
15]), a standard fMRI preprocessing method to derive the six motion traces (x, y, z direction as well as rotational motion of each). We used the six acceleration motion traces as inputs for AMARA with window length of 8 min and window step size of 4 min (for our 12 min acquisition) which were in the originally published study by Metz et al. set to 15 min and 5 min, respectively [
12].
Raw fNIRS data were converted to oxyhemoglobin and deoxyhemoglobin with HOMER2 [
3]. The pathlength was corrected in accordance with the source–detector distance calculated from the fMRI anatomical scans and also corrected for age [
26]. We compared three motion correction conditions: no motion correction (NoMC); simple up-sampled motion correction (UpMC) in which the OrigRes motion time courses were up-sampled to the effective sampling rate by using the scipy.interpolate’s UnivariateSpline routine with the default smoothing (k = 3); and correction with high-resolution motion traces (HighMC with AMARA–fMRI). The significance of the activation of each channel per method was calculated with the NIRS Brain AnalyzIR Toolbox [
27] which accounts for multiple comparisons (q-stats). Significant task responses determined by fMRI (example voxels in
Figure 3a) were evaluated below the fNIRS channel in the photon paths calculated using MCX [
28,
29]. We calculated the percentage of significant voxels present in the photon path (banana-shaped) activation area below the fNIRS probes (
Figure 4c) as well as the z-statistics (
Figure 4b) for comparison.
MRI data were processed in FSL FEAT [FMRIB Expert Analysis Tool, version 5.0.10 (
http://www.fmrib.ox.ac.uk/fsl, accessed on 20 February 2023, Oxford University, United Kingdom [
24]). Standard preprocessing steps were applied to the data: temporal high-pass filter (200 s to remove very slow instrumental drifts), spatial smoothing (2 mm), slice time correction, motion correction, and FILM prewhitening. Contrasts for both the 2- and 3-back as well as only the 2-back and 3-back were evaluated for comparison (1st contrast: 2-back = 1, 3-back = 1; 2nd contrast: 2-back = 1, 3-back = 0; and 3rd contrast: 2-back = 0, 3-back = 1).
3. Results
We calculated high temporal resolution motion parameters by dividing the original multiband fMRI brain images, taken with TR of 0.72 s, into the 9 sets, or ‘stacks’, of simultaneously acquired images acquired within each TR at 9 “slice times” (72 slices with a multiband factor of 8 corresponds to 9 sets of slices acquired at 9 different slice or acquisition times), and merging the resulting time course of the 9 stacks for each motion parameter (total 6) according to the slice timing (
Figure 2) [
18]. This resulted in an effective sample rate of 12.5 Hz. Notably, even by using initial motion traces with a sample time of 0.72 s (1.4 Hz sampling rate, with a Nyquist frequency of 0.7 Hz), for which the cardiac signal at ~1 Hz could not be resolved, we could now resolve the cardiac signal (
Figure 2).
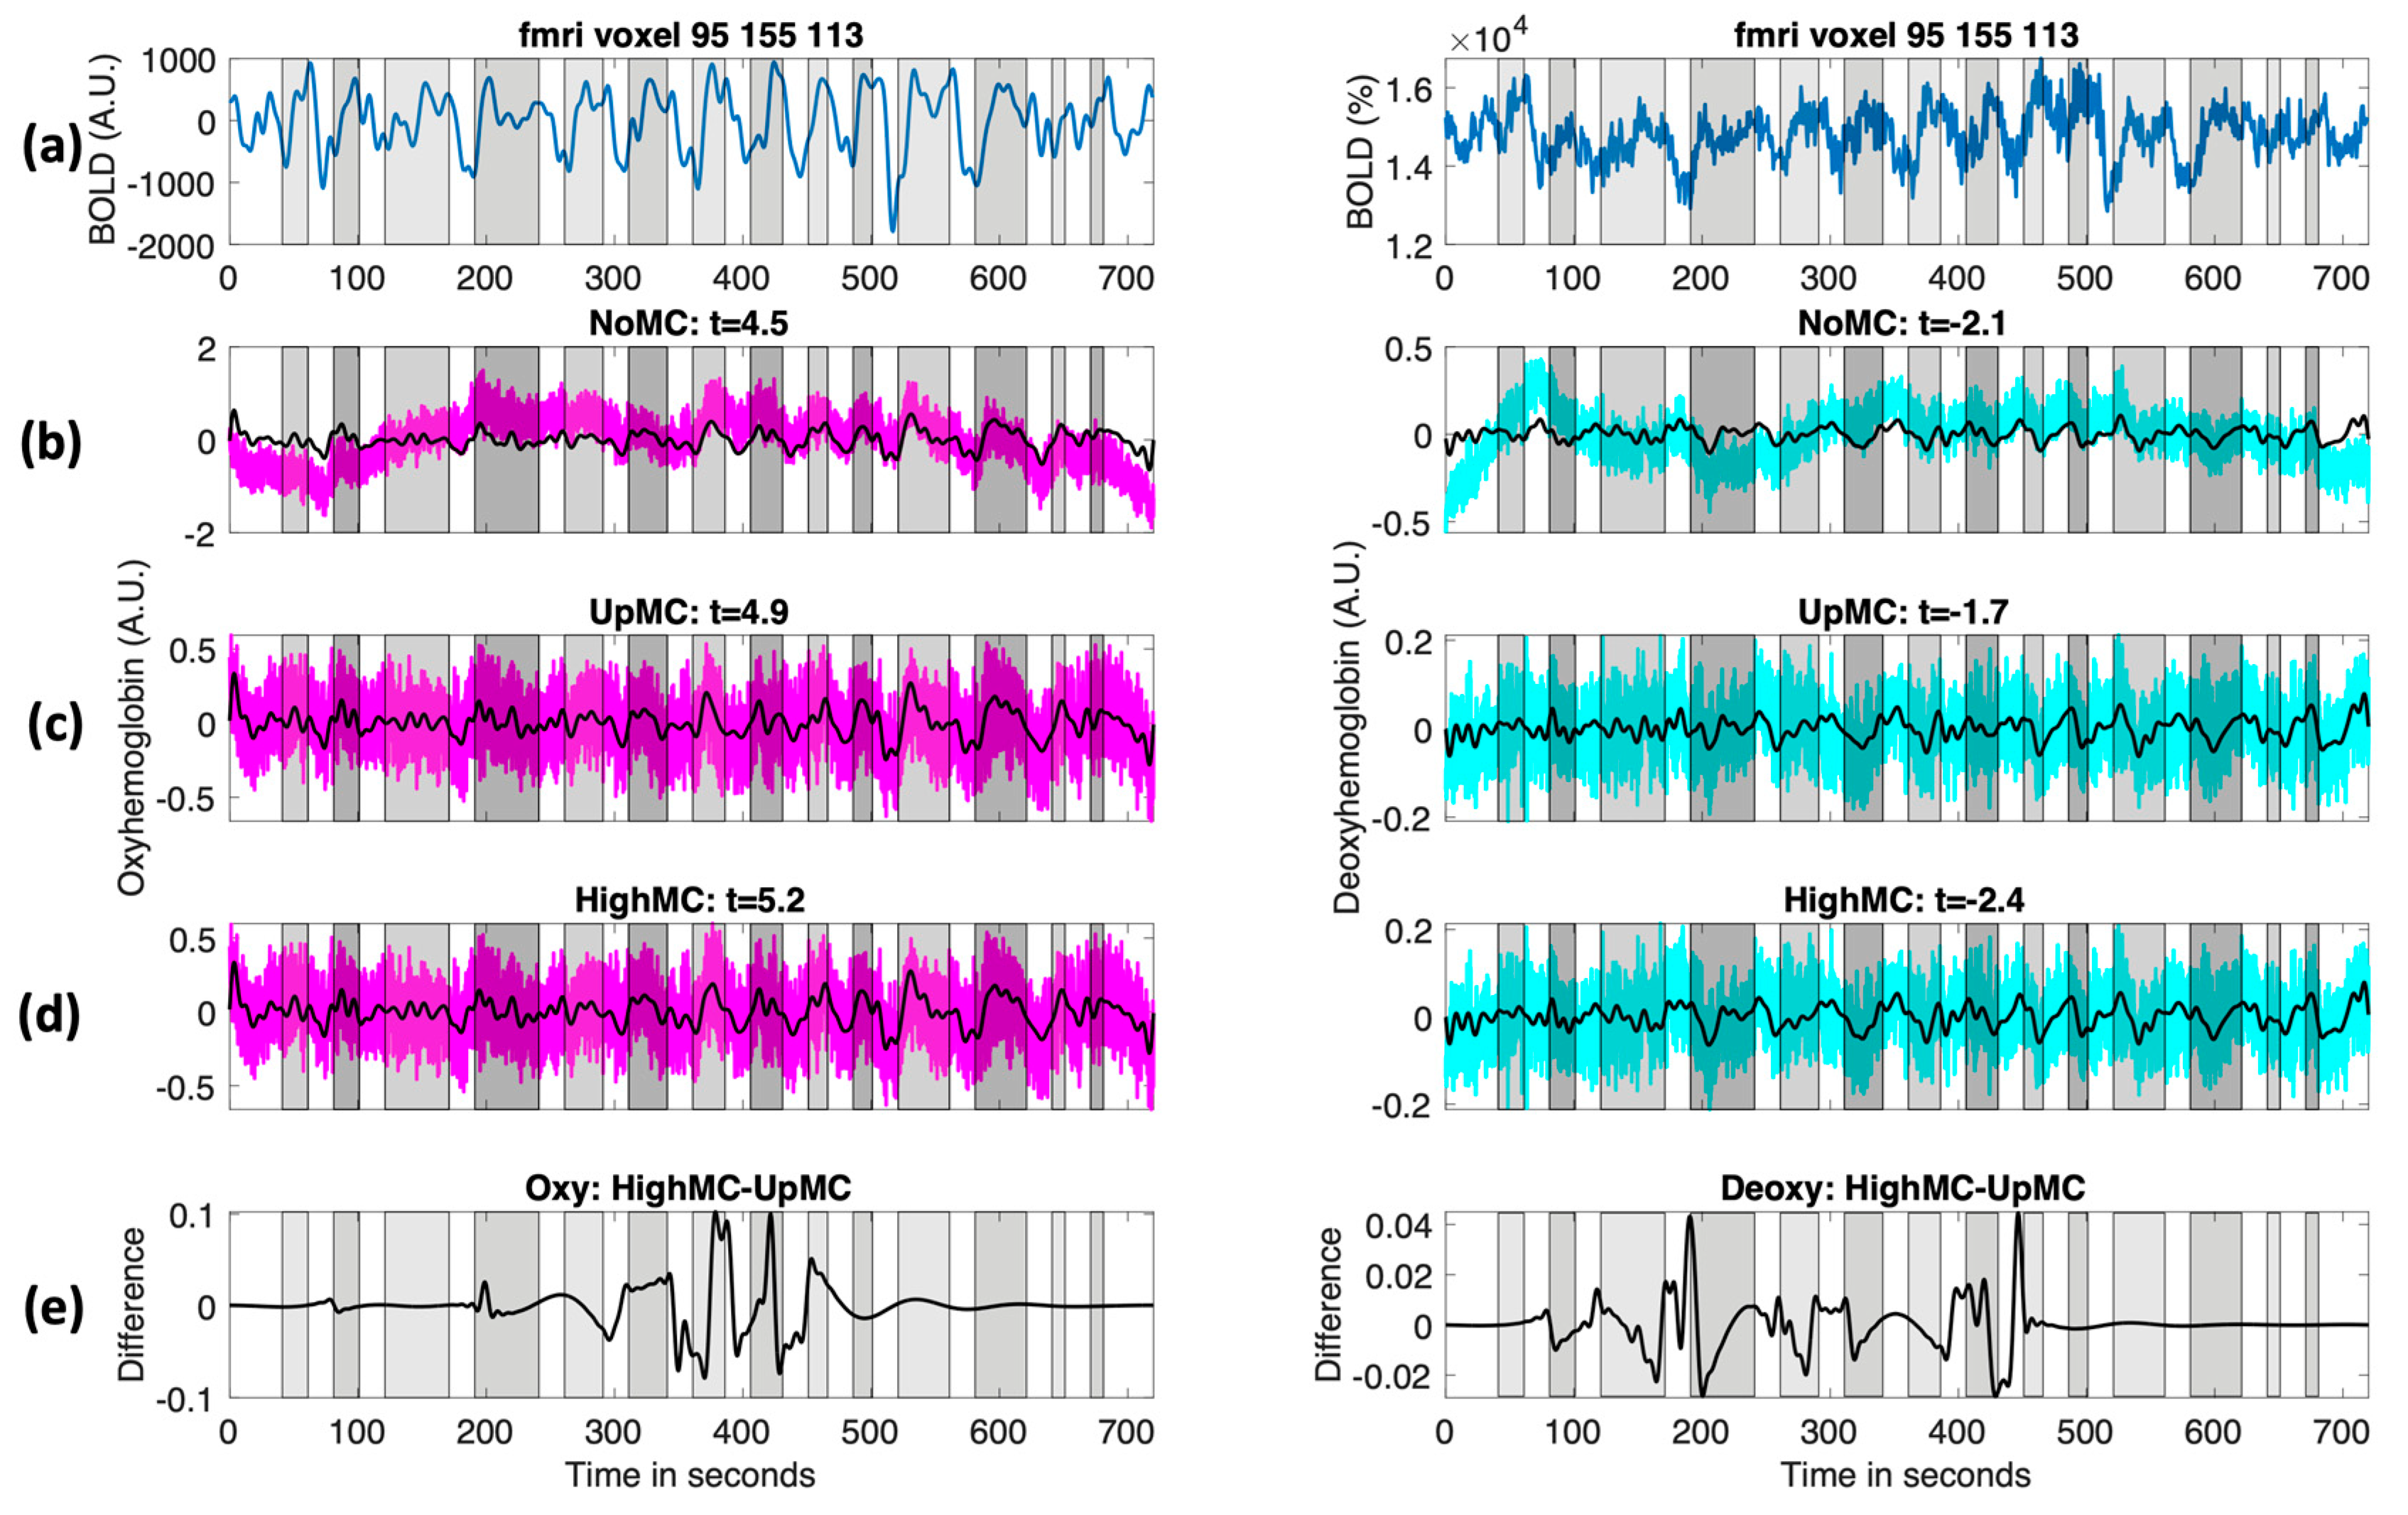
Figure 3 shows an example of the resulting fNIRS time course with and without motion correction (
Figure 3b–d) as well as an example an fMRI time course in the sensitive region of the fNIRS probe (
Figure 3a).
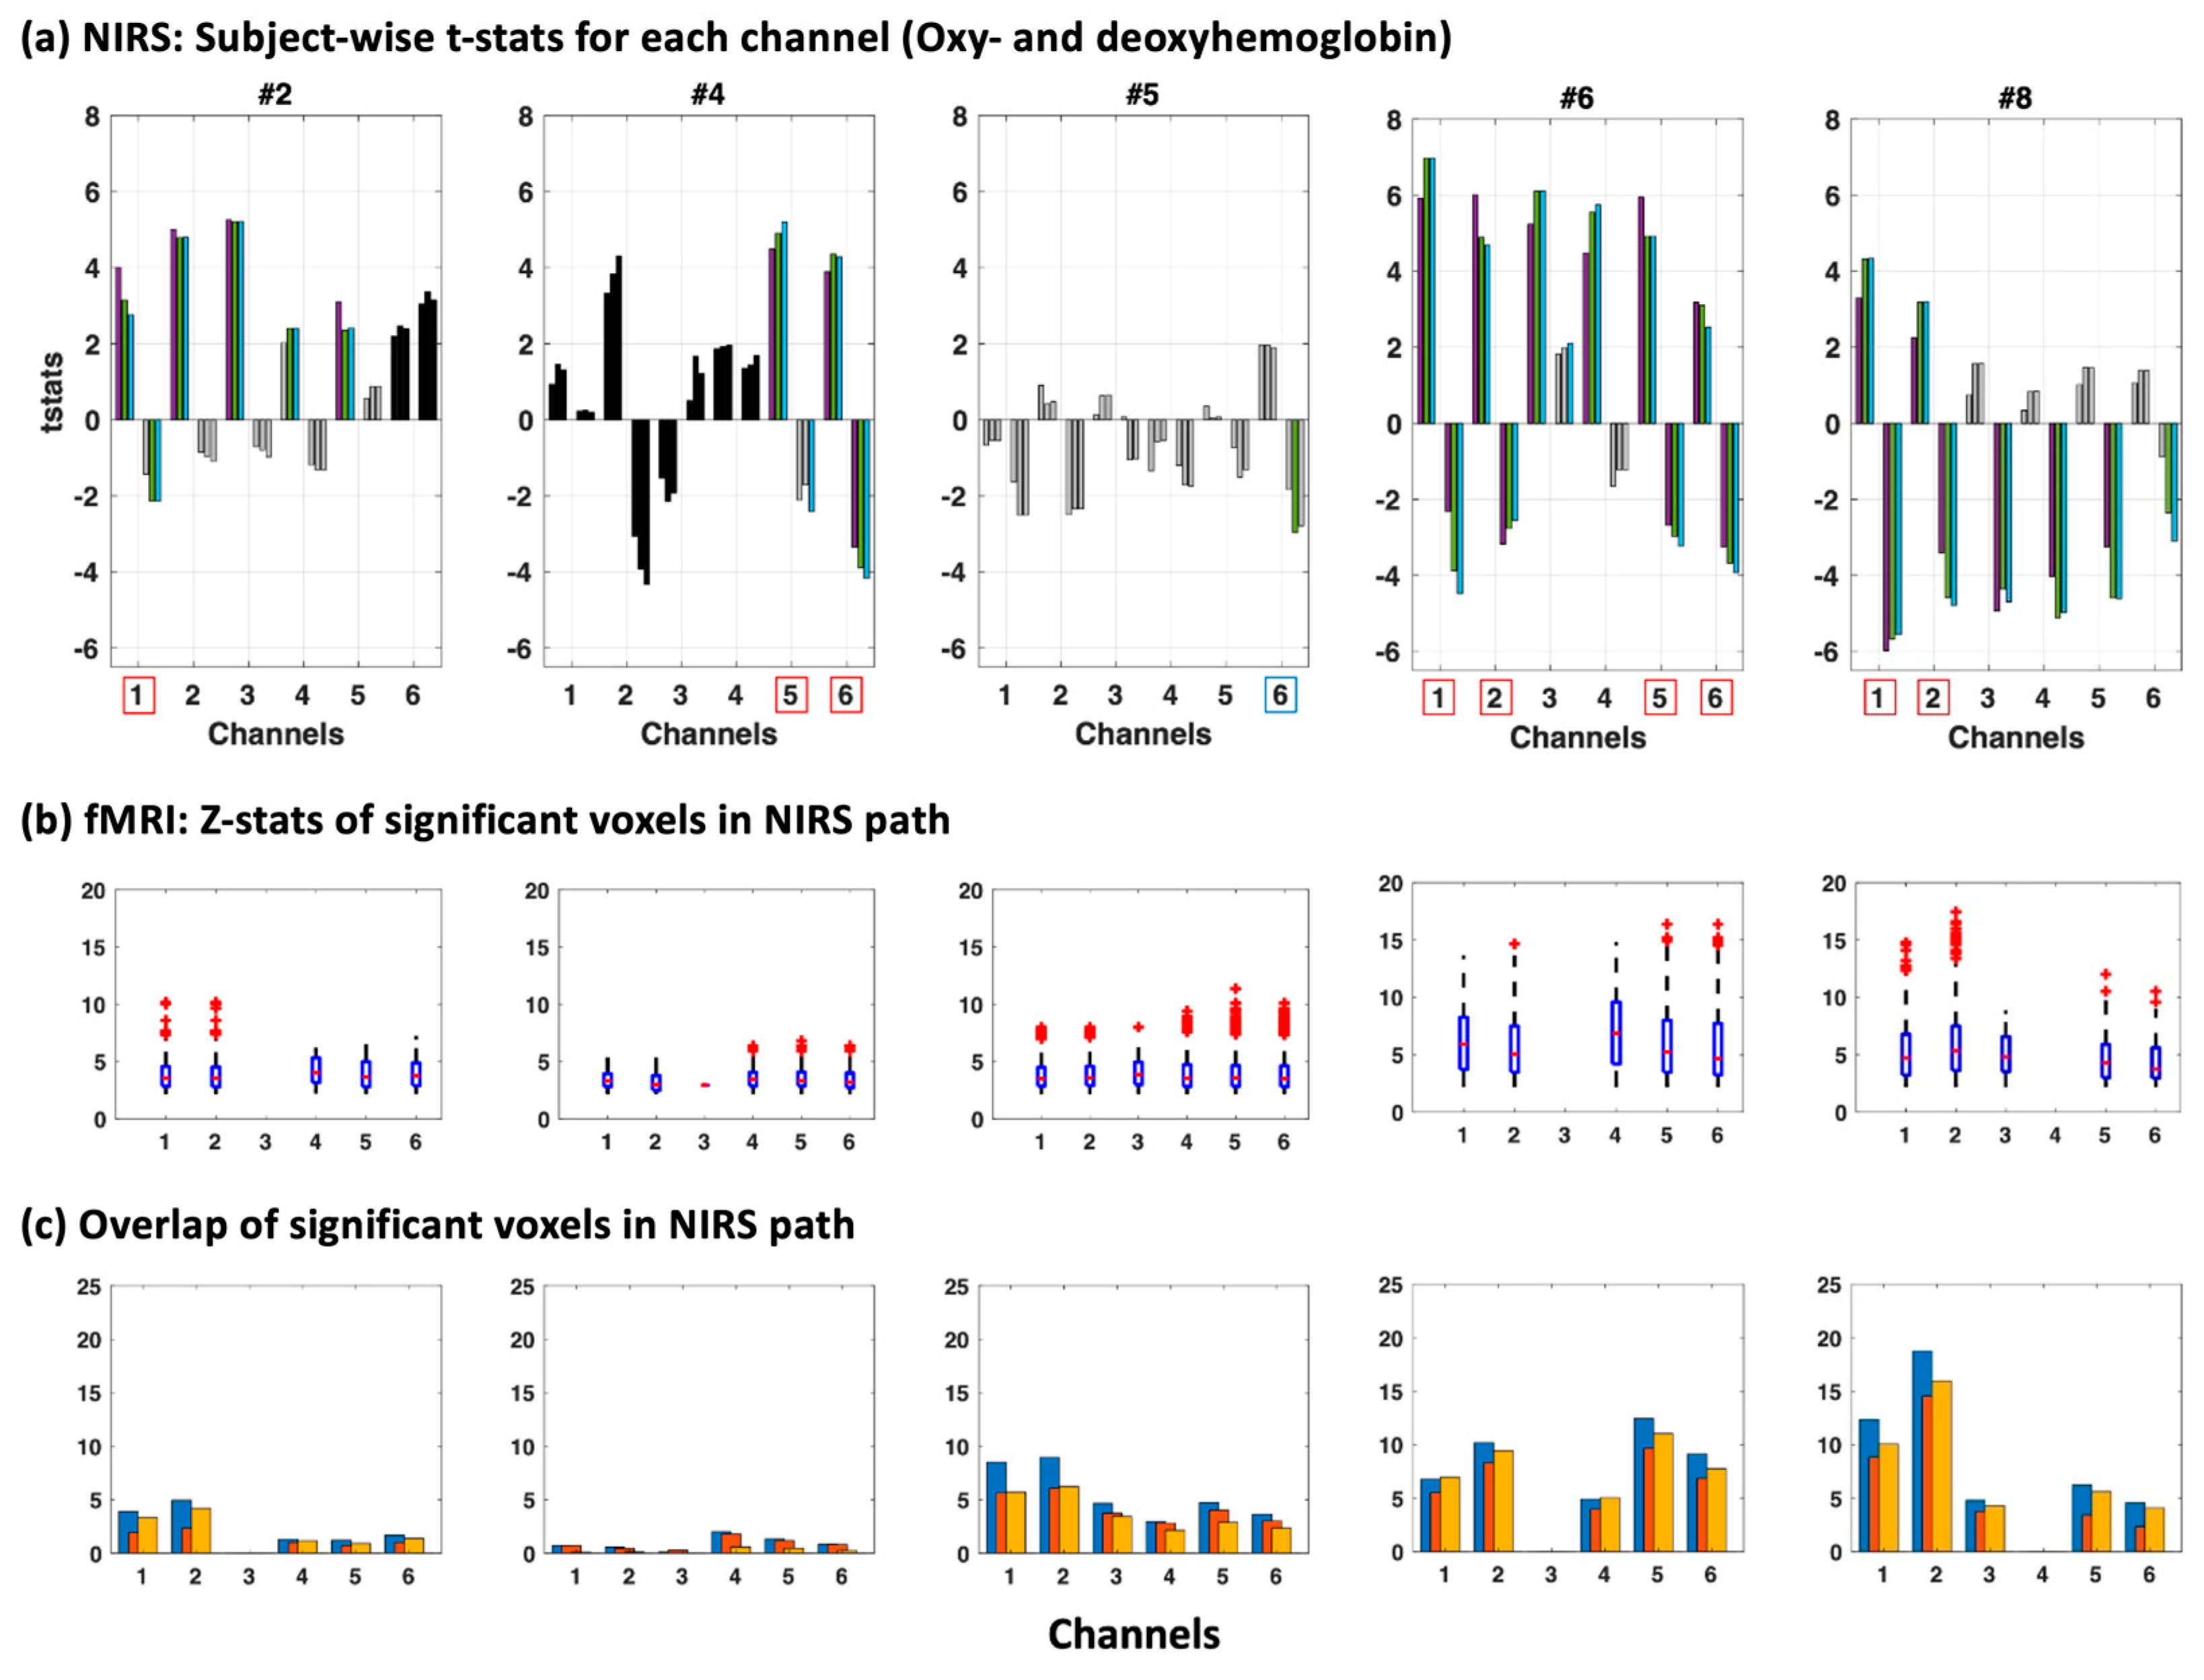
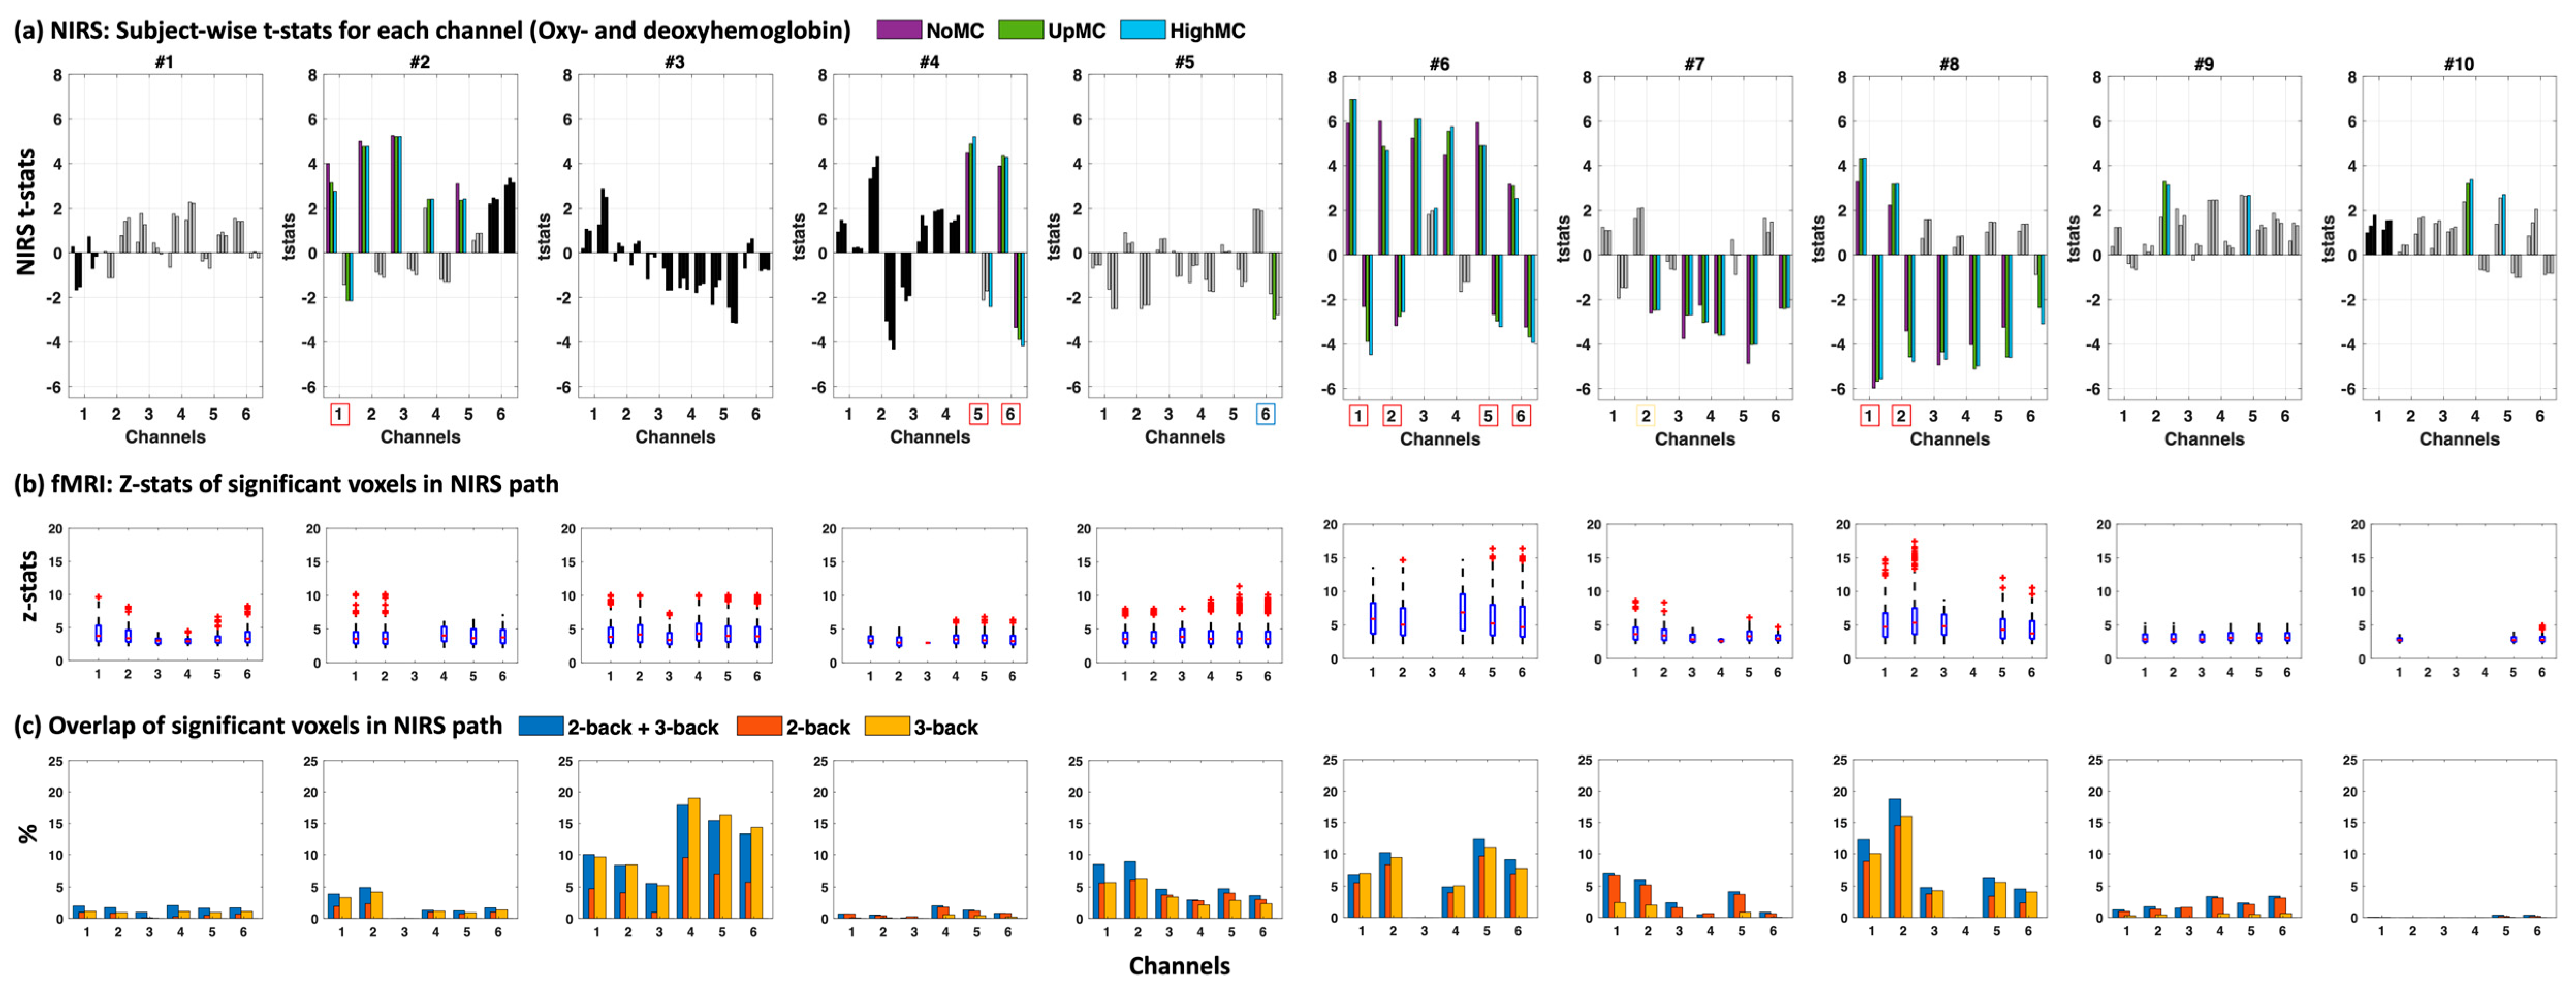
We also compared our fNIRS results to the fMRI data (
Figure 4 and for all subjects see
Figure A1) including the z-statistics in the photon probability path underneath the channels (
Figure 4b) as well as the overlap between the photon probability path and the significantly activated voxels seen in fMRI (
Figure 4c) for three contrasts of the N-back task (1st contrast: 2-back = 1, 3-back = 1; 2nd contrast: 2-back = 1, 3-back = 0; 3rd contrast: 2-back = 0, 3-back = 1).
We found a high consensus in most subjects with high z-statistics (z > 10) in areas with even a small percentage overlap with fMRI (~above 5%) when taking both oxyhemoglobin and deoxyhemoglobin into account (red boxes around channels below the
x-axis in
Figure 4a), except in subject #4 and #5. Subject 5 was especially affected by motion which may explain the improved t-statistics with motion correction (for deoxyhemoglobin). However, even though t-statistics were high for both oxyhemoglobin and deoxyhemoglobin for Subject 5 channel 6, the significance threshold was not reached when multiple comparison correction was applied (blue box around channel in which significance was reached without multiple comparison correction).
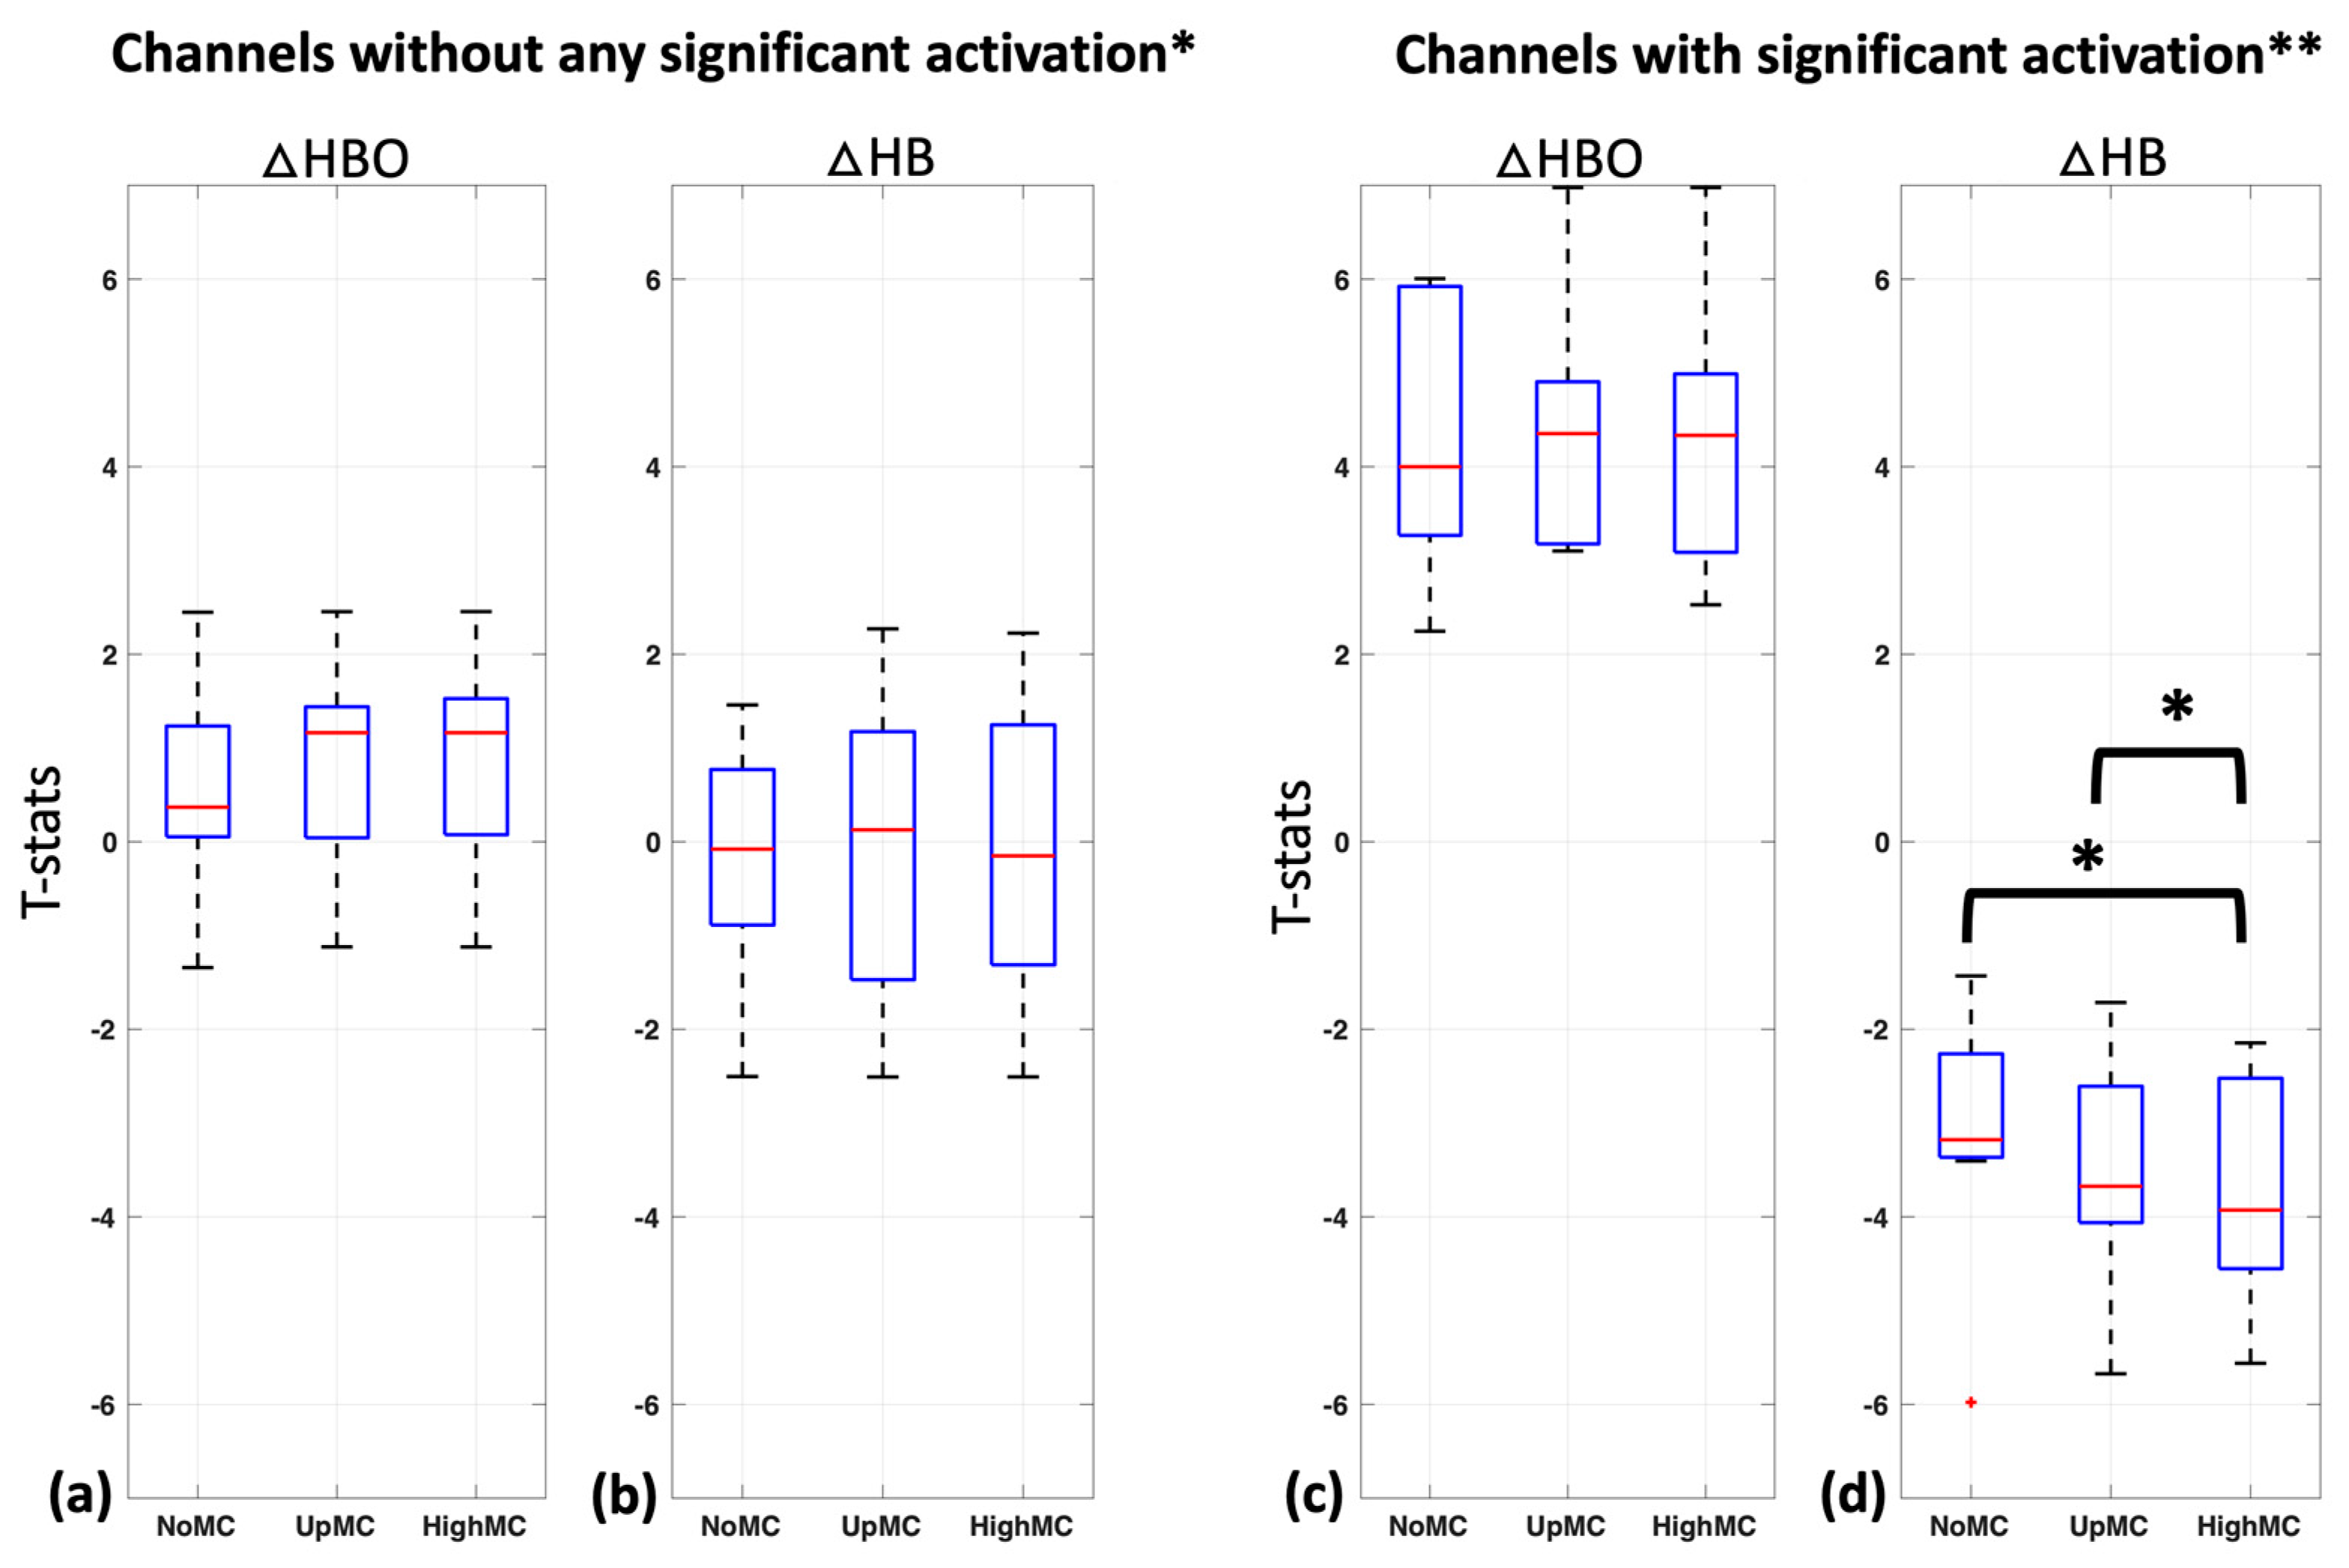
Changes in the t-statistics of the task response with motion correction (with up-sampled (UpMC) and reconstructed high sample rate (HighMC) motion parameters) in comparison to without motion correction (NoMC) were compared in all 10 subjects both for oxyhemoglobin and deoxyhemoglobin. For this evaluation, we considered the 18 non-significant channels (no significant changes in oxyhemoglobin or deoxyhemoglobin changes with any method,
Figure 5a,b) and the 9 significant channels (both significant oxyhemoglobin and deoxyhemoglobin changes,
Figure 5c,d) separately and disregarded channels in which only oxyhemoglobin or deoxyhemoglobin showed significant activation with any method.
Non-significant channels (N = 18) for oxyhemoglobin in the NoMc and UpMC condition did not differ significantly from HighMC (one-sided
t-test,
p < 0.09 and
p < 0.48, respectively) (
Figure 5a) and neither did non-significant channels for deoxyhemoglobin (one-sided
t-test,
p < 0.56 and
p < 0.11, respectively) (
Figure 5b). Mean +/− Std t-statistics for non-significant oxyhemoglobin channels in all three motion correction methods were 0.54 +/− 1.0 (NoMC), 0.81 +/− 1.0 (UpMC), and 0.81 +/− 1.0 (HighMC) (
Figure 5a) and for non-significant deoxyhemoglobin channels −0.17 +/− 1.1 (NoMC), −0.11 +/− 1.4 (UpMC), and −0.15 +/− 1.4 (HighMC) (
Figure 5b).
Significant channels (N = 9) for oxyhemoglobin in the NoMc and UpMC condition did not differ significantly from HighMC (one-sided
t-test,
p < 0.51 and
p < 0.87, respectively) (
Figure 5c); however, significant channels for deoxyhemoglobin did (one-sided
t-test,
p < 0.03 and
p < 0.03, respectively) (
Figure 5d). Mean +/− Std t-statistics for significant oxyhemoglobin channels in all three motion correction methods were 4.33 +/− 1.4 (NoMC), 4.42 +/− 1.2 (UpMC), and 4.3 +/− 1.4 (HighMC) (
Figure 5c) and for significant deoxyhemoglobin channels were −3.08 +/− 1.3 (NoMC), −3.48 +/− 1.2 (UpMC), and −3.70 +/− 1.2 (HighMC) (
Figure 5d).
4. Discussion
In this study, we demonstrate a new way to use high-resolution motion time courses extracted from fMRI to generate acceleration input data for the fNIRS motion correction methods, such as AMARA (acceleration-based movement artifact reduction algorithm) [
12] in multimodal fNIRS–fMRI studies. We did so by increasing the effective temporal resolution of acceleration data derived from the fMRI motion measurements, by adapting and expanding a method we developed to extract motion parameters at the slice acquisition time resolution, rather than the volume acquisition time resolution [
18]. We call this method AMARA–fMRI. We tested this method on a small number of channels, with a window length and step size representative of concurrent fNIRS/fMRI research datasets (~10 min), rather than the parameters used in the original sleep study on long acquisition times with a window length of 15 min [
12].
We found that this high-resolution motion correction method (HighMC) significantly improved the detection of activation in deoxyhemoglobin in comparison to no motion correction (NoMC) in the channels with significant activation (significant channels were only considered significant when both oxyhemoglobin and deoxyhemoglobin were significant for any method—red boxes in
Figure 4a) shown in
Figure 5d; the method also outperformed simple up-sampled motion traces converted into acceleration data (UpMC) in these channels (
Figure 5d). As expected, this was not true for channels showing no activation pattern (defined as channels with neither oxyhemoglobin nor deoxyhemoglobin showing significant activation with any method). This fact, in conjunction with the fact that we do not see “significant activation patterns” in any of the very small source–detector distances (e.g., channels 3 and 4) which are considered to probe only more superficial layers of the brain (e.g., [
30,
31]), is encouraging. This suggests that this motion correction does not simply increase the t-statistics in all the channels it is applied to or introduce patterns resembling activation; rather, it specifically unmasks patterns of underlying neuronal activity, increasing only the t-statistics for these channels.
Notably, in most channels AMARA–fMRI performed very well on deoxyhemoglobin measures, even rendering channels significant, which would not have been significant without correction (see
Figure 4a, Subject #2, channel 1). Studies have demonstrated that changes in the deoxyhemoglobin concentration detected in fNIRS provide a more accurate reflection of underlying neuronal activation, particularly in the spatial domain. This is in comparison to the calculation of activation maps using oxyhemoglobin. As a result, improving the signal quality of deoxyhemoglobin can greatly enhance the accuracy of fNIRS results [
32,
33,
34].
Furthermore, the fNIRS results were mostly in accordance with the underlying pattern of neuronal activity revealed by the fMRI data (
Figure 4 and for all subjects
Figure 1A), in accordance with previously reported overlaps between both techniques [
6,
23,
35,
36,
37,
38]. It also showed that even spatially small activation patterns, in combination with high z-statistics in fMRI, predicted fNIRS activation patterns in the channels above the activation site. However, we did see that in Subject #5 the motion effects could not be completely resolved with AMARA–fMRI to reveal the underlying neuronal activation shown with fMRI. This subject had a very high amount of motion in all channels, and although motion correction increased t-statistics in deoxyhemoglobin, it did not meet the significance threshold when corrected for multiple comparisons. This does suggest limitations on the amount of motion that can removed; however, these limitations are relevant only with very strong motion artifacts.
Besides these limitations, there are also additional limiting factors to our method. Namely, since our method relies on extracting the maximum amount of motion information possible from the fMRI data by measuring motion in sub-timepoints of the TR, our method will fail in cases where (1) the fMRI acquisition method does not allow for three-dimensional sub-TR motion estimation, for example if a non-multiband acquisition is used; (2) the multiband factor is too low to get good motion estimates from the subsampled data (the slice stacks are too coarse to estimate motion reliably); or (3) the multiband factor is too high, so the degree of subsampling within a TR is too low to give an effective boost to the sample rate.
Lastly, these results are based on a very small number of channels, making this method well adapted to multimodal experiments in which only a small number of channels are used due to the set-up time, subject comfort, and head position when lying down among other reasons. Motion correction methods based on global temporal filtering may perform poorly in these instances. Though these are very promising results, we did not observe a significant improvement in the oxyhemoglobin activations. This is most likely due to the higher initial signal-to-noise ratio of oxyhemoglobin; in voxels with significant activation, the signal was most likely already detected, so improved motion correction would not be expected to make a large difference (
Figure 3e). There may also be an influence attributable to the window length and step size chosen. AMARA was originally designed for extremely long free-moving studies, with window length and step size of 15 min and 5 min, respectively. The multimodal fMRI studies are restricted in terms of their motion and are of much shorter duration (e.g., commonly used paradigm times of approximately 10 min), so we would expect them to require significantly different tuning parameters than the original reference. We arrived at the chosen values using an exhaustive hyperparameter search on a single subject in a preliminary study [
39]. Incidentally, we saw here that a higher window length of 10, with step size of 5 min, was more advantageous for oxyhemoglobin. While the values we selected are clearly effective at improving the power of task detection in an existing dataset, repeating the procedure in a larger, more heterogeneous dataset encompassing more subjects and a variety of tasks will be required to tune these values optimally. However, this was beyond the scope and power of the current study.


