1. Introduction
The growing interest in the application of gesture recognition (GR) using surface electromyography (sEMG) signals has been evident in recent years. A search on the SCOPUS database using the keywords (“Electromyography” or “EMG”) and “Gesture Recognition” yielded 884 references dating back to 1993. This is a highly interdisciplinary field, with the majority of papers falling under the categories of “Computer Science” and “Engineering” with 637 and 557 references, respectively, with 351 being common to both. Other areas with a significant number of references include “Mathematics,” “Physics and Astronomy,” and “Medicine” with 169, 144, and 124 references, respectively. Of those, none, 18, and 9 do not belong to either “Computer Science” or “Engineering”.
There are numerous medical applications for this technology for both people with disabilities and healthy individuals, as discussed in [
1]. EMG signals have also been used in the design [
2] and control of prostheses [
3]. Applications in robot therapy were presented in [
4], and [
5] describes an elbow rehabilitation system using a remote-controlled intelligent robot. The use of EMG signals for disease diagnosis is an area with many applications, including the progression of primary lateral sclerosis [
6], dysphagia [
7], patellofemoral pain syndrome [
8], neuromuscular disorders [
9], and the evaluation of mobility loss in patients with musculoskeletal disorders [
10].
Some of the uses of sEMG-based GR mentioned before can be grouped in human–machine interface (HMI). sEMG HMI allows the user to control or command other systems, such as wheelchairs, prosthetics, drones, robot arms, or exoskeletons. This use has been extensively studied by specific reviews on the topic. These reviews showed the necessity of low-complexity classifiers [
11,
12,
13,
14], which translates into reduced preprocessing, lower latency, and lower power consumption. These characteristics are critical when talking about wearable devices, as shown in review [
15].
One of the great challenges facing GR systems is their use in wearable devices. A wearable device is a type of embedded system that is designed to be worn on the body, such as smartwatches, fitness trackers, and clothing embedded with sensors. These devices have several advantages, including convenience, portability, and personalization, but also have some limitations, such as limited battery life, privacy, security concerns, and limited computational power. The processing that takes place at the end devices is what is known as edge computing.
Edge computing has several advantages, such as privacy, given that no data is uploaded to a third-party cloud server; lower and reliable latency, as data are not required to be uploaded, and the latency does not depend on the network availability; and lower cost or simplicity because the system does not require a modem or connection to a network. On the other hand, the resources are limited by the embedded systems, and the use of batteries limits the use of more complex algorithms, such as complex neural networks (NNs) [
16]. Therefore, this leaves room for simpler lineal models, such as the one presented in this work.
To ensure continuity of operation, a fault-tolerant system can be implemented, which allows the system to continue functioning correctly in the presence of hardware or software faults by detecting, diagnosing, and recovering from errors in real-time. This is achieved by using techniques such as redundancy, error detection and correction, diversity, and isolation. They can be combined to accomplish different levels of fault tolerance depending on the specific requirements of the system and application. As wearables are becoming more and more important in different fields, their fault-tolerance feature is increasingly important in many critical systems, such as aerospace, military, medical, and industrial systems, where a failure could have serious consequences. In these applications, the lack of robustness could lead to material or even personal damage.
The contribution of the proposed method is its capability of detecting errors by using a gesture multiclass model based on partial least square (PLS) class modelling with the use of an encoding matrix called error correcting output codes (ECOC) while keeping a small size model and low complexity, therefore, maintaining its suitability for real-time classification on a wearable device. To achieve fault tolerance, error detection was implemented. An
error is defined as a deviation from the expected or correct behaviour of the system, in this case, the difference between the gesture made and the obtained label. In the context of HMI, an
error can lead to a wheelchair driving into an obstacle because of a gesture misclassification or a drone crashing because the GR classifier confused left withright. In the proposed class-modelling approach, if an
error is detected, it can take action, such as asking the user to reposition the electrodes or to repeat the gesture, preventing the system from executing any incorrect actions based on the sEMG input signal. Latency and robustness are critical in real-time classification [
17]. This work also addresses the unresolved issue of automating the obtention of useful features because there are dozens of them that are usually chosen by hand during the design of the classifier and have a great impact on the outcome of the classifier.
This paper is organized as follows: Following this introduction, state-of-the-art approaches are discussed in
Section 2, and the elements of the problem are described in
Section 3. This includes the notation and experimental procedure to obtain the EMG signals (
Section 3.1) and a description of the structural elements of the PLS-ECOC procedure (
Section 3.2,
Section 3.3,
Section 3.4,
Section 3.5,
Section 3.6,
Section 3.7 and
Section 3.8). The results are shown in
Section 4, and a discussion of them in
Section 5 shows the advantages of modelling the gesture and the accuracy of gesture classification, comparing it with those found in several papers. This paper ends with conclusions and several references.
2. State-of-the-Art Approaches
In gesture recognition using sEMG signals, computational techniques from machine learning (ML) are employed to assign a recorded signal to a gesture class. Specifically, a matrix of sEMG signals with N rows corresponds to N gestures grouped into K classes (). There are two general approaches to addressing this issue: discriminant techniques and class modelling.
The first one is a purely discriminative approach. In the training phase, the ML technique constructs a mathematical model and decision rule to assign each gesture class a subset of the signal space in such a way that they are disjoint, and their union is the total. As a result, in the prediction phase, a new signal will necessarily be assigned to one of the classes and only one. These types of techniques are commonly known in pattern recognition as discriminant or classification techniques.
The performance of a discriminant model is measured with the expected classification accuracy, namely, the percentage of correct decisions in prediction or variations of this metric. Examples of common purely discriminant methods include linear or quadratic discriminant analysis (LDA, QDA [
18]), regularized discriminant analysis (RDA) [
19], partial least squares discriminant analysis (PLS-DA) [
20], classification and regression trees (CART) [
21], or support vector machines (SVM) originally developed for two-class classification [
22], generalized to the multiclass situation [
23], and the case of unlabelled data [
24]. Neural networks (NNs) have also been widely developed and improved since their inception [
25], with the backpropagation algorithm [
26] allowing for computational feasibility. NNs offer flexibility, allowing them to adapt their structure to improve classification accuracy. For example, the convolutional neural networks (CNNs) proposed in reference [
27] have been applied to handwritten digit classification.
The second approach for GR using EMG signals is known as the class-modelling technique. It also builds K subsets, named K-class models, which are represented by , but they are not necessarily disjoints, and their union may not cover the entire signal space. As a result, an object(in this case an sEMG signal) can belong to one or more classes (gestures) or none at all. To evaluate the performance of the class-modelling technique, the sensitivity and specificity of each class model are measured. In this context, the sensitivity of a class model refers to its ability to correctly identify its corresponding gesture (usually measured as the rate of correctly classified objects within the class model, ), while its specificity refers to its ability to correctly reject objects that do not belong to the class model (measured as the rate of correctly classified objects outside the class model).
Among the class-modelling methods, some stand out: Soft independent models of class analogy (SIMCA) [
28] have been widely used for product authentication, quality assurance, fraud detection, unequal class models or unequal dispersed classes (UNEQ) [
29], or an adaptation of SVM [
30]. Two-class modelling using PLS can be seen in reference [
31] and for K-classes in [
32].
The advantage over the usual class discriminant classifiers used in sEMG gesture recognition problems and the proposed class modelling approach is that it enables the system to be fault tolerant. This is because the class modelling approach does not limit the answer to a unique label. Another advantage is the extra information provided by the sensitivity and specificity of each class model that allows the engineer to adapt the design by including extra channels to detect the difference between the confused gestures or to remove certain gestures if they are being problematic prior to the deployment of the system. This possibility in discriminant classifiers would not be available, and the only possible action would be to add more data to the dataset with the objective of improving its accuracy.
In the field of gesture recognition using EMG signals, class modelling has never been used. In the literature reviewed, only gesture classification has been performed. Publications powered by pattern recognition methods have been reviewed in references [
33,
34,
35]. The most commonly used are SVM [
36,
37] and NNs [
38]. After the signal acquisition, among all the modules that compose a gesture recognition system, perhaps the most important and critical ones are feature extraction and the classification algorithm. In this regard, the algorithms and results of these references are summarized below.
The review by Nazmi et al. [
35] of works from 1999 to 2013 shows that the classifiers used are linear discriminant analysis, SVM, adaptive network-based fuzzy inference system, NNs, and fuzzy logic. The range of accuracy is [73.00, 98.87] with a mean of 90.60% and a standard deviation of 7.06%. Moreover, Jaramillo-Yáñez et al.’s review [
33] from 2013 to 2019 showed that the classifiers used are support vector machines, feedforward neural networks, linear discriminant analysis, convolutional neural networks with several variants, k-nearest neighbours coupled with several other procedures binary tree-support vector machines, vector autoregressive hierarchical hidden Markov models, Gaussian mixture models and hidden Markov models, quadratic discriminant analysis, fuzzy logic, recurrent neural networks, generalized regression neural networks, and one vs. one classifier. Among them, the most commonly used machine learning algorithms are support vector machines, feedforward neural networks, and linear discriminant analysis. The accuracy of the reviewed publications ranges from 71.00% to 99.78% with a mean of 91.57% and a standard deviation of 6.35%. Similar accuracy is reported (63.74% to 99.23% with a mean of 89% and a standard deviation of 10.11%) by Dhumal and Sharma’s [
34] revision between 2017 and 2021. A more recent comparison evaluated five machine learning techniques in classifying daily gestures [
10]. It reported an accuracy ranging from 47.7% to 83.6% with a mean value of 66.54% and a standard deviation of 14.95%. This revision included SVN, a random forest, a decision tree-based algorithm, a convolutional neural network, and a recurrent neural network.
The analysis of the abovementioned reviews also shows that in order to capture and describe the complexity and variability of sEMG signals, it is considered necessary to handle “deep learning” methods. This trend can be observed in related fields such as gesture recognition based on electroencephalogram (EEG) signals. In Zhang et al.’s revision [
38], a taxonomy of deep learning models was made according to their functionality in different scenarios of brain activity. After a very extensive description of applications, the authors indicated that it is still very challenging to produce classification results in real-time. In [
39], GR performance was improved by using a graph sequence neural network applied to an HMI problem. In [
40], six features were obtained using the correlation and canonical correlation analysis between filtered signals; after that, a selection was conducted. However, these advances have not yet been translated into their equivalent sEMG signals.
Phinyomark and Scheme [
41] made a very systematic analysis of the use of deep learning for classifying sEMG signals and define two categories of computational procedures:
Feature engineering. Under this heading, the methods to find the best combination of features in a specific problem are grouped. They are parallel computing procedures, either native or classics parallelized. Then, conventional classifiers, such as support vector machines, linear discriminant analysis, k-nearest neighbours, random forests, multilayer perceptron neural networks, etc., are applied.
Feature learning. This heading includes methods with a special emphasis on “deep learning”. In general, though, deep learning models can be roughly grouped into three main categories: unsupervised pretrained networks, convolutional neural networks, and recurrent neural networks. These three categories of models have already been used to analyse sEMG signals, as shown in the reviews of the preceding paragraphs.
The authors concluded their extensive review by saying: “A key challenge and impediment to the clinical deployment of deep learning methods is their high computational cost (i.e., long training times and high computational complexity). Because of the stringent power and size restrictions of prosthetic components, most devices are built using embedded systems”.
On the other hand, the use of an SVM classifier for gestures in EEG and sEMG signals is still interesting, as shown by Quitadamo et al.’s review [
14]. Up to nine different variants of SVM classifiers were reviewed in several applications. The review showed that the accuracy of the 76 publications revised ranged from 18.83% to 100% with a mean of 80.8% and a standard deviation of 13.32%. Taking into account only the sEMG GR publications, the accuracy increases to a range from 73% to 100% with a mean of 91.1% and a standard deviation of 6.38%. The review concludes that “SVMs result to be among the most versatile classifiers for pattern recognition… and furthermore resulted to be particularly suitable for online implementations”.
Therefore, along with the trend to use deep learning, there is still interest in exploring the feasibility of class modelling with PLS-ECOC that simultaneously reduces the complexity associated with feature engineering and that associated with the deep learning approach. In addition, PLS-ECOC distinguishes between failure and error.
However, in all cases, the methods used are independent of the structure of
, the sEMG signals, and the encoding used to describe the classes, which is denoted by
. In engineering, particularly in the field of signal transmission, redundancy has been used to distinguish, at the receiver, two signals despite having lost information during transmission. This idea has been used in this work to encode the gesture classes and construct the matrix
by assigning each class a code (a vector of ones and minus ones) using an ECOC matrix. Little attention has been paid to the codification of classes in GR sEMG publications. Only ref. [
14] presents the effect of two codifications (one vs. one and one vs. all) which have been proven to be inefficient [
32].
The proposal in this work is to use PLS to find the linear relationship between the signals and the encoded classes, explaining the maximum variance in
, in
, and the maximum correlation between them. PLS constructs
nvl latent variables, linear combinations of
variables and
variables under the condition of having the maximum correlation. In this way, PLS applies a reduction of the signal space but links to the classes of the gestures to be distinguished. This characteristic makes PLS an advance in the treatment of EMG signals. Since ancient times [
42], the need to reduce the dimension of the signal space has been recognized, in most cases, as a second stage after obtaining features [
43]. In [
44], using several classifiers, a comparison has been made between feature selection and dimensionality reduction, including PCA. However, in general, PCA is performed independently of the classifier and, therefore, of the classes to be modelled. In a review made, only one PLS application with sEMG signals has been found. It is devoted to model concurrent EEG and EMG data collected in a Parkinson’s disease study [
45], but it was not a classification of gestures.
The method, PLS-ECOC [
32], provides the sensitivity and specificity matrix of the constructed model. This matrix is evaluated using diagonal modified confusion entropy (DMCEN) [
46]. According to the classification of methods to preprocess sEMG signals, PLS-ECOC can be considered an embedded one because the construction of latent variables and the model of classes are built simultaneously in the same model [
47].
It is also noteworthy that PLS-ECOC is robust to sEMG signals that differ from those used to train the class model since, in addition to the equations for class prediction, the model provides a closed enclosure in the sEMG signal space, the PLS-box, so that a signal outside of it will be declared an outlier.
3. Materials and Methods
This section presents the methodology followed to develop the hand gesture model-ling system (HGM) based on surface electromyography signals (sEMG) and partial least squares multiresponse. It has been divided into eight subsections, each of them providing enough information to understand the method and the results section. A complete schematic of the operations followed to achieve HGM can be seen in
Figure 1.
This figure is meant to be a guide to the reader showing the processing and flow of data, and it follows the same notation and subsection names and numbering used in the rest of this paper. In it, each rectangle includes the numerical matrix resulting from applying the operation indicated in the access arrow and describes in detail in the subsection that bears the name and numbering indicated. The second subscript of the matrices indicates the dimension of each of them.
For example, the vector of the class labels,
L, and the signals sEMG,
X, are divided according to the procedure described in
Section 3.2 into the data to be used for training,
LTR and
XTR, and for prediction,
LTS and
XTS, respectively.
Applying the coding procedure explained in
Section 3.3 returns
YTR, the matrix of the encoded response, which, together with
XTR, allows the coefficients of the PLS regression,
, to be obtained. With this model, the calculated code matrix,
, is obtained, which is decoded into
to compare it with the vector of the labels
LTR. Afterwards, the matrix of sensitivities and specificities,
STR, is obtained in training. This process is iterated according to the procedure described in
Section 3.7 to obtain the optimal PLS model,
. This model is applied to the test set,
XTS, and the vector of labels in prediction,
, is obtained. More details on the method can be consulted in [
32].
The K-class model consists of K models, one for each class modelled. Class models are built and validated as a whole. Consequently, if a new class was added, the model would need to be built and validated again, obtaining a new (K + 1)-class model.
I sEMG signals were recorded into K class, C1, C2, …, CK, each of them associated with each gesture type. The number of signals recorded for the j-th class is denoted by Ij, so .
The result of applying the K-class model is summarized in the confusion matrix N
where usual gesture classification algorithms verify the following:
njm is the number of gestures belonging to class
Cj which are inside the class model built for class
Cm.
, which means that the sum of the j-row elements of matrix N, Equation (1), is equal to the number of elements in the j-th class.
, which means that the sum of all the elements of matrix N, Equation (1), is equal to the total I signals recorded.
However, when using class modelling, each signal can be assigned to no class or more than one class. So, one or both of the above equations might not be met. This distinction between usual classifiers and the class modelling presented here will prove to be critical.
The relative frequency matrix,
F, Equation (2), can be obtained from Equation (1) as follows:
As a consequence of the matrix N structure and the use of the class modelling algorithm, each of the rows of the F matrix, Equation (2), may not add 1, unlike a classification method.
F matrix has a relevant statistical meaning. The assignation of an sEMG signal to a class is applying a hypothesis test. Given
K classes, this decision is a family/set of
K(
K − 1) hypothesis tests such as those in Equation (3). It is composed of
K − 1 tests for each of the
K classes. The null Hypothesis H
0 is the same for each
j = 1, …,
K, but H
1, the alternative hypothesis, is different for each one.
TEST matrix, Equation (4), symbolically summarizes these tests. Each diagonal term contains the null hypothesis (H0), and the rest of the terms of the matrix contain the corresponding alternative hypothesis (H1).
Hypothesis test theory defines
as the significance level and 1 −
βmj as the power of each test. These parameters are related to sensitivity and specificity of the test. Note that notation on sensitivity and power of the test vary and can be confusing, see references [
35,
36,
48]; that is why they are defined below.
The column j-th of TEST, Equation (4), corresponds to the K − 1 hypothesis tests of class. Using the F matrix, it is possible to calculate the significance level and power of the test and to define the sensitivity and specificity:
Sensitivity, ) = of F, Equation (2). This means the probability of correctly assigning an sEMG signal of class to the class model of annotated as in Equation (5).
Specificity, corresponds to the rest of the elements of the columns of F, Equation (2). This means the probability of correctly not assigning an sEMG signal of class to the class model of annotated as in Equation (5).
To sum up, sensitivity is the proportion of gestures that are assigned correctly to the modelled class, and specificity is the proportion of gestures correctly rejected from the modelled class.
With this notation, matrix F is transformed into matrix S of sensitivities and specificities, Equation (5), that characterizes the performance of the K-class model.
3.1. Acquisition of EMG Data
The acquisition setup is composed of an embedded device (
Section 3.1.1) and a computer. The methodology for the acquisition is described in
Section 3.1.2. Data description is included in
Section 3.1.3. A detailed description, including code, can be found in the previous work [
37] of the authors.
3.1.1. Hardware Description
The data were acquired using an embedded system,
Figure 2, based on a 4-channel 24-bit ADC (AD7124-4) connected by serial peripheral interface (SPI) to a microcontroller (MCU) STM32L486RG microcontroller and running YetiOS [
49] as the operating system. The sampling rate was set to 500 Hz with a hardware lowpass filter with a cutoff frequency of 130 Hz. The signals were transmitted via serial to the computer where they were processed using MATLAB [
50].
3.1.2. Methodology for Acquisition
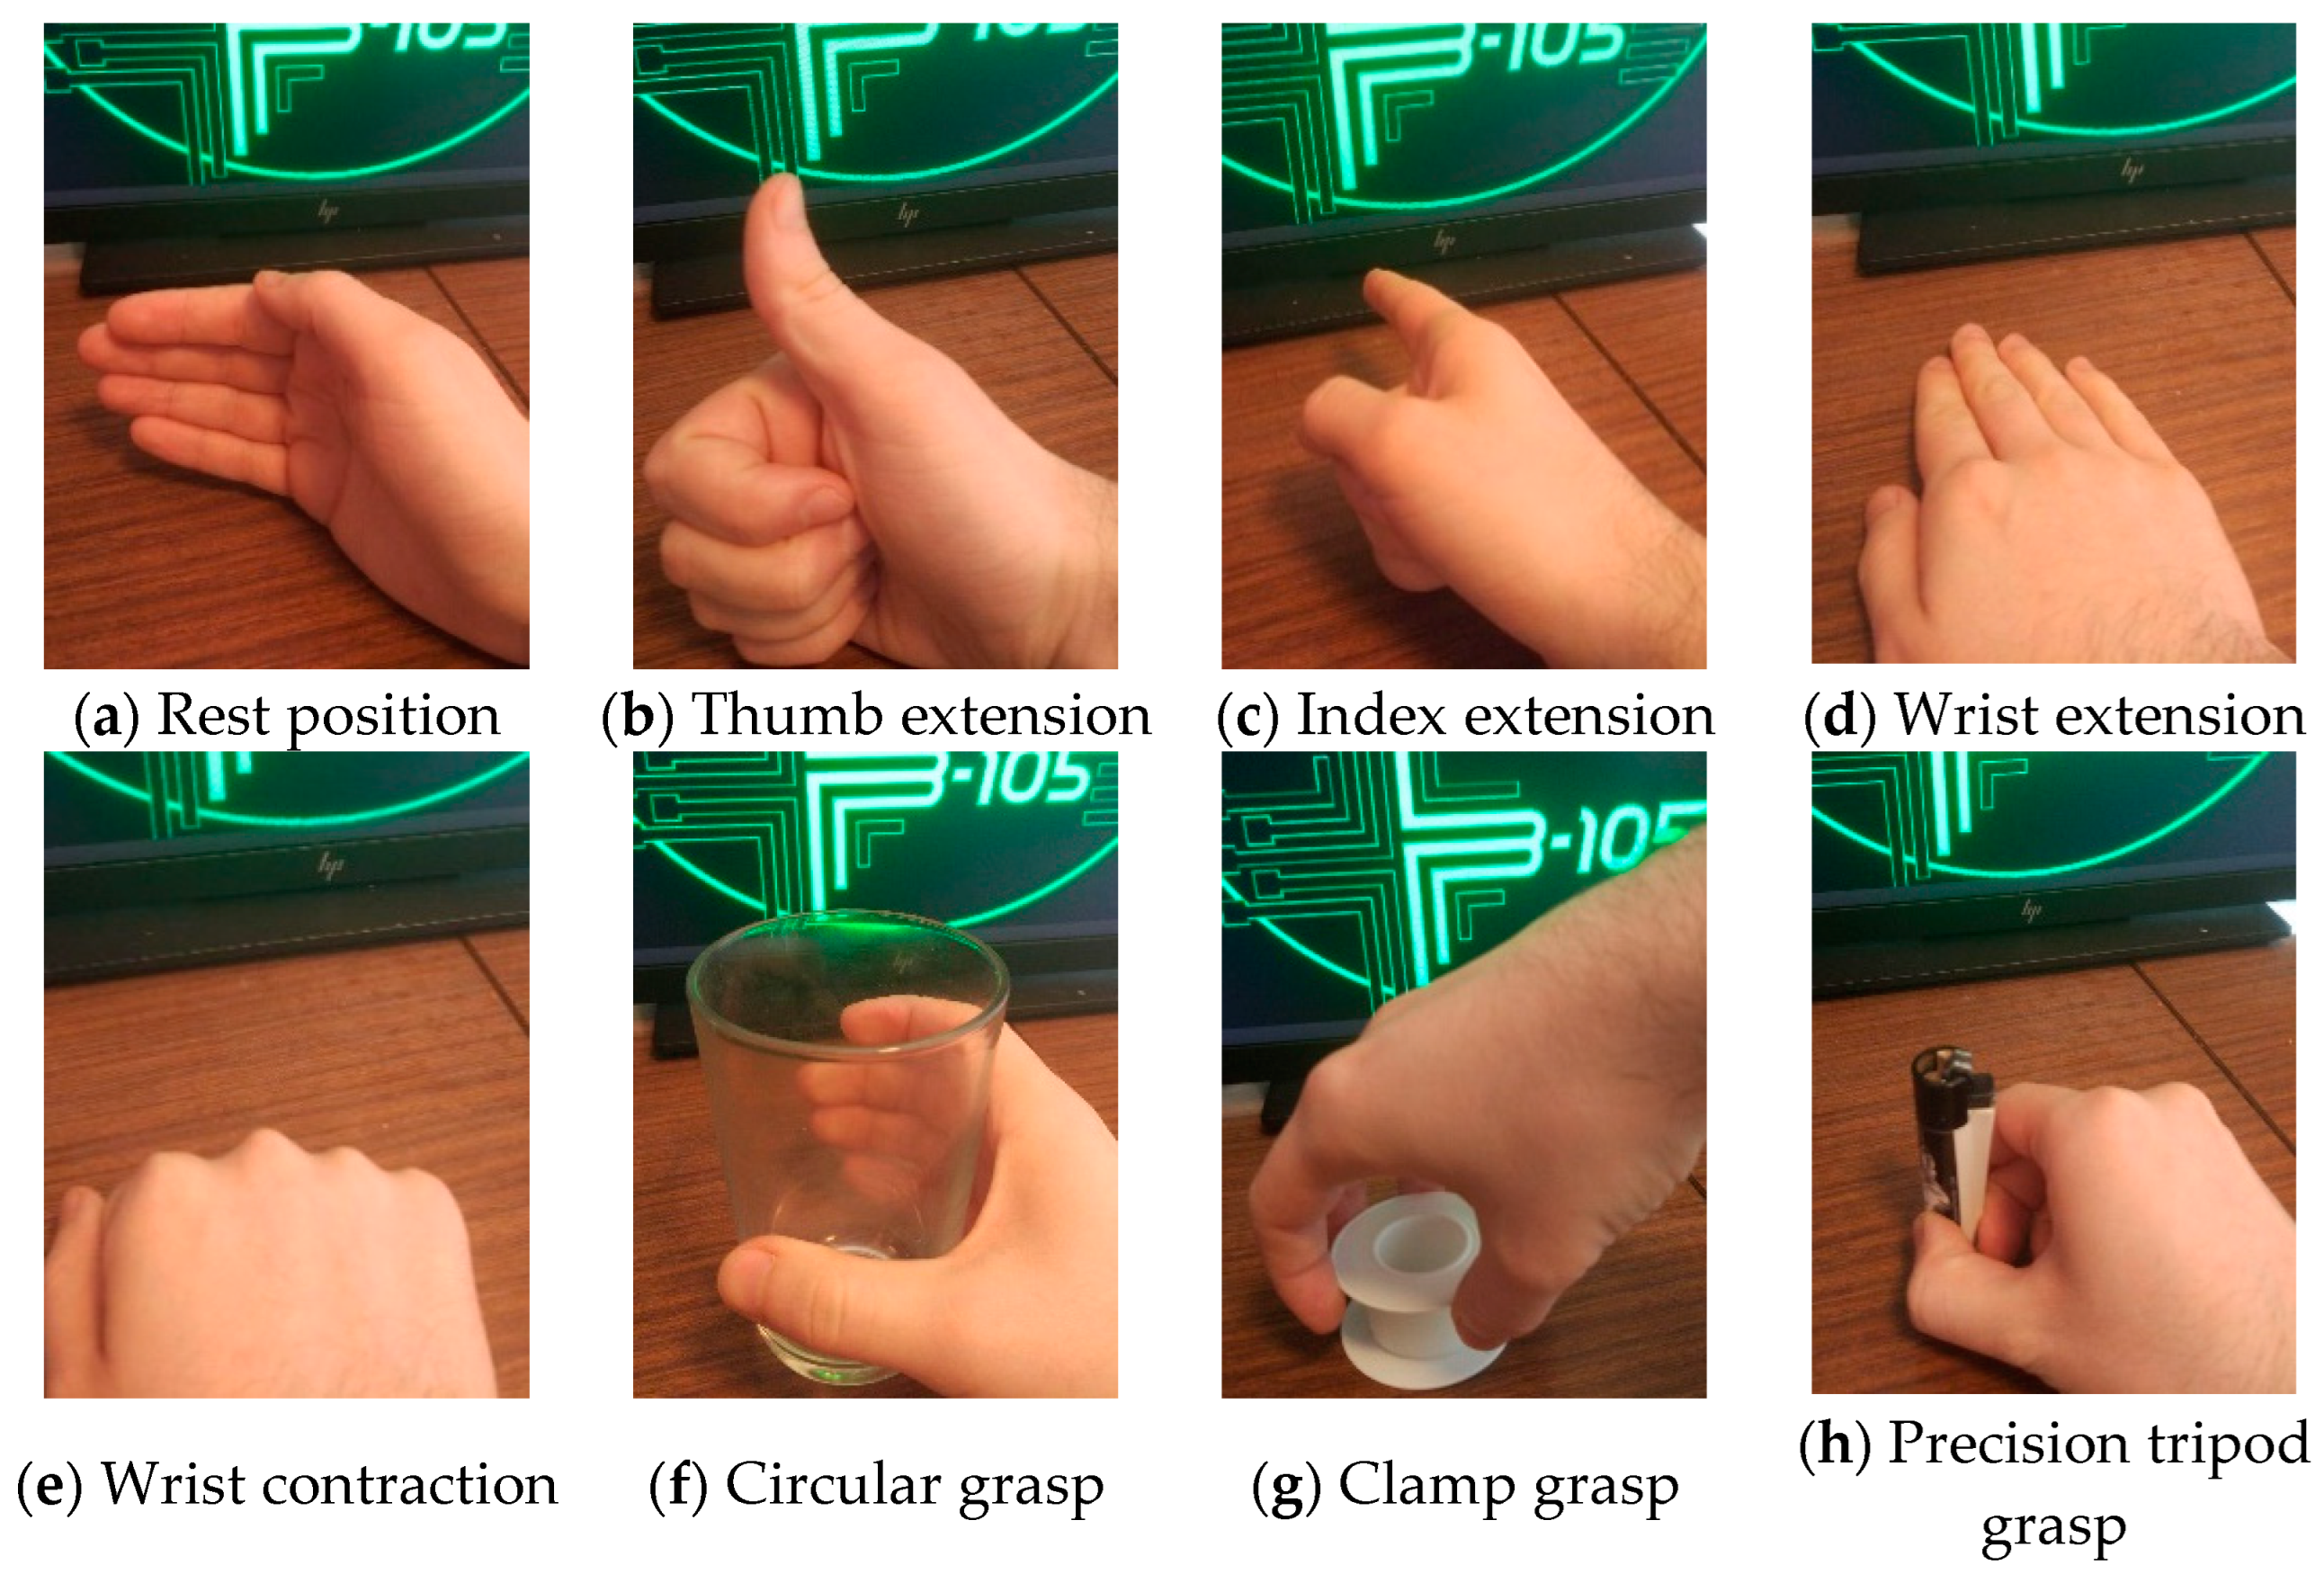
The study conducted within this work does not require ethical approval since no part of the experiments has any possible effect on the subjects’ bodies, harmful or otherwise. The system developed only gathers user motion data through EMG measurements. Moreover, the data were recorded and used in this publication under informed consent of the subject. The subject was a 23-year-old male.
Figure 3 shows the 8 gestures recorded that emulate representative prosthetic hand movements. These particular movements are the same as those used in one of the most employed databases in the field, Ninapro DB6 [
51].
Electrodes are placed on the skin of the forearm of the subject after applying conductive gel. Then, the subject was asked to repeat the gestures shown in
Figure 3 10 times, each of them for 3 s, and they were subsequently stored in the computer, processed, and saved in matfiles using MATLAB [
50].
3.1.3. Data Description
The result of the acquisition is a vector of around 1620 voltage measurements for each channel. Channel 3 was faulty during the acquisition, so, it was removed. Each of these vectors is concatenated, leading to a vector of 4860 coordinates. A total of 80 gestures (10 repetitions of each class) were acquired, producing a matrix
of size 80 × 4860 that will be used in this paper. This dataset is fully available in [
52].
3.2. Training and Test Sets to Evaluate the Prediction Abilitty of the PLS2-CM Model
The evaluation of prediction capability can be done through a test set independent of the training set or by cross-validation (CV), also named k-fold procedure, that includes leave-one-out cross-validation. Despite its popularity, CV use has been criticized [
53], and it has recently been formally proved that it is not a correct procedure to estimate prediction capability [
54]. It has therefore been decided to divide dataset
into two subsets:
for training and
, the test set, for the evaluation of predictive capability. The Kennard-Stone algorithm [
55], the most relevant for this task, was used by means of ‘kennardstone’ function of PLStoolbox [
56]. The method initially selects the pair of sEMG signals with the largest distance and ranked as most representative. Then, in each following step, the remaining samples with the greatest distance from the already selected samples are chosen and added to the bottom of the previous rank list. This procedure is repeated until a predefined number of gestures had been chosen and ranked in each class. The method assures a uniform distribution of the sEMG signals selected, and it also includes boundary gestures of the class. Remaining gestures are assigned to test subset. In each class, 70% has been assigned for training and 30% for test subset. Resultantly, training matrix
has a size of 56 × 4860 and 24 × 4860 for prediction
.
3.3. Class Encoding
Error correcting code (ECOC) is the method of choice to encode the K classes by means of c binary learners. This codification is defined by the matrix of K rows and c columns whose elements are or . A simple example, Equation (6), of matrix was built to encode 4 classes using a code of length .
Each row of represents the class code, so in Equation (6), the objects of the third class will be assigned the code or vector . The same can be performed for the other three classes. Using these codes, it is possible to obtain the matrix formed by the class codes of all the objects. Each column of is a binary learner that can compare between two groups of classes or superclasses and . Continuing with the example of Equation (6), the first column (binary learner) divides the classes into two superclasses: the first one comprises the class and left the rest in the second, . Another example could be the second binary learner that groups and in the first superclass, , and and in the second, .
A series of changes that do not affect the codification can be deduced from the aforementioned description of : permutations of columns, sign change in the whole column, and whole columns of −1 or +1 can be discarded. Therefore, the maximum length to encode K classes is . For example, in the case of Equation (6), with K = 4 classes, .
Selecting the adequate binary learners and their number
c for a specific problem is challenging. As evaluated with several datasets in reference [
46] and given that our dataset has
classes, the proposed approach was to use function ‘designecoc’ (Statistics and Machine Learning Toolbox of MATLAB [
50]). This function assigns positive or negative elements with equal probability for each element in
M and uses a random generator to obtain the encoding, so the size of
c is a random variable. However, its mean can be estimated by
, which in our case, means
. Applying this codification to the training label matrix
with dimensions
will result in matrix
with dimensions
containing the encoding for each gesture, see
Figure 1.
3.4. Partial Least Squares Regression
Partial least squares regression (PLS) is a statistical tool that is very extended at the moment. It was introduced by Wold [
57] in the 1970s and was successively developed [
58,
59]. This tool was used to relate
with
, see
Figure 1.
PLS sequentially builds pairwise lineal combinations of variables, one from
X and one from
Y, defined by the
r and
q vectors, respectively, that solve
where
var and
corr stand for variance and correlation, respectively, of the new variables
and
that are named latent variables of PLS model.
Maximization of the product tends to look for directions of large variance in both X- and Y-spaces (with more information), avoiding those of small variance (probably noise). In addition, the criterion includes the term that helps in avoiding directions in the signal space with small correlation with the class codification.
PLS is particularly useful when the variables
and/or
are very correlated or are colinear. In our case,
, the sEMG signals, present both characteristics: They are not independent, and they do not define 4860 dimensions, and neither do
, the gesture codes, define approximately 30 dimensions. PLS is very efficient in finding the subjacent structure in the data by using a reduced number of latent variables,
nvl. These latent variables define a subspace of
X of
nvl dimensions that explains the variability in the object codes,
, that, in our problem, is the variability between gesture classes. The value of
nvl is adjusted between one and
K to obtain the best response using the method described in
Section 3.6.
This step of procedure returns a linear regression model described by
coefficients along with the PLS-box [
60], which is a closed region in the space of the sEMG signals. The complement set to the PLS-box identifies signals to which the model cannot be applied because they are significantly different from the training matrix. PLS-box is defined by two critical values fixed in this work to a confidence level of 0.95. As all the responses are fitted together, PLS provides a common PLS-box for the c binary learners.
The result of applying the model to sEMG signals (
or
will return, respectively, the predicted code (
and
, respectively), see
Figure 1. For this task, the function ‘pls’ of PLSToolbox [
56] has been used.
3.5. Decoding, Class Assignation
Based on the encoding section,
Section 3.3, for each binary learner,
and its two superclasses
y
, there are two sets of predicted values,
and
, that should be close to −1 and 1, respectively. The distribution of these predicted values is calculated using the univariate kernel density [
61]. Fixing the probabilities of
and
(that can be different for each
), the distributions previously fitted are used to compute critical values
and
and with the conditions established in Equation (8).
where
P stands for probability. Notice that the definitions in Equation (8) imply that
would be a large value close to one, whereas
would be close to zero. In this application,
and
for all
have been fixed.
For each EMG signal in the PLS-box, if
, then the
i-th coordinate on the decoding vector will be −1, and if
, the coordinate will be +1. For each binary learner, the objects whose predicted values are between the corresponding critical values present two possibilities: (i) if
, the signal will not be assigned, neither +1 nor −1, and (ii) when
, the signal is assigned to both +1 and −1 (intersection). Finally, the signal is inside the
i-th class model if the codeword of the
i-th class in
M is one of the decoding vectors related to it. To summarize, the sEMG signal could be assigned to none, one, or more classes or gestures. In our example, see
Figure 1, the purpose is to obtain the
and
label matrix from the
and
predicted codes. However, based on the premise that any sample measured can only belong to one class, because it is not possible to perform two gestures at the same time, it is possible to obtain not valid results and
errors when one sample belongs to none, two, or more classes. For this reason, predicted labels
and
will have one more possible class (
K + 1) than the original (
K) classes in label matrix
.
3.6. K-Class Model Evaluation
Evaluation of a K-class model implies studying
values of its corresponding sensitivity
matrix. Any given problem with more than
makes it practically impossible to work with. In our case, it would be 64 values of sensitivity and specificity. Several metrics have been proposed to address this problem [
62,
63]. These metrics, in most of the cases, are obtained from the sensitivity of every individual class model, pair-wise specificities, efficiency or the total sensitivity, total specificity, and total efficiency of all class models, including convex combination of individual sensitivities and specificities. In particular, the mean of both is named accuracy in reference [
48], but in [
35], accuracy is the proportion of true assignations (positives or negatives). In general, these indexes are less sensible to changes in
matrix. For this reason, they are not well suited for a systematic comparison of class models, for example, in an optimization.
One alternative is to apply entropy concept as a measure of the order/information within the states of a system. A K-class model could be seen as a system whose states are the classes, and the information is provided by the sensitivities and specificities for each class model (K models in total). One K-class model will be better if it has less entropy according to Shannon’s entropy definition. In other words, a better class model will provide more information and better sensitivities and specificities if it successfully assigns sEMG signals to the model of each class and rejects the ones that do not belong to it, thus reducing the uncertainty or entropy of the system. In Shannon’s notation, followed in this paper, the entropy value will be 0 if all elements of are ones, and it will be perfectly precise, leaving no room for uncertainty.
The development of this idea for confusion matrix can be found in references [
64,
65]. The first one proposes, for the first time, a measure of the order/information generated by a classification method, called confusion entropy (CEN), inspired by Shannon’s entropy. The second solves a deficiency of CEN by proposing modified confusion entropy (MCEN).
MCEN was evaluated and generalized in [
46], defining a new index, diagonal modified confusion entropy (DMCEN), for sensitivity and specificity to evaluate K-class models. It also introduces one modification to solve MCEN’s almost unresponsiveness to differences in sensitivity by explicitly accounting for the contribution of sensitivity against specificity in the parameter
w. This parameter can take values from zero to one; in our work, has was chosen
w = 0.5.
A detailed description of DMCEN is out of the scope of this paper. Qualitatively, the idea is that for the computation of Shannon’s entropy of a class, is necessary to define the probability that the system is in class in relation to another class , for this it is considered as reference for all the decisions that involve both classes. In other words, to evaluate one K-class model, is necessary to take into account its whole matrix.
In this work, DMCEN was calculated using an ad-hoc MATLAB code, available in reference [
66], that calculates global DMCEN and for each class given an
S matrix. DMCEN can take values from zero to one, and the lower DMCEN, the better the K-class model is.
3.7. PLS-ECOC Model Optimization
ECOC matrix,
M, has a random origin, as explained in
Section 3.3, and is not related to
, but with
M, the response
is built. Therefore, the PLS model that relates
and
depends on
M. To select the best
M matrix, the steps from
Section 3.3 to
Section 3.6 were repeated 280 times, aiming to obtain the best
S matrix. The PLS model associated with it is called
and is the one that will be used in
Section 3.8 for the evaluation with the test subset,
. This process is illustrated in
Figure 1 as the left grey rectangle.
3.8. Model Validation
To validate the model, the calculated label matrix
, DMCEN and
was obtained using the model
and test data
as its input. Another interesting metric is the use of
, extra class, the one assigned to errors to obtain the overall
error and
failure rate of the system. Error rate in a system is defined as a known misclassification per total signals predicted, and that would be the sEMG labelled as
error in
.
Failure rate is the wrongly labelled sEMG signals in
compared to
minus the number of errors over the total of signals predicted. This process is illustrated in
Figure 1 as the right grey rectangle.
4. Results
PLS stands out when it comes to model data that have high collinearity because it uses latent variables. To evaluate the collinearity of the data, principal component analysis (PCA) was carried out with and of . The result of this analysis shows that 4860 dimensions of can be represented with 5 to 8 components, explaining 88.2% to 93.3% of the variance, respectively. Similar results were obtained when analyzing , where the number of principal components is 7, much smaller than the original dimension, 35, and explaining all the variance. In addition, in this case, 15.2% of the pairwise correlation coefficients between columns are, in absolute value, greater than 0.5. These results, specific to our problem, indicates the need to use a regression on latent variables, such as PLS.
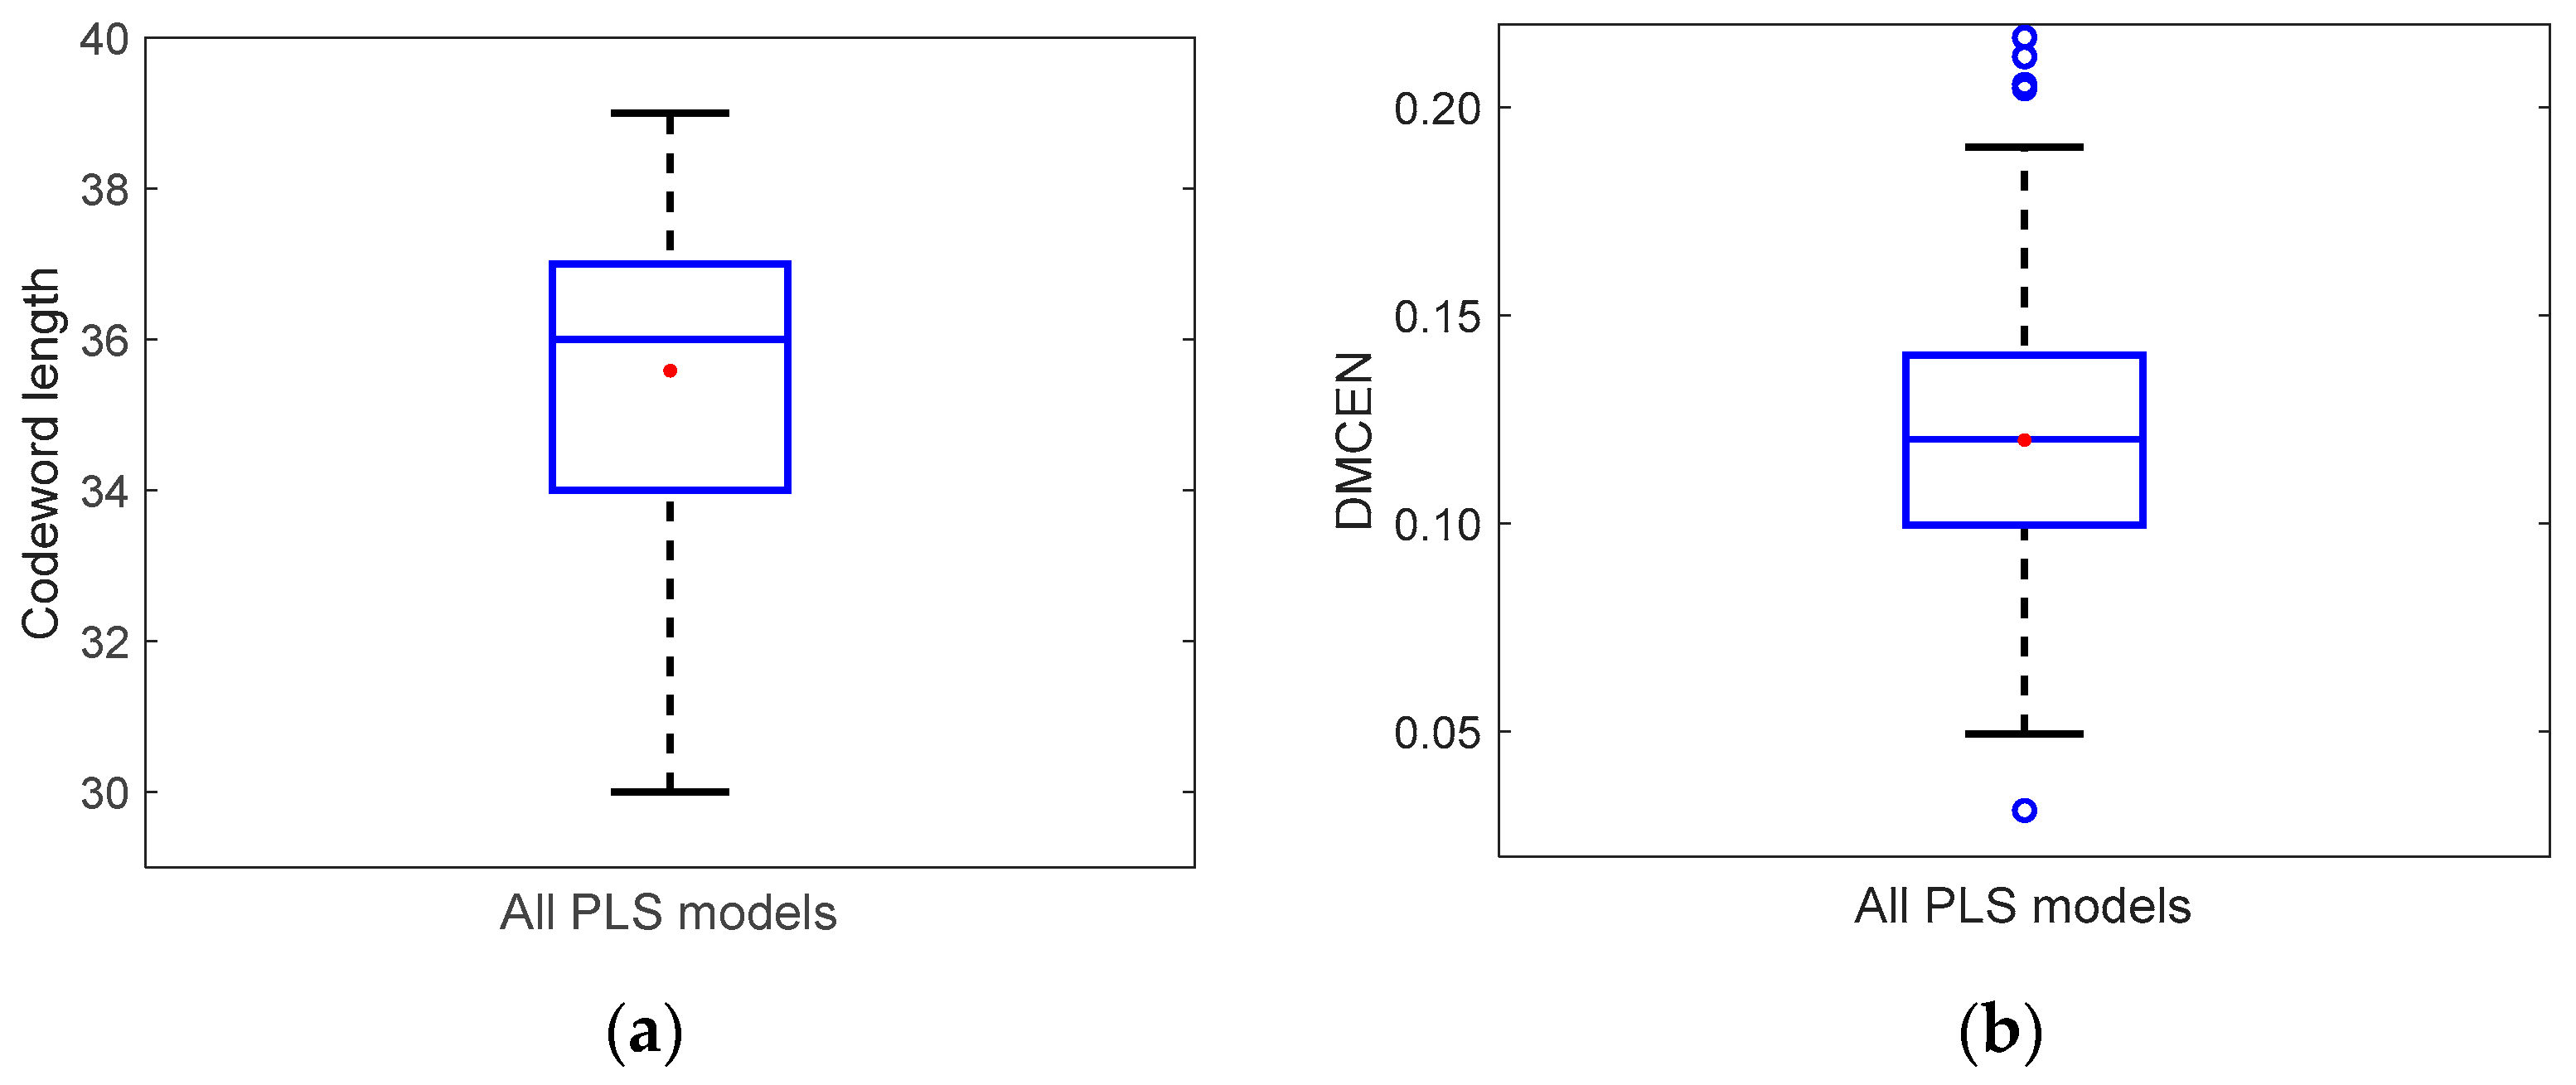
Optimization of the PLS model,
Section 3.8, generates 280 ECOC matrices; therefore, 280 matrices
result in 280 PLS models. Each of these iterations may have a different
c, codeword length, of the ECOC matrix and a different DMCEN index. The optimization looks to minimize the DMCEN index in the training subset,
, obtaining a
optimum model with seven latent variables. DMCEN
, and codeword length
. All codeword lengths and DMCEN values obtained are depicted in
Figure 4. Codeword length varies from 30 to 39, greater than the expected 30 (
Section 3.3), with a median value of 36. DMCEN varies from 0.031 to 0.217 with a median and mean value of 0.12 with a very symmetric distribution.
Sensitivity and specificity in the training matrix
are shown in
Table 1. The meaning of this matrix was thoroughly discussed at the beginning of
Section 2. There are two elements in
Table 1 that differ from one (the best possible result); both cases will be commented. First, the element marked with (*), 0.86, means that one
sample was wrongly assigned to the
class, so the
class model is not completely specific against
. Second, the element marked with (**), 0.71, means that two
samples were assigned to
, so the
class model is not completely specific against
. From this analysis, we can say that the
and
class models are unable to fully reject signals from
and
, respectively.
Applying the
model to the test matrix
, the sensitivity and specificity matrix
is obtained,
Table 2, and DMCEN associated with
is 0.209. Again, we are going to comment on the three elements of
that differ from the one in
Table 2. First, the element marked with (*), 0.67, means that one out of the three signals from the
class was wrongly rejected from the
class model. Therefore, the class
model sensitivity lowered to 0.67. The
class model also wrongly accepted two signals belonging to
, thus reducing its specificity against
to 0.33, marked as (**). Lastly, the element marked as (***), 0.33, means that the
class model failed to reject two signals from the
class, so its specificity against
reduced to 0.33. From these results, we can say the
class model is having problems to model the
signals like its own and is failing to completely reject all signals from
. The
class model is presenting the same flaw as in the training set wrongly assigning
signals to itself.
To understand the benefits of modelling sEMG signals as an alternative to usual classifiers, the assignation matrix,
Table 3, of the test dataset
is shown. This matrix was obtained by applying the
model and decoding it. Each row of the matrix represents one sEMG signal from
and is composed of a vector of zeros and ones indicating the class assignment made by the model. Each signal sEMG belonging to test dataset (
) is a row of
Table 3, and each 1 means that the class model, the column, accepted the signal.
In this analysis, an error is defined as a signal that belongs to a number of gestures different from one, a failure is defined as a signal that is assigned solely to the wrong class, and a success is defined as a signal that is correctly assigned to its class.
For example, Row 7 of
Table 3 shows an sEMG signal from the
gesture class that was not assigned to any class, resulting in an
error and reducing the sensitivity of the
class model, as indicated by the (*) label in
Table 2Rows 17 and 18 show two signals from the
class that have been assigned to two classes, the correct one (
) and an incorrect one (
). This results in two
errors, but the
class model sensitivity is not affected. However, incorrect assignment of the signals to
reduces the specificity of the
class model against the
class, as indicated by the (***) label in
Table 2.
Similarly, rows 23 and 24 show two signals that are correctly assigned to the class but are also incorrectly assigned to the class, which reduces the specificity of the class model against the class and adding two errors to the overall results.
To sum up, the assignation matrix,
Table 3, shows that there were 5
errors where a signal was assigned to a number of gestures different than one, 19 successes where a signal was correctly assigned to its class, and 0
failures. It also highlights the origin of the changes in specificity and sensitivity in the
S matrix,
Table 2.
5. Discussion
Differences between a classifier and a class-modelling classifier such as PLS-ECOC were stated in the Introduction and State-of-the-Art Approaches Sections. To summarize, the main difference is that a class-modelling classifier can assign one gesture to none or more than one class. This feature combined with the PLS-box was used in this work to implement a fault-tolerant classifier that can detect errors, increasing the robustness of the whole system. This feature could not be achieved with previous classifiers used in sEMG GR applications.
To fully evaluate the extra information provided by a class-modelling classifier, the DMCEN [
46] metric was used as described in
Section 3.6. The usual metrics (accuracy, precision, or F1 score) will fall short because they assume that each object can belong to only one class. However, for the sake of comparison with other classifiers in the sEMG GR field, it seems reasonable to express the results also in the usual metric format: accuracy, precision, and F1 score. To this purpose, the
errors (gestures assigned to none or two or more classes) were assigned to their most probable class. Note that with this transformation, the class-modelling algorithm loses its fault-tolerant capability.
Considered PLS-ECOC as a classification method, the confusion matrix in training NTR = (nij), is diagonal, with nii = 7 and nij = 0 if i ≠ j. Therefore, accuracy, precision, and F1 are all equal to 100%.
In prediction, with the test set, the confusion matrix is shown in
Table 4. The accuracy, precision, and F1 values are 87.5, 91.87, and 86.34%, respectively. They have been calculated in accordance with ref. [
63] to maintain consistency with the definitions of sensitivity and specificity given in the introduction of
Section 3.
However, in the field of sEMGs, there is no agreement on the definition of accuracy, and this ambiguity makes it difficult to compare results.
Section 3.5 of ref. [
33] is devoted to this question. The authors find that one work of the 56 studied defines “the recognition accuracy” (a gesture is considered a true positive, i.e., the gesture is recognized correctly when the model determines what gesture was performed and when this gesture was performed by a person). Eleven other papers use the concept of “classification accuracy” because they only took into consideration what gesture was performed by a person as a true positive, and the remaining papers do not show what they consider a true positive. This ambiguity is transferred to the calculation of accuracy. In our case, both definitions coincide with each other and with our calculation because the rest position (no gesture, in other papers) has been considered as a class in the model.
Other definitions of accuracy used in the analysis of sEMG signals are the ratio of correctly predicted gestures (true positives plus true negatives) to the total gestures [
67,
68], obtaining 98.44% with our data. In [
33], accuracy is also defined as the arithmetic mean of sensitivity and specificity, which, in our case, would be 87.5%.
In any case, the accuracy of PLS-ECOC transformed into a classifier is in the range of values found in the literature described in
Section 2. Specifically, using the means and standard deviations obtained from the accuracies reported in references [
14,
33,
34,
35] and assuming that the data come from a normal distribution, the tolerance limits state that we can be 95.0% confident that 99.0% of the distribution lies above 73.62, 52.76, 63.40, and 71.92%, respectively. The value obtained, 87.5%, with PLS-ECOC transformed into a classifier is inside all four tolerance intervals.
Another important aspect of the proposed class-model is that it does not require human intervention in adjusting it. Most approaches in the sEMG GR field require the selection of features to make the classifier work or to adjust the parameters of the classifier. By contrast, the proposed method is totally automated, simultaneously adjusting feature extraction, dimensionality reduction in the nvl latent variables, and classification performance using the DMCEN index. It only needs a labelled dataset to work with. This approach should provide better flexibility, reducing design time. Another advantage from the designer’s point of view is the information that the PLS-ECOC provides; the sensitivity and specificity matrix S can give important insights on which gestures are being confused, providing a useful debug tool to fix or improve the overall system design. For example, it can highlight which electrodes should be placed differently or that some gestures cannot be used as commands for the system.
The last part of this discussion will focus on the applicability of the presented method for a wearable, real-time application. Three metrics are evaluated: the size of the model, latency, and scalability. The size of the model is extremely important for wearable devices, as it directly impacts performance and limits usability. Any lineal model has a parameter size of where nvc is the number of voltage values recorded, nc is the number of channels, and c is the codeword length. The computation required is also proportional to the size of the model because obtaining the classification value will require one multiplication and one addition per parameter. This size is comparable with the SVM algorithm. Translated into memory parameters, it will occupy 664 kB, a size that could not be fitted into the ram memory of a low-power MCU. However, the current implementation uses a 3 s gesture as an input. So, the size will fold by 30 in a real case scenario where windowing of the order of the hundredth of milliseconds is used. Latency, another key parameter, is composed of the time to acquire one gesture to be evaluated (3 s) and the time to process it. Being a linear model, the processing time in an MCU will be low because it is only composed of a multiplication and an addition per parameter. The last parameter is scalability. PLS-ECOC codification makes the size of the model increase logarithmically () compared to SVM usual encoding, one vs. one, which increases quadratically (), being, in both cases, K, the number of classes, providing a good base for more complex HMI systems that will require a large number of gestures to be functional. All these characteristics should be tested by implementing PLS-ECOC in a real embedded device and evaluating its performance.
Another hint that there is room for improvement in the reduction of the codeword,
c, length is the fact that the observed correlation in
Figure 4 is 0.2 between DMCEN and
c. This result implies that a larger codeword (and model) does not translate into better overall classification characteristics of the model.
6. Conclusions
The proposed PLS-ECOC model for gesture recognition using sEMG signals can provide a failure-free result in the prediction phase. While keeping comparable results in accuracy, precision, and F1 of 87.5, 91.87 y 86.34%, respectively, to the current state-of-the-art classifiers. This highlights the effectiveness of the proposed method as a fault-tolerant classification system. To the best knowledge of the authors, this type of fault-tolerant design has not been studied before, and it opens up new possibilities for developing classification applications in critical systems where safety is a key requirement, such as controlling a robotic arm.
The proposed method also offers great flexibility for designers because it does not require any exploratory analysis to obtain features, which can be time-consuming and will be specific to each dataset. The PLS-ECOC method simultaneously adjusts feature extraction, dimensionality reduction in the nvl latent variables, and classification performance using the DMCEN index. Dimensionality reduction performed simultaneously with the adjustment of the model provides a great base for future developments. It is more robust and adapts better to differences between subjects, electrode placement, or acquisition systems. However, this paper was only evaluated on one subject, and further studies with more subjects, electrode positions, and acquisition systems should be carried out. The sensitivity and specificity matrix S provides a powerful tool for system designers to better understand where gestures are confused and to make decisions to improve the design.
DMCEN is as simple as the accuracy metric used in discriminant classifiers. However, it extends its validity to class modelling classifiers, proving its utility for optimizing the PLS model.
The PLS-ECOC lineal model provides good characteristics for further development because of its computational simplicity. However, in its current state, it is too big to fit in a low-power MCU that could be used in a wearable design. To address this issue, a couple of future work lines are proposed: reduction of the codeword length by reducing the ECOC output matrix and windowing the sEMG signals, which would be a required step to implement the method in a real-time application.
Another improvement that should be taken into account is to use DMCEN optimization for the other two criteria (minimizing errors and minimizing the length of the codeword) either through a desirability function that introduces “a priori” weight to the criteria [
69] or by applying a multicriteria optimization and using the Pareto front of the optimal solutions to obtain the optimal solution “a posteriori” [
70]. As the relationship between the three criteria and the experimental data is not described by any deterministic function, a heuristic method, such as a genetic algorithm [
71], could be used in the optimization process.


