Article

IRONEDGE: Stream Processing Architecture for Edge Applications

by
João Pedro Vitorino
1,*,†,
José Simão
1,2,3,*,†,
Nuno Datia
1,2,4,† and
Matilde Pato
1,2,5,†
1
Lisbon School of Engineering (ISEL), Polytechnic Institute of Lisbon (IPL), 1959-007 Lisboa, Portugal
2
Future Internet Technologies (FIT), Lisbon School of Engineering (ISEL), 1959-007 Lisboa, Portugal
3
INESC-ID, 1000-029 Lisboa, Portugal
4
NOVA LINCS, NOVA School of Science and Technology, 2829-516 Caparica, Portugal
5
LASIGE, Faculty of Sciences of the University of Lisbon (FCUL), University of Lisbon, 1749-016 Lisboa, Portugal
*
Authors to whom correspondence should be addressed.
These authors contributed equally to this work.
Algorithms 2023, 16(2), 123; https://doi.org/10.3390/a16020123
Submission received: 22 December 2022 / Revised: 8 February 2023 / Accepted: 14 February 2023 / Published: 17 February 2023

Abstract

:
This paper presents IRONEDGE, an architectural framework that can be used in different edge Stream Processing solutions for “Smart Infrastructure” scenarios, on a case-by-case basis. The architectural framework identifies the common components that any such solution should implement and a generic processing pipeline. In particular, the framework is considered in the context of a study case regarding Internet of Things (IoT) devices to be attached to rolling stock in a railway. A lack of computation and storage resources available in edge devices and infrequent network connectivity are not often seen in the existing literature, but were considered in this paper. Two distinct implementations of IRONEDGE were considered and tested. One, identified as Apache Kafka with Kafka Connect (K0-WC), uses Kafka Connect to pass messages from MQ Telemetry Transport (MQTT) to Apache Kafka. The second scenario, identified as Apache Kafka with No Kafka Connect (K1-NC), allows Apache Storm to consume messages directly. When the data rate increased, K0-WC showed low throughput resulting from high losses, whereas K1-NC displayed an increase in throughput, but did not match the input rate for the Data Reports. The results showed that the framework can be used for defining new solutions for edge Stream Processing scenarios and identified a reference implementation for the considered study case. In future work, the authors propose to extend the evaluation of the architectural variation of K1-NC.

1. Introduction

Currently, there is a growing ecosystem of solutions described as being “smart” in a wide array of distinct domains [1]. These solutions, ranging from “Smart Agriculture” and “Smart Industry” to “Smart Cities” and “Smart Infrastructure”, all share a common context and approach. Technology has enabled the creation of digitally connected environments at a lower cost during the Fourth Industrial Revolution (Industry 4.0 [2]), resulting in rapid technological advancements. Using Internet of Things (IoT) devices to sensorize environments and collect data on the status of assets, a common approach focuses on monitoring critical assets. This collection of data, sometimes in large volumes, can be referred to as Streams of Data. Consequently, organizations need to process them in time to support critical decisions [3].
Under the umbrella of “Smart solutions”, an area of particular concern is that of “Smart Infrastructure” [4,5]. “Smart Infrastructure” can at times overlap with “Smart Cities” when applied as a concept in urban areas, with some authors considering “Smart Cities” as a sub-type of “Smart Infrastructure” [5], but more broadly covering all types of basic public and private infrastructure, such as: (i) water distribution infrastructure, (ii) electricity distribution infrastructure, (iii) transportation infrastructure, and (iv) telecommunication infrastructure.
In the given domains, it is easy to identify areas that are of critical importance, requiring outstanding planning and close monitoring on a continuous basis. Let us consider the example of a transportation infrastructure, the railway, as it is representative of several restrictions (such as limited resources and unreliable networking) imposed on the monitoring IoT solution [6]. Railways face a number of safety threats, including rockfalls on rocky slopes and other materials falling onto the rail, flat wheels, and mechanical failures. A number of IoT sensors can be attached to rolling stock to capture quality data in real-time. Detecting conditions and Events that need attention must be performed quickly. Centralized processing is limited by connectivity restrictions, the large volume of data generated by monitoring systems, as well as the latency restrictions. Thus, the data processing should take place close to the collection of data, at the edge, in order to reduce the latency of the responses [7]. According to [8], one way to tackle this research challenge is to define a layer of edge computing [9], where a subset of data may be better handled by Stream Processing. In spite of some proposals in the literature regarding architectures for edge processing, e.g., [10], many do not take connectivity restrictions into account, nor do they consider the space and computation constraints imposed by edge solutions in many domains. Furthermore, there is a lack of literature on real-time processing of IoT stream data with high demands on throughput and latency.
In the described context, the authors considered the need to define an architecture representative of a typical Stream Processing solution at the edge, with this architecture used as an evaluation basis in a test environment with limited computational and storage resources. The proposed architecture is expanded as a reusable framework, where the components represent common functionalities in edge Stream Processing solutions. Each component, and the relationships between components, is then specified according to the requirements of each case under consideration. This architectural framework is referred to in the paper as IRONEDGE. Taking railway infrastructure sensing as a guiding thread, the study was designed to be closer to real-world applications. This resulted in the specification of the IRONEDGE framework. The proposed case study does not fit within the constraints of the existing literature. This is because the equipment to be added to the rolling stock has limitations in terms of size and energy use and, as such, limitations to computation and storage. Additionally, it is not possible to guarantee a stable network connection during an entire voyage.
Summarizing, the paper focused on the following research questions:
Q1:
“What are the common components/functions that an edge Stream Processing framework should have to be reusable?”
Q2:
“What should be the considered implementation for the referenced case study?”
Q3:
“What is the processing upper limit for the chosen implementation, while minimizing global loss of messages from IoT devices?”
The rest of this paper is organized as follows:
  • Section 2 discusses existing research work and provides the background on the considered technologies;
  • Section 3 presents the proposed architectural approach and technological alternatives;
  • Section 4 describes the testing environment and methodology;
  • Section 5 presents and discusses the obtained results, as well as points out future work directions.

2. Background and Related Work

Considering the context for the IRONEDGE framework, this section provides background information and related work, on the development of Stream Processing solutions at the edge, for “Smart Infrastructure” use cases.

2.1. IoT and Edge Computing for “Smart Infrastructure”

Expanding on the previously given definition, “Smart Infrastructure” covers a wide array of domains that, in some way, support both the daily lives of individuals in particular and the economy in general. Considering specific domain areas in “Smart Infrastructure”, we can consider:
(1)
Water distribution infrastructure (“Smart Water”);
(2)
Electricity distribution infrastructure (“Smart Energy”);
(3)
Transportation infrastructure (“Smart Transportation”);
(4)
Telecommunication infrastructure (“Smart Communications”).
In all domains, there is a common approach to resource management, where resources are continuously monitored. Continuous monitoring, or more accurately, the flow of data created by continuous monitoring, allows organizations to react appropriately to changes in the state of managed resources. This is true whether they occur quickly or slowly.
The creation of data flows describing the state of resources is typically enabled by Internet of Things (IoT) devices integrated into the resources, or positioned close to them. These kinds of devices generally have limited computational, storage, and energy resources. Their limitations force them to delegate the task of handling the data they themselves produce to other components that receive the collected data. While a single sensor in a single device may produce small volumes of data, the aggregation of many sensors in all devices required for “Smart Infrastructure” quickly grows to very significant levels.
When considering approaches to handle large volumes of data continuously produced by IoT devices, a simple, yet reasonable approach is to simply divide the data into smaller subsets that can be easily processed more closely to their source, by some processing nodes [8,11,12]. The method is more efficient than transferring all data to a centralized location, but it may have high latencies and may be challenging to scale, as the number of IoT devices increases [9]. Depending on how close to the sources of data these nodes are located, these approaches are refereed to as edge computing, for a higher level of aggregation, or fog computing [13], in contrast to cloud computing, for a lower level of aggregation.
Even when considering the advantages of this approach, a centralized processing step may still be required, for example for monitoring the resource’s status, detecting Events at the edges of the zones of responsibility of multiple nodes, distributing alerts, or simply persisting processed data redundantly. For this set of needs, data may be filtered, reducing the data transfer costs, and enriched with the local context available only to each node. In summary, a three-layer architecture, similar to the one shown in Figure 1, is common in edge-computing-based solutions [11].
In the context of “Smart solutions”, collecting data from IoT devices, there is, naturally, an unbounded stream of data continuously arriving at each node. The rate at which data arrive to the nodes differs between devices and usage cases, and it is not necessarily known when its is triggered by Events in the monitored resources. As a result, solutions based on Asynchronous Messaging Middleware (AMM) and Stream Processing are commonly employed for transferring and processing data as part of the three-layer architecture depicted in Figure 1.

2.2. Stream Processing

The term Stream Processing refers to a distributed computing paradigm that supports the gathering, processing, and analysis of high-volume, heterogeneous, continuous data streams to extract insights and actionable results in real-time [14]. The paradigm is well suited to data that are received at some rate in an unbounded fashion, with no set start or end, requiring extraction of knowledge as the data arrive. This exists within the world of Big Data, as a response to processing challenges of earlier batch-based paradigms, such as MapReduce [15], which are unable to handle this on their own. A number of Stream Processing systems have been proposed and developed, both in industrial contexts and academic research, such as Apache Storm [16,17], Apache Flink [18], Apache Spark [19], and Kafka Streams [20].

2.3. Asynchronous Messaging Middleware

The term Asynchronous Messaging Middleware (AMM) is here used to describe a set of closely related technologies that share the characteristic of handling the delivery of some data element, a message, in an asynchronous fashion. These include solutions more typically described as messages queues (e.g., RabbitMQ [21]), as Publish/Subscribe solutions (e.g., Apache Pulsar [22]), and as Event stream platforms (Apache Kafka [23,24,25,26]), albeit that these categories overlap depending on the details of each solution.
Besides supporting Stream Processing solutions, the usage of an AMM also allows communication between other components in the system. These components may also be the IoT devices themselves or be located in other processing nodes. This type of communication offers a number of advantages [27], such as:
(1)
Not all components need to be available at the same time. If a component is unavailable, it may consume the message at a later date;
(2)
They offer a queuing service to handle temporary bursts of messages or may drop messages above a set threshold;
(3)
Differing delivery guaranties, depending on the implementation details.
Of particular note is the fact that some AMMs, such as Apache Kafka, can be configured to provide persistent message storage, allowing for their easy integration as the persistence layer of a system. This is publishing a message to transmit it to other components, which is the same operation as storing the message for future consumption. If queries akin to those offered by actual databases are required, systems such as ksqlDB [28], for Apache Kafka, may be used. ksqlDB, in particular, offers an interface equivalent to the Structure Query Language (SQL).

2.4. Related Work

The combination of IoT devices and edge computing for “Smart Infrastructure” is already widely present in the literature. Reference [29] presented a case study addressing road accidents in India. To reduce the number of accidents, the authors proposed a model for detecting potholes by analyzing streams from security cameras present on roads. In addition, they proposed a set of sensors to monitor the behavior of vehicles. To support the large computational and storage requirements, the authors recommended that the data be divided among edge nodes responsible for the initial detection of abnormal Events. This would filter the data sent to the Cloud Layer. Reference [30] described the challenges related to managing energy in scenarios of collaborating microgrids and developed a system based on the NVIDIA Jetson Nano Developer Kit for defining edge nodes that collect and process data from a set of sensors at the premises of each participant in the micro-grid. After initial processing, the Data Points are aggregated in a Cloud Layer through MQ Telemetry Transport (MQTT) [31]. SLedge [32] is an edge Stream Processing architecture, centered on Apache Storm [17], optimized for disaster response scenarios. A model for efficiently distributing tasks over fog computing infrastructure, edge nodes, and mobile devices was provided. For an image recognition scenario, the authors concluded that an edge Stream Processing architecture can provide a reduction of more than five-times the Event processing latency, when compared to an equivalent architecture relying only on cloud-based processing.
An approach orchestrated over Kubernetes [33] was presented in [10], with a reference architecture for processing IoT device data in urban infrastructure monitoring scenarios. While not specific to edge processing use cases, the authors proposed it may be applied at any scale, whether at the Cloud Layer or even the fog layer. For this approach, the authors combined the usage of an MQTT broker, to consume data from IoT devices, with the usage of Apache Kafka as both an AMM and as the storage layer of the solution (by integrating the usage of ksqlDB) to be used by some Stream Processing solution. The authors further proposed the classification of work to be applied over IoT-collected data into two generalizable jobs: (i) A data enrichment job; (ii) An analytics job. For the proposed combination of the architecture and jobs, the authors performed scalability and reliability testing. The number of nodes was increased in order to increase the throughput. A second approach defined over both Kubernetes and Apache Kafka is that of CEFIoT [34], where a fault-tolerant architecture with four processing stages was presented. The four stages were divided into an edge and a Cloud Layer, each with multiple nodes, and work was coordinated between the stages for a surveillance camera study case.
In the existing literature, it is also possible to identify solutions that combine Apache Kafka with Apache Storm in IoT scenarios, such as [35,36]. Both papers presented solutions in the context of industrial manufacturing, where Apache Kafka and Apache Storm were combined to create a scalable Stream Processing pipeline, demonstrating the applicability of the technologies in processing data from IoT devices. They did not, however, approach their respective scenarios from a edge processing point of view. The performance analysis carried out in [36] is of particular interest, but the resources allocated to the set of servers were above what is expected of IRONEDGE in a single edge node deployment.
In terms of approaches that make more detailed considerations regarding limited resources and connectivity issues, one could consider [2,37]. In [37], the authors proposed a scheme for optimal topology formation in edge deployment scenarios, minimizing the delay between IoT nodes and the assigned edge node while efficiently distributing workloads among nodes; this scheme had, as a side effect, a reduction in energy usage. Such a scheme, however, assumes that the workloads may be distributed among a set of edge nodes, which may communicate among each other and whose placement may vary in order to achieve the optimal placement. In [2], the authors proposed an affordable edge processing solution for fast early warning. With the objective of reducing the cost associated with the edge devices, the authors made considerations to increase its efficiency and achieved a working solution for highly constrained resources. The authors also identified the optimal scenario for balancing CPU utilization and latency. Their study, however, did not extend to memory usage, nor did it try to identify upper processing limits, in terms of maximum messages per second, nor did it consider the need to gather the data in the cloud.
The above-cited papers considered solutions applicable to Stream Processing solutions at the edge for different use cases; however, they mostly did not consider both the restrictions imposed by limited resources in a single edge node and the need to support a scenario with interrupted connectivity to a central Cloud Layer. For the first two papers, no evaluation was made of the upper processing limits for the proposed edge architectures. There were no considerations regarding resource usage or network connectivity. For SLedge [32], the evaluation did not find the upper processing limits, but compared the processing latency for real use cases. In [10], the reliability and scalability of the proposed architecture were evaluated, but the evaluation considered at least four nodes to distribute the work. For CEFIoT [34], there was no evaluation on the processing limits for the architecture. References [35,36] may serve as a guiding thread in using Apache Kafka with Apache Storm, but do not qualify as a edge processing solution. For [37], the scheme was a valuable solution when planing and optimizing the placement of networks of IoT and edge nodes. However, the solution is not applicable to solutions where alternative placements are not a viable solution, that is uses cases where existing constraints limit the number, placement, and assignment of edge nodes. Due to this context, the testing was carried out considering a simulated network of at least 50 edge nodes, and not a single real edge node with limited resources. The authors in [2] came closer to what is intended for IRONEDGE, but did not fully access the processing limits that the proposed edge nodes possess and the infrequent connectivity. Additionally, it used a Stream Processing approach. Table 1 summarizes the discussed papers and presents if each topic was approached/included in the corresponding paper.
We propose that the upper processing limits, in terms of messages successfully processed, be evaluated for a scenario where a single node is available and where the architecture should consider intermittent network connectivity to the cloud, without the possibility of offloading the computation to other edge nodes. The evaluation used the proposed framework to support a real study case based on railway infrastructure sensing [6].

3. Proposed Architectural Framework

For Research Question Q1 and to develop an architecture that can be easily adapted to different use cases while remaining comparable, we developed a framework named IRONEDGE. Following the current design practices for distributed processing in “Smart Infrastructure” scenarios [8,11,12], we identified the need to split the work over a number of nodes in an Edge Layer. Thus, a number of common capabilities should be present in every node of the Edge Layer. This set of capabilities is combined to define the common data flow in the edge node and generically identified as:
(1)
The capability to collect data from Data Sources, the Data Collection;
(2)
The capability to execute processing over the collected data, the Stream Processing;
(3)
The capability to store some local state, the Local Storage;
(4)
The capability to replicate obtained results, an Event Output;
(5)
The previous capabilities are supported by an interconnecting layer allowing for message passing between components, an Asynchronous Messaging Middleware.
Consider Figure 2, which represents the logical architecture of the components offering the listed capabilities, for a single IRONEDGE node.
Under this framework, each IRONEDGE node is responsible for a variable number of Data Sources and will act as the first layer for the aggregation and processing of data, before transmissions to the second layer. This corresponds to the middle layer (the edge/fog nodes) in Figure 1. Each Data Source may be either some Internet of Things (IoT) device or some other element capable of interfacing with the chosen Data Collection implementation. In the IRONEDGE framework, a single message containing data from a single source is designated as a Data Report.
The capabilities offered by the Data Collection component are the first step in the flow of data, allowing for the collection of data from the corresponding Data Sources. The Data Reports are to be delivered to the Stream Processing component. This second component is the central component of any implementation of the framework and is responsible for the extraction of knowledge from the gathered Data Reports. The extracted knowledge resulting from a set of Data Reports is designated as an Event. A generic pipeline for processing Data Reports into Events is presented in Section 3.1.
An Event Output component implements the interface in some secondary layer, generally assumed to be a Cloud Layer. This Cloud Layer may offer long-term storage, further enrichment and processing by aggregating Events from multiple IRONEDGE nodes, as well as propagating alerts resulting from the Events. As such, the Event Output component collects the output Events resulting from the Stream Processing component and transmits the Events to the Cloud Layer. The definition and implementation of the Cloud Layer, or a similar layer, is outside the scope of this paper. The components identified so far require two additional capabilities. The distribution of data between components is supported by an AMM. In addition, Local Storage allows components, such as Stream Processing, to store local context and previous Data Reports/Events for later processing. While this framework is a higher level of the architecture of such a node, the set of identified capabilities is a unifying factor in this type of solution. Two detailed implementations of the framework are presented in Section 3.2.

3.1. Generic Pipeline for Stream Processing

The Stream Processing component represents any processing that will be applied to the received Data Reports, so as to acquire the corresponding Events. For different use cases where the IRONEDGE framework is applied, the implementation details of this component will differ in two dimensions: (i) The Stream Processing system chosen for the implementation in a given use case (e.g., Apache Storm, Apache Flink, among others); (ii) The nature of the steps that needed to produce Events for a given Data Source. In order to simplify the development of customized solutions under the IRONEDGE framework, a generic pipeline for any smart infrastructure use case is provided. This pipeline makes no assumptions about the implementation details of any component, but can be applied to any Stream Processing system. Additionally, the usage of a common model to define processing pipelines has, as a secondary advantage, minimizing the effect of different requirements in the use cases. This is when comparing the performance of different implementations of the IRONEDGE framework.
Consider the proposed pipeline, as presented in Figure 3, in the context of the high-level overview of the architecture. The set of steps included in the pipeline can be described as follows:
(1)
Input Stage—Read data from the Data Collection component, with no transformations applied. Messages should be tagged with the current timestamp;
(2)
Mapping Stage—Data Reports are parsed and mapped into a use-case-specific Data Model, a Data Point. Additional context may be fetched from the Local Storage;
(3)
Windowing Stage—Data Points are grouped by common characteristics in the use case (e.g., time intervals, geographic area);
(4)
Aggregation Stage—The created groupings are aggregated into a data aggregate;
(5)
Predictive Stage—Given a data aggregate, a use-case-specific predictive model is applied, which allows the detection and classification of Events. Additional parameters may be fetched or stored in the Local Storage;
(6)
Output Stage—The resulting Events are output into the Event Output component.

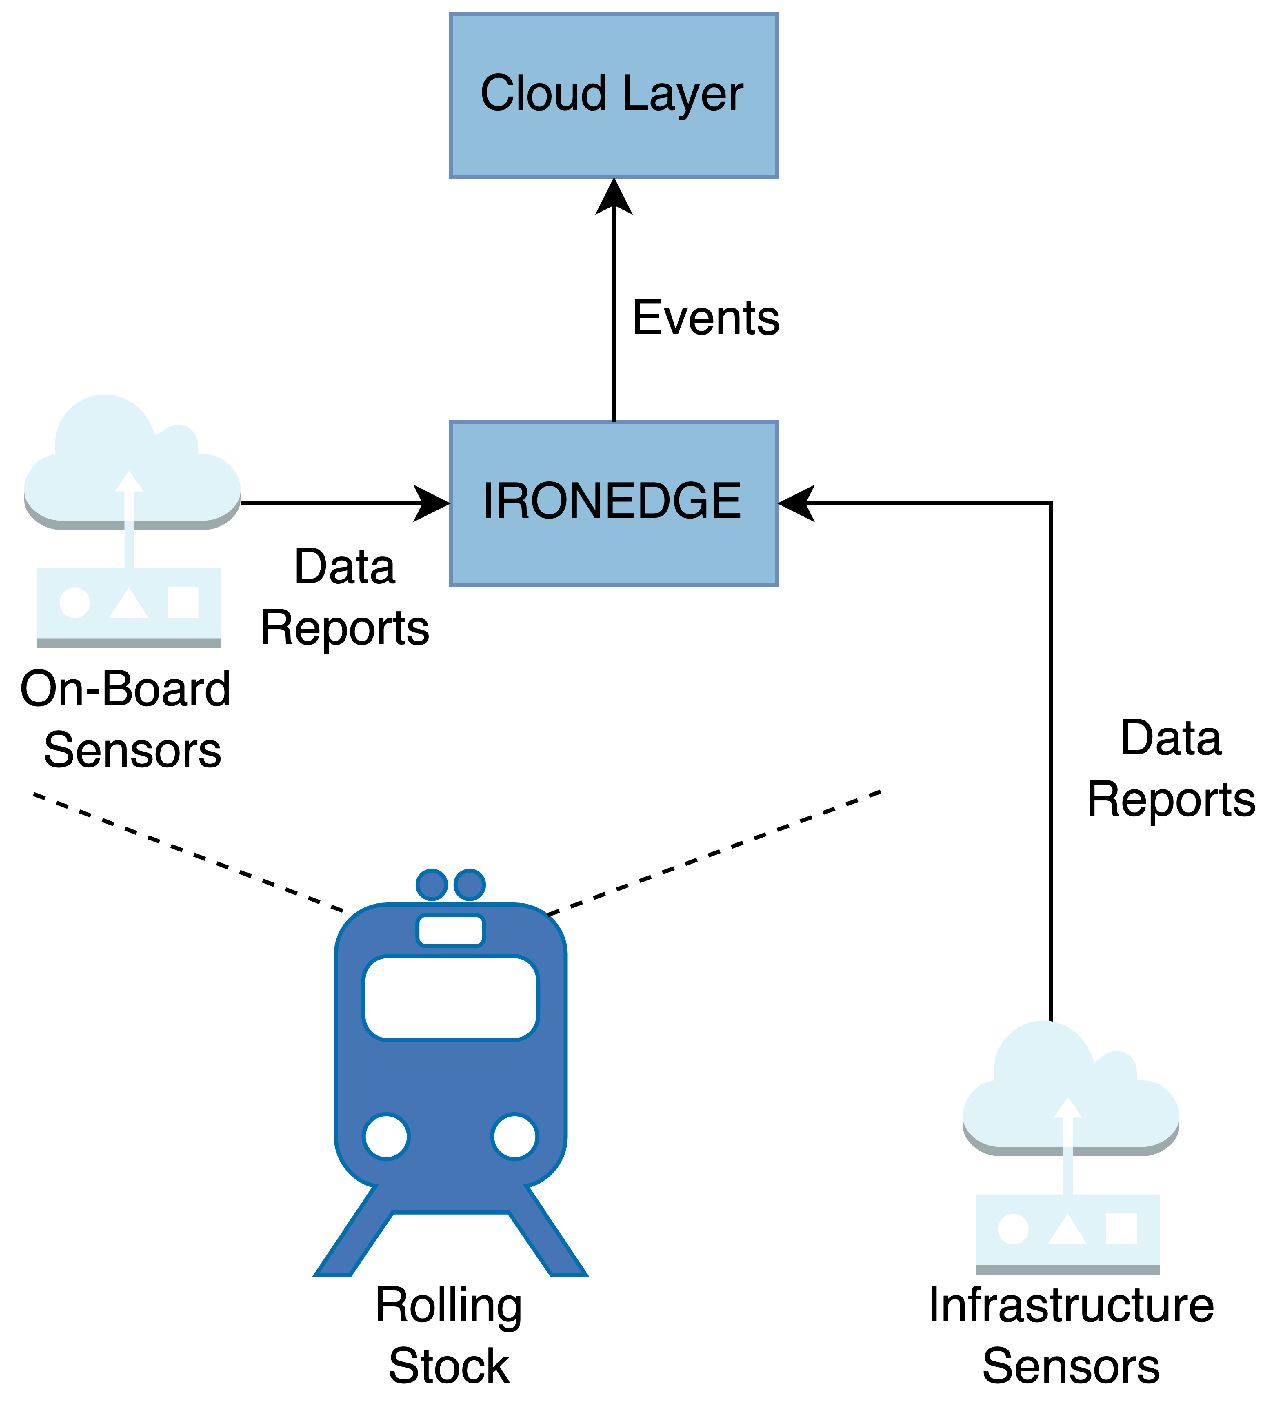
3.2. Case Study of the Ferrovia 4.0 Project

Starting from the previous framing for IRONEDGE as a reusable framework, a specific use case considered for the implementation and performance comparison is that of the Ferrovia 4.0 [6] project [6]. This implementation aimed to answer Research Question Q2.
The Ferrovia 4.0 project aims at building a new, smarter, and more sustainable generation of rail systems. When considering a railway, there are a number of safety threats that may affect it. These include the falling of stones and other materials onto the rail, slow movements of nearby slopes, and the development of mechanical failures over time. As a part of this objective, the project plans to enable a widespread monitoring system for railway infrastructures, covering both IoT devices on-board the train carriages and IoT devices positioned throughout the infrastructure of the railway system, as shown in Figure 4. As such, it can be considered an example of “Smart Infrastructure”. The exact set of sensors and distinct processing flows to be integrated may vary throughout the lifetime of the project. As a consequence, the proposed architecture should be able to support multiple heterogeneous Data Sources and multiple pipelines, where the volume of Data Reported for each pipeline may reach thousands per second. Similarly, the protocols to use in communication with both the devices and the Cloud Layer may vary through the lifetime of the project or even a single trip of the rolling stock. As an initial implementation case, the usage of LoRa-based IoT devices as the Data Sources was assumed, integrated with a co-located gateway, which will make the received messages available though MQ Telemetry Transport (MQTT). The wireless communication protocols used for connectivity with the Cloud Layer will depend on available coverage throughout the railway to create the communication link and will rely on a combination of 3G, 4G, 5G, and WiFi connectivity. As further explored in Section 3.2.2, the protocol used over this link is Apache Kafka, while the usage of MQTT is an efficient choice for supporting IoT devices.
Ferrovia 4.0 is a real-life use case that presents limitations not commonly considered in the literature. The IRONEDGE nodes are to be added to the rolling stock itself, and as such, they have:
(1)
Limited resources—There will be limited mounting space and energy supplied to the node. Care must be taken to minimize these aspects, resulting in predictably low computational and storage resources. Each edge node must be able to process all data collected from the set of IoT devices in the assigned rolling stock, or railway section. It is not that data from each sensor may not be offloaded to a different edge node then the one that was initially assigned;
(2)
Infrequent connectivity—The rolling stock will not have network connectivity over an entire voyage; in particular, there may only be connectivity close to each station or smaller sections of the voyage.
The first limitation is directly connected to Research Question Q3, to be analyzed in Section 5. Therefore, there is a need to reduce the number of components integrated into the implementation. The second limitation is that most of the internal data flow is independent of external connectivity issues. Only the Event Output requires connectivity for successfully completing the delivery of Events. If the Event Output implements some buffering mechanism, previously processed Events may be delivered as connectivity becomes available. They may also be discarded if the buffer is full, in order to reduce back-pressure on the Event Output. The following section describes the technological solutions that were chosen as implementations for the components presented in Section 3.

3.2.1. Apache Kafka for Messaging and Storage

The AMM interconnects the components of the architecture. The choice of this element presents an initial limitation in the choice of the following components, as they must support the chosen AMM as the internal interface. Additionally the AMM can become a bottleneck point, by limiting the volume at which data are distributed among components. Apache Kafka is an example of an AMM that fulfills this requirement. Apache Kafka offers a solution that has been proven to be scalable in handling large volumes of messages [38] in a fault-tolerant fashion and, as such, is a common choice for Stream Processing architectures [10,34]. As previously stated, Apache Kafka is a notable example of an AMM as it supports the long-lived persistence of messages contained in topics. With the objective of reducing the number of components, as a step to reduce resource usage, Apache Kafka was chosen also to serve the role of Local Storage.
The Kafka ecosystem offers a number of technological components for integration with external systems, in particular Kafka Connect [39] and Kafka Mirrormaker v2 [40]. Kafka Connect offers a framework for developing workers integrated with the Apache Kafka cluster. The workers may be used to collect and output data to external systems. Kafka Mirrormaker v2, in its second version, uses the capabilities provided by Kafka Connect to interconnect a local Apache Kafka cluster with one or more remote Apache Kafka clusters.

3.2.2. Distributing Data Reports and Events

Considering Apache Kafka as the AMM, an integration with its ecosystem offers a natural extension of its functionalities. Kafka Mirrormaker v2, in particular, can offer the capabilities expected from the Event Output component. In contrast with architectures where the nodes used in the Edge Layer are interconnected, as a single Apache Kafka cluster, with the nodes of the Cloud Layer, in the Ferrovia 4.0 project, it is assumed that there are extended periods of interrupted networking between layers. Additionally, only a subset of topics, those containing Events, will require distribution to the Cloud Layer.
Kafka Mirrormaker v2 operates by creating pairs of workers that subscribe to a configurable list of topics from the local cluster and publish them to the remote cluster. These pairs are connected by internal buffers. Together with the local persistence of topics, it allows for the composition of a push-like Event Output during periods of network connection.
The IoT devices considered in the use case require lightweight communication protocols, so using Apache Kafka as the Data Collection is not an acceptable option based on the amount of resources consumed by the IoT devices. Furthermore, the initial implementation case for the case study was a set of LoRa devices, which will have their messages exposed though a local MQ Telemetry Transport (MQTT) broker. As such, it was defined that the Data Collection be an MQTT broker, in common use among IoT-based solutions. This resulted in two possible architectures for the use case:
(1)
K0-WC (with Connect)—This architecture continues the path of using existing integrations from the Kafka ecosystem by using Kafka Connect to read Data Reports from the MQTT broker and inject them into Apache Kafka (see Figure 5a);
(2)
K1-NC (without Connect)—As shown in Figure 5b, the architecture forgoes the closer integration for a more lightweight approach, requiring that each topology in Apache Storm consumes Data Reports directly from the MQTT broker.
Figure 5. Implementation of the Ferrovia 4.0 architectures. (a) K0-WC uses Kafka Connect to integrate the MQTT source. (b) No Kafka Connect is used by K1-NC, instead consuming the MQTT source directly. Kubernetes implicitly uses Grafana [41] and Prometheus [42] for resource monitoring.
Algorithms 16 00123 g005

3.2.3. Apache Storm

Figure 5a,b also reflect the choice of the Stream Processing component, in this case being Apache Storm [17]. The combination of Apache Storm with Apache Kafka, for Stream Processing, has, as already noted, shown previous validation in the literature [35,36]. The implementations of the generic pipeline, discussed in Section 3.1, are presented for each architectural proposal. The Input Stage step was mapped into a Spout, while all others were mapped into Bolts.
The generic pipeline was implemented as described below. The processing steps depend on the Data Models, identified by source MQTT/Apache Kafka topic, which define the processing details in each Bolt. Section 4 gives details on a specific dataset and the configurations supplied as part of its Data Model. The mapping between steps and Bolts is:
(1)
Input Stage—While following the same sequence, K0-WC uses a KafkaSpout to access the Apache Kafka broker and K1-NC uses an MqttSpout to access the MQTT broker. For K1-NC, the read-time timestamp is inserted. For K0-WC, the write-time is obtained from the Apache Kafka topic;
(2)
Mapping Stage—A generic Bolt converts Data Reports into Data Points, associating the MQTT/Kafka topic with the Data Model;
(3)
Windowing and Aggregation Stages—These two stages are implemented as a single Bolt, aWindowedAggregator. The Data Points are grouped in a rolling window by time interval, using the injected timestamps. As a default value, a windowing value of 5 s was selected;
(4)
Predictive Stage—During the initial development phase of the project, with domain knowledge still being gathered, a more simple approach, the CUSUM [43,44] method, was selected, to detect changes in accelerator data. This corresponds to the implementation of a CusumBolt. Initially, Events are always transmitted, even when no change is detected, with the current state of the aggregation;
(5)
Output Stage—For both variations, a KafkaBolt is implemented to inject Events into Apache Kafka topics marked for distribution by Kafka Mirrormaker v2.
The initial behavior of the Predictive Stage is inherently inefficient and may be optimized through fine-tuning, for example with a threshold mechanism that only sends Data Reports above a certain variance threshold, as seen in [45]. This initial behavior is meant for gathering domain knowledge on the sensor set to be used and stress testing during initial development and is used to feed the required fine-tuning in further phases of the project. Additionally, another important consideration is that of outliers in collected Data Reports resulting from ambient noise and faults in the IoT devices. Initially, these considerations, while important, are considered out of scope for the initial phase of development, where the purposed architecture was evaluated for an upper maximum processing limit. Once a more significant body of domain knowledge on the set of sensors used has been collected, the Predictive Stage may be further fine-tuned to consider outliers.

3.2.4. Orchestrator and Resource Monitoring

While implementing the prototype, an additional concern is that of easily managing resource usage in a diverse technology stacks while combining different workloads and integrating monitoring. For this purpose, the use case was implemented over a Kubernetes [33] stack; in particular, Microk8s [46,47] was selected as a lightweight distribution of Kubernetes. Figure 5a,b do not depict the monitoring infrastructure. This capability is not discussed in the definition of the framework, as it is not a strict requirement of an edge Stream Processing system. It is, in any case, a requirement of any real computational system to be deployed in production. A common choice for monitoring resources in systems orchestrated with Kubernetes is a combination of Prometheus [42] and Grafana [41]. Microk8s, in particular, offers a plugin that adds these components without an additional configuration, to monitor resource usage by containers. Prometheus runs scraping jobs to build a time series database, while Grafana allows for the deployment of dashboards and the extraction of collected metrics. This infrastructure is used in the following sections to obtain usage metrics during testing.

4. Testing Methodology

The following section presents the testing methodology used for evaluating the proposed implementations in the context of the railway domain.

4.1. Dataset

As a part of the load testing process, it is necessary to obtain volumes and rates of input data similar to, and slightly higher than, those of the real sensors. In this context, an auxiliary software component, called the InputGenerator, was developed to be used as the Data Source, given an initially supplied dataset. The dataset may then be replayed at different input rates and different Data Collections as required. In order to approximate the expected usage of the nodes in the use case, the evaluation process used a dataset previously collected in the context of Ferrovia 4.0. An example of the dataset was made available by one of the project partners (Faculdade de Engenharia da Universidade do Porto, https://paginas.fe.up.pt/, accessed on 20 December 2022) and is composed of a set of measurements of seven accelerometers installed on-board a train carriage. The dataset was stored as a Comma Separated Values (CSV) file, where each line corresponds to a measurement for the seven accelerometers and the associated metadata and has a variable size. Each line was reproduced as it was stored, corresponding to an individual Data Report. Under these conditions, each Data Report had, on average, a size of 150 bytes with a minimum size of 137 bytes and a maximum size of 162 bytes. In the described dataset, there were only 8599 unique Data Reports values. As such, the dataset was repeated by the InputGenerator to obtain the required number of Data Reports. For each run of all test cases, a total of 100,000 Data Reports were written into the system.

4.2. Metrics

For the performance comparison among the use cases, the following metrics were considered.

4.2.1. Latency

Latency is defined as the time each message spends inside the IRONEDGE node. The latency of writing to the MQTT broker and to the remote Cloud Layer was not considered, as the study, in this development phase, was focused on the processing limitations of the architectural variations. This latency was measured as the difference between two timestamps: the Input Timestamp and the Output Timestamp. As already stated, the origin of the Input Timestamp has two possible mechanisms. Either it is directly supplied by the Spout in K1-NC or it is extracted from the Apache Kafka topic, corresponding to the CreateTime timestamp inserted by Kafka Connect, in K0-WC. The Output Timestamp is obtained after each test run from the Apache Kafka cluster used as the Cloud Layer. Once again, these timestamps are of the CreateTime type, corresponding to the moment each message is passed to the network by the producers in Kafka Mirrormaker v2.

4.2.2. Actual Throughput

Throughput is defined as the number of Events processed and successfully written into the Cloud Layer until an upper time limit, defined in Section 4.3. For the pipelines examined, each instance of a Data Report always results in one Event being sent to the Cloud Layer.

4.2.3. Loss Rates

Loss rates are defined as the percentage of Events that are never received by the Cloud Layer, for the upper time limit, defined in Section 4.3. For these pipelines, each instance of a Data Report always results in one Event being sent to the Cloud Layer.

4.2.4. Memory Utilization

Memory utilization is defined as the average percentage of memory utilized by all components integrated in Kubernetes, from the arrival of the first Data Report in the IRONEDGE node to the last Event received in the Cloud Layer. This value is collected by the monitoring infrastructure, as reported by Prometheus.

4.2.5. CPU Utilization

CPU utilization is defined as the average percentage of memory utilized by all components integrated in Kubernetes, from the arrival of the first Data Report in the IRONEDGE node to the last Event received in the Cloud Layer. This value is collected by the monitoring infrastructure, as reported by Prometheus.

4.2.6. Log Time

The log time is defined as a measurement of the “spreading” of Events delivered to the Cloud Layer, that is the time difference between the arrival of the first Event to the Cloud Layer and the last.

4.3. Testing Conditions

All tests were performed using a single machine, with the characteristics described in Table 2.
The effect on latency resulting from the communication protocols was eliminated, as the current phase of development was focused on the limitations imposed by the chosen local implementation of the node on the available processing capacity. With this objective, the previously described InputGenerator was directly connected though a local Ethernet link and injected the generated Data Reports in the co-located MQTT broker. The effect of connectivity with the Cloud Layer was also not considered, as latency was measured only until the Events exited the node. Additionally, consider Table 3, which presents the configuration settings for the different components. Based on best practices, the chosen configuration aimed to achieve a balanced node with existing resources. Under the listed conditions, the node was subjected to write rates between 1000 Data Reports per second and 14,000 Data Reports per second. As stated, the dataset for the case study was repeated to achieve a total of 100,000 individual Data Reports in each test run. For each pair of architecture variation and target rate, there were a total of five test runs. This means that the presented values were the average of processing a total of 500,000 Data Reports, at different points in time. The upper limit of 14,000 was chosen as it was the point that both architecture variations started displaying loss rates above 1%. Each test run was defined as starting with the arrival of the first Data Report in the IRONEDGE node and ending either with the 100,000th Event received in the Cloud Layer or an upper time limit of 120 s. Section 5 presents the results of the described methodology and their corresponding discussion.

5. Results and Comparison

Consider the two different implementations presented in Section 3.2 and the previously described testing conditions from Section 4.

5.1. Resource Usage

Figure 6 depicts the averaged values for the memory and CPU utilization. Regarding the memory, the average utilization varied between 71.2% and 71.8% for K0-WC, corresponding to a range of 0.6%. For K1-NC, there was a wider variation, between 67.3% and 70.7%, for a range of 3.4%. Related to the CPU, the average utilization showed variations between 58.1% and 63.4% for K0-WC and 50.8% and 55% for K1-NC. This corresponds to variation ranges of 5.3% and 4.2%.
It is clear that, comparing K0-WC and K1-NC, the introduction of Kafka Connect, as expected, increased the overall resource usage. The increase was minimal for memory utilization, corresponding to an increase of, at most, 4.4%. For CPU utilization, this increase was more significant, reaching upwards of 12.5%. Additionally, for both implementations, there was no significant increase in resource usage resulting from the increased rates of Data Reports. On the contrary, there was an overall decrease in CPU utilization for both implementations.

5.2. Loss Rates and Latency

Consider now Figure 7, which presents the recorded loss rates and average latency.
In Figure 7a, for K0-WC, there was significant loss starting from only 2000 Data Reports per second, at 16.3%, and reaching a peak of 90.6% for 14,000 Data Reports per second. Contrary to K1-NC, no loss was recorded until the test case for 14,000 Data Reports per second, at 1.5%. As this marks the point at which both implementations exceeded a maximum acceptable level of 1% of loss for the Data Reports, this was chosen as the cut-off point for further test cases. For the average latency, as presented in Figure 7b, once again, K1-NC showed significant performance increases when compared with K0-WC. There was a decrease in average latency from 52.2 ms to 19.8 ms. This gap in latency increased significantly for higher Data Report rates. The collected data suggest, therefore, that the observed increase in pressure on the limited computing resources was sufficient to prevent the accurate processing of received Data Reports in a timely fashion. The average latency values for K1-NC never exceeded 275.2 ms, for 8000 Data Reports per second. While K0-WC showed a maximum of 55.042 ms, this was a full 55.042 s to deliver the Events resulting from each Data Report, for 14,000 Data Reports per second. The occurrence of latency peaks at 8,000 Data Reports per second is of particular interest. This effect may be explained by the internal batching size used in Apache Storm, which was set to 5000 records, as previously shown in Table 3.
For 8000 Data Reports, the last 3000 had to wait for the eventual arrival of additional messages over the next second, increasing the average latency. For 10,000 Data Reports, two batches may be created in the same second, resulting in a decrease. This effect continued for 12,000 and 14,000 Data Reports, but the first 10,000 Data Reports that were successfully batched attenuated the effect when considering the average latency. From the loss rate and latency, it is clear that the removal of Kafka Connect as an interconnecting component offered significant performance improvements for the proposed architecture. This is in spite of the fact that Figure 6 shows that resource usage did not increase with higher Data Reporting rates.

5.3. Actual Throughput and Log Time

Recall that, for both K0-WC and K1-NC, the Data Reports all originated in a single Data Source and were sequentially inserted into the Data Collection. Figure 8a shows the actual throughput of the system, measured as the rate at which Events were written into the Cloud Layer. Figure 8b shows the log time, the average time spent delivering all valid Events to the Cloud Layer.
For both figures, the implementations displayed similar behavior for the test case of 1000 Data Reports per second, but differed significantly for all higher rates. In the case of actual throughput, both implementations initially matched the Data Report rate, where both had a 0% loss. For higher rates, K0-WC clearly showed low throughput resulting from high losses. K1-NC, in contrast, showed an increase in throughput, but never matched the input rate for the Data Reports. For example, for 12,000 and 14,000 Data Reports per second, the throughput was limited to 4610.3 and 4146.2 Events per second, respectively. Coupled with the low loss rates already verified in Figure 7, this displays a spreading effect in internal processing. Due to the fact that the implementation consumes Data Reports at a much faster rate than it can process and deliver them to the Cloud Layer, as such, the total time taken to deliver Events will tend to be the same as or higher than the time taken to consume Data Reports. As already noted for the recorded latency, this appears to be due to the internal batching size set by Apache Storm to 5000 Data Reports per batch.
These effects were also reflected in the log time. After initially matching the behavior, K0-WC showed high log times, starting at 152,826.6 ms for 2000 Data Reports per second and lowering to 103,647.8 ms for 14,000 Data Reports per second. In addition to the high loss rate, this high log time indicates that the system is losing messages that it cannot process. However, as the internal state progressed, it accepted messages received later. Identifying which component, or set of components, is shedding messages would require more detailed delivery metrics taken at the boundaries of each component. For K1-N, the recorded log time showed a more stable behavior, with no particular trend to be identified.

6. Conclusions and Future Work

In this paper, a framework guiding architectural designs for nodes in “Smart Infrastructure” scenarios was proposed. The framework identifies a set of components/functionalities that are common across multiple proposals in the existing literature. This framework is named IRONEDGE. A specific use case, related to monitoring rolling stock in the Ferrovia 4.0 project, was presented. This study case covered two limitations on the edge node: (i) limited computational resources and (ii) periods without network connectivity to the Cloud Layer.
Following the proposed framework, two architectures were defined for the case study. Both variations followed a pattern, also presented in recent literature, of combining Kubernetes for orchestration and Apache Kafka for the data distribution with a Stream Processing system (Apache Storm for this study case). Both differ in the integration of IoT sensors that use MQTT for message delivery. K0-WC uses Kafka Connect to pass messages from MQTT to Apache Kafka. K1-NC allows Apache Storm to consume messages directly.
As a response to Research Question Q3, the two architectures were compared for different Data Report rates. K1-NC offered, for the available computational resources, both overall lower Event loss and lower processing latency. For the K0-WC scenario, the figures showed an almost stable CPU and memory utilization, with a slight decrease in the CPU utilization when more Events were dropped. For this scenario, the optimal number of messages per second was 2000, since it had a higher processing rate than 1000, even with a loss of 16.306%, while the 4000 case had a loss higher than 50%, at 54.888%. For the K1-NC scenario, the figures showed that the CPU utilization had some variations, but not very significant ones. The optimal scenario was 14,000 since the loss of 1.45% resulted in the processing of 13,797 messages per second, a number larger than the 12,000 previously considered. Considering a maximum of a 1% loss of Events received in less than 120 s, the upper limit was set at 12,000 Data Reports per second. K1-NC should be the chosen variation for the study case, with the disadvantage that the internal communication flow became fragmented, with the responsibility of managing the Data Collection from different Data Sources being delegated to Apache Storm.
For future work, the authors will mainly consider the need to extend the evaluation that was carried out over the K1-NC architectural variation. In particular, the reliability of using Kafka Mirrormaker v2 as the Event Output component should be evaluated by introducing randomized network faults in the connection between the Edge Layer and Cloud Layer, as well as the effect on latency resulting from the communication protocols used for connectivity with both the Data Sources and the Cloud Layer. As the Ferrovia 4.0 project used as a study case advances the need to evaluate the proposed implementation with multiple Apache Storm pipelines, supporting different sensor types will also arise.

Author Contributions

Conceptualization, J.P.V., J.S. and N.D.; methodology, J.P.V.; software, J.P.V.; validation, J.P.V., J.S., N.D. and M.P.; formal analysis, J.P.V., J.S., N.D. and M.P.; investigation, J.P.V., J.S., N.D. and M.P.; resources, J.S., N.D. and M.P.; data curation, J.P.V.; writing—original draft preparation, J.P.V.; writing—review and editing, J.P.V., J.S., N.D. and M.P.; visualization, J.P.V., J.S., N.D. and M.P.; supervision, J.S., N.D. and M.P.; funding acquisition, J.S., N.D. and M.P. All authors have read and agreed to the published version of the manuscript.

Funding

This work was supported by the Ferrovia 4.0 mobilizer project, under the grants LISBOA-01-0247-FEDER-046111 and POCI-01-0247-FEDER-046111 from ANI (National Innovation Agency) and by NOVA LINCS (UIDB/04516/2020), LASIGE (UIDB/00408/2020) and INESC-ID (UIDB/50021/2020) with financial support from FCT (Fundação para a Ciência e a Tecnologia) through national funds.

Institutional Review Board Statement

Not applicable.

Informed Consent Statement

Not applicable.

Data Availability Statement

Not applicable.

Acknowledgments

For their ongoing support and advice, the authors would like to thank the team at Future Internet Technologies, Instituto Superior de Engenharia de Lisboa, and Instituto Politécnico de Lisboa, involved in Ferrovia 4.0. All Ferrovia 4.0 partners are also thanked by the authors.

Conflicts of Interest

The authors declare no conflict of interest.

Abbreviations

The following abbreviations are used in this manuscript:
AMMAsynchronous Messaging Middleware
CPUCentral Processing Unit
IoTInternet of Things
MQTTMQ Telemetry Transport
K0-WCApache Kafka with Kafka Connect
K1-NCApache Kafka with No Kafka Connect

References

  1. Friess, P.; Riemenschneider, R. IoT Ecosystems Implementing Smart Technologies to Drive Innovation for Future Growth and Development. In Digitising the Industry Internet of Things Connecting the Physical, Digital and VirtualWorlds; River Publishers: Aalborg, Denmark, 2022; pp. 5–13. [Google Scholar]
  2. Syafrudin, M.; Fitriyani, N.L.; Alfian, G.; Rhee, J. An Affordable Fast Early Warning System for Edge Computing in Assembly Line. Appl. Sci. 2019, 9, 84. [Google Scholar] [CrossRef] [Green Version]
  3. Kolajo, T.; Daramola, O.; Adebiyi, A. Big data stream analysis: A systematic literature review. J. Big Data 2019, 6, 1–30. [Google Scholar] [CrossRef]
  4. Aleksic, S. A survey on optical technologies for IoT, smart industry, and smart infrastructures. J. Sens. Actuator Netw. 2019, 8, 47. [Google Scholar] [CrossRef] [Green Version]
  5. Annaswamy, A.M.; Malekpour, A.R.; Baros, S. Emerging research topics in control for smart infrastructures. Annu. Rev. Control. 2016, 42, 259–270. [Google Scholar] [CrossRef] [Green Version]
  6. Ferrovia 4.0. A Smart, Sustainable and New Generation of Rail System. Available online: http://ferrovia40.pt/?lang=en (accessed on 10 December 2021).
  7. Abouaomar, A.; Cherkaoui, S.; Mlika, Z.; Kobbane, A. Resource provisioning in edge computing for latency-sensitive applications. IEEE Internet Things J. 2021, 8, 11088–11099. [Google Scholar] [CrossRef]
  8. de Assuncao, M.D.; da Silva Veith, A.; Buyya, R. Distributed data Stream Processing and edge computing: A survey on resource elasticity and future directions. J. Netw. Comput. Appl. 2018, 103, 1–17. [Google Scholar] [CrossRef] [Green Version]
  9. Sajjad, H.P.; Danniswara, K.; Al-Shishtawy, A.; Vlassov, V. Spanedge: Towards unifying Stream Processing over central and near-the-edge data centers. In Proceedings of the 2016 IEEE/ACM Symposium on Edge Computing (SEC), Washington, DC, USA, 27–28 October 2016; pp. 168–178. [Google Scholar]
  10. Geldenhuys, M.K.; Will, J.; Pfister, B.J.; Haug, M.; Scharmann, A.; Thamsen, L. Dependable iot data Stream Processing for monitoring and control of urban infrastructures. In Proceedings of the 2021 IEEE International Conference on Cloud Engineering (IC2E), San Francisco, CA, USA, 4–8 October 2021; pp. 244–250. [Google Scholar]
  11. Yu, W.; Liang, F.; He, X.; Hatcher, W.G.; Lu, C.; Lin, J.; Yang, X. A survey on the edge computing for the Internet of Things. IEEE Access 2017, 6, 6900–6919. [Google Scholar] [CrossRef]
  12. Papageorgiou, A.; Poormohammady, E.; Cheng, B. Edge-computing-aware deployment of Stream Processing tasks based on topology-external information: Model, algorithms, and a storm-based prototype. In Proceedings of the 2016 IEEE International Congress on Big Data (BigData Congress), San Francisco, CA, USA, 27 June–2 July 2016; pp. 259–266. [Google Scholar] [CrossRef]
  13. Bonomi, F.; Milito, R.; Zhu, J.; Addepalli, S. Fog computing and its role in the internet of things. In Proceedings of the First Edition of the MCC Workshop on Mobile Cloud Computing, Helsinki, Finland, 17 August 2012; pp. 13–16. [Google Scholar] [CrossRef]
  14. Andrade, H.C.; Gedik, B.; Turaga, D.S. Fundamentals of Stream Processing: Application Design, Systems, and Analytics; Cambridge University Press: Cambridge, UK, 2014. [Google Scholar]
  15. Dean, J.; Ghemawat, S. MapReduce: Simplified data processing on large clusters. Commun. ACM 2008, 51, 107–113. [Google Scholar] [CrossRef]
  16. Apache Storm. Available online: https://storm.apache.org/ (accessed on 10 December 2021).
  17. Toshniwal, A.; Taneja, S.; Shukla, A.; Ramasamy, K.; Patel, J.M.; Kulkarni, S.; Jackson, J.; Gade, K.; Fu, M.; Donham, J.; et al. Storm@twitter. In Proceedings of the 2014 ACM SIGMOD International Conference on Management of Data, Snowbird, UT, USA, 22–27 June 2014; pp. 147–156. [Google Scholar] [CrossRef]
  18. Apache Flink: Stateful Computations over Data Streams. Available online: https://flink.apache.org/ (accessed on 10 December 2021).
  19. Apache Spark- Unified Engine for Large-Scale Data Analytics. Available online: https://spark.apache.org/ (accessed on 10 December 2021).
  20. Bejeck, B. Kafka Streams in Action: Real-Time Apps and Microservices With the Kafka Streams API; Simon and Schuster: New York, NY, USA, 2018. [Google Scholar]
  21. Messaging That Just Works—RabbitMQ. Available online: https://www.rabbitmq.com/ (accessed on 10 December 2021).
  22. Apache Pulsar. Hello from Apache Pulsar. Available online: https://pulsar.apache.org/ (accessed on 10 December 2021).
  23. Apache Kafka. Available online: https://kafka.apache.org/ (accessed on 10 December 2021).
  24. Auradkar, A.; Botev, C.; Das, S.; De Maagd, D.; Feinberg, A.; Ganti, P.; Gao, L.; Ghosh, B.; Gopalakrishna, K.; Harris, B.; et al. Data infrastructure at LinkedIn. In Proceedings of the 2012 IEEE 28th International Conference on Data Engineering, Arlington, VA, USA, 1–5 April 2012; pp. 1370–1381. [Google Scholar] [CrossRef]
  25. Kreps, J.; Narkhede, N.; Rao, J. Kafka: A distributed messaging system for log processing. Proc. NetDB 2011, 11, 1–7. [Google Scholar]
  26. Narkhede, N.; Shapira, G.; Palino, T. Kafka: The Definitive Guide: Real-Time Data and Stream Processing at Scale; O’Reilly Media, Inc.: Sebastopol, CA, USA, 2017. [Google Scholar]
  27. Kleppmann, M. Designing Data-Intensive Applications: The Big Ideas behind Reliable, Scalable, and Maintainable Systems; O’Reilly Media, Inc.: Sebastopol, CA, USA, 2017. [Google Scholar]
  28. ksqlDB: The Database Purpose-Built for Stream Processing Applications. Available online: https://ksqldb.io/ (accessed on 10 December 2021).
  29. Bhogaraju, S.D.; Korupalli, V.R.K. Design of smart roads-a vision on indian smart infrastructure development. In Proceedings of the 2020 International Conference on COMmunication Systems & NETworkS (COMSNETS), Bengaluru, India, 7–11 January 2020; pp. 773–778. [Google Scholar]
  30. Nammouchi, A.; Aupke, P.; Kassler, A.; Theocharis, A.; Raffa, V.; Di Felice, M. Integration of AI, IoT and Edge-Computing for Smart Microgrid Energy Management. In Proceedings of the 2021 IEEE International Conference on Environment and Electrical Engineering and 2021 IEEE Industrial and Commercial Power Systems Europe (EEEIC/I&CPS Europe), Bari, Italy, 7–10 September 2021; pp. 1–6. [Google Scholar]
  31. MQTT—The Standard for IoT Messaging. Available online: https://mqtt.org/ (accessed on 14 December 2021).
  32. Hidalgo, N.; Rosas, E.; Saavedra, T.; Morales, J. SLedge: Scheduling and Load Balancing for a Stream Processing EDGE Architecture. Appl. Sci. 2022, 12, 6474. [Google Scholar] [CrossRef]
  33. Kubernetes Documentation. Available online: https://kubernetes.io/docs/home/ (accessed on 22 December 2021).
  34. Javed, A.; Heljanko, K.; Buda, A.; Främling, K. CEFIoT: A fault-tolerant IoT architecture for edge and cloud. In Proceedings of the 2018 IEEE 4th World Forum on Internet of Things (WF-IoT), Singapore, 5–8 February 2018; pp. 813–818. [Google Scholar] [CrossRef] [Green Version]
  35. Syafrudin, M.; Fitriyani, N.L.; Li, D.; Alfian, G.; Rhee, J.; Kang, Y.S. An Open Source-Based Real-Time Data Processing Architecture Framework for Manufacturing Sustainability. Sustainability 2017, 9, 2139. [Google Scholar] [CrossRef] [Green Version]
  36. Syafrudin, M.; Alfian, G.; Fitriyani, N.L.; Rhee, J. Performance Analysis of IoT-Based Sensor, Big Data Processing, and Machine Learning Model for Real-Time Monitoring System in Automotive Manufacturing. Sensors 2018, 18, 2946. [Google Scholar] [CrossRef] [PubMed] [Green Version]
  37. Gauttam, H.; Pattanaik, K.; Bhadauria, S.; Saxena, D.; Sapna. A cost aware topology formation scheme for latency sensitive applications in edge infrastructure-as-a-service paradigm. J. Netw. Comput. Appl. 2022, 199, 103303. [Google Scholar] [CrossRef]
  38. Hesse, G.; Matthies, C.; Uflacker, M. How fast can we insert? an empirical performance evaluation of apache kafka. In Proceedings of the 2020 IEEE 26th International Conference on Parallel and Distributed Systems (ICPADS), Hong Kong, 2–4 December 2020; pp. 641–648. [Google Scholar]
  39. Apache Kafka. Available online: https://kafka.apache.org/documentation/#connect (accessed on 10 December 2021).
  40. Apache Software Foundation. KIP-382: MirrorMaker 2.0-Apache Kafka. Available online: https://cwiki.apache.org/confluence/display/KAFKA/KIP-382%3A+MirrorMaker+2.0 (accessed on 19 December 2021).
  41. Grafana: The Open Observability Platform. Available online: https://grafana.com/ (accessed on 19 December 2021).
  42. Prometheus. Prometheus-Monitoring System & Time Series Database. Available online: https://prometheus.io/ (accessed on 19 December 2021).
  43. 6.3.2.3. Cusum Control Charts. Available online: https://www.itl.nist.gov/div898/handbook/pmc/section3/pmc323.htm (accessed on 19 December 2021).
  44. Zhang, M.; Li, X.; Wang, L. An adaptive outlier detection and processing approach towards time series sensor data. IEEE Access 2019, 7, 175192–175212. [Google Scholar] [CrossRef]
  45. Jain, S.; Pattanaik, K.K.; Verma, R.K.; Shukla, A. EDVWDD: Event-Driven Virtual Wheel-based Data Dissemination for Mobile Sink-Enabled Wireless Sensor Networks. J. Supercomput. 2021, 77, 11432–11457. [Google Scholar] [CrossRef]
  46. MicroK8s. Zero-Ops Kubernetes for Developers, Edge and IoT MicroK8s. Available online: http://microk8s.io (accessed on 19 December 2021).
  47. Böhm, S.; Wirtz, G. Profiling Lightweight Container Platforms: MicroK8s and K3s in Comparison to Kubernetes. In Proceedings of the 13th Central European Workshop on Services and their Composition (ZEUS), Bamberg, Germany, 25–26 February 2021. [Google Scholar]
Figure 1. Three-layer architecture for edge-computing-based solutions. Adapted from [11].
Algorithms 16 00123 g001
Figure 2. High-level overview of the proposed framework, identifying the fundamental set of components: Data Collection, Stream Processing, Local Storage, Event Output.
Algorithms 16 00123 g002
Figure 3. Processing pipeline for approximation of workloads. Including connections with Local Storage and external components.
Algorithms 16 00123 g003
Figure 4. High-level view of sensor integration for Ferrovia 4.0.
Algorithms 16 00123 g004
Figure 6. Resource usage for each implementation and Data Reports’ rate. (a) Average memory utilization. (b) Average CPU utilization.
Algorithms 16 00123 g006
Figure 7. Implementation performance measured as loss rates and latency, for each implementation and Data Reports’ rate. (a) Loss rates. (b) Average end-to-end latency.
Algorithms 16 00123 g007
Figure 8. Implementation performance measured as throughput and log time, for each implementation and Data Reports’ rate. (a) Actual throughput. (b) Log time.
Algorithms 16 00123 g008
Table 1. A summary of papers that were considered in the Related Work Section.
PaperLocal OrchestrationEdgeStream ProcessingAMMLimited ComputingIntermittent Connectivity
Bhogaraju et al. [29]NoYesNoNoNoNo
Nammouchi et al. [30]NoYesNoYes (MQTT)NoNo
Hidalgo et al. [32]PartiallyYesYes (Apache Storm)NoYes (Only latency. Offloads to mobile devices)No
Geldenhuys et al. [10]YesNo (Adaptable)Yes (Apache Flink)Yes (MQTT/Apache Kafka)Partially (only cluster)Partially (only cluster)
Javed et al. [34]YesYesNoYes (Apache Kafka)Partially (not evaluated)Partially (not evaluated)
Syafrudin et al. [35]NoNoYes (Apache Storm)Yes (Apache Kafka)NoNo
Syafrudin et al. [36]NoNoYes (Apache Storm)Yes (Apache Kafka)No (performance for cloud scenario)No
Gauttam et al. [37]NoYesNoNoPartially (only cluster)Yes
Syafrudin et al. [2]NoYesNoNoPartiallyNo
Table 2. Testing node machine parameters.
ResourcesDetails
CPU cores4
Memory8 Gb
Storage128 Gb
Network1 Gpbs vNIC
Operating systemUbuntu 20.04.3 LTS
Kernel5.4.0-99-generic
Table 3. Non-default configurations used for the components.
ParametersValueDefault
Apache Storm
topology.stats.sample.rate0.0011
topology.producer.batch.size50001
topology.executor.receive.buffer.size32,0001
Mosquitto
listener1883-
allow_anonymoustruefalse
Apache Kafka
offsets.topic.replication.factor13
transaction.state.log.replication.factor13
transaction.state.log.min.isr12
inter.broker.protocol.version3.1N.A
Kafka Mirrormaker v2
offset.flush.timeout.ms20,0005000
producer.buffer.memory2,194,30433,554,432
max.request.size2,194,3041,048,576
batch.size524,28816,384
max.poll.records20,000500
config.namestorage.replication.factor 1 3
offset.storage.replication.factor 1 3
status.storage.replication.factor 1 3
Kafka Connect
config.namestorage.replication.factor 1 3
offset.storage.replication.factor 1 3
status.storage.replication.factor 1 3
Disclaimer/Publisher’s Note: The statements, opinions and data contained in all publications are solely those of the individual author(s) and contributor(s) and not of MDPI and/or the editor(s). MDPI and/or the editor(s) disclaim responsibility for any injury to people or property resulting from any ideas, methods, instructions or products referred to in the content.

