
Structure and Luminescent Properties of Niobium-Modified ZnO-B2O3:Eu3+ Glass
 , , , ,
Abstract
:1. Introduction
2. Materials and Methods
3. Results
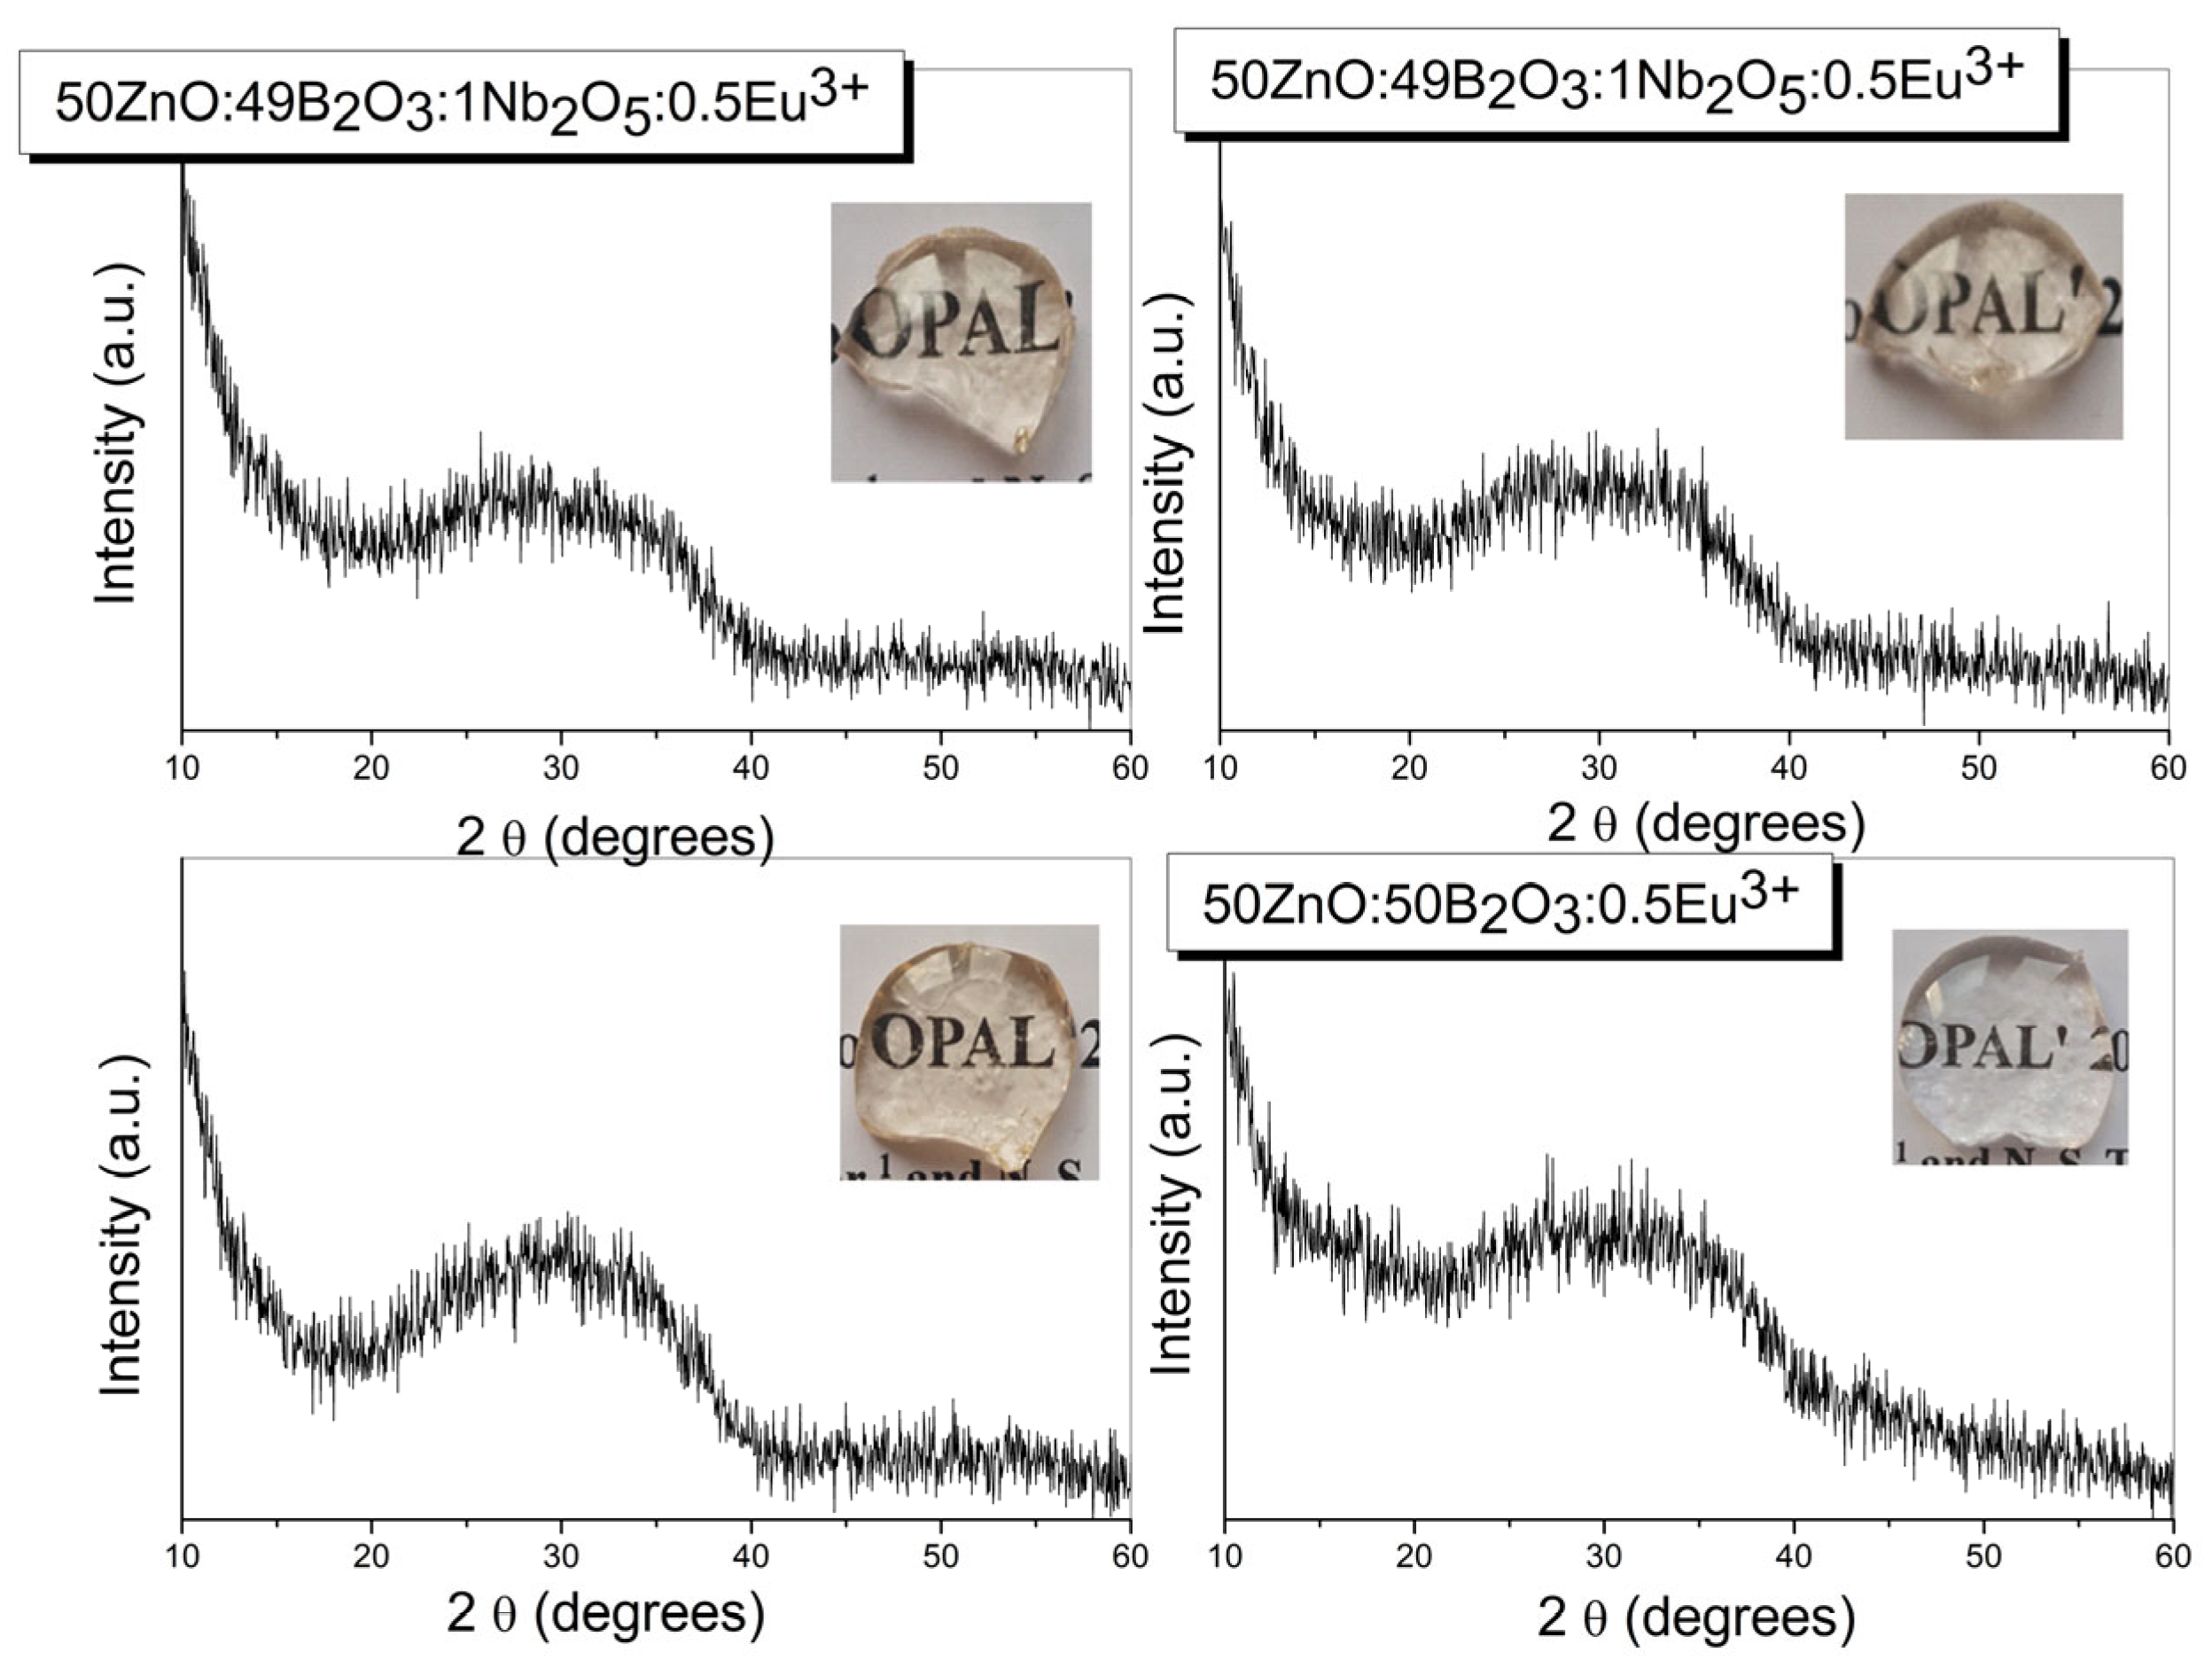
3.1. XRD Spectra and Thermal Analysis
3.2. Raman Analysis
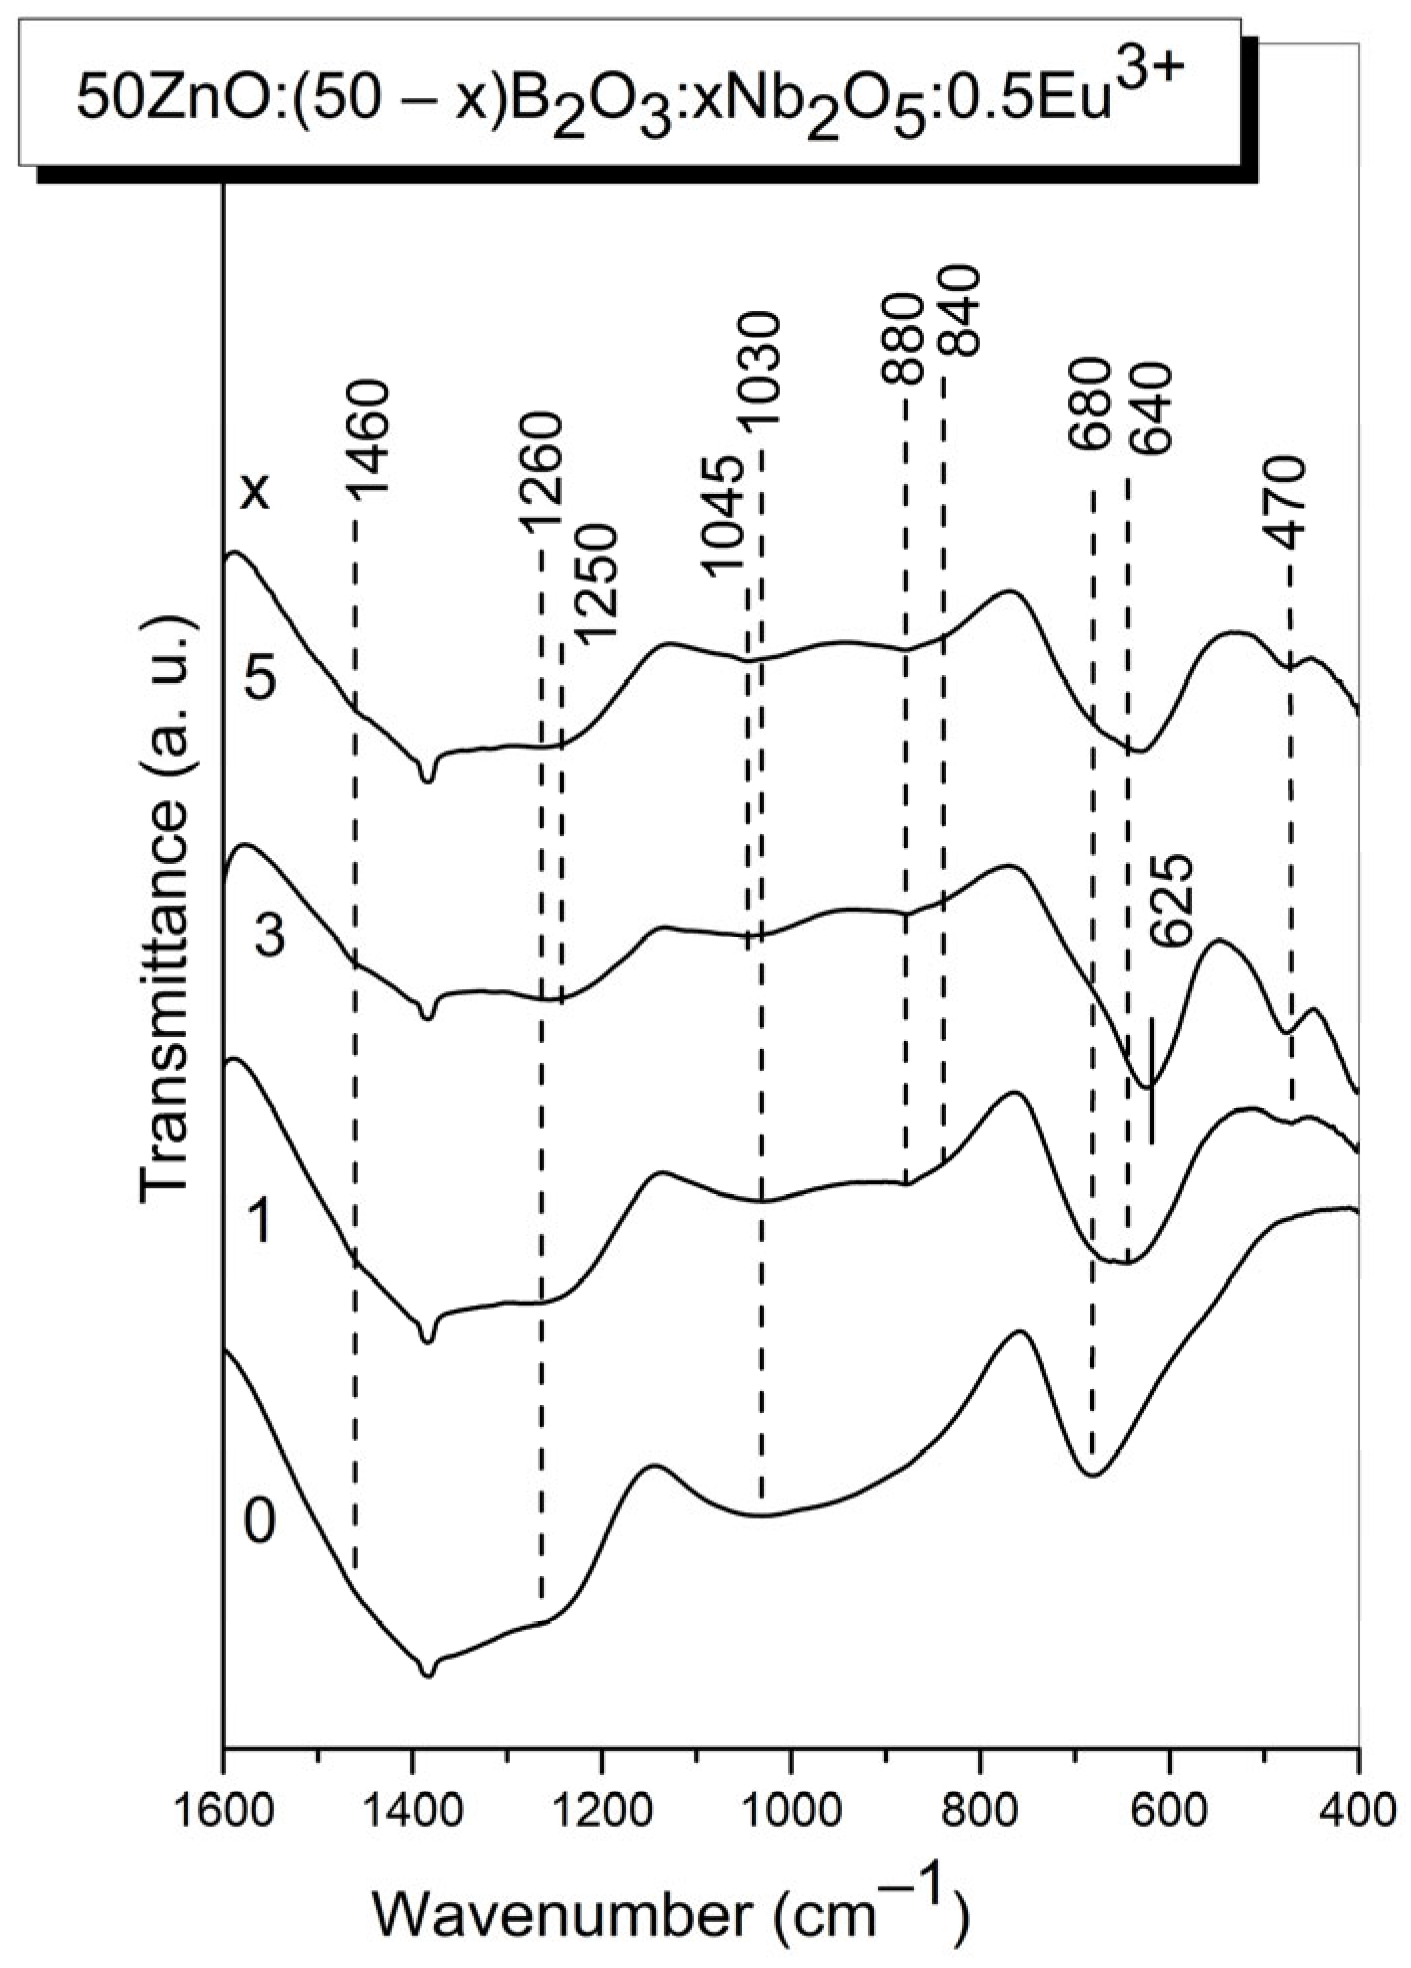
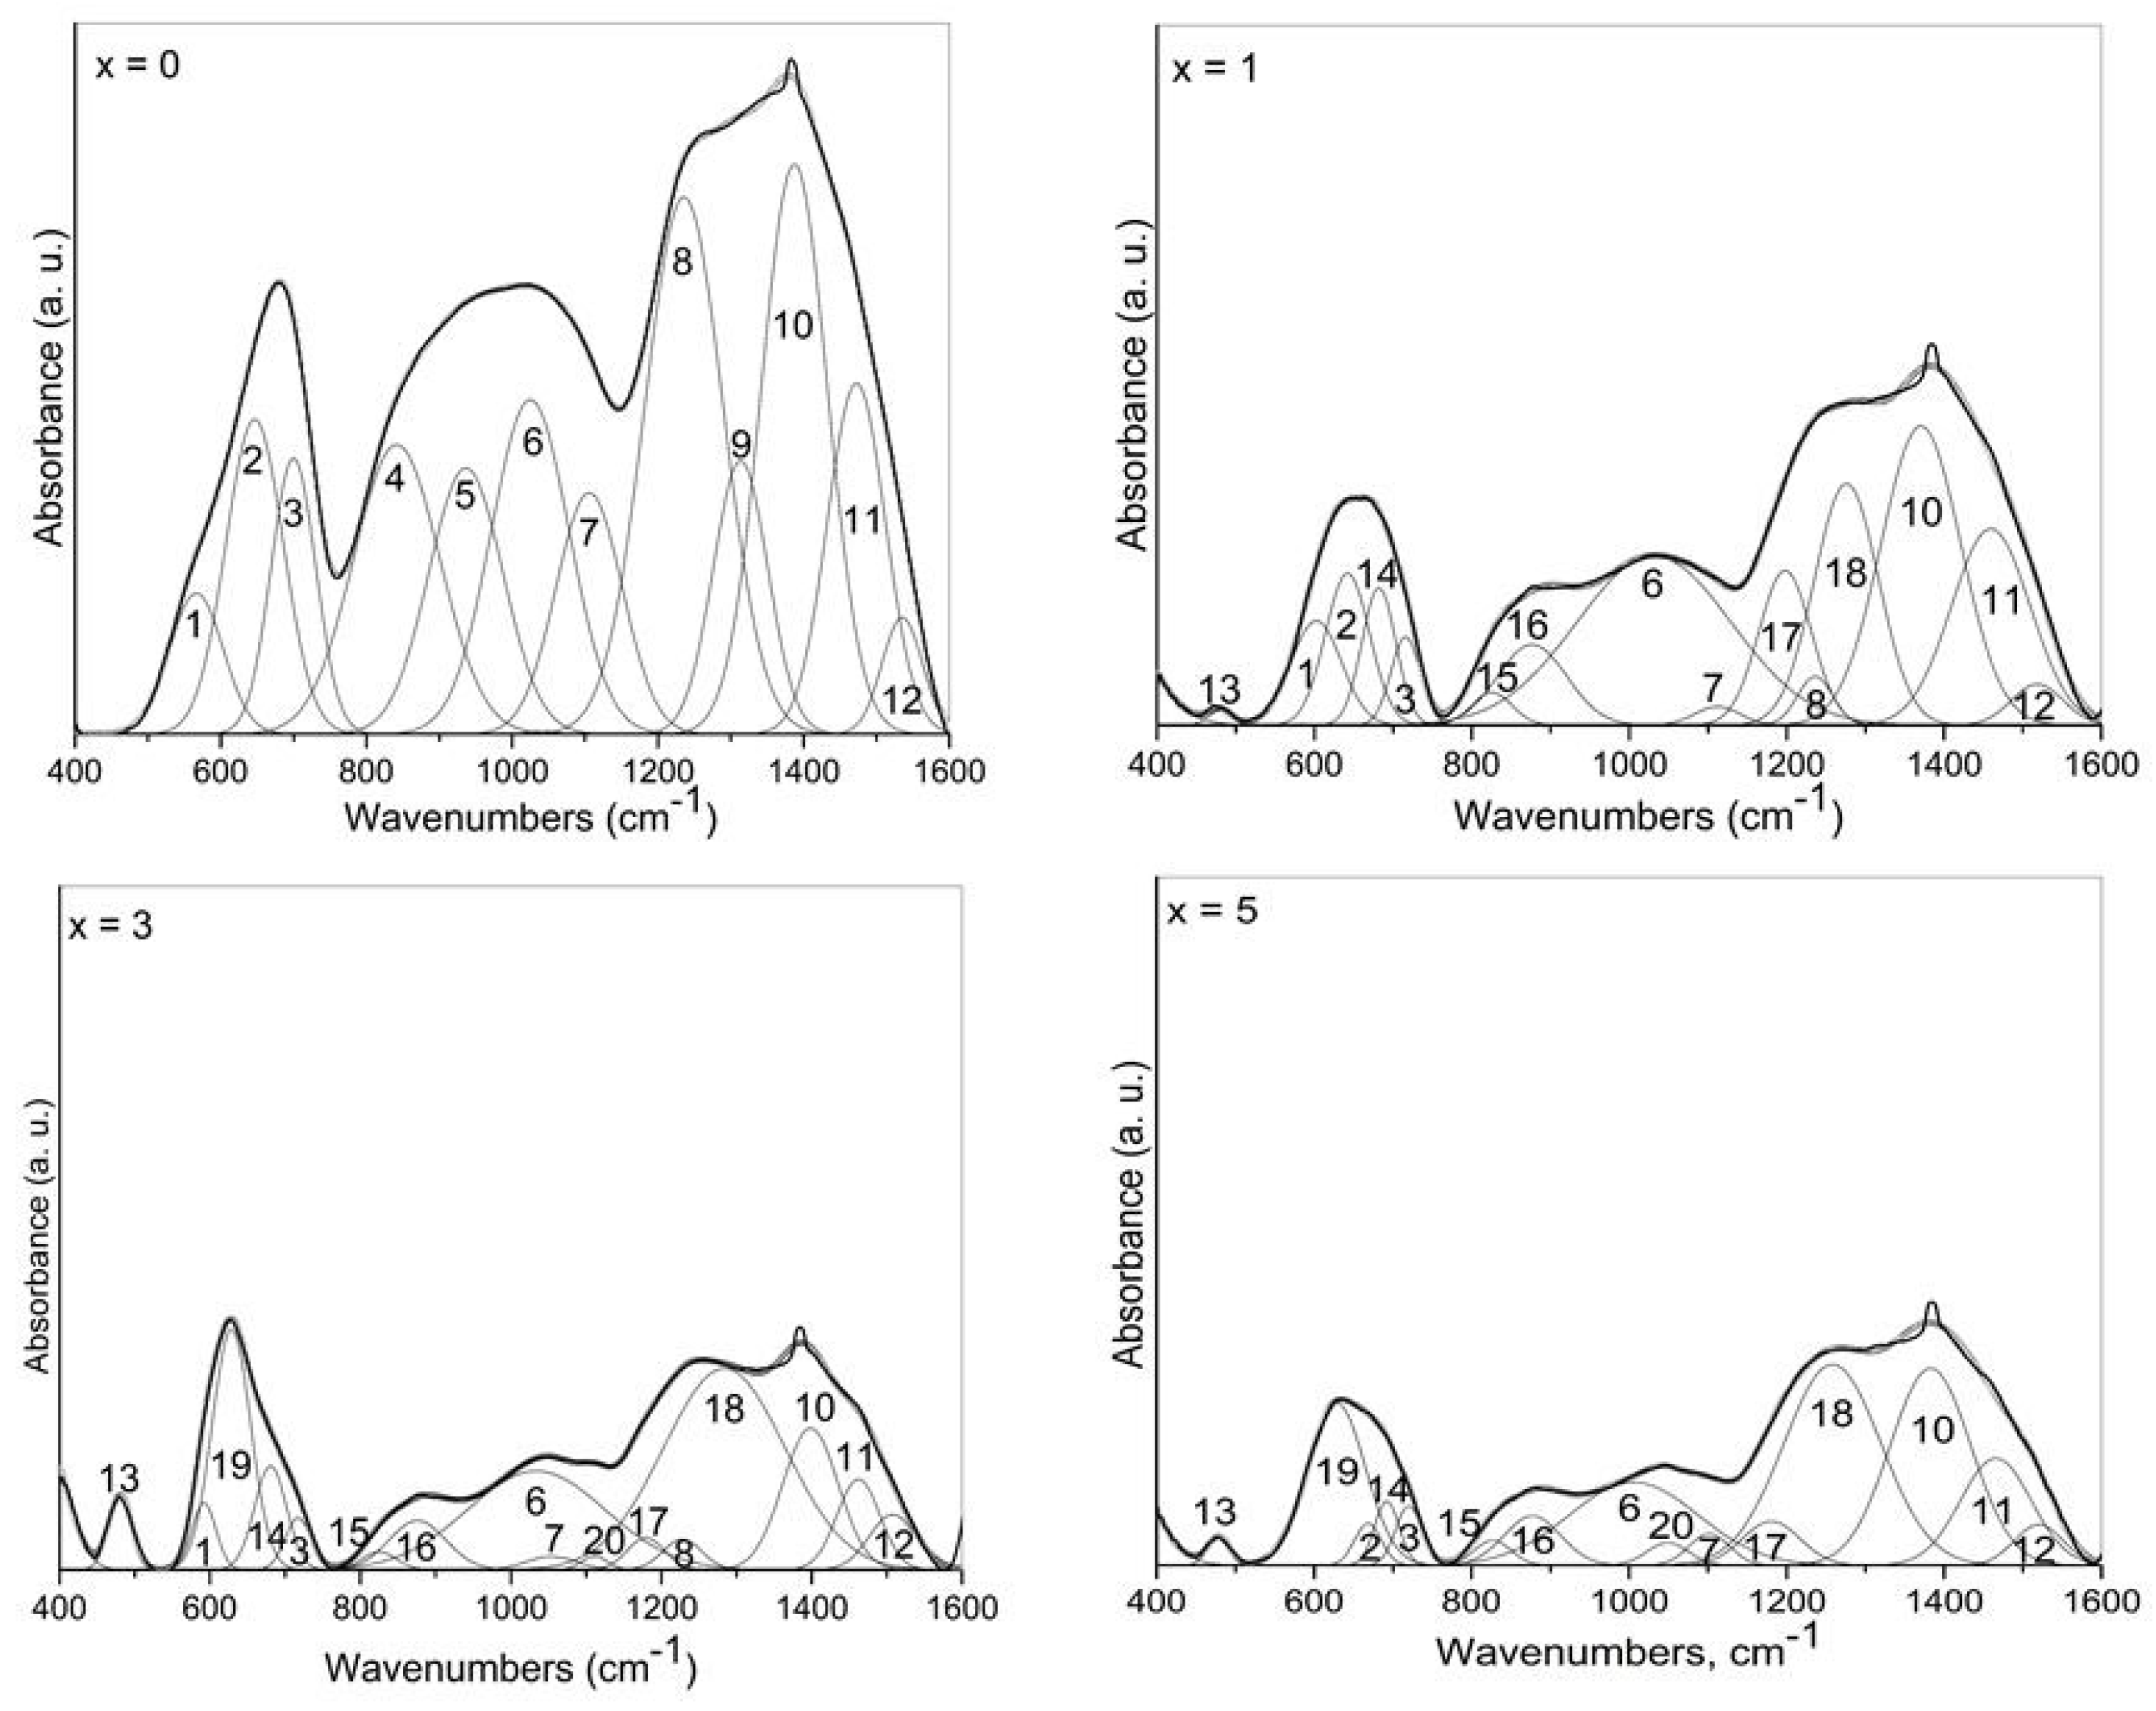
3.3. IR Analysis
3.4. Physical Parameters
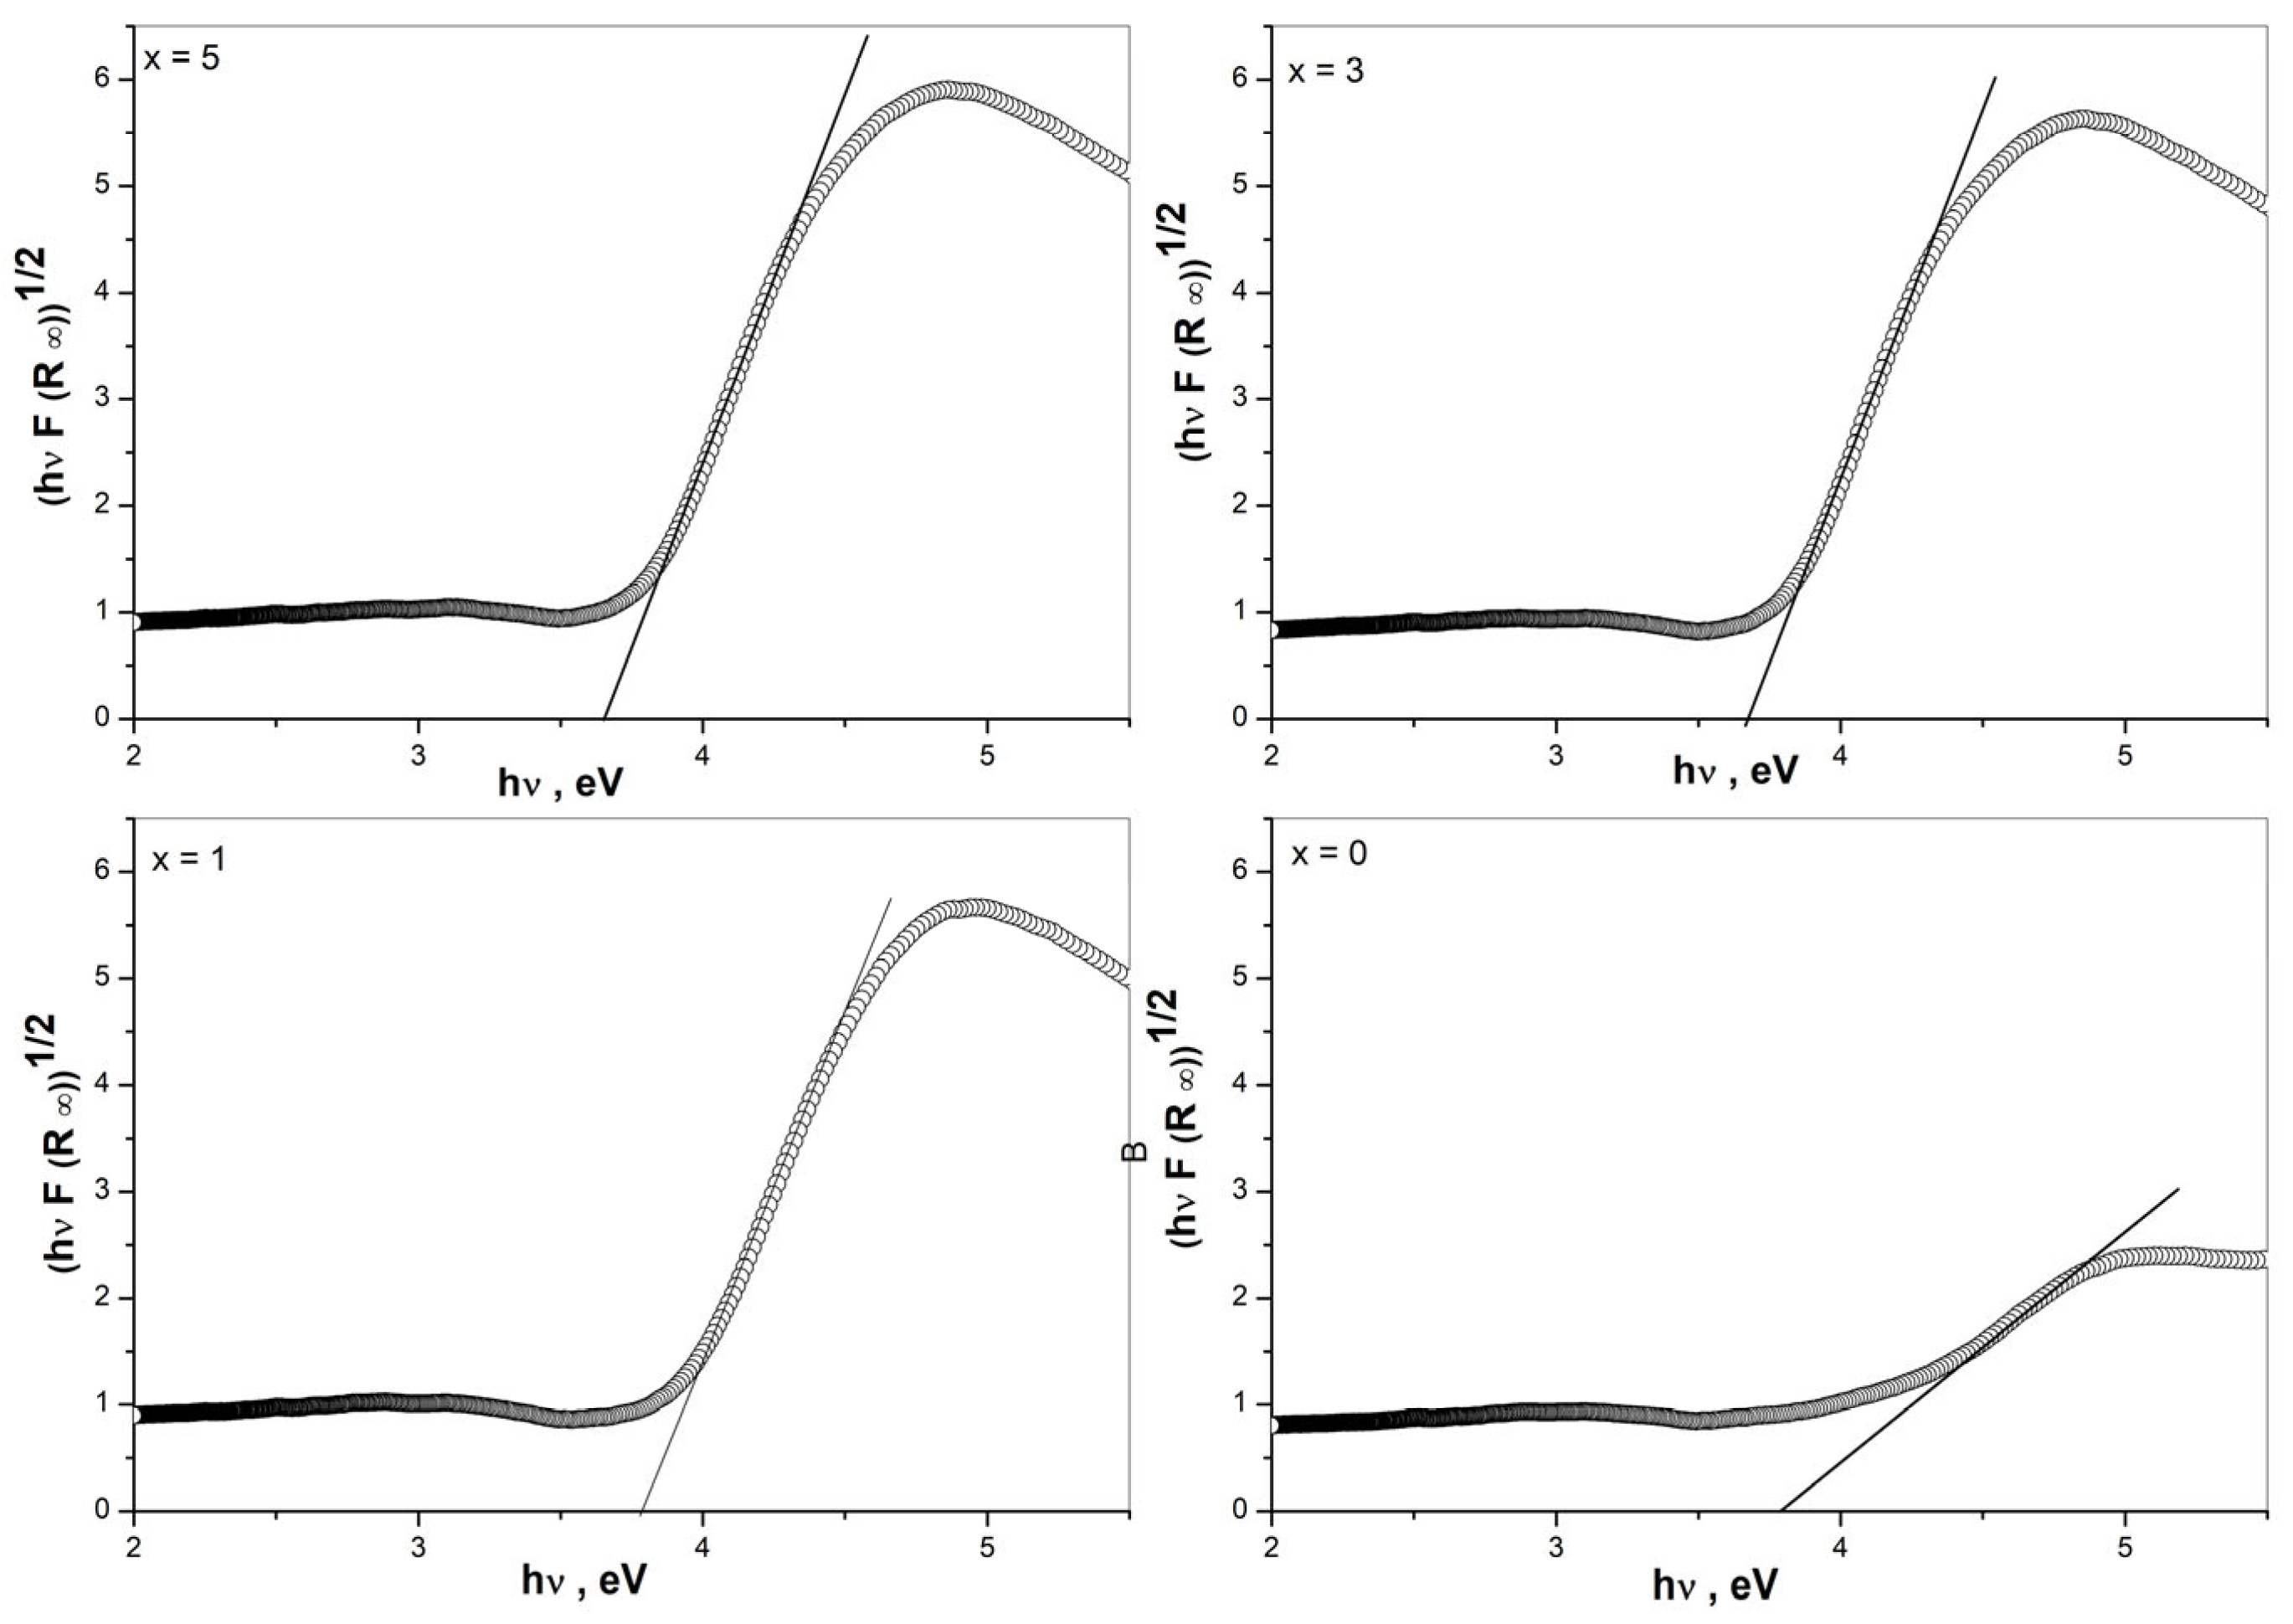
3.5. Determination of Optical Band Gap
3.6. EPR Spectroscopy
3.7. Optical Studies
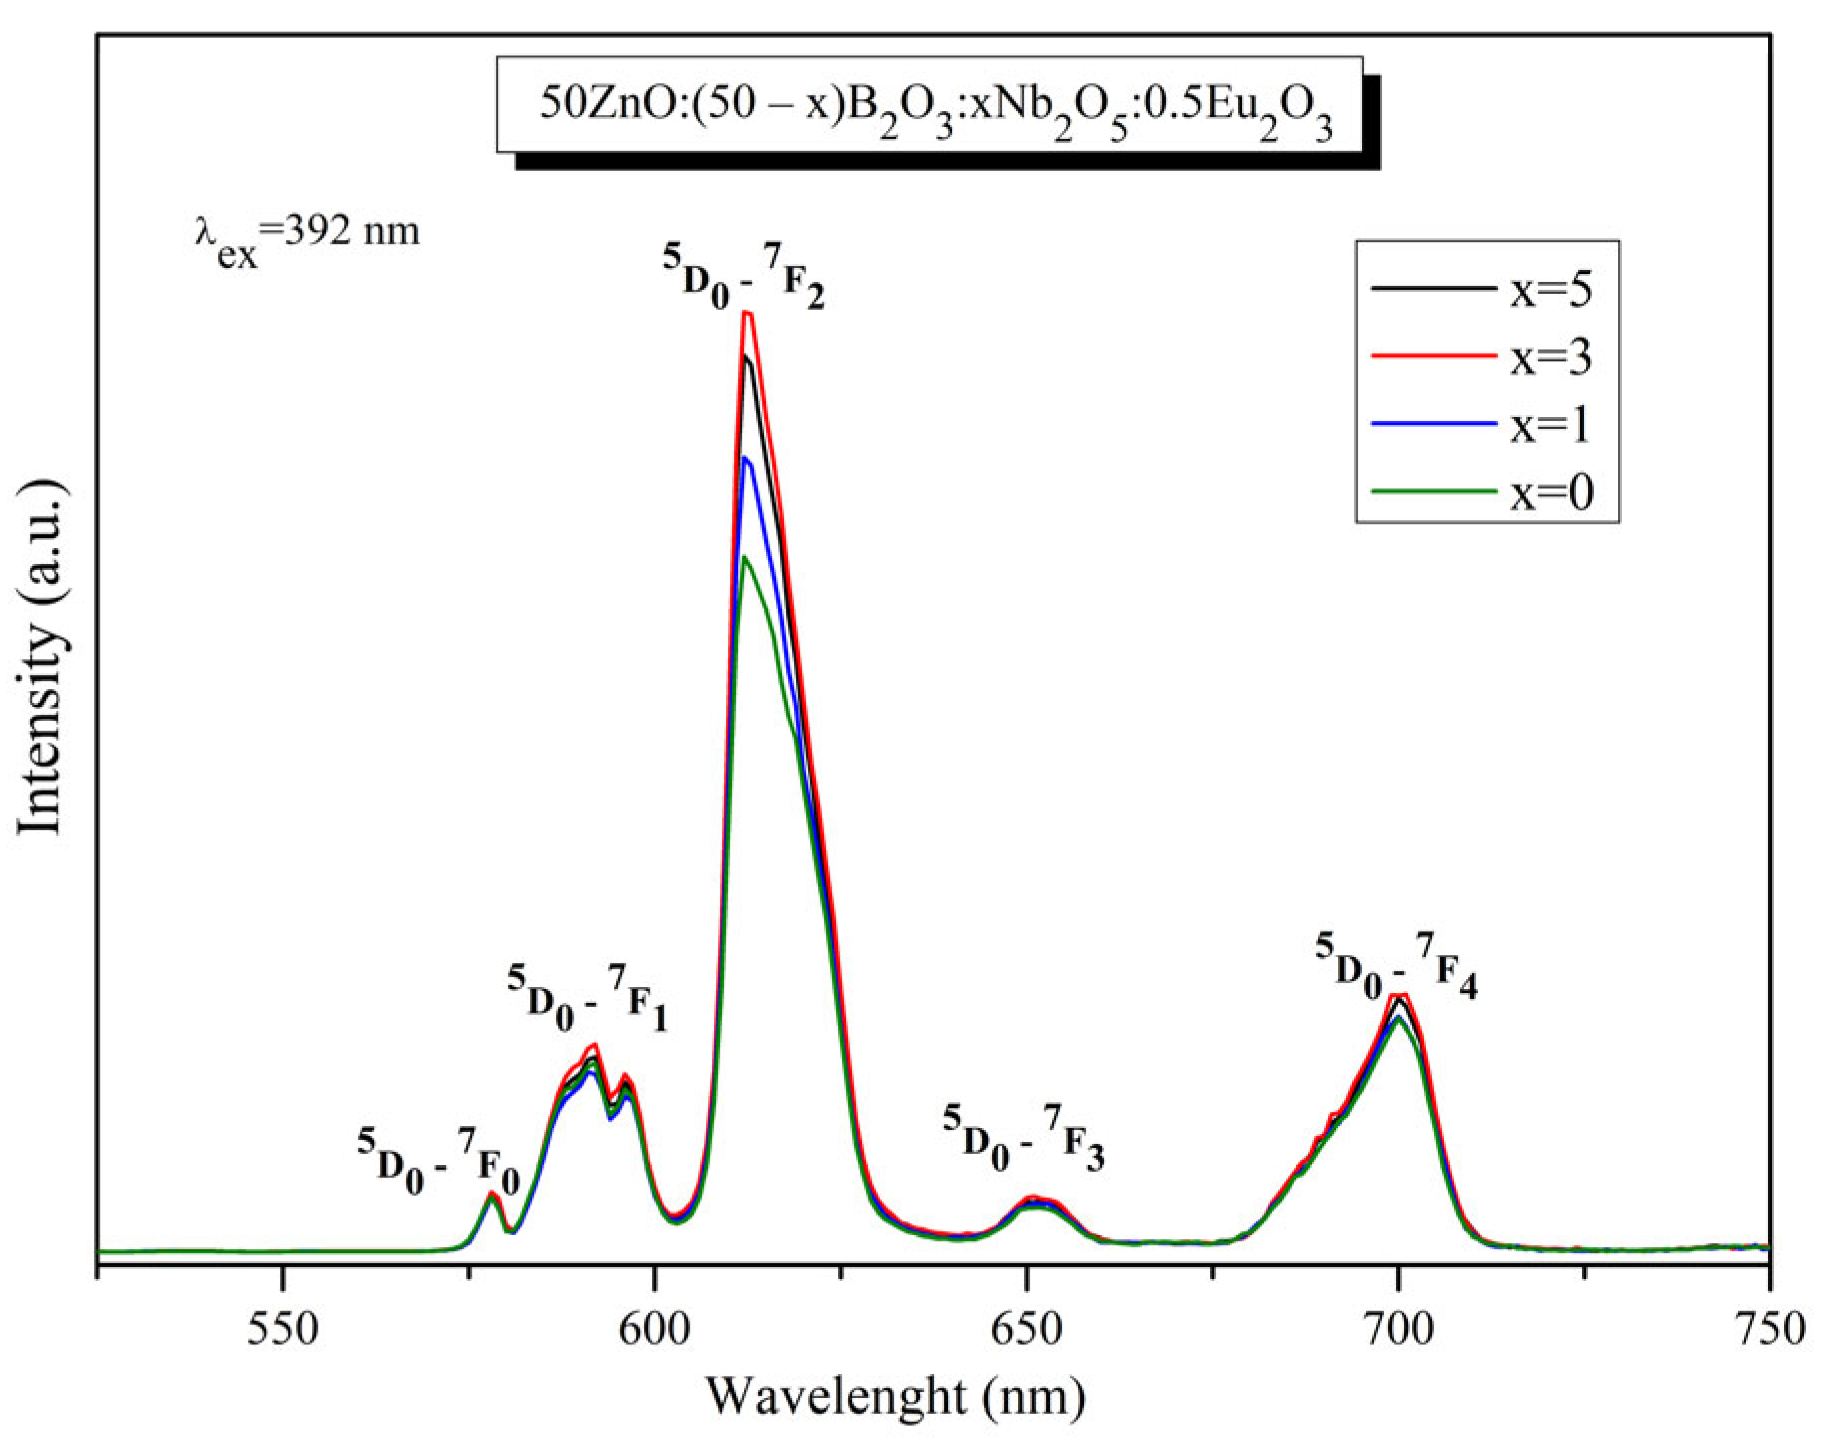
3.8. Luminescent Properties
CIE Color Coordinates and CCT (K) Values
4. Discussion
5. Conclusions
Author Contributions
Funding
Institutional Review Board Statement
Informed Consent Statement
Data Availability Statement
Conflicts of Interest
References
- Sontakke, A.D.; Tarafder, A.; Biswas, K.; Annapurna, K. Sensitized red luminescence from Bi3+ co-doped Eu3+: ZnO–B2O3 glasses. Phys. B Condens. Matter. 2009, 404, 3525–3529. [Google Scholar] [CrossRef]
- Devi, C.H.B.; Mahamuda, S.; Swapna, K.; Venkateswarlu, M.; Rao, A.S.; Prakash, G.V. Compositional dependence of red luminescence from Eu3+ ions doped single and mixed alkali fluoro tungsten tellurite glasses. Opt. Mater. 2017, 73, 260–267. [Google Scholar] [CrossRef]
- Rajaramakrishna, R.; Nijapai, P.; Kidkhunthod, P.; Kim, H.J.; Kaewkhao, J.; Ruangtaweep, Y. Molecular dynamics simulation and luminescence properties of Eu3+ doped molybdenum gadolinium borate glasses for red emission. J. Alloys Comp. 2020, 813, 151914. [Google Scholar] [CrossRef]
- Rakpanicha, S.; Wantanab, N.; Kaewkhao, J. Development of bismuth borosilicate glass doped with Eu3+ for reddish orange emission materials application. Mater. Today Proc. 2017, 4, 6389–6396. [Google Scholar] [CrossRef]
- Lakshminarayana, G.; Wagh, A.; Kamath, S.D.; Dahshan, A.; Hegazy, H.H.; Marzec, M.; Kityk, I.V.; Lee, D.; Yoon, J.; Park, T. Eu3+-doped fluoro-telluroborate glasses as red-emitting components for W-LEDs application. Opt. Mater. 2020, 99, 109555. [Google Scholar] [CrossRef]
- Balda, R.; Fernàndez, J.; Lacha, L.M.; Arriandiaga, M.A.; Fernàndez-Navarro, J.M. Energy transfer studies in Eu3+-doped lead–niobium–germanate glasses. Opt. Mater. 2005, 27, 1776–1780. [Google Scholar] [CrossRef]
- Bilir, G.; Ertap, H.; Ma, L.; Di Bartolo, B. Infrared to visible upconversion emission in Nb2O5 modified tellurite glasses triply doped with rare earth ions. Mater. Res. Express. 2019, 6, 085203–0852214. [Google Scholar] [CrossRef]
- Marcondes, L.M.; Maestri, S.; Sousa, B.; Gonçalves, R.R.; Cassanjes, F.C.; Poirier, G.Y. High niobium oxide content in germanate glasses: Thermal, structural, and optical properties. J. Am. Ceram. Soc. 2018, 101, 220–230. [Google Scholar] [CrossRef]
- Chen, Q. Nb2O5 improved photoluminescence, magnetic, and Faraday rotation properties of magneto-optical glasses. J. Non-Cryst. Solids 2019, 519, 119451. [Google Scholar] [CrossRef]
- Iordanova, R.; Milanova, M.; Aleksandrov, L.; Shinozaki, K.; Komatsu, T. Structural study of WO3-La2O3-B2O3-Nb2O5 glasses. J. Non-Cryst. Solids 2020, 543, 120132. [Google Scholar] [CrossRef]
- Komatsu, T.; Honma, T.; Tasheva, T.; Dimitrov, V. Structural role of Nb2O5 in glass-forming ability, electronic polarizability and nanocrystallization in glasses: A review. J. Non-Cryst. Solids 2022, 581, 121414. [Google Scholar] [CrossRef]
- Siva Sesha Reddy, A.; Ingram, A.; Brik, M.G.; Kostrzewa, M.; Bragiel, P.; Kumar, V.R.; Veeraiah, N. Insulating characteristics of zinc niobium borate glass-ceramics. J. Am. Ceram. Soc. 2017, 100, 4066–4080. [Google Scholar] [CrossRef]
- Barbosa, A.J.; Dias Filho, F.A.; Maia, L.J.Q.; Messaddeq, Y.; Ribeiro, S.J.L.; Gonçalves, R.R. Er3+ doped phosphoniobate glasses and planar waveguides: Structural and optical properties. J. Phys. Condens. Matter 2008, 20, 285224. [Google Scholar] [CrossRef]
- Cottrell, T.L. The Strength of Chemical Bonds, 2nd ed.; Butterworth: London, UK, 1958. [Google Scholar]
- Topper, B.; Möncke, D.; Youngman, R.E.; Valvi, C.; Kamitsos, E.I.; Varsamis, C.P. Zinc borate glasses: Properties, structure and modelling of the composition-dependence of borate speciation. Phys. Chem. Chem. Phys. 2023, 25, 5967–5988. [Google Scholar] [CrossRef]
- Yao, Z.Y.; Möncke, D.; Kamitsos, E.I.; Houizot, P.; Célarié, F.; Rouxel, T.; Wondraczek, L. Structure and mechanical properties of copper–lead and copper–zinc borate glasses. J. Non-Cryst. Solids 2016, 435, 55–68. [Google Scholar] [CrossRef]
- Kamitsos, E.I.; Karakassides, M.A.; Chryssikos, G.D. Vibrational Spectra of Magnesium-Sodium-Borate Glasses. 2. Raman and Mid-Infrared Investigation of the Network Structure. J. Phys. Chem. 1987, 91, 1073–1079. [Google Scholar] [CrossRef]
- Milanova, M.; Aleksandrov, L.; Yordanova, A.; Iordanova, R.; Tagiara, N.S.; Herrmann, A.; Gao, G.; Wondraczek, L.; Kamitsos, E.I. Structural and luminescence behavior of Eu3+ ions in ZnO-B2O3-WO3 glasses. J. Non-Cryst. Solids 2023, 600, 122006. [Google Scholar] [CrossRef]
- Aronne, A.; Sigaev, V.N.; Champagnon, B.; Fanelli, E.; Califano, V.; Usmanova, L.Z.; Pernice, P. The origin of nanostructuring in potassium niobosilicate glasses by Raman and FTIR spectroscopy. J. Non-Cryst. Solids 2005, 351, 3610–3618. [Google Scholar] [CrossRef]
- Jeng, J.M.; Wachs, I.E. Structural chemistry and Raman spectra of niobium oxides. Chem. Mater. 1991, 3, 100–107. [Google Scholar] [CrossRef]
- Pradhan, A.K.; Choudhary, R.N.P. Vibrational spectra of rare earth orthoniobates. Phys. Stat. Sol. B. 1987, 143, K161–K166. [Google Scholar] [CrossRef]
- Cardinal, T.; Fargin, E.; Couszi, M.; Canioni, L.; Segonds, P.; Sarger, L.; Ducasse, A.; Adamietz, F. Non-linear optical properties of some niobium oxide (V) glasses. Eur. J. Solid State Chem. 1996, 33, 597–605. [Google Scholar]
- Ptak, M.; Pilarek, B.; Watras, A.; Godlewska, P.; Szczygieł, I.; Hanuza, J. Structural, vibrational and optical properties of Eu3+-doped Gd3NbO7 niobates-The mechanism of their structural phase transition. J. Alloys Compd. 2019, 810, 151892. [Google Scholar] [CrossRef]
- Fukumi, K.; Sakka, S. Coordination states of Nb5+ ions in silicate and gallate glasses as studied by Raman spectroscopy. J. Mater. Sci. 1998, 23, 2819–2823. [Google Scholar] [CrossRef]
- Varsamis, C.P.E.; Makris, N.; Valvi, C.; Kamitsos, E.I. Short-range structure, the role of bismuth and property-structure correlarion in bismuth borate glasses. Phys. Chem. Chem. Phys. 2021, 23, 10006–10020. [Google Scholar] [CrossRef]
- Tatsumisago, M.; Hamada, A.; Minami, T.; Tanaka, M. Infrared spectra of rapidly quenched glasses in the systems Li2O-RO-Nb2O5 (R = Ba, Ca, Mg). J. Am. Ceram Soc. 1982, 66, 117–119. [Google Scholar] [CrossRef]
- Blasse, G.G.; Van den Heuvel, G. Vibrational spectra of some oxidic niobates. Z. fur Phys. 1973, 84, 114–120. [Google Scholar] [CrossRef]
- Villegas, M.A.; Fernández Navarro, J.M. Physical and structural properties of glasses in the TeO2–TiO2–Nb2O5 system. J. Eur. Ceram. Soc. 2007, 27, 2715–2723. [Google Scholar] [CrossRef]
- Zhongcai, W.; Bingkai, S.; Shizhuo, W.; Hanxing, L. Investigation of the network structure of niobium borate glasses. J. Non-Cryst. Solids 1986, 80, 160–166. [Google Scholar] [CrossRef]
- Tauc, J. Amorphous and Liquid Semiconductor; Plenum Press: London, UK; New York, NY, USA, 1974. [Google Scholar]
- Rani, S.; Sanghi, S.; Ahlawat, N.; Agarwal, A. Influence of Bi2O3 on thermal, structural and dielectric properties of lithium zinc bismuth borate glasses. J. Alloys Compd. 2014, 597, 110–118. [Google Scholar] [CrossRef]
- Brodbeck, M.; Iton, L.E. The EPR spectra of Gd3+ and Eu3+ in glassy systems. J. Chem. Phys. 1985, 83, 4285–4299. [Google Scholar] [CrossRef]
- Nandyala, S.; Hungerford, G.; Babu, S.; Rao, J.L.; Leonor, I.B.; Pires, R.; Reis, R.L. Time resolved emission and electron paramagnetic resonance studies of Gd3+ doped calcium phosphate glasses. Adv. Mater. Lett. 2016, 7, 277–281. [Google Scholar] [CrossRef]
- Binnemans, K. Interpretation of europium (III) spectra. Coord. Chem. Rev. 2015, 295, 1–45. [Google Scholar] [CrossRef]
- Blasse, G.; Grabmaier, B.C. Luminescent Materials, 1st ed.; Springer: Berlin/Heidelber, Germany, 1994; p. 18. [Google Scholar]
- Hoefdraad, H.E. The charge-transfer absorption band of Eu3+ in oxides. J. Solid State Chem. 1975, 15, 175–177. [Google Scholar] [CrossRef]
- Parchur, A.K.; Ningthoujam, R.S. Behaviour of electric and magnetic dipole transitions of Eu3+,5D0→7F0 and Eu-O charge transfer band in Li+ co-doped YPO4:Eu3+. RSC Adv. 2012, 2, 10859–10868. [Google Scholar] [CrossRef]
- Mariselvam, K.; Liu, J. Synthesis and luminescence properties of Eu3+ doped potassium titano telluroborate (KTTB) glasses for red laser applications. J. Lumin. 2021, 230, 117735. [Google Scholar] [CrossRef]
- Nimpoeno, W.A.; Lintang, H.O.; Yuliati, L. Zinc oxide with visible light photocatalytic activity originated from oxygen vacancy defects. IOP Conf. Ser. Mater. Sci. Eng. 2020, 833, 012080. [Google Scholar] [CrossRef]
- Zeng, H.; Song, J.; Chen, D.; Yuan, S.; Jiang, X.; Cheng, Y.; Chen, G. Three-photon-excited upconversion luminescence of niobium ions doped silicate glass by a femtosecond laser irradiation. Opt. Express 2008, 16, 6502–6506. [Google Scholar] [CrossRef] [PubMed]
- Nogami, M.; Umehara, N.; Hayakawa, T. Effect of hydroxyl bonds on persistent spectral hole burning in Eu3+ doped BaO-P2O5 glasses. Phys. Rev. B 1998, 58, 6166–6171. [Google Scholar] [CrossRef]
- Aleksandrov, L.; Milanova, M.; Yordanova, A.; Iordanova, R.; Nedyalkov, N.; Petrova, P.; Tagiara, N.S.; Palles, D.; Kamitsos, E.I. Synthesis, structure and luminescence properties of Eu3+-doped 50ZnO.40B2O3.5WO3.5Nb2O5 glass. Phys. Chem. Glas. Eur. J. Glass Sci. Technol. B 2023, 64, 101–109. [Google Scholar]
- Barbosa, J.S.; Batista, G.; Danto, S.; Fargin, E.; Cardinal, T.; Poirier, G.; Castro Cassanjes, F. Transparent glasses and glass-ceramics in the ternary system TeO2-Nb2O5-PbF2. Materials 2021, 14, 317. [Google Scholar] [CrossRef]
- Praveena, R.; Venkatramu, V.; Babu, P.; Jayasankar, C.K.; Tröster, T.; Sievers, W.; Wortmann, G. Pressure dependent luminescence properties of Eu3+: TeO2-K2O-Nb2O5 glass. J. Phys. Conf. Ser. 2008, 121, 042015. [Google Scholar] [CrossRef]
- Babu, S.S.; Jang, K.; Cho, E.J.; Lee, H.; Jayasankar, C.K. Thermal, structural and optical properties of Eu3+ doped zinc-tellurite glasses. J. Phys. D Appl. Phys. 2007, 40, 5767. [Google Scholar] [CrossRef]
- Bettinelli, M.; Speghini, A.; Ferrari, M.; Montagna, M. Spectroscopic investigation of zinc borate glasses doped with trivalent europium ions. J. Non-Cryst. Solids 1996, 201, 211–221. [Google Scholar] [CrossRef]
- Oomen, E.W.J.L.; Van Dongen, A.M.A. Europium (III) in oxide glasses: Dependence of the emission spectrum upon glass composition. J. Non-Cryst. Solids 1989, 111, 205–213. [Google Scholar] [CrossRef]
- Kumar, A.; Rai, D.K.; Rai, S.B. Optical studies of Eu3+ ions doped in tellurite glass. Spectrochim. Acta A Mol. Biomol. Spectrosc. 2002, 58, 2115–2125. [Google Scholar] [CrossRef] [PubMed]
- Binnemans, K.; Görller-Walrand, C. Application of the Eu3+ ion for site symmetry determination. J. Rare Earths 1996, 14, 173–180. [Google Scholar]
- Smith, T.; Guild, J. The CIE colorimetric standards and their use. Trans. Opt. Soc. 1931, 33, 73. [Google Scholar] [CrossRef]
- Paolini, T.B. SpectraChroma (Version 1.0.1) [Computer Software]. 2021. Available online: https://zenodo.org/records/4906590 (accessed on 7 June 2021).
- Trond, S.S.; Martin, J.S.; Stanavage, J.P.; Smith, A.L. Properties of Some Selected Europium—Activated Red Phosphors. J. Electrochem. Soc. 1969, 116, 1047–1050. [Google Scholar] [CrossRef]
- McCamy, C.S. Correlated color temperature as an explicit function of chromaticity coordinates. Color Res. Appl. 1992, 17, 142–144. [Google Scholar] [CrossRef]


| Peak # | Peak Position, cm−1 | Band Assignment | Ref. | |||
|---|---|---|---|---|---|---|
| 0% Nb2O5 | 1% Nb2O5 | 3% Nb2O5 | 5% Nb2O5 | |||
| 1 | 566 | 602 | 591 | - | Bending modes of various trigonal borate units. | [15,18] |
| 2 | 646 | 641 | - | 668 | Bending modes of various trigonal borate units. | [15,18] |
| 3 | 700 | 715 | 717 | 720 | Bending modes of various trigonal borate units. | [15,18] |
| 4 | 841 | - | - | - | B-O stretching modes of [BØ]− from ring type superstructures containing one or two tetrahedral boron sites + νas of tetrahedral metaborate groups. | [15] |
| 5 | 936 | - | - | - | B-O stretching modes of [BØ]− from ring type superstructures containing one or two tetrahedral boron sites + νas of tetrahedral metaborate groups. | [15] |
| 6 | 1025 | 1031 | 1034 | 1005 | B-O stretching modes of [BØ]− from ring type superstructures containing one or two tetrahedral boron sites + νas of tetrahedral metaborate groups. | [15] |
| 7 | 1105 | 1111 | 1111 | 1101 | B-O stretching modes of [BØ]− from ring type superstructures containing one or two tetrahedral boron sites + νas of tetrahedral metaborate groups. | [15] |
| 8 | 1236 | 1236 | 1228 | - | Stretching vibrations of BØ3 triangles involved in various ring type superstructural borate groups (boroxol rings, tri-,tetra- and pentaborates). | [15,18] |
| 9 | 1313 | - | - | - | B-O− stretch in pyroborate units. | [25] |
| 10 | 1387 | 1371 | 1398 | 1383 | Stretching vibrations of non-bridging B-O− bonds in metaborate units, BØ2O−. | [10,15] |
| 11 | 1472 | 1459 | 1462 | 1466 | Stretching vibrations of non-bridging B-O− bonds in metaborate units, BØ2O−. | [10,15] |
| 12 | 1535 | 1519 | 1508 | 1520 | Stretching of B-Ø bonds in neutral BØ3 triangles. | [25] |
| 13 | - | 480 | 481 | 479 | Stretching vibrations of NbO6. | [23,27] |
| 14 | - | 681 | 680 | 692 | ν3 asymmetric stretching vibrations of NbO6. | [10] |
| 15 | - | 825 | 825 | 827 | Vibrations of Nb-O-Nb bonding in chains of corner shared NbO6 groups. | [10] |
| 16 | - | 876 | 876 | 877 | ν1 symmetric mode of short Nb-O bonds in distorted NbO6 and NbO4 units. | [10] |
| 17 | - | 1197 | 1179 | 1180 | B-O-B stretch in pyroborate units, BØO22−. | [25] |
| 18 | - | 1276 | 1284 | 1258 | ν3 asymmetric stretching mode of orthoborate groups, BO33−. | [25] |
| 19 | - | - | 628 | 629 | ν3 asymmetric stretching vibrations of NbO6. | [10,26] |
| 20 | - | 1054 | 1054 | 1049 | B-O stretching modes of [BØ]− from ring type superstructures containing one or two tetrahedral boron sites + νas of tetrahedral metaborate groups. | [15] |
| Sample ID | ρg (g/cm3) | Vm (cm3/mol) | Vo (cm3/mol) | OPD (g atom/L) | Eg (eV) |
|---|---|---|---|---|---|
| x = 0 | 3.413 ± 0.001 | 22.634 | 11.261 | 88.804 | 3.80 |
| x = 1 | 3.567 ± 0.001 | 22.208 | 10.940 | 91.408 | 3.78 |
| x = 3 | 3.663 ± 0.001 | 22.697 | 10.965 | 91.201 | 3.67 |
| x = 5 | 3.665 ± 0.001 | 23.755 | 11.258 | 88.823 | 3.66 |
| Glass Composition | Relative Luminescent Intensity Ratio, R | Reference |
|---|---|---|
| 50ZnO:50B2O3:0.5Eu2O3 | 4.31 | Present work |
| 50ZnO:49B2O3:1Nb2O3:0.5Eu2O3 | 4.89 | Present work |
| 50ZnO:47B2O3:3Nb2O3:0.5Eu2O3 | 5.16 | Present work |
| 50ZnO:45B2O3:5Nb2O3:0.5Eu2O3 | 5.11 | Present work |
| 50ZnO:40B2O3:10WO3:xEu2O3 (0 ≤ x≤ 10) | 4.54–5.77 | [18] |
| 50ZnO:40B2O3:5WO3:5Nb2O5:xEu2O3 (0 ≤ x ≤ 10) | 5.09–5.76 | [42] |
| (100 − y)TeO2-10Nb2O5-yPbF2 (0 ≤ y ≤ 30) | 2–4.16 | [43] |
| 69TeO2:1K2O:15Nb2O5:1.0Eu2O3 | 5 | [44] |
| 60TeO2:19ZnO:7.5Na2O:7.5Li2O:5Nb2O5:1Eu2O3 | 3.73 | [45] |
| 4ZnO:3B2O3:0.5–2.5 mol% Eu3+ | 3.94–2.74 | [46] |
| (99.5 − x):B2O3:xLi2O:0.5Eu2O3 | 2.41–3.40 | [47] |
| (64 − x)GeO2:xSiO2:16K2O:6BaO:4Eu2O3 | 3.42–4.07 | [47] |
| (98 − x)P2O5:xCaO:2Eu2O3 | 3.88–3.95 | [47] |
| 79TeO2 + 20Li2CO3 + 1Eu2O3 | 4.28 | [48] |
| Glass Composition | Chromaticity Coordinates (x, y) | CCT (K) |
|---|---|---|
| 50ZnO:B2O3:0.5Eu2O3 (x = 0) | (0.645, 0.346) | 2301.26 |
| 50ZnO:49B2O3:1Nb2O3:0.5Eu2O3 (x = 1) | (0.656, 0.344) | 2479.99 |
| 50ZnO:47B2O3:3Nb2O3:0.5Eu2O3 (x = 3) | (0.656, 0.343) | 2505.78 |
| 50ZnO:45B2O3: 5Nb2O3:0.5Eu2O3 (x = 5) | (0.657, 0.343) | 2518.60 |
| NTSC standard for red phosphors | (0.67, 0.33) | |
| Y2O2S:Eu3+ | (0.658, 0.340) |
Disclaimer/Publisher’s Note: The statements, opinions and data contained in all publications are solely those of the individual author(s) and contributor(s) and not of MDPI and/or the editor(s). MDPI and/or the editor(s) disclaim responsibility for any injury to people or property resulting from any ideas, methods, instructions or products referred to in the content. |
© 2024 by the authors. Licensee MDPI, Basel, Switzerland. This article is an open access article distributed under the terms and conditions of the Creative Commons Attribution (CC BY) license (https://creativecommons.org/licenses/by/4.0/).
Share and Cite
Iordanova, R.; Milanova, M.; Yordanova, A.; Aleksandrov, L.; Nedyalkov, N.; Kukeva, R.; Petrova, P. Structure and Luminescent Properties of Niobium-Modified ZnO-B2O3:Eu3+ Glass. Materials 2024, 17, 1415. https://doi.org/10.3390/ma17061415
Iordanova R, Milanova M, Yordanova A, Aleksandrov L, Nedyalkov N, Kukeva R, Petrova P. Structure and Luminescent Properties of Niobium-Modified ZnO-B2O3:Eu3+ Glass. Materials. 2024; 17(6):1415. https://doi.org/10.3390/ma17061415
Chicago/Turabian StyleIordanova, Reni, Margarita Milanova, Aneliya Yordanova, Lyubomir Aleksandrov, Nikolay Nedyalkov, Rositca Kukeva, and Petia Petrova. 2024. "Structure and Luminescent Properties of Niobium-Modified ZnO-B2O3:Eu3+ Glass" Materials 17, no. 6: 1415. https://doi.org/10.3390/ma17061415