Figure 1.
(
a) Schematic diagram of the WAAM system; (
b) a typical thin-walled part with geometrical features [
25,
26].
Figure 1.
(
a) Schematic diagram of the WAAM system; (
b) a typical thin-walled part with geometrical features [
25,
26].
Figure 2.
Variation rules of the characteristic parameters of the 308L thin-walled single-pass deposits: (a) bead height; (b) bead depth; (c) bead width; (d) wetting angle, (e) dilution rate; (f) WAAM process parameter databases (tungsten electrode angle, welding current, and welding speed) of the 308L according to the requirements.
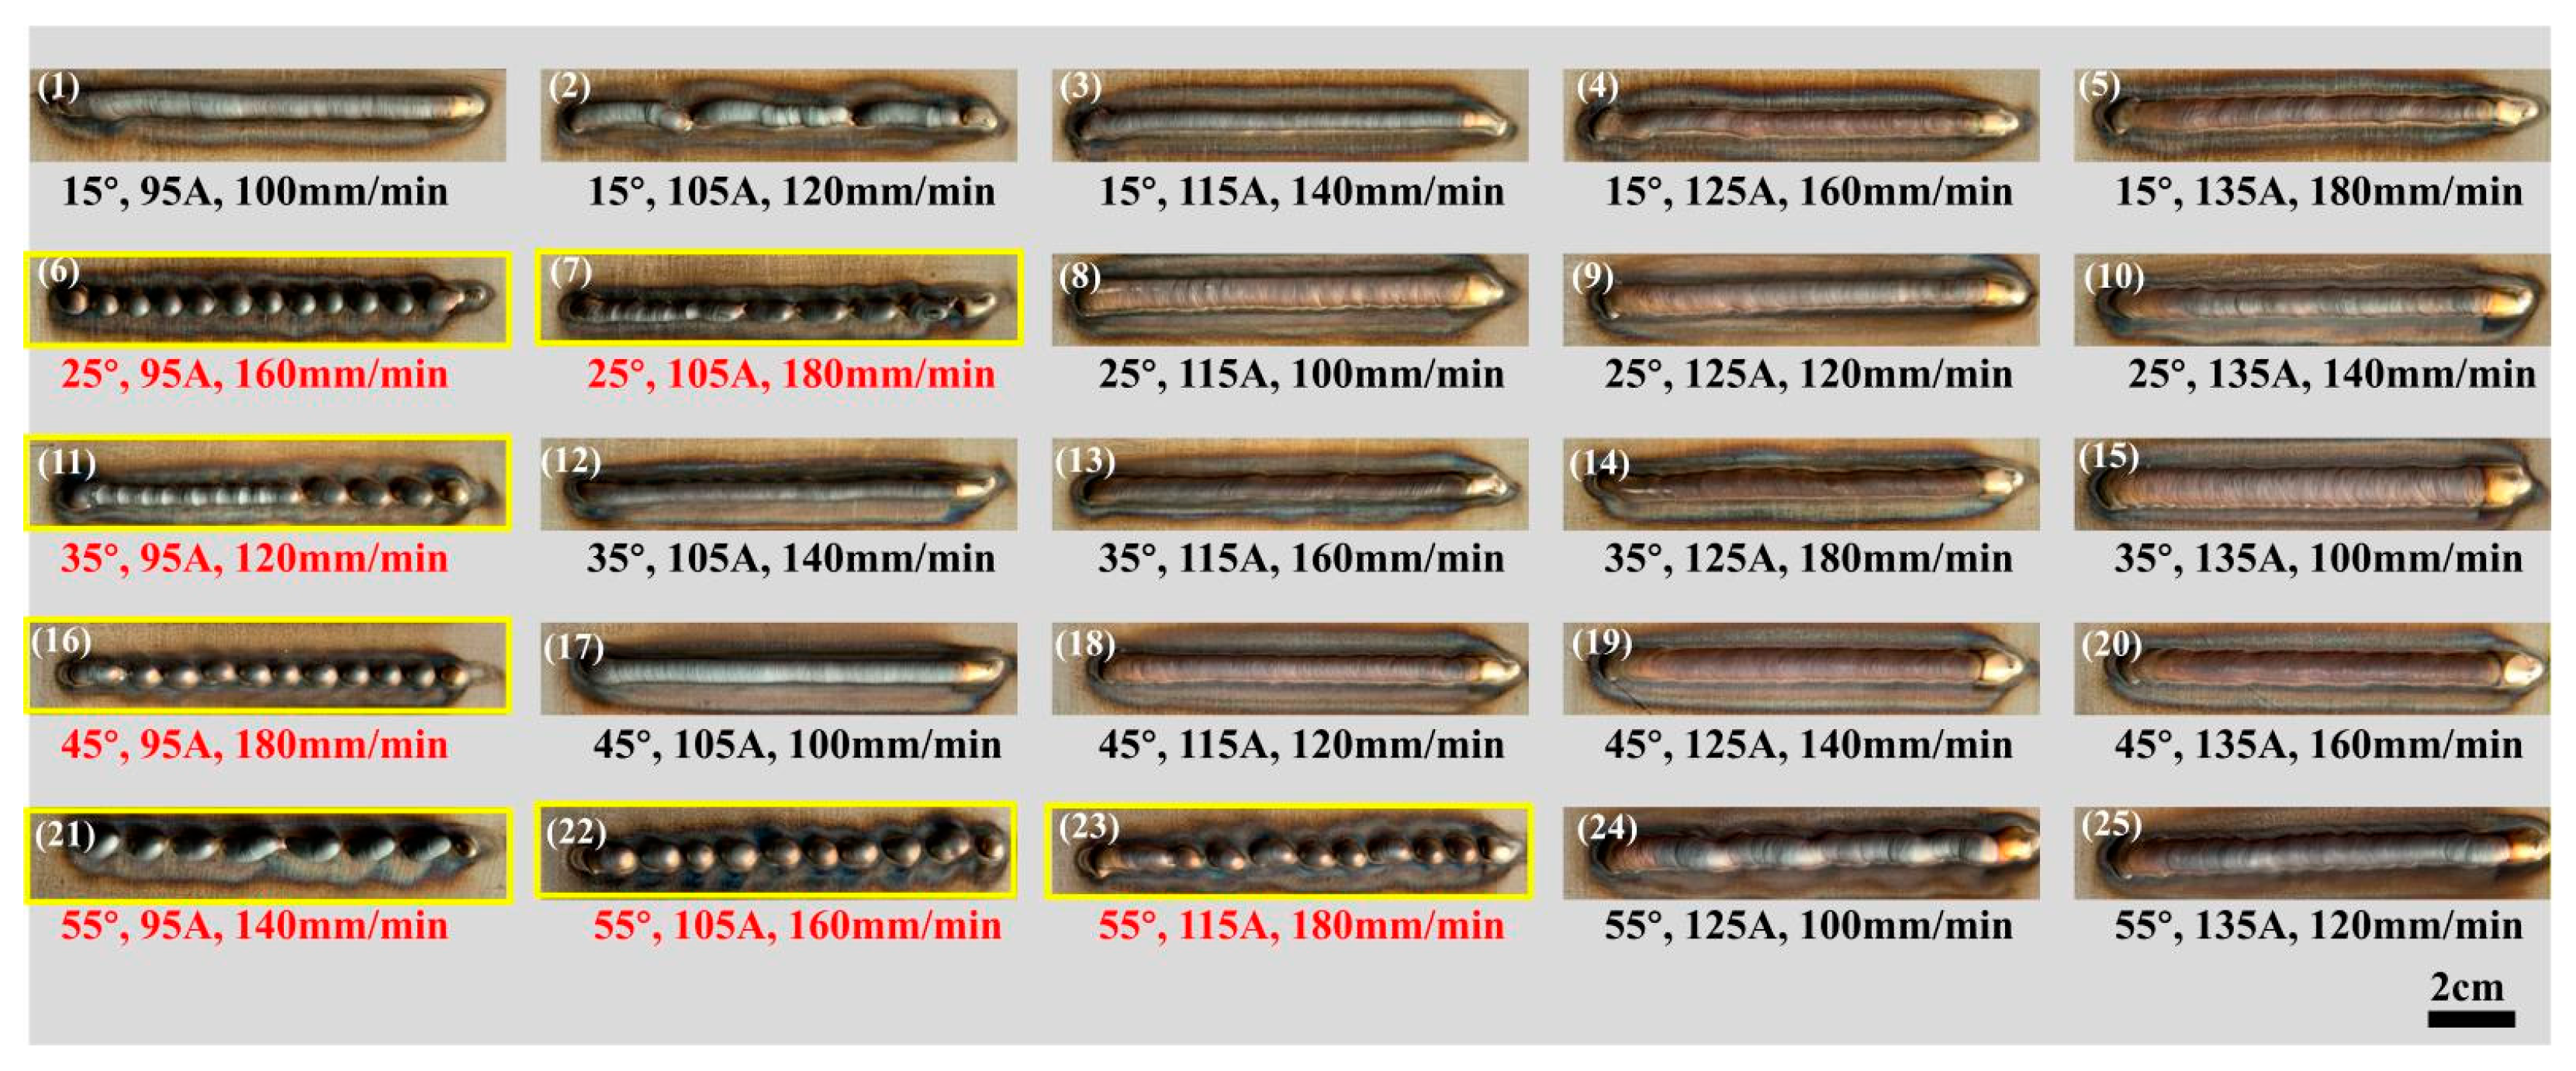
Figure 3.
CCD-based design for single-pass, single-layer weld testing.
Figure 3.
CCD-based design for single-pass, single-layer weld testing.
Figure 4.
Single layer interface with different process parameters: (a) head, (b) middle, and (c) tail.
Figure 4.
Single layer interface with different process parameters: (a) head, (b) middle, and (c) tail.
Figure 5.
Schematic diagram of the geometric characteristics of a single-pass, single-layer weld: bead height (r), bead depth (p), and bead weight (w), (a) r < p, w > r + p, (b) r ≈ p, w > r + p, (c) r > p, w > r + p, (d) r < p, w ≈ r + p, (e) the calculation method for dilution rate.
Figure 5.
Schematic diagram of the geometric characteristics of a single-pass, single-layer weld: bead height (r), bead depth (p), and bead weight (w), (a) r < p, w > r + p, (b) r ≈ p, w > r + p, (c) r > p, w > r + p, (d) r < p, w ≈ r + p, (e) the calculation method for dilution rate.
Figure 6.
(a) The effect of tungsten electrode angle on bead height, (b) the effect of welding current on bead height, (c) the effect of welding speed on bead height, (d) comparison of predicted and actual values of bead height.
Figure 6.
(a) The effect of tungsten electrode angle on bead height, (b) the effect of welding current on bead height, (c) the effect of welding speed on bead height, (d) comparison of predicted and actual values of bead height.
Figure 7.
(a) The interaction effect of tungsten electrode angle and welding current on the melt height, (b) The interaction effect of tungsten electrode angle and welding speed on the melt height, (c) The interaction effect of welding speed angle and welding current on the melt height.
Figure 7.
(a) The interaction effect of tungsten electrode angle and welding current on the melt height, (b) The interaction effect of tungsten electrode angle and welding speed on the melt height, (c) The interaction effect of welding speed angle and welding current on the melt height.
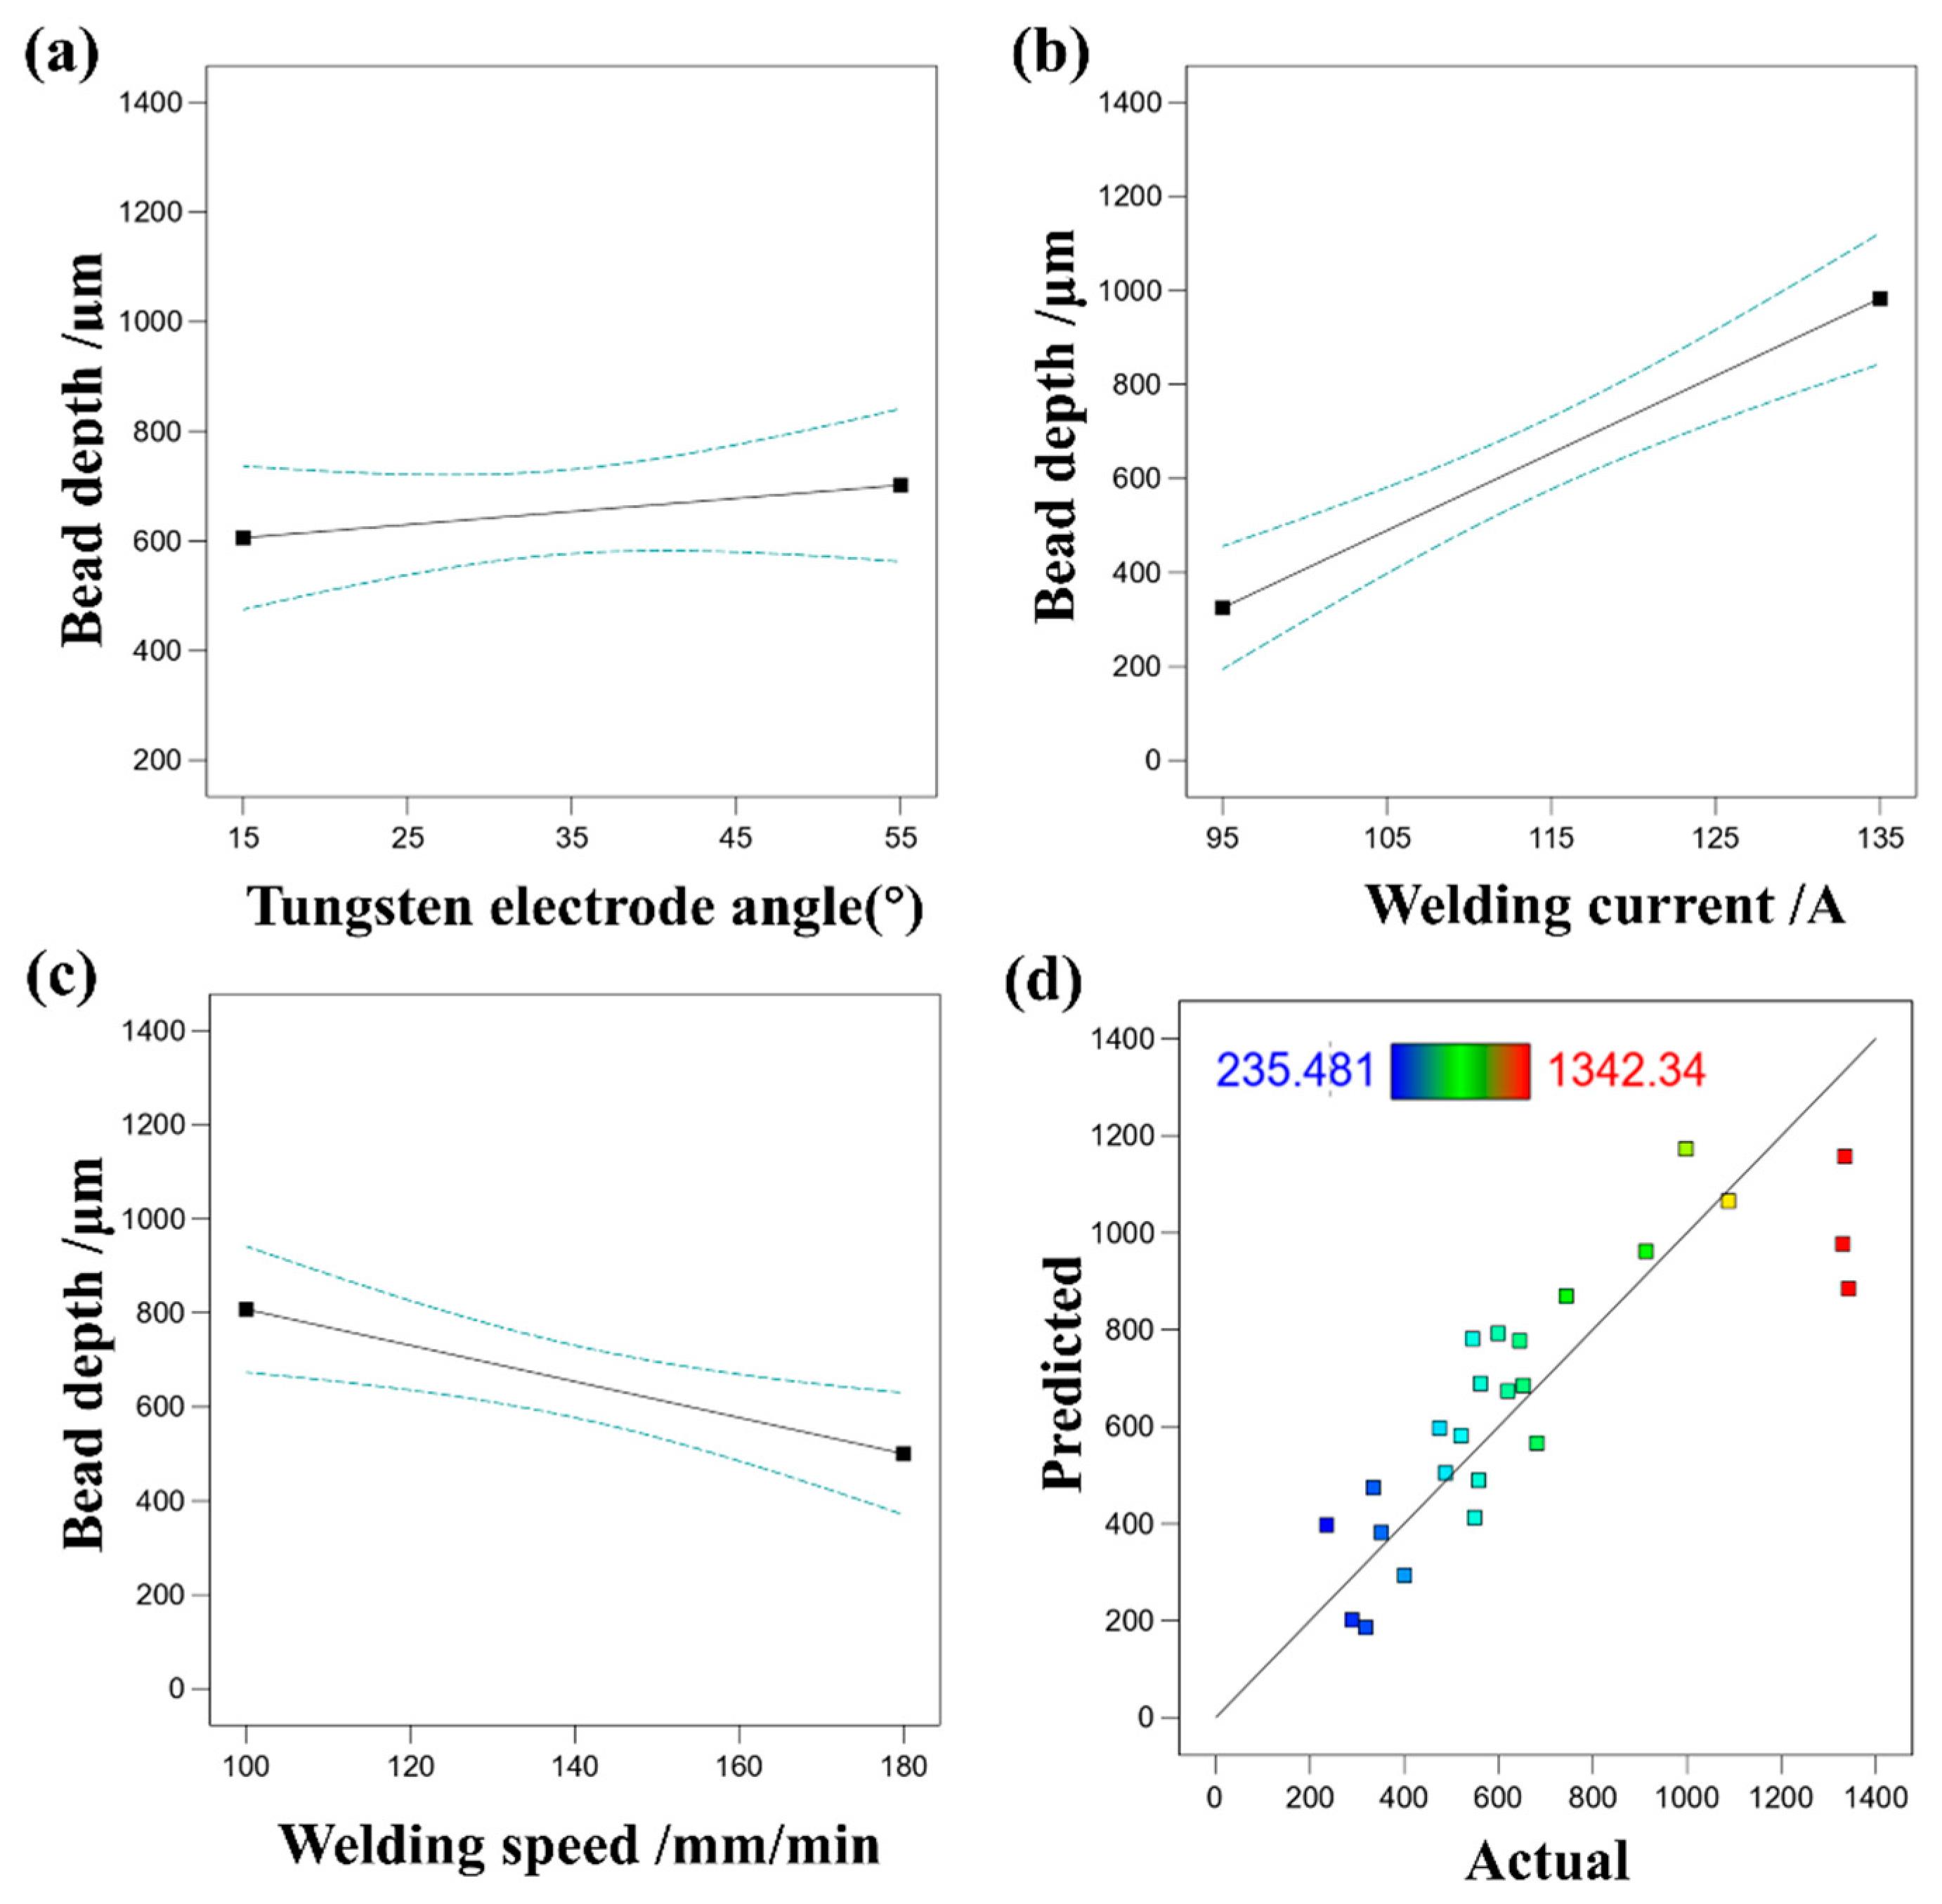
Figure 8.
(a) The effect of tungsten electrode angle on bead depth, (b) the effect of welding current on bead depth, (c) the effect of welding speed on bead depth, (d) comparison of predicted and actual values of bead depth.
Figure 8.
(a) The effect of tungsten electrode angle on bead depth, (b) the effect of welding current on bead depth, (c) the effect of welding speed on bead depth, (d) comparison of predicted and actual values of bead depth.
Figure 9.
(a) The effect of tungsten electrode angle on bead width, (b) the effect of welding current on bead width, (c) the effect of welding speed on bead width, (d) comparison of predicted and actual values of bead width.
Figure 9.
(a) The effect of tungsten electrode angle on bead width, (b) the effect of welding current on bead width, (c) the effect of welding speed on bead width, (d) comparison of predicted and actual values of bead width.
Figure 10.
(a) The effect of tungsten electrode angle on wetting angle, (b) the effect of welding current on wetting angle, (c) the effect of welding speed on wetting angle, (d) comparison of predicted and actual values of wetting angle.
Figure 10.
(a) The effect of tungsten electrode angle on wetting angle, (b) the effect of welding current on wetting angle, (c) the effect of welding speed on wetting angle, (d) comparison of predicted and actual values of wetting angle.
Figure 11.
(a) The effect of tungsten electrode angle on dilution rate, (b) the effect of welding current on dilution rate, (c) the effect of welding speed on dilution rate, (d) comparison of predicted and actual values of dilution rate.
Figure 11.
(a) The effect of tungsten electrode angle on dilution rate, (b) the effect of welding current on dilution rate, (c) the effect of welding speed on dilution rate, (d) comparison of predicted and actual values of dilution rate.
Figure 12.
Shape of single-pass single-layer welds after parameter optimization and 8 mm swing: (a) 35°/135 A/100 mm/min, (b) 35°/145 A/100 mm/min, (c) 35°/135 A/120 mm/min, (d) 35°/135 A/100 mm/min + 8 mm swing, (e) 35°/145 A/100 mm/min + 8 mm swing, (f) 35°/135 A/120 mm/min + 8 mm swing.
Figure 12.
Shape of single-pass single-layer welds after parameter optimization and 8 mm swing: (a) 35°/135 A/100 mm/min, (b) 35°/145 A/100 mm/min, (c) 35°/135 A/120 mm/min, (d) 35°/135 A/100 mm/min + 8 mm swing, (e) 35°/145 A/100 mm/min + 8 mm swing, (f) 35°/135 A/120 mm/min + 8 mm swing.
Figure 13.
(a,b) are schematic diagrams of fish scale patterns formed by non-swing process and swing process, respectively.
Figure 13.
(a,b) are schematic diagrams of fish scale patterns formed by non-swing process and swing process, respectively.
Figure 14.
Cross-sectional view of the weld after parameter optimization and swing, (a) 35°/135 A/100 mm/min, (b) 35°/145 A/100 mm/min, (c) 35°/135 A/120 mm/min, (d) 35°/135 A/100 mm/min + 8 mm swing, (e) 35°/145 A/100 mm/min + 8 mm swing, (f) 35°/135 A/120 mm/min + 8 mm swing.
Figure 14.
Cross-sectional view of the weld after parameter optimization and swing, (a) 35°/135 A/100 mm/min, (b) 35°/145 A/100 mm/min, (c) 35°/135 A/120 mm/min, (d) 35°/135 A/100 mm/min + 8 mm swing, (e) 35°/145 A/100 mm/min + 8 mm swing, (f) 35°/135 A/120 mm/min + 8 mm swing.
Figure 15.
Macro morphology of single-pass multilayer wall forming after parameter optimization and swing, (a) 35°/135 A/100 mm/min, (b) 35°/145 A/100 mm/min, (c) 35°/135 A/120 mm/min, (d) 35°/135 A/100 mm/min + 8 mm swing, (e) 35°/145 A/100 mm/min + 8 mm swing, (f) 35°/135 A/120 mm/min + 8 mm swing.
Figure 16.
Local line roughness of single-pass multilayer walls after parameter optimization and swing, (a) 35°/135 A/100 mm/min, (b) 35°/145 A/100 mm/min, (c) 35°/135 A/120 mm/min, (d) 35°/135 A/100 mm/min + 8 mm swing, (e) 35°/145 A/100 mm/min + 8 mm swing, (f) 35°/135 A/120 mm/min + 8 mm swing.
Figure 16.
Local line roughness of single-pass multilayer walls after parameter optimization and swing, (a) 35°/135 A/100 mm/min, (b) 35°/145 A/100 mm/min, (c) 35°/135 A/120 mm/min, (d) 35°/135 A/100 mm/min + 8 mm swing, (e) 35°/145 A/100 mm/min + 8 mm swing, (f) 35°/135 A/120 mm/min + 8 mm swing.
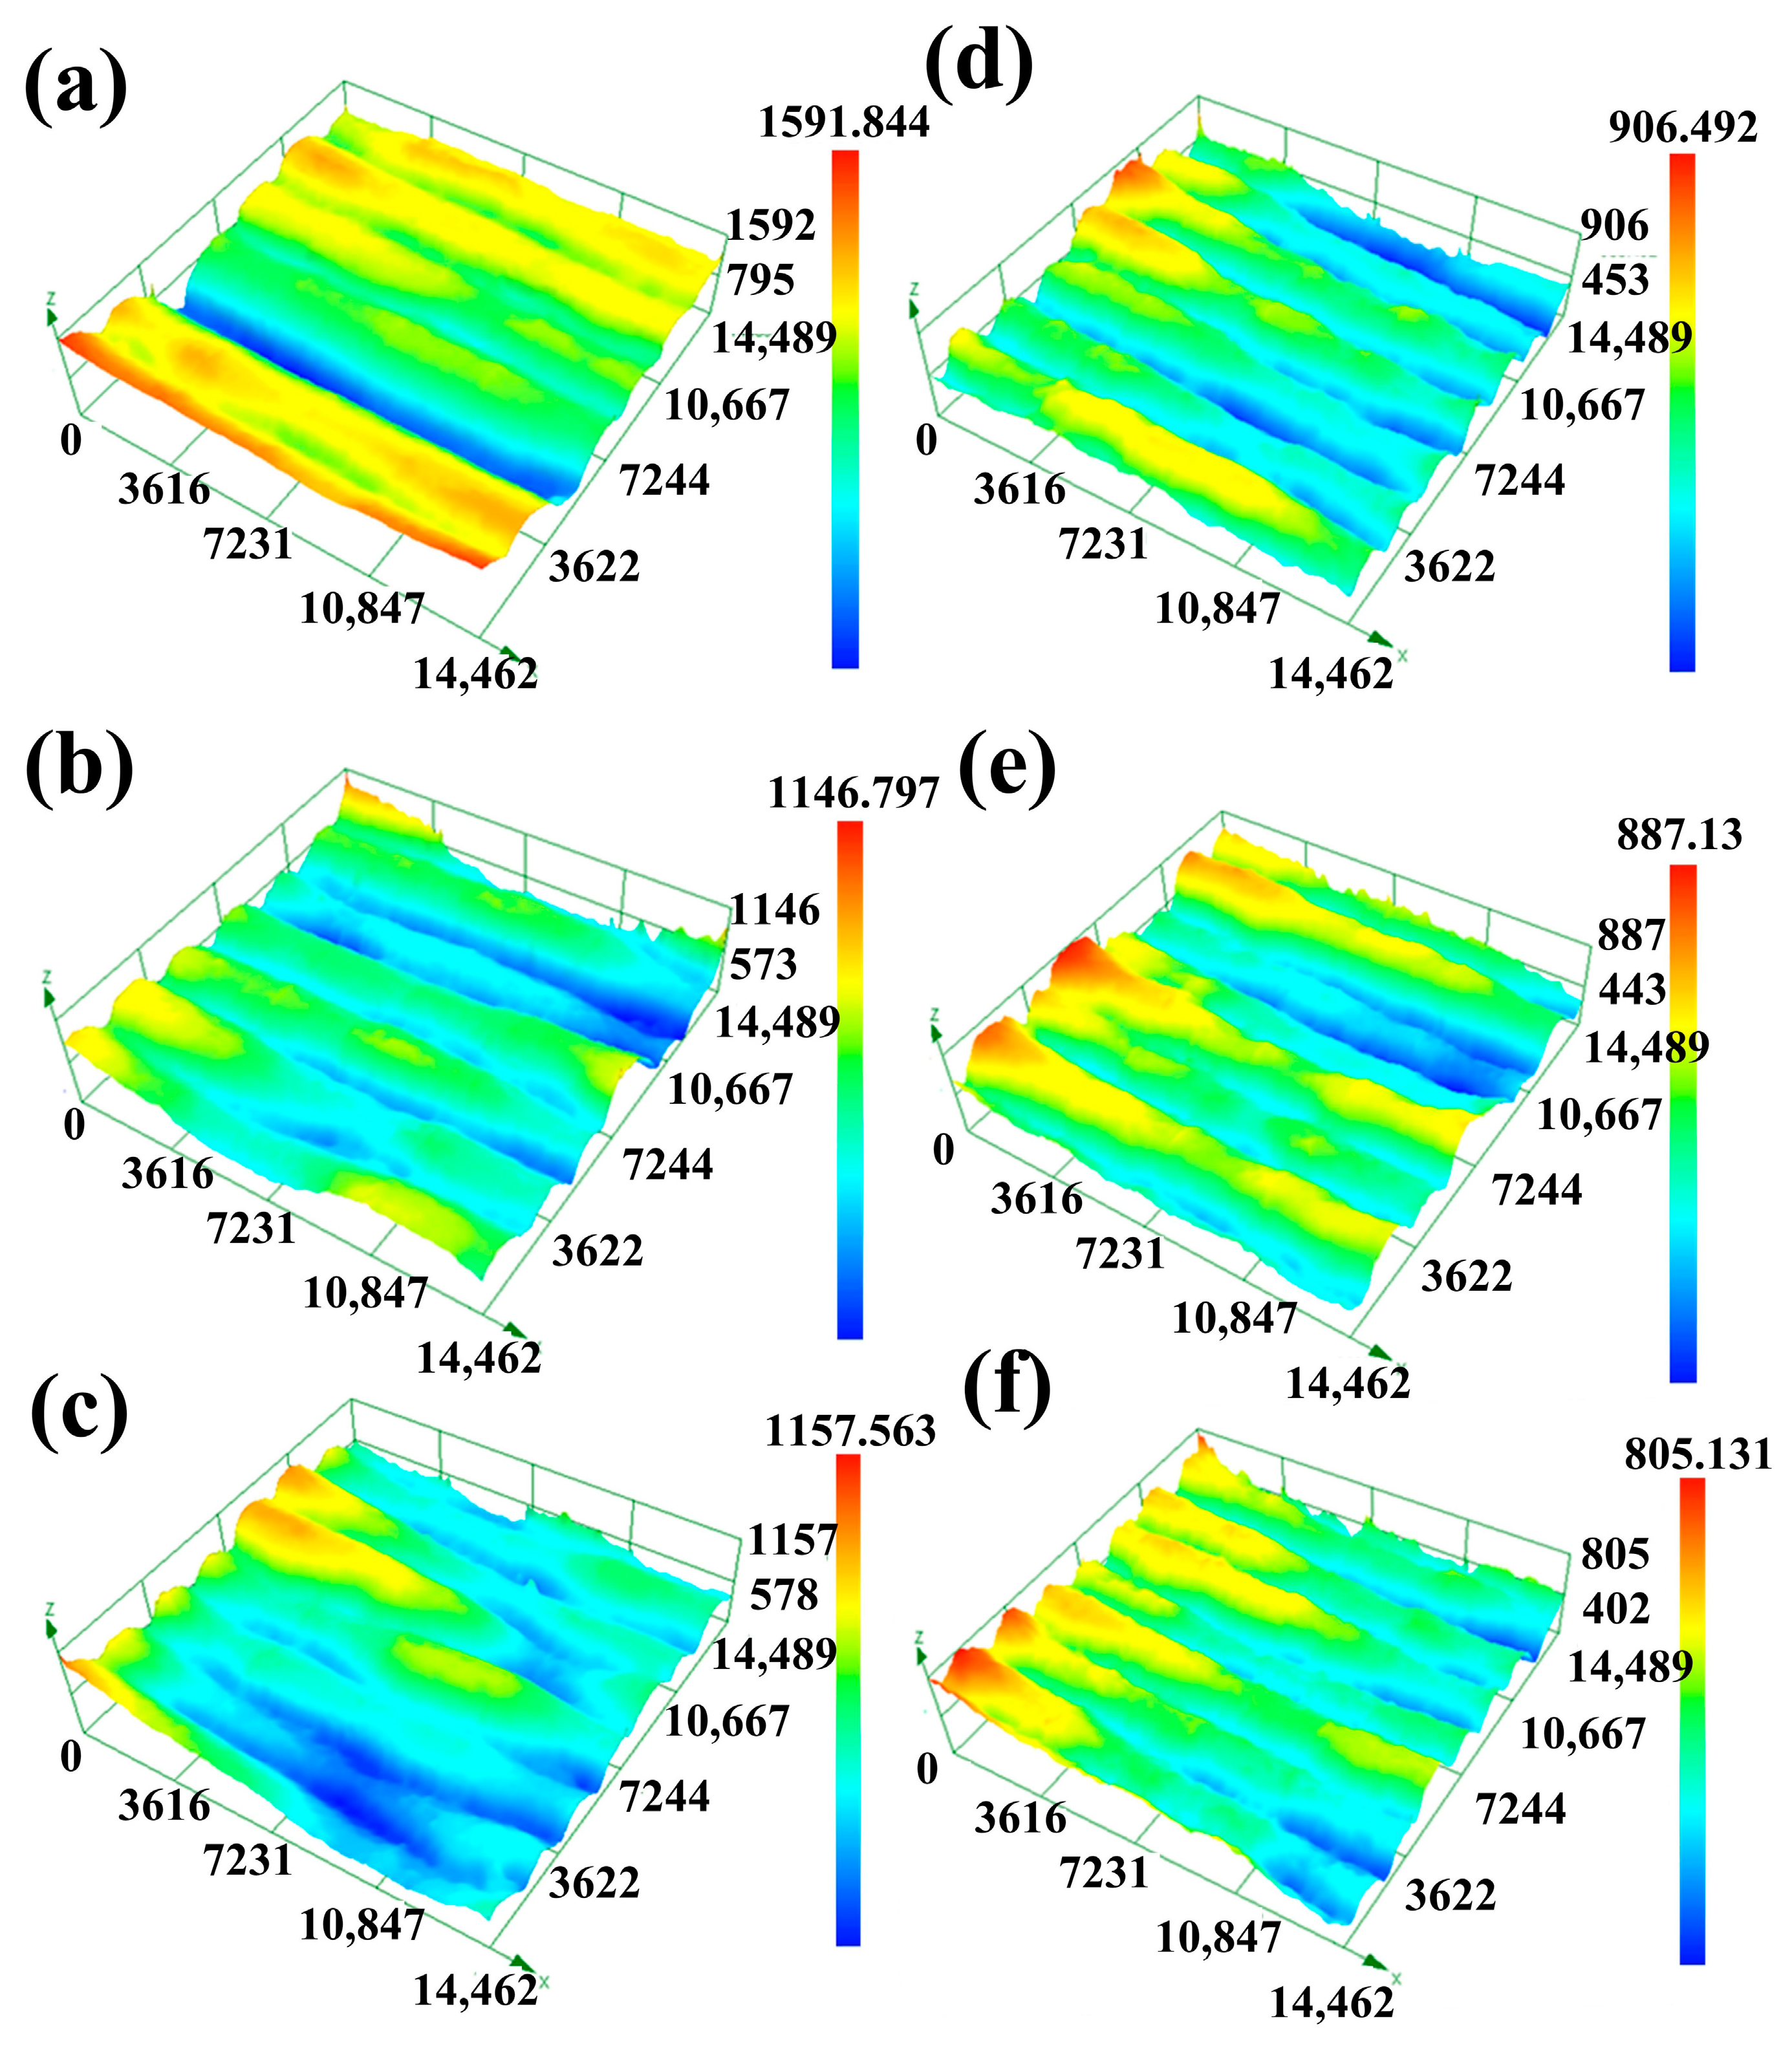
Figure 17.
Local surface morphology of single-pass multilayer walls after parameter optimization and swing, (a) 35°/135 A/100 mm/min, (b) 35°/145 A/100 mm/min, (c) 35°/135 A/120 mm/min, (d) 35°/135 A/100 mm/min + 8 mm swing, (e) 35°/145 A/100 mm/min + 8 mm swing, (f) 35°/135 A/120 mm/min + 8 mm swing.
Figure 18.
Single-pass multi-layer wall sections after parameter optimization and swing; (a) 35°/135 A/100 mm/min, (b) 35°/145 A/100 mm/min, (c) 35°/135 A/120 mm/min, (d) 35°/135 A/100 mm/min + 8 mm swing, (e) 35°/145 A/100 mm/min + 8 mm swing, (f) 35°/135 A/120 mm/min + 8 mm swing, (g) schematic of process efficiency.
Figure 19.
Schematic diagrams of non-swing and swing sections: (a) non-swing; (b) swing.
Figure 19.
Schematic diagrams of non-swing and swing sections: (a) non-swing; (b) swing.
Figure 20.
Height of single-pass multilayer wall after parameter optimization and swing (a) and forming efficiency (b), the figure caption (a–f) are respectively: (a) 35°/135 A/100 mm/min, (b) 35°/145 A/100 mm/min, (c) 35°/135 A/120 mm/min, (d) 35°/135 A/100 mm/min + 8 mm swing, (e) 35°/145 A/100 mm/min + 8 mm swing, (f) 35°/135 A/120 mm/min + 8 mm swing.
Table 1.
Chemical compositions of source materials (wt.%).
Table 1.
Chemical compositions of source materials (wt.%).
| Materials | C | Mn | Si | S | P | Ni | Cr | Mo | Cu | N | Fe |
|---|
| 304 substrate | 0.05 | 1.09 | 0.45 | 0.003 | 0.032 | 8.00 | 18.08 | 0.012 | 0.14 | 0.054 | Bal. |
| 308L | 0.022 | 2.12 | 0.515 | 0.006 | 0.023 | 9.75 | 19.92 | 0.032 | 0.031 | 0 | Bal. |
Table 2.
The process parameters that remain constant during the WAAM manufacturing process.
Table 2.
The process parameters that remain constant during the WAAM manufacturing process.
| Process Parameters | Details |
|---|
| Distance of electrode to substrate | 4 mm |
| Angle of nozzle to substrate | 30° |
| Angle of nozzle to tungsten | 60° |
| Gas flow rate of GTAW torch | 15 L/min |
| Gas flow rate of trailing shield cover | 15 L/min |
| Post-argon flow duration | 5 s |
| Dwell time between layers | 120 s |
Table 3.
Variable process parameters.
Table 3.
Variable process parameters.
| Serial No. | Input Parameters | Symbols | Units | Levels | | | | |
|---|
| 1 | Tungsten electrode angle | A | ° | 15 | 25 | 35 | 45 | 55 |
| 2 | Welding current | B | A | 95 | 105 | 115 | 125 | 135 |
| 3 | Welding speed | C | mm/min | 100 | 120 | 140 | 160 | 180 |
Table 4.
CCD design scheme and the result of the response value.
Table 4.
CCD design scheme and the result of the response value.
| Serial No. | A: Factor 1 | B: Factor 2 | C: Factor 3 | Response 1 | Response 2 | Response 3 | Response 4 | Response 5 |
|---|
| | Tungsten Electrode Angle | Welding Current | Welding Speed | Bead Height | Bead Depth | Bead Width | Wetting Angle | Dilution Rate |
|---|
| | (°) | (A) | (mm/min) | (μm) | (μm) | (μm) | (°) | (%) |
|---|
| 1 | 15 | 95 | 100 | 4617.848 | 549.335 | 2878.795 | 135.924 | 4.755% |
| 2 | 15 | 105 | 120 | 4274.767 | 487.330 | 3324.733 | 126.695 | 4.338% |
| 3 | 15 | 115 | 140 | 3633.638 | 474.838 | 4058.800 | 114.996 | 6.390% |
| 4 | 15 | 125 | 160 | 2717.728 | 561.719 | 6731.990 | 66.843 | 14.511% |
| 5 | 15 | 135 | 180 | 2414.458 | 544.756 | 7202.880 | 61.706 | 14.699% |
| 6 | 25 | 95 | 160 | 4583.701 | 289.041 | 4558.627 | 113.251 | 2.829% |
| 7 | 25 | 105 | 180 | 3614.209 | 400.788 | 3659.849 | 111.559 | 4.511% |
| 8 | 25 | 115 | 100 | 3598.103 | 599.160 | 7114.498 | 86.976 | 8.197% |
| 9 | 25 | 125 | 120 | 3027.317 | 1342.338 | 6719.678 | 81.501 | 24.081% |
| 10 | 25 | 135 | 140 | 2448.061 | 1330.182 | 7153.620 | 62.860 | 32.191% |
| 11 | 35 | 95 | 120 | 4296.385 | 235.481 | 3342.230 | 117.668 | 2.496% |
| 12 | 35 | 105 | 140 | 3564.160 | 557.588 | 4522.106 | 105.016 | 8.057% |
| 13 | 35 | 115 | 160 | 3010.714 | 520.264 | 5521.721 | 82.435 | 8.688% |
| 14 | 35 | 125 | 180 | 2411.061 | 619.916 | 6910.416 | 63.019 | 16.717% |
| 15 | 35 | 135 | 100 | 3066.646 | 997.576 | 9152.847 | 68.903 | 17.977% |
| 16 | 45 | 95 | 180 | 4267.049 | 318.010 | 4230.122 | 113.386 | 3.938% |
| 17 | 45 | 105 | 100 | 4460.113 | 652.508 | 3815.834 | 122.753 | 6.653% |
| 18 | 45 | 115 | 120 | 3140.439 | 644.889 | 6398.481 | 82.586 | 15.170% |
| 19 | 45 | 125 | 140 | 2511.521 | 743.472 | 7736.503 | 63.033 | 21.663% |
| 20 | 45 | 135 | 160 | 2262.966 | 912.661 | 7948.921 | 59.236 | 28.306% |
| 21 | 55 | 95 | 140 | 4890.840 | 351.168 | 3362.547 | 133.353 | 2.728% |
| 22 | 55 | 105 | 160 | 4246.538 | 334.481 | 4888.712 | 108.007 | 4.517% |
| 23 | 55 | 115 | 180 | 3626.270 | 681.448 | 5224.573 | 97.183 | 11.127% |
| 24 | 55 | 125 | 100 | 3564.171 | 1087.386 | 7506.277 | 80.660 | 20.368% |
| 25 | 55 | 135 | 120 | 3168.731 | 1334.422 | 7647.319 | 73.923 | 27.924% |
Table 5.
ANOVA table for height of bead.
Table 5.
ANOVA table for height of bead.
| Source | Sum of Squares | df | Mean Square | F-Value | p-Value | Prob > F |
|---|
| Model | 1.459 × 10⁷ | 9 | 1.621 × 10⁶ | 39.75 | <0.0001 | significant |
| A-A | 47,639.54 | 1 | 47,639.54 | 1.17 | 0.2969 | |
| B-B | 1.047 × 10⁷ | 1 | 1.047 × 10⁷ | 256.66 | <0.0001 | |
| C-C | 9.623 × 10⁵ | 1 | 9.623 × 10⁵ | 23.59 | 0.0002 | |
| AB | 21,543.47 | 1 | 21,543.47 | 0.5282 | 0.4786 | |
| AC | 0.0567 | 1 | 0.0567 | 1.389 × 10⁻⁶ | 0.9991 | |
| BC | 2.592 × 10⁵ | 1 | 2.592 × 10⁵ | 6.36 | 0.0235 | |
| A2 | 1.002 × 10⁶ | 1 | 1.002 × 10⁶ | 24.56 | 0.0002 | |
| B2 | 1.868 × 10⁵ | 1 | 1.868 × 10⁵ | 4.58 | 0.0492 | |
| C2 | 91,353.02 | 1 | 91,353.02 | 2.24 | 0.1552 | |
| Residual | 6.118 × 10⁵ | 15 | 40,786.38 | | | |
| Cor Total | 1.520 × 10⁷ | 24 | | | | |
Table 6.
ANOVA table for depth of bead.
Table 6.
ANOVA table for depth of bead.
| Source | Sum of Squares | df | Mean Square | F-Value | p-Value | Prob > F |
|---|
| Model | 1.891 × 10⁶ | 3 | 6.303 × 10⁵ | 19.33 | <0.0001 | significant |
| A-A | 54,574.48 | 1 | 54,574.48 | 1.67 | 0.2098 | |
| B-B | 1.505 × 10⁶ | 1 | 1.505 × 10⁶ | 46.17 | <0.0001 | |
| C-C | 3.310 × 10⁵ | 1 | 3.310 × 10⁵ | 10.15 | 0.0044 | |
| Residual | 6.847 × 10⁵ | 21 | 32,602.45 | | | |
| Cor Total | 2.575 × 10⁶ | 24 | | | | |
Table 7.
ANOVA table for width of bead.
Table 7.
ANOVA table for width of bead.
| Source | Sum of Squares | df | Mean Square | F-Value | p-Value | Prob > F |
|---|
| Model | 6.694 × 10⁷ | 3 | 2.231 × 10⁷ | 37.68 | <0.0001 | significant |
| A-A | 1.916 × 10⁶ | 1 | 1.916 × 10⁶ | 3.24 | 0.0864 | |
| B-B | 6.466 × 10⁷ | 1 | 6.466 × 10⁷ | 109.19 | <0.0001 | |
| C-C | 3.635 × 10⁵ | 1 | 3.635 × 10⁵ | 0.6139 | 0.4421 | |
| Residual | 1.244 × 10⁷ | 21 | 5.922 × 10⁵ | | | |
| Cor Total | 7.938 × 10⁷ | 24 | | | | |
Table 8.
ANOVA table for wetting angle of bead.
Table 8.
ANOVA table for wetting angle of bead.
| Source | Sum of Squares | df | Mean Square | F-Value | p-Value | Prob > F |
|---|
| Model | 13,069.07 | 3 | 4356.36 | 44.08 | <0.0001 | significant |
| A-A | 34.00 | 1 | 34.00 | 0.3440 | 0.5638 | |
| B-B | 12,589.10 | 1 | 12,589.10 | 127.39 | <0.0001 | |
| C-C | 445.97 | 1 | 445.97 | 4.51 | 0.0457 | |
| Residual | 2075.23 | 21 | 98.82 | | | |
| Cor Total | 15,144.30 | 24 | | | | |
Table 9.
ANOVA table for dilution rate of bead.
Table 9.
ANOVA table for dilution rate of bead.
| Source | Sum of Squares | df | Mean Square | F-Value | p-Value | Prob > F |
|---|
| Model | 1608.07 | 3 | 536.02 | 31.80 | <0.0001 | significant |
| A-A | 45.82 | 1 | 45.82 | 2.72 | 0.1141 | |
| B-B | 1545.35 | 1 | 1545.35 | 91.68 | <0.0001 | |
| C-C | 16.90 | 1 | 16.90 | 1.00 | 0.3280 | |
| Residual | 353.98 | 21 | 16.86 | | | |
| Cor Total | 1962.05 | 24 | | | | |
Table 10.
Parameter optimization and swing design scheme and the result of the response value.
Table 10.
Parameter optimization and swing design scheme and the result of the response value.
| | Bead Height (μm) | Bead Depth (μm) | Bead Width (μm) | Wetting Angle (°) | Dilution Rate (%) |
|---|
| a | 3018.700 | 1051.654 | 9231.270 | 72.66° | 2.528% |
| b | 2786.026 | 935.615 | 11,650.265 | 54.957° | 3.816% |
| c | 3118.908 | 1520.438 | 10,409.224 | 59.894° | 4.603% |
| d | 2474.025 | 1129.722 | 12,233.838 | 51.758° | 5.516% |
| e | 3350.619 | 1227.085 | 7187.254 | 78.733° | 3.386% |
| f | 2376.039 | 1032.679 | 11,256.612 | 43.168° | 4.712% |
Table 11.
Forming height and forming efficiency.
Table 11.
Forming height and forming efficiency.
| | Number of Layers | Height (mm) | L (μm) | Li (μm) | Forming Efficiency (%) |
|---|
| a | 15 | 36,559.089 | 7241.048 | 11,328.519 | 63.921% |
| b | 15 | 34,265.968 | 8016.998 | 11,591.895 | 69.157% |
| c | 15 | 29,659.417 | 6656.058 | 10,509.323 | 63.336% |
| d | 15 | 33,539.914 | 9501.562 | 10,842.430 | 87.631% |
| e | 15 | 32,969.751 | 9628.981 | 10,329.996 | 93.214% |
| f | 15 | 30,933.713 | 8404.616 | 8939.096 | 94.015% |


