
Study of Microstructure and Performance Evaluation of Zr-Sn-Nb Joints by Electron Beam Welding
Abstract
:1. Introduction
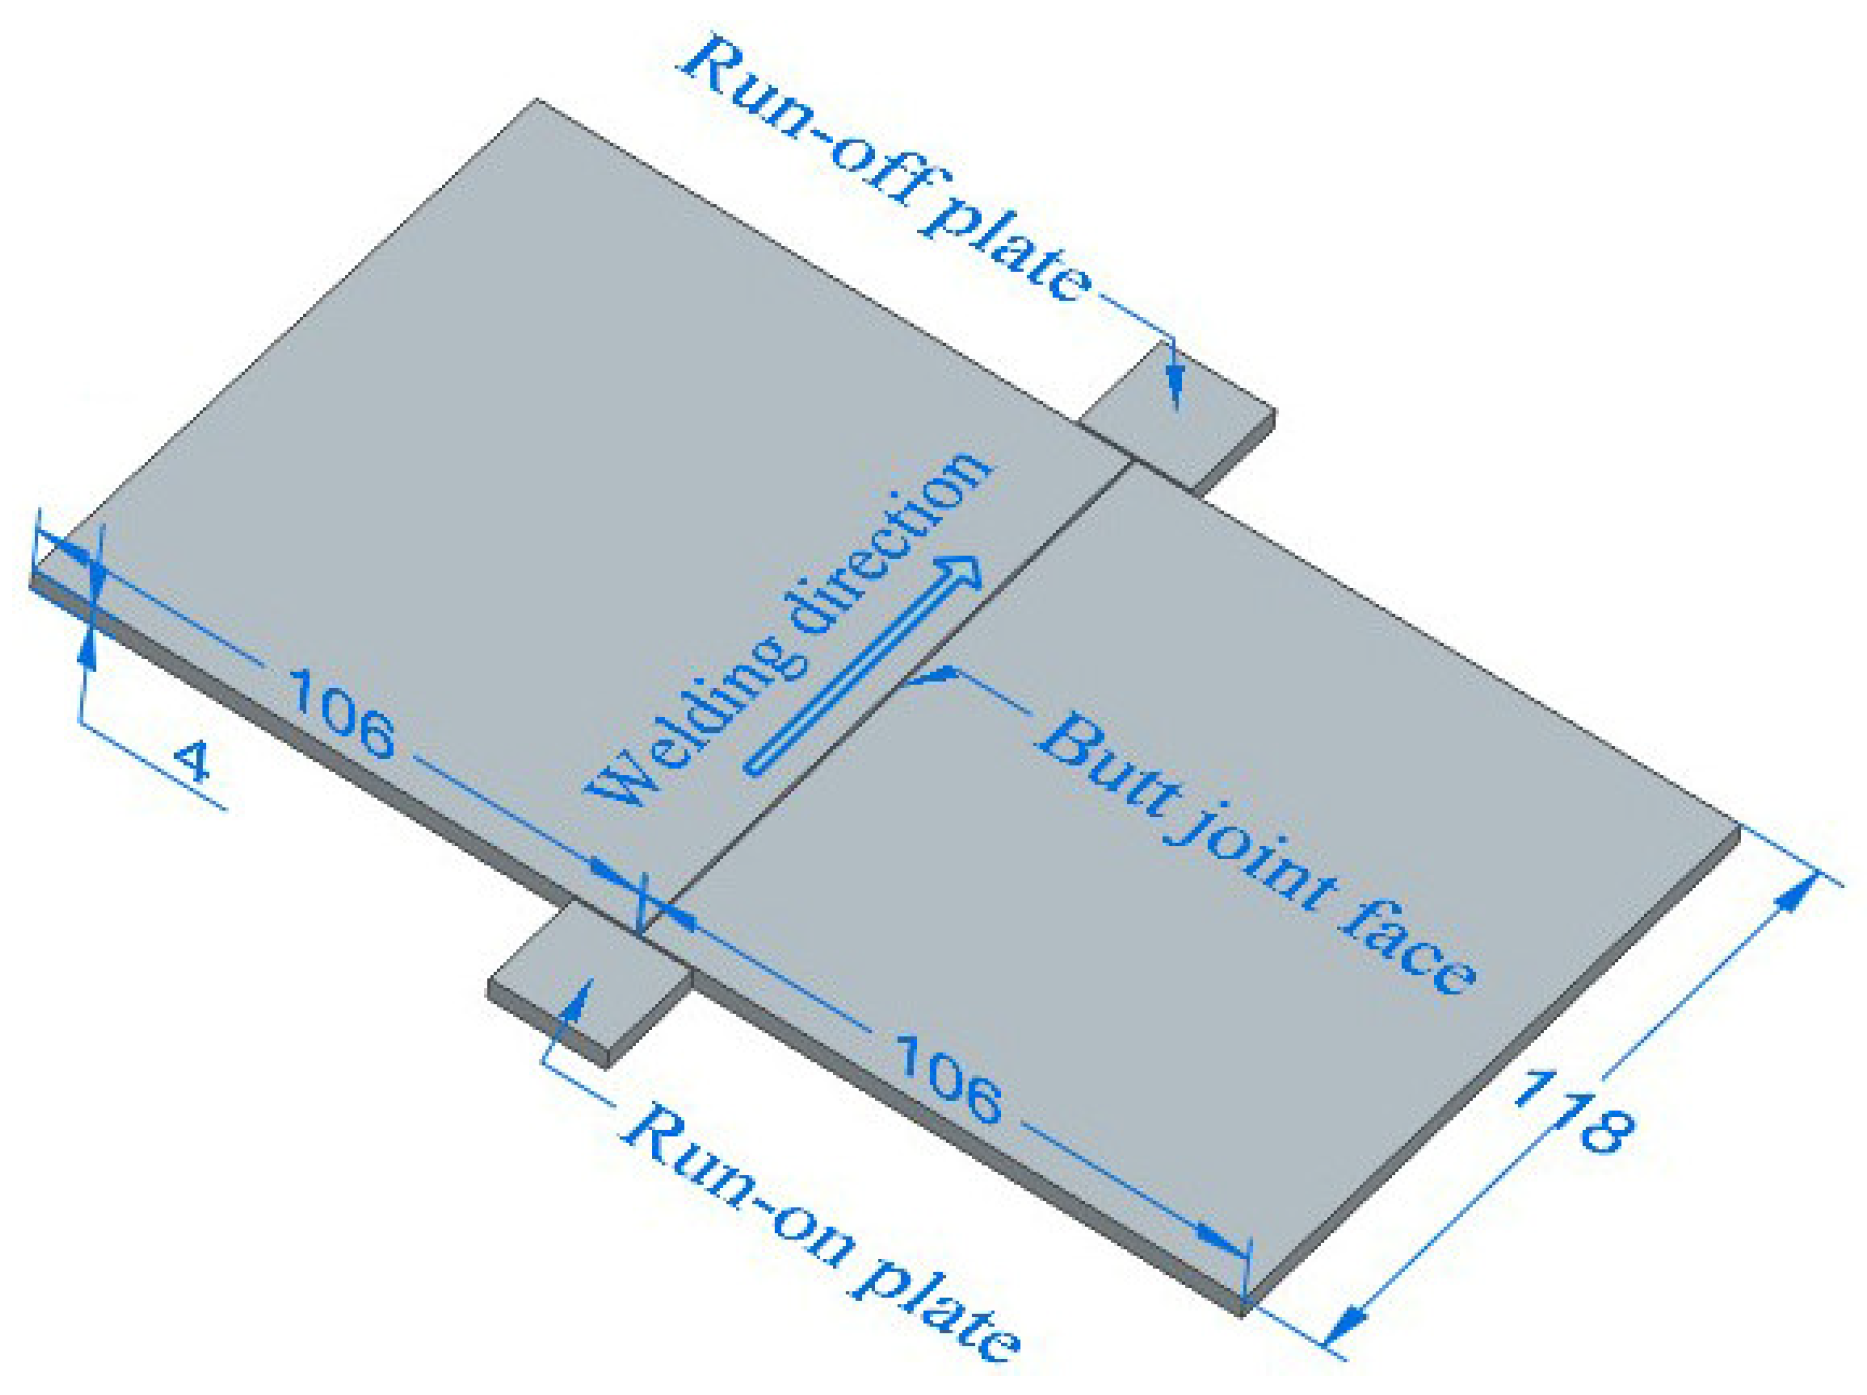
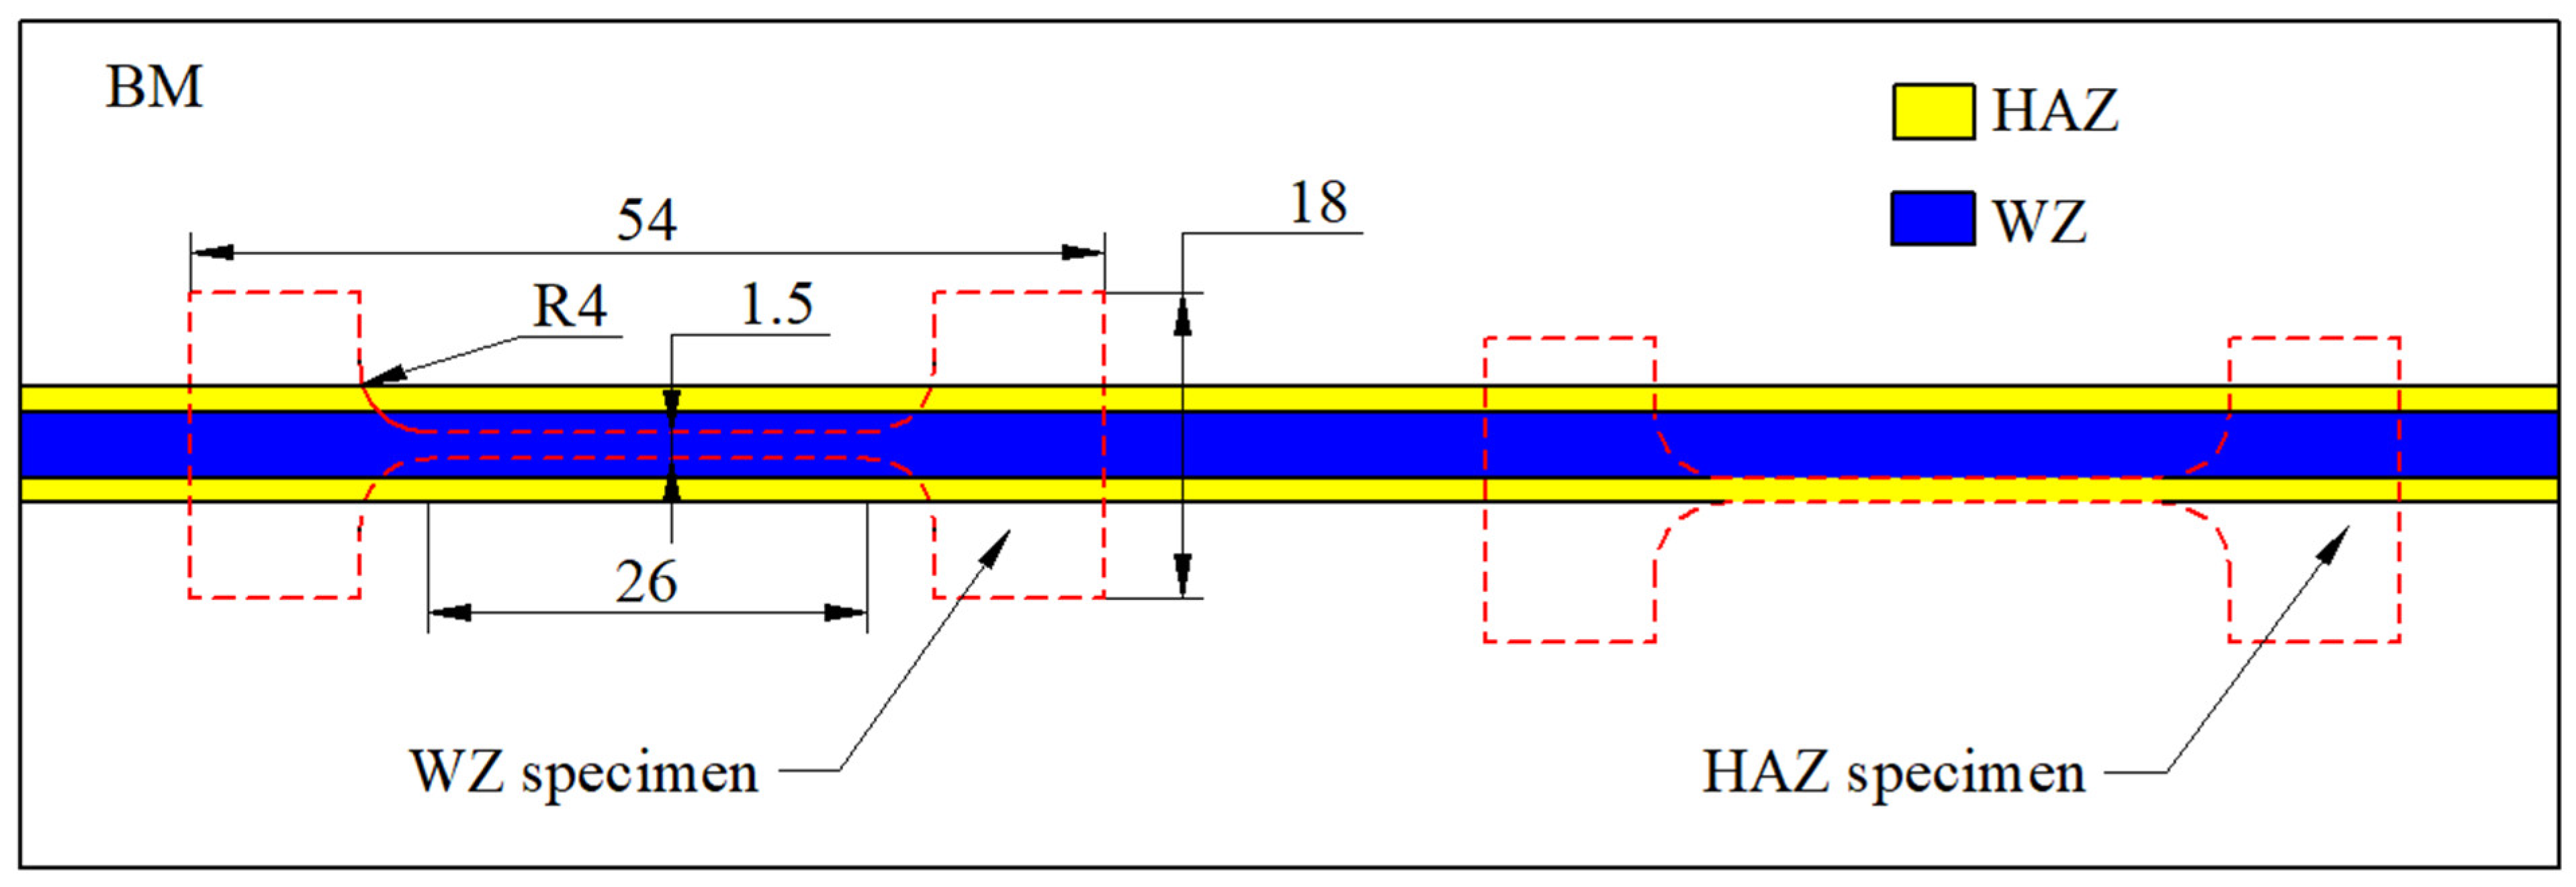
2. Experimental Section
3. Results and Discussion
3.1. Weld Forming
3.2. Microstructure Analysis
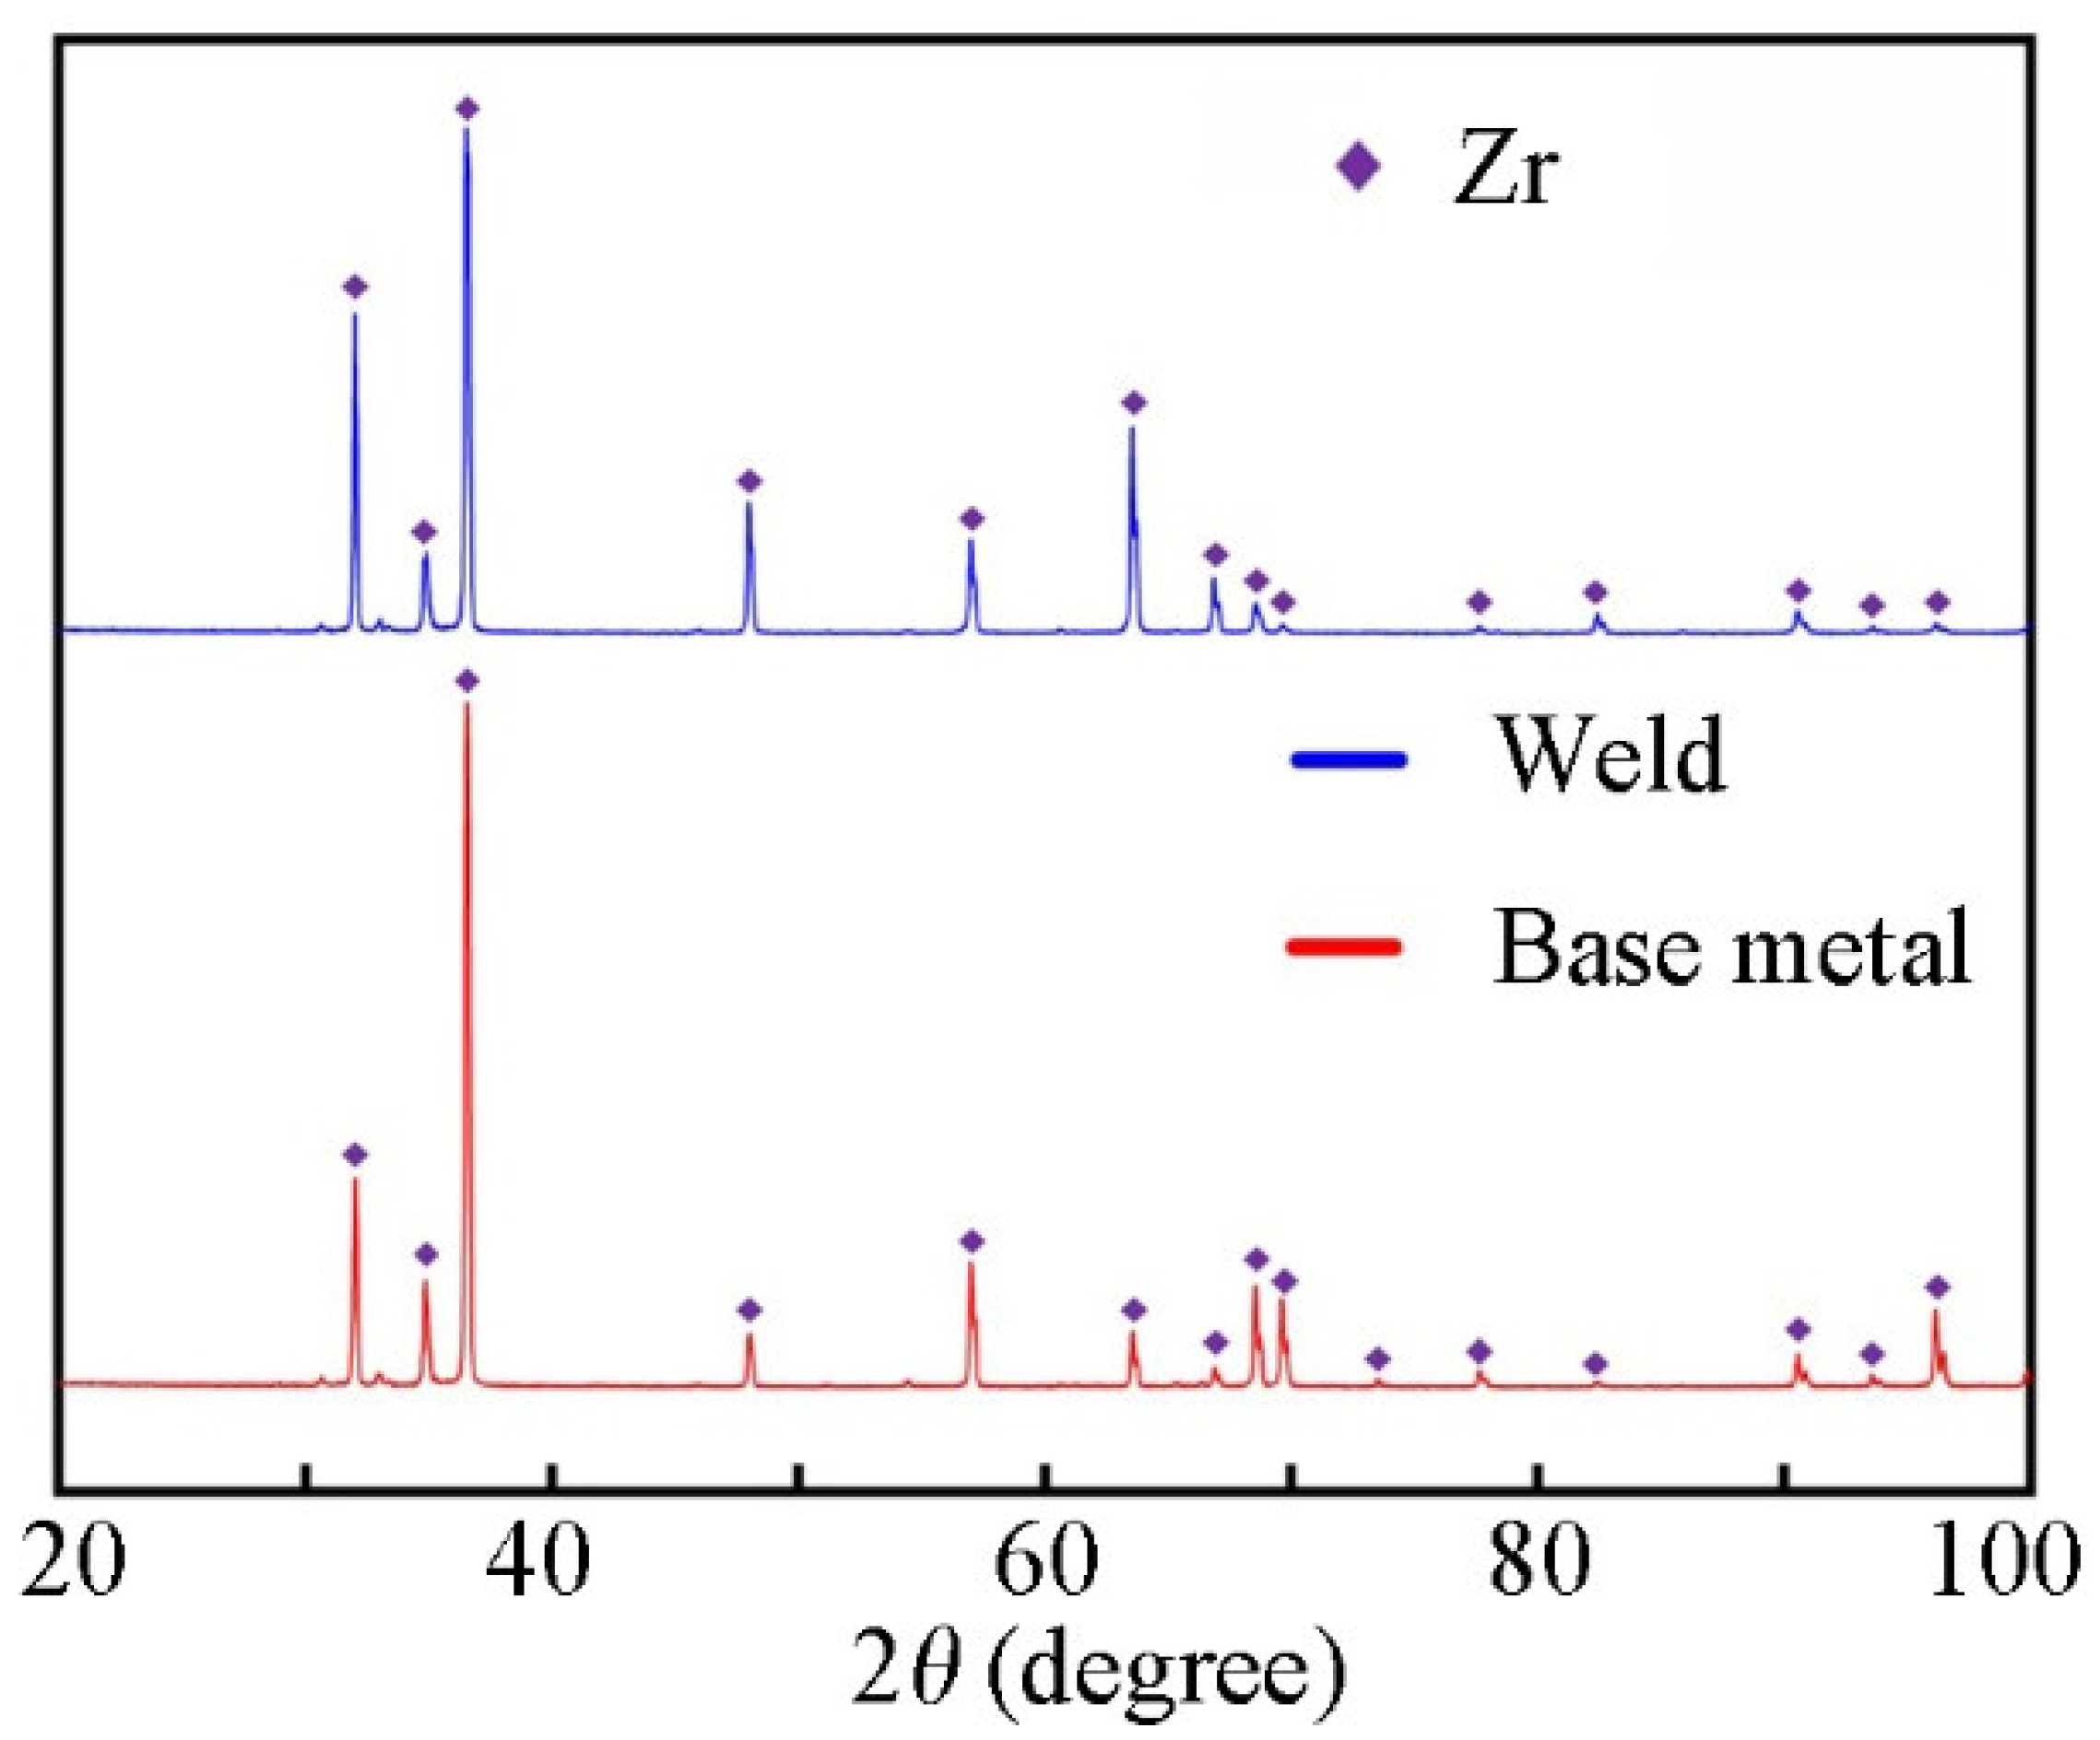
3.3. XRD Analysis
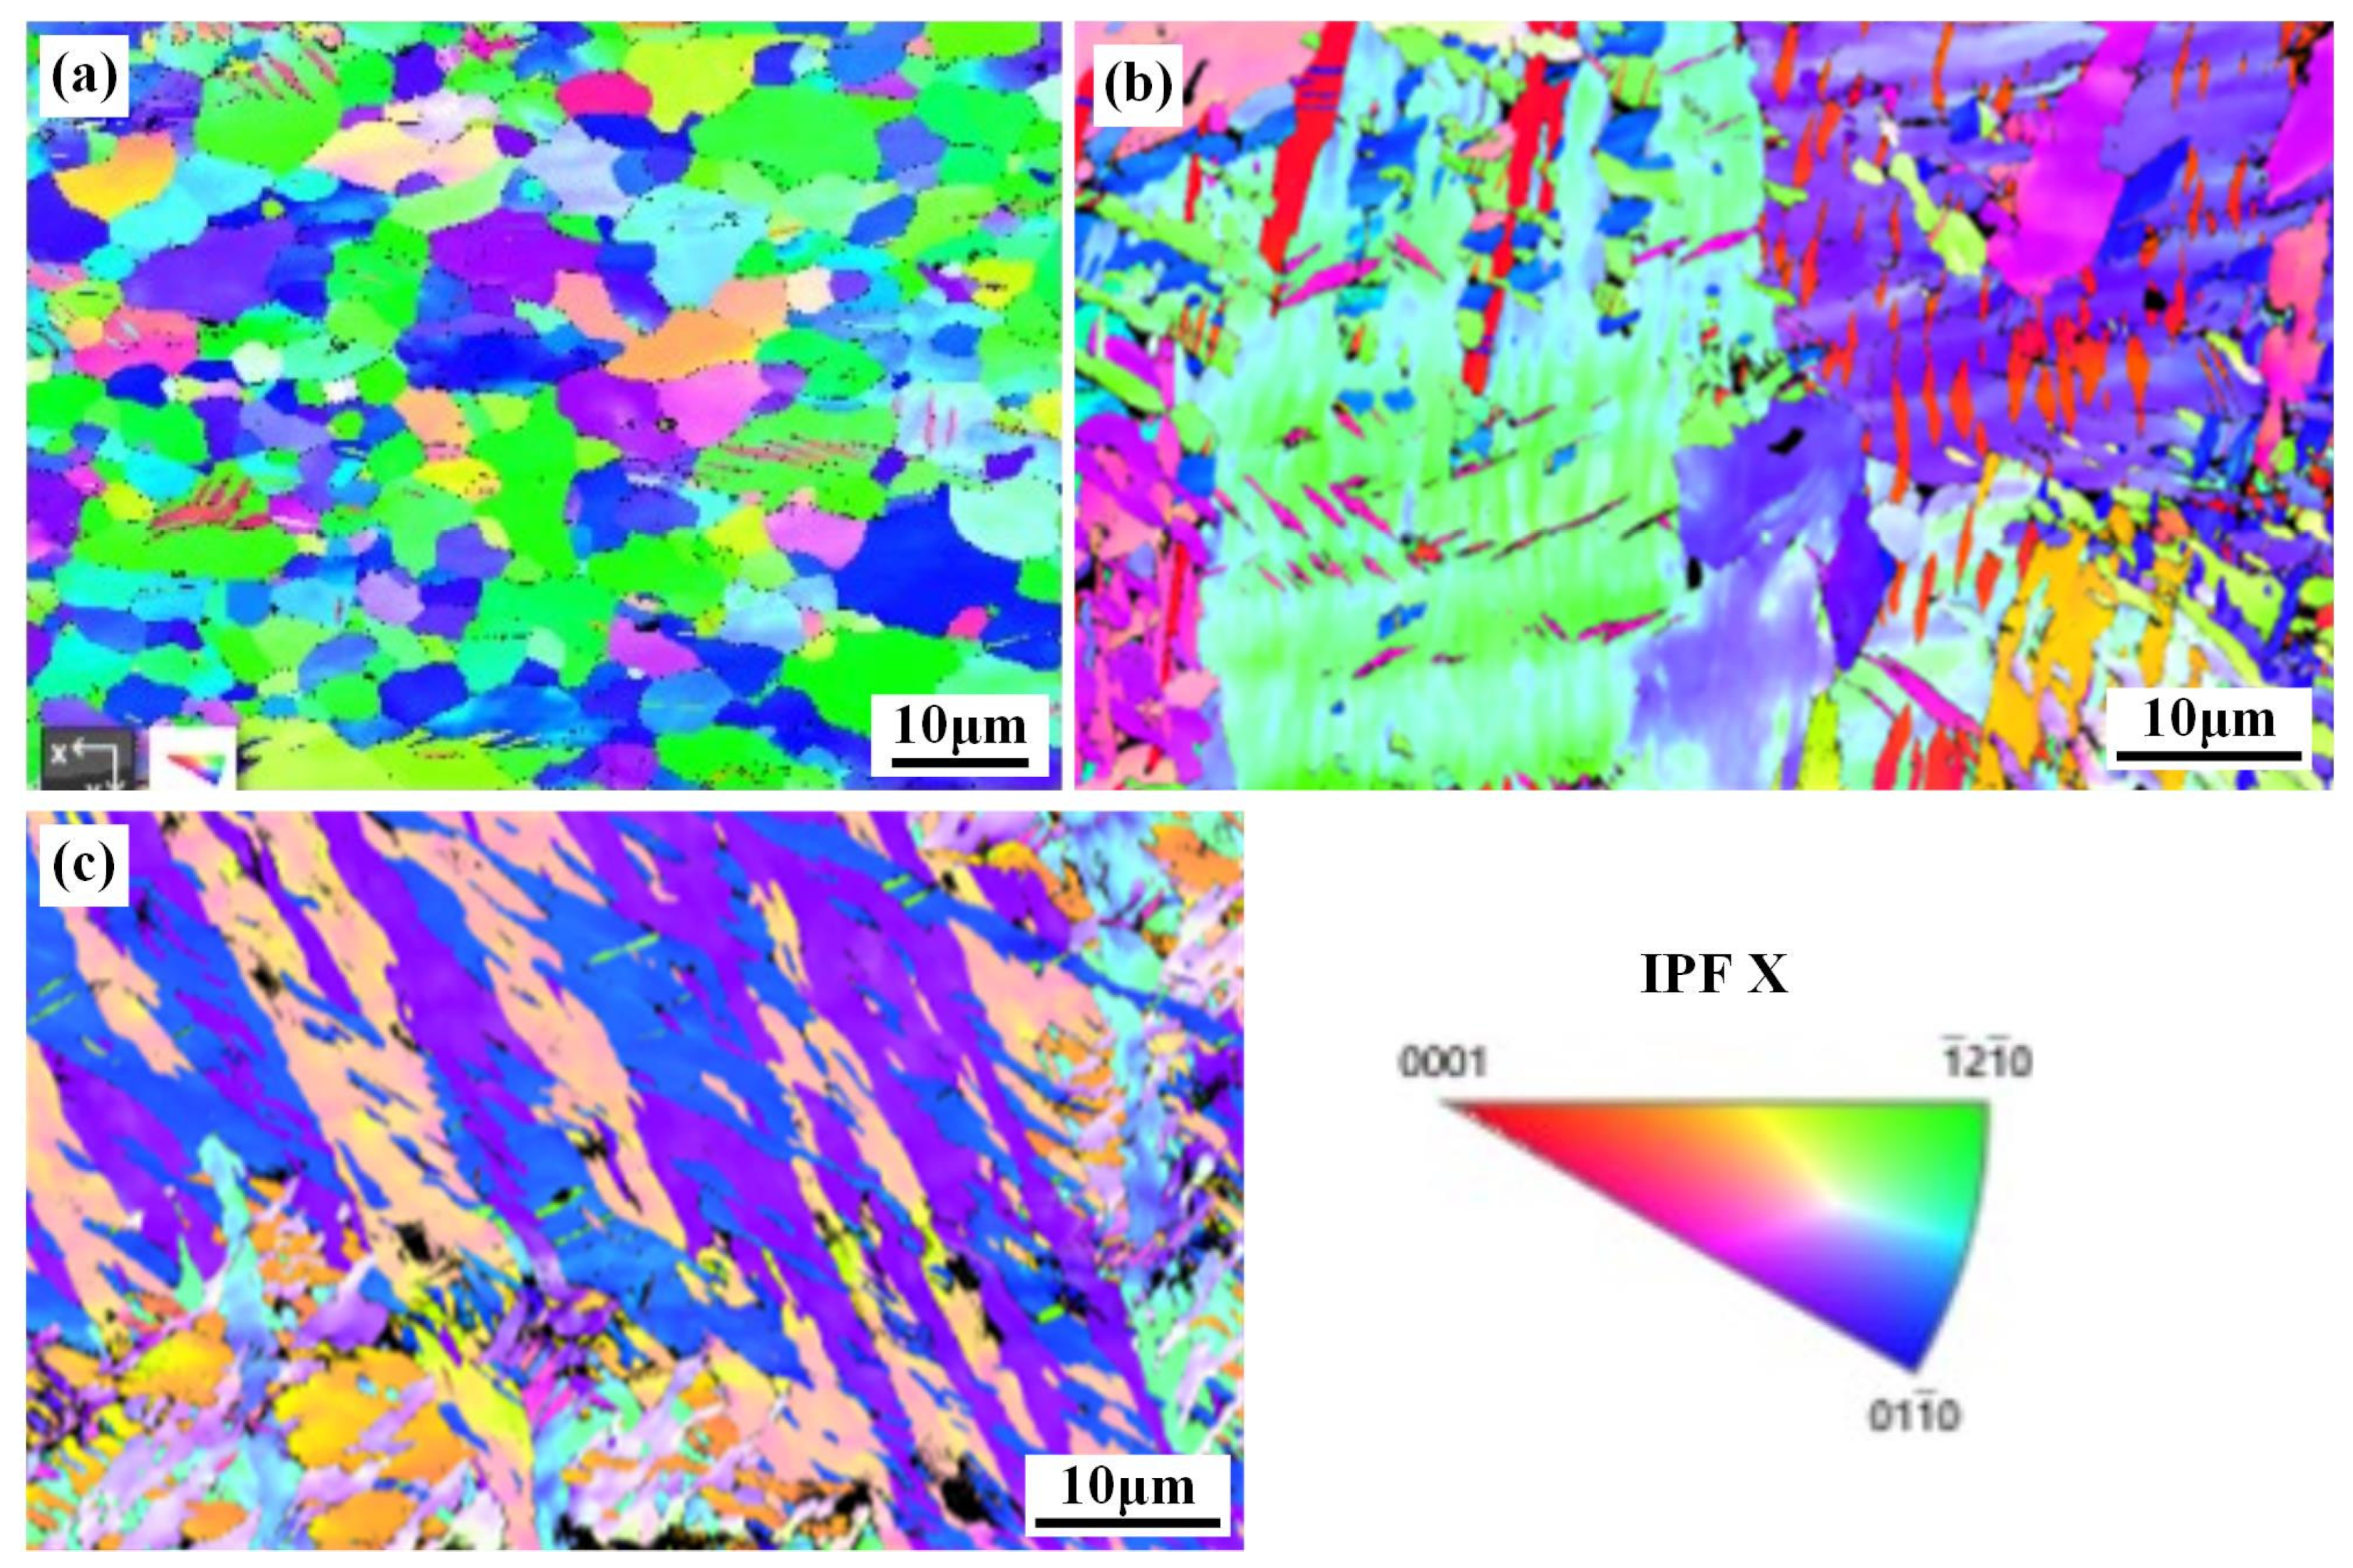
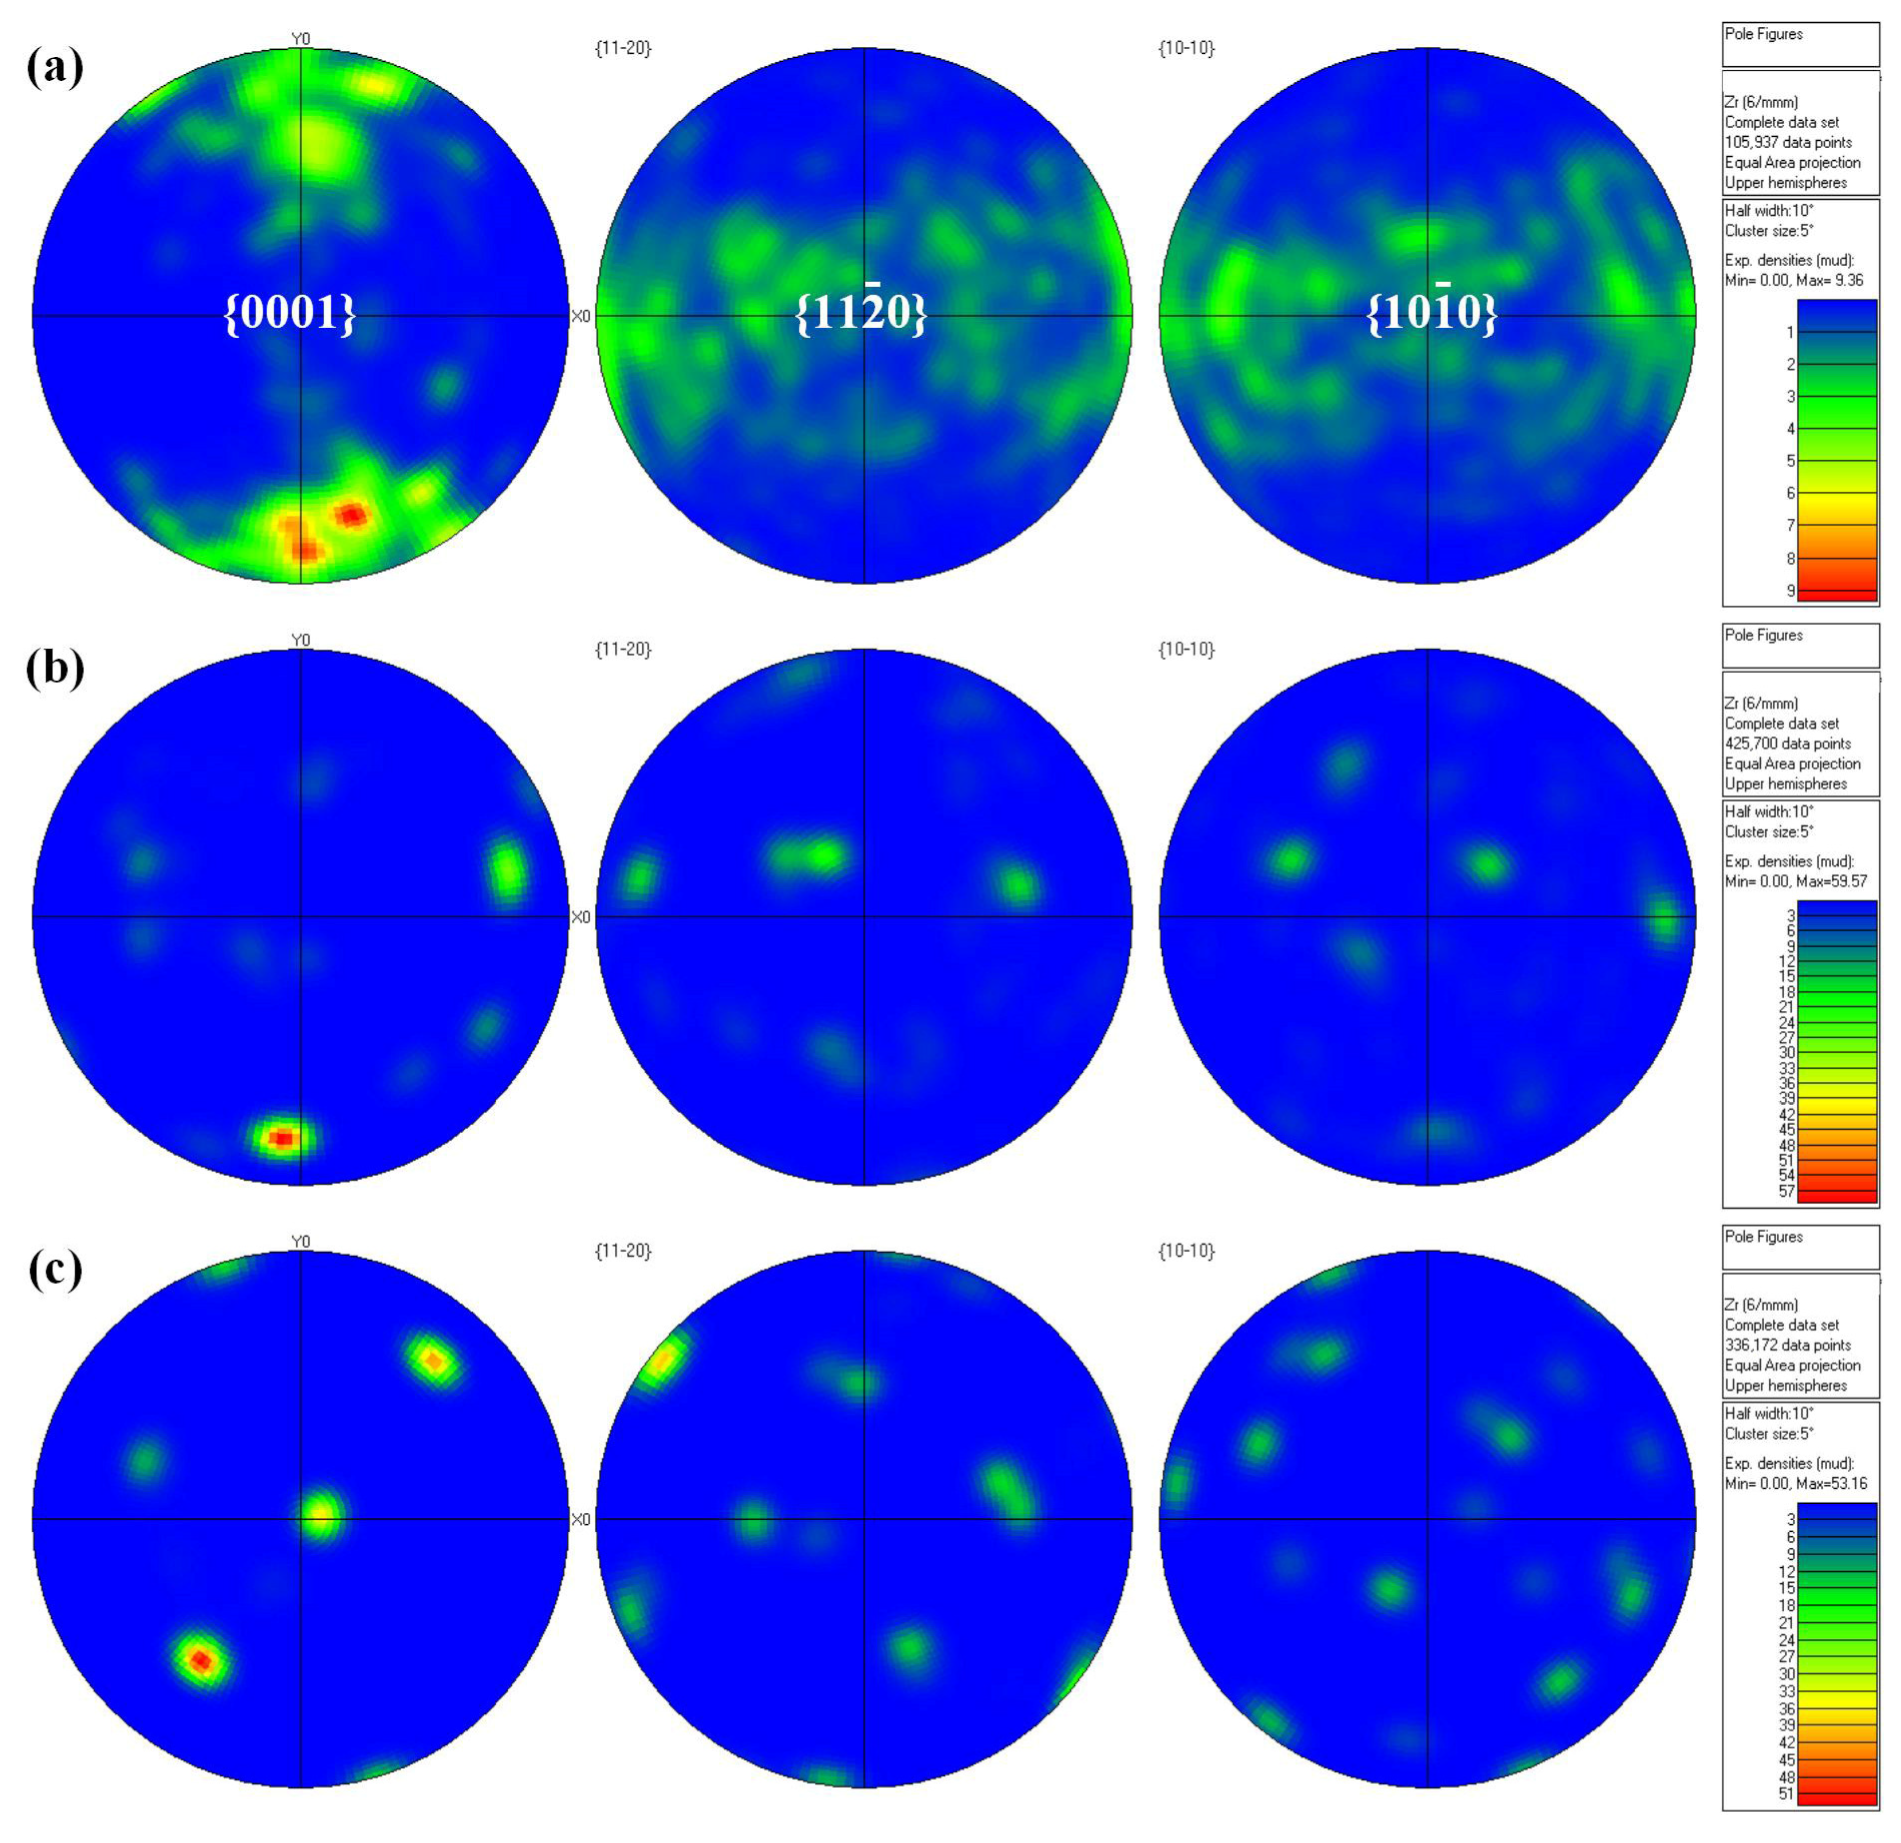
3.4. EBSD Analysis
3.5. Mechanical Properties Evaluation of Zr-Sn-Nb Joint
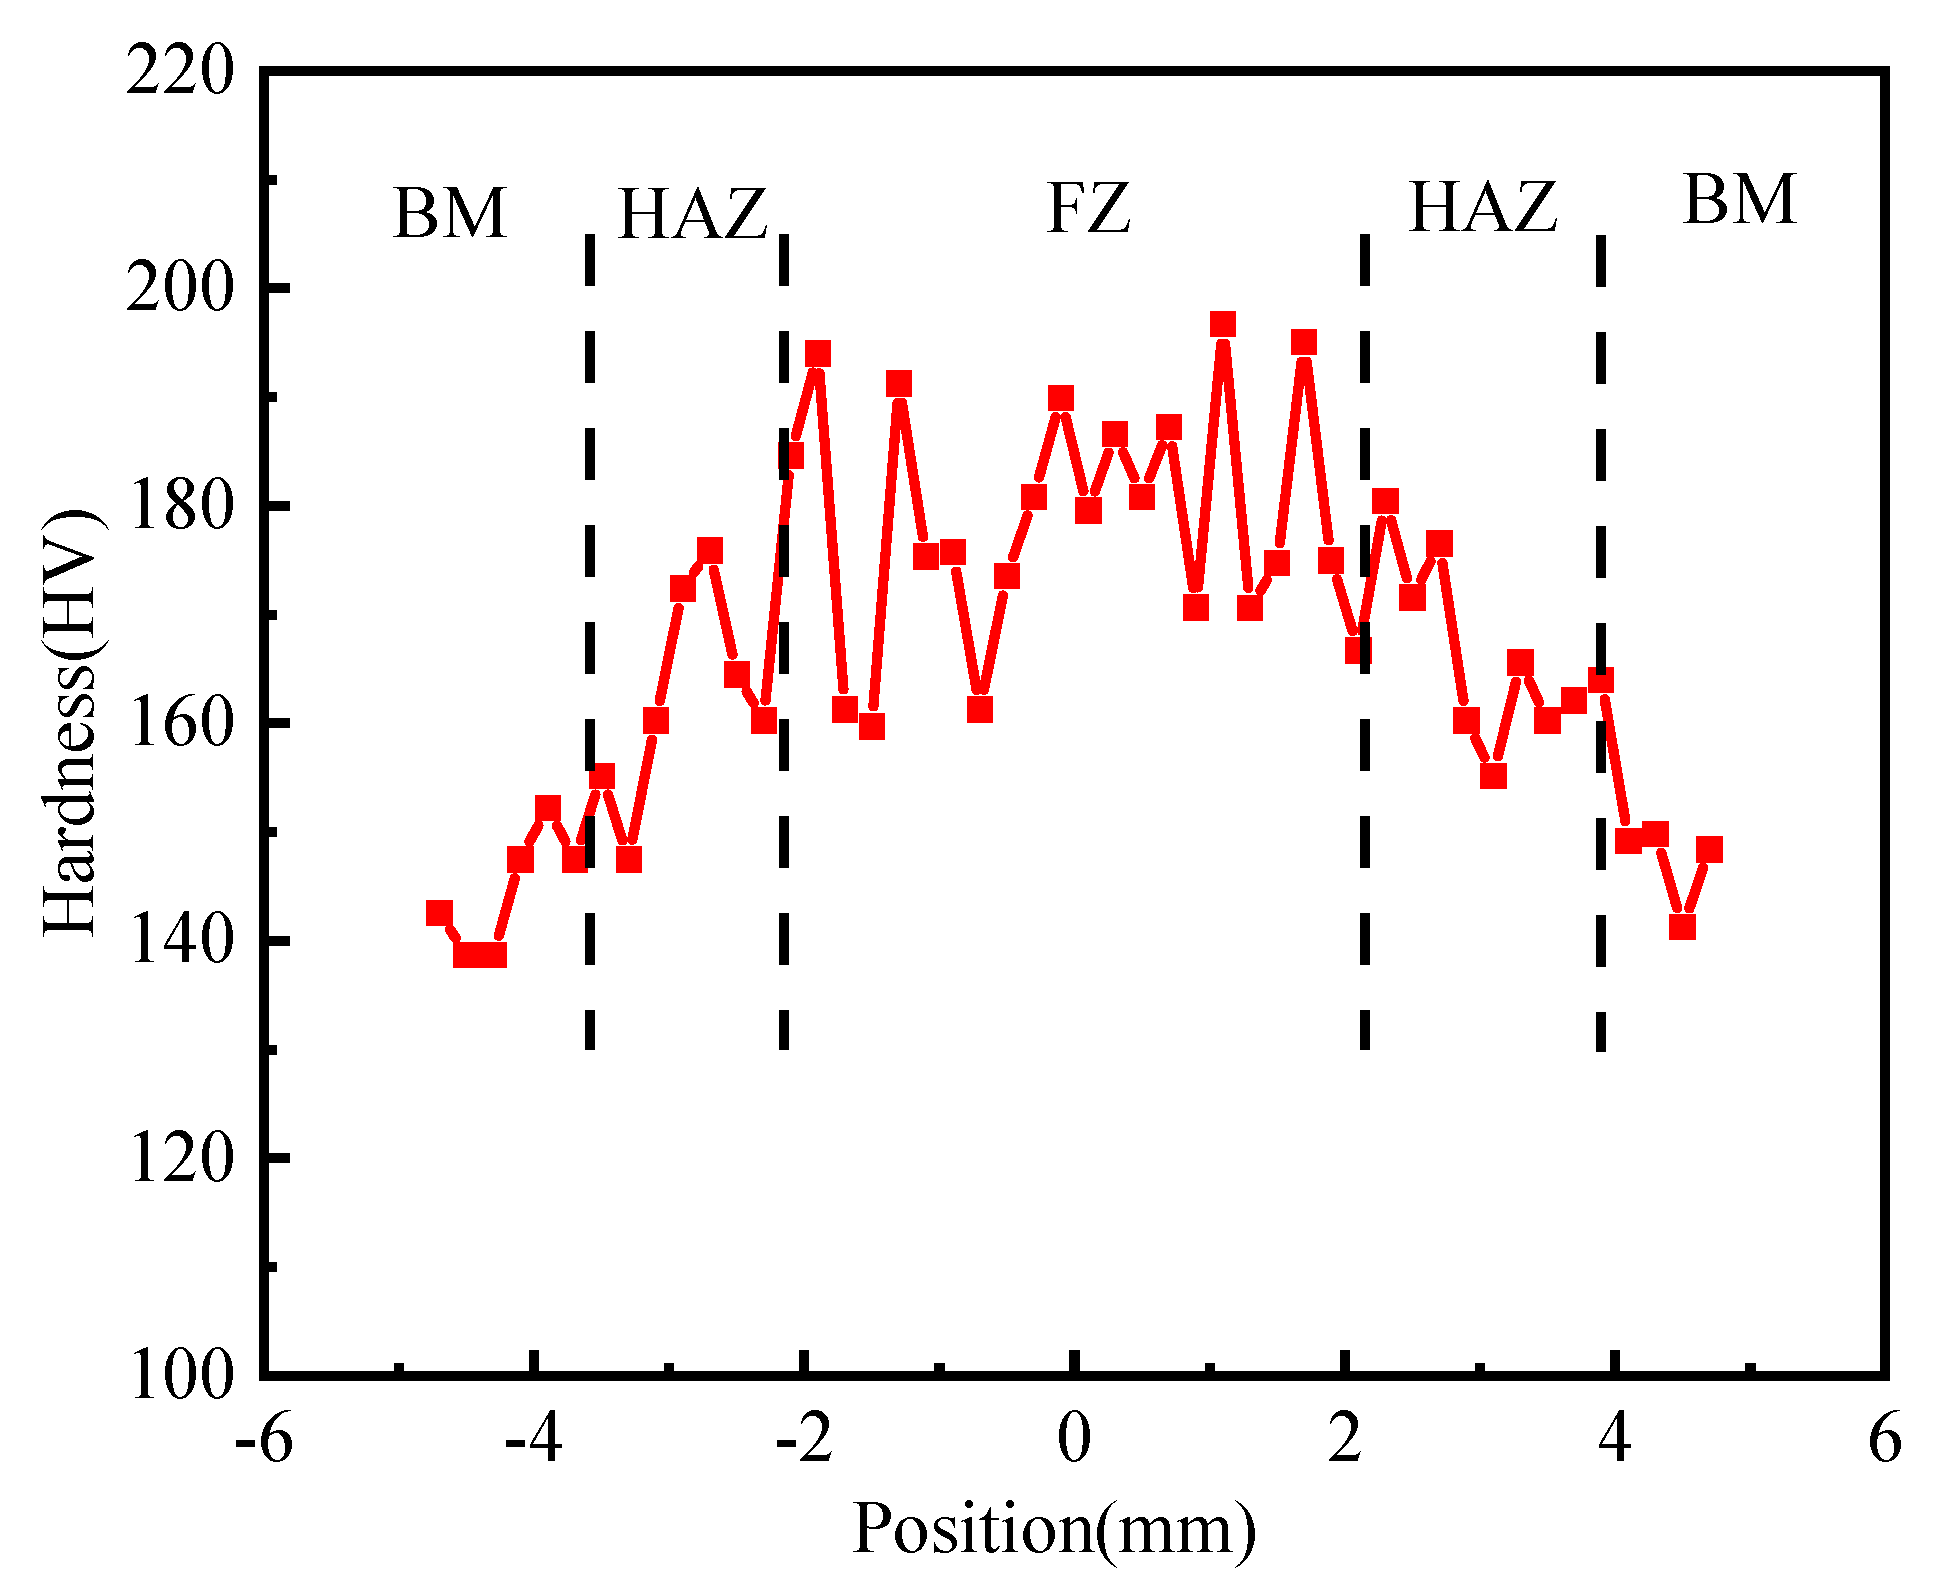
3.5.1. Micro-Hardness
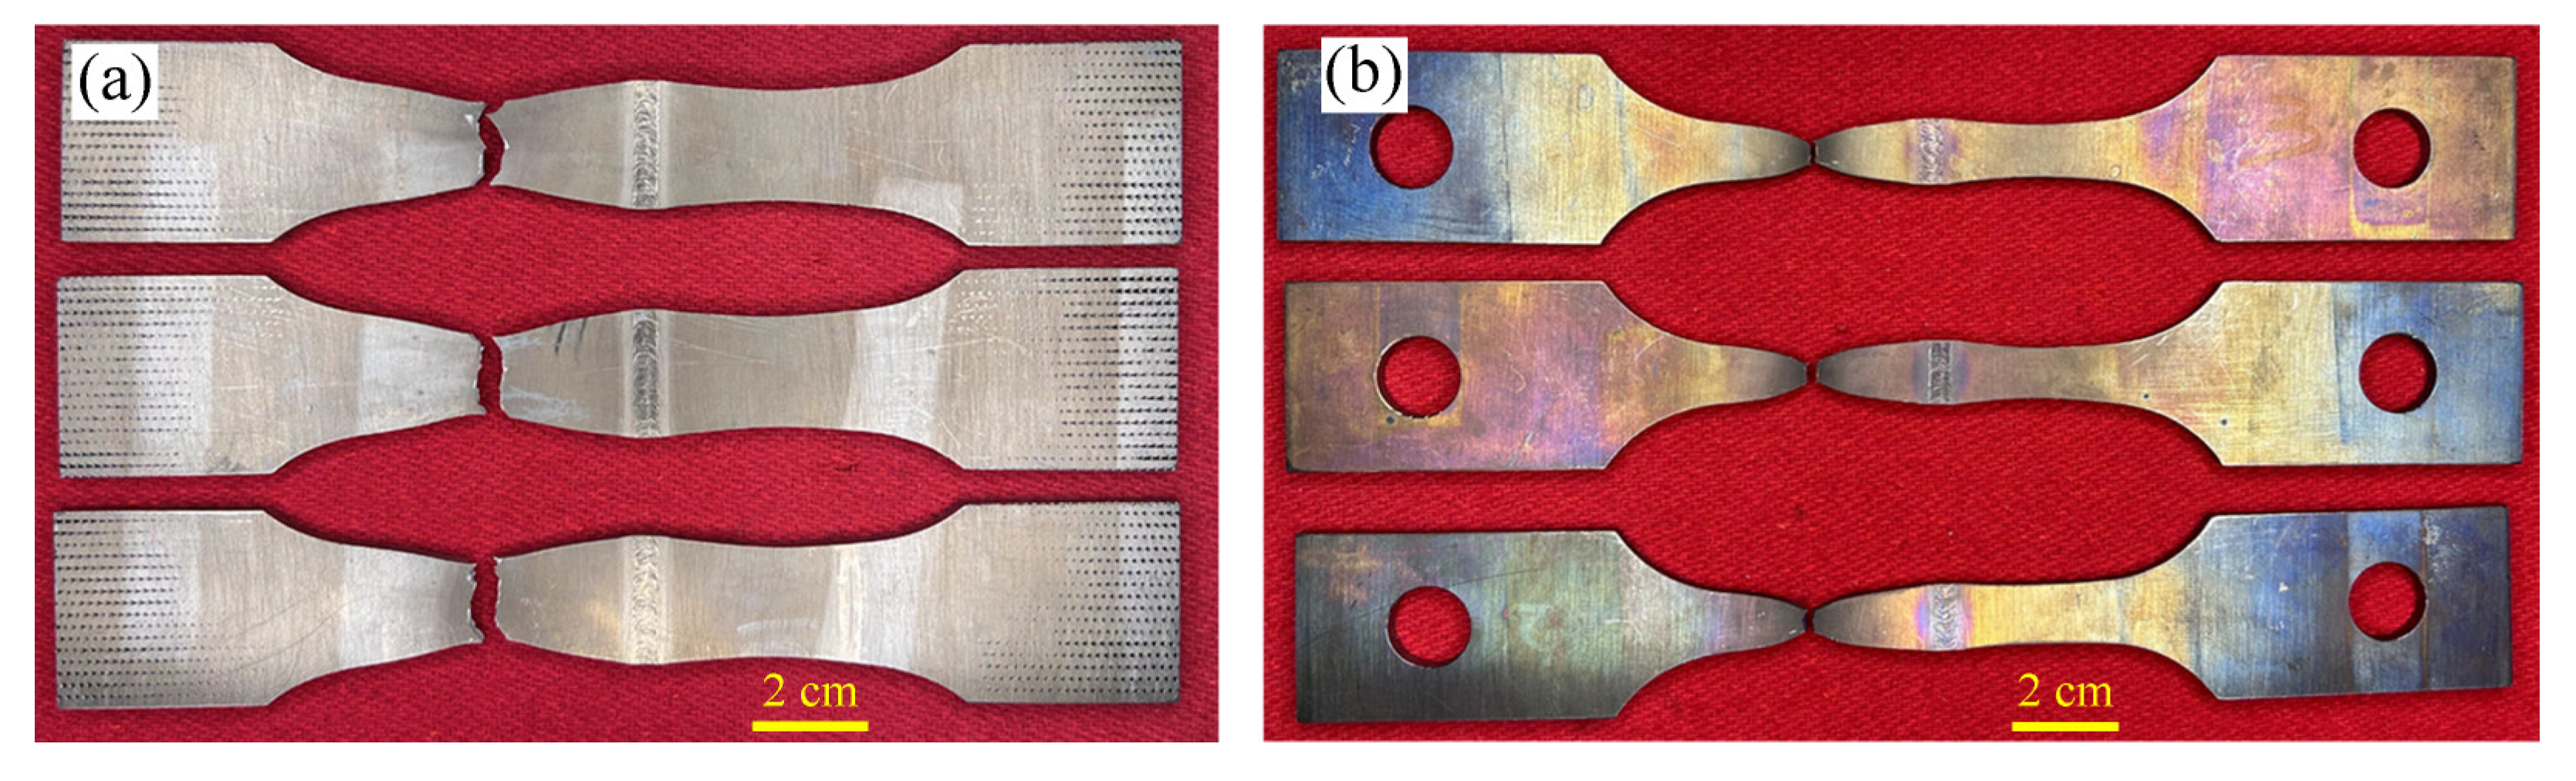
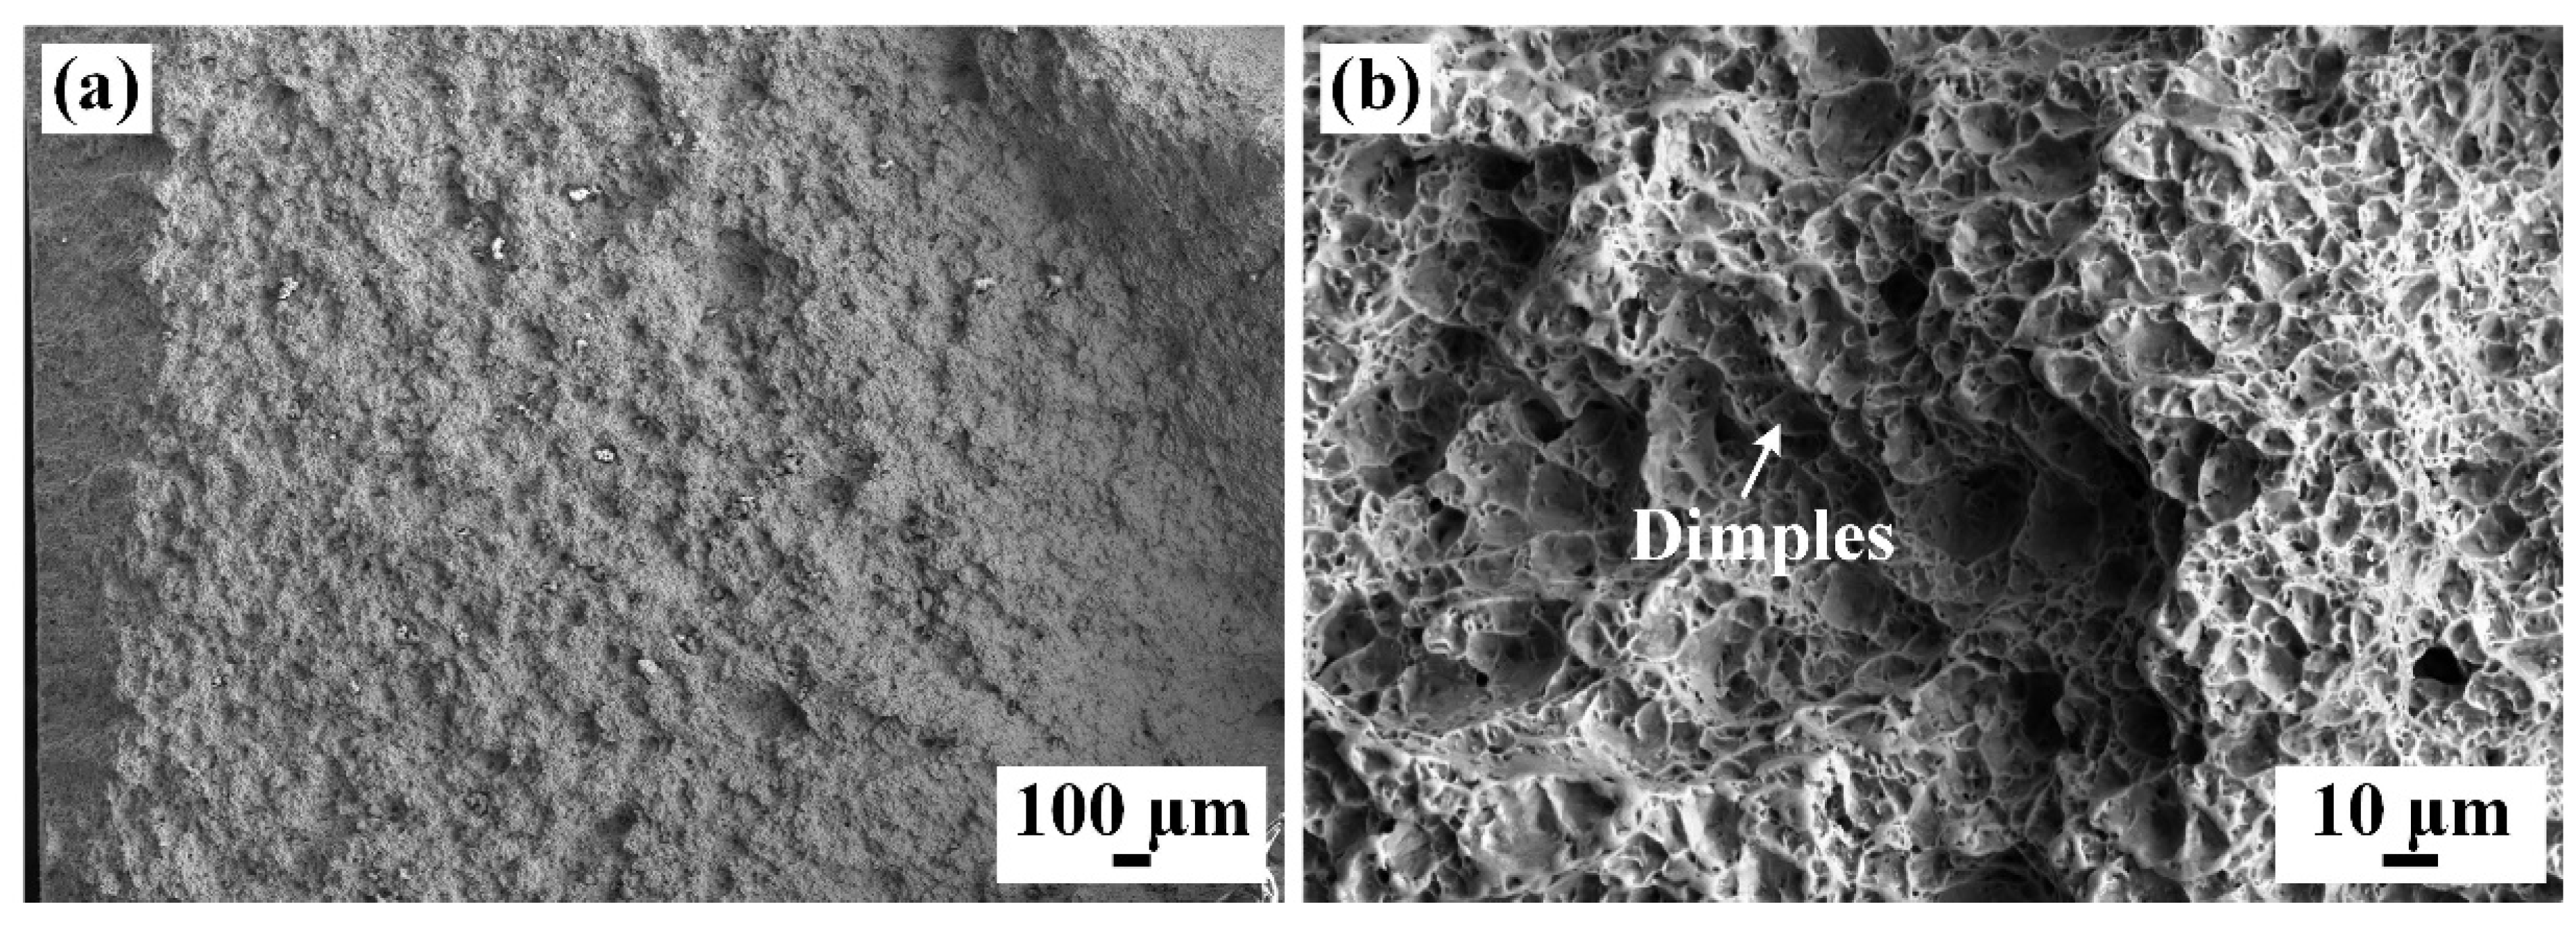
3.5.2. Tensile Properties of the Whole Joint
3.5.3. Tensile Properties of Different Regions of Whole Joint
3.5.4. Impact Property
3.5.5. Corrosion Resistance
4. Conclusions
- (1)
- EBW of Zr-Sn-Nb alloy can obtain a weld with a flat surface and relatively uniform fish scale pattern. The interior of the weld is free of defects.
- (2)
- The WZ and HAZ grains were significantly coarsened, with the formation of acicular α′-Zr in the upper part of the weld and the maximum size of the primary β grains exceeding 0.5 mm. The blocky α phase formed in the root of the weld. The EBSD results indicate that the grain orientation inside the WZ and HAZ is uniform and there is no obvious preferred orientation.
- (3)
- Coarse grains and fine acicular α′ phases increase the strength of the joint, but reduce the plasticity of the joint. The tensile strengths of the joints at RT and 375 °C were 438 MPa and 313 MPa, respectively, and fracture occurred in the BM. The strength of the WZ and HAZ were higher than that of the BM, but the elongation was significantly lower than that of the BM.
- (4)
- Hardening of the joint significantly reduces the toughness of the joint. The RM impact energy of the joint is 18.5 J, which is only 58.3% of the BM.
- (5)
- The high purity of the EBW process and unsignificant grain orientation minimizes damage to the corrosion resistance of Zr-Sn-Nb alloy joints. The corrosion weight gains of the joint specimen and the BM specimen were 12.91 mg/dm2 and 12.64 mg/dm2, respectively, and the thicknesses of the cross-section corrosion layer were 12–15 μm and 9–12 μm, respectively.
Author Contributions
Funding
Institutional Review Board Statement
Informed Consent Statement
Data Availability Statement
Conflicts of Interest
References
- Kim, H.A.; Kim, J.S.; Lee, Y.; Kim, S.; Lee, Y.H.; Kim, Y.S.; Kang, J.H.; Kim, S. Microstructure and mechanical properties of hydride blisters formed on Zircaloy-4 claddings. J. Nucl. Mater. 2024, 588, 154777. [Google Scholar] [CrossRef]
- Jia, Y.; Han, W. Mechanisms of hydride nucleation, growth, reorientation, and embrittlement in zirconium: A review. Materials 2023, 16, 2419. [Google Scholar] [CrossRef]
- Park, S.Y.; Lee, M.H.; Choi, B.K.; Beak, J.H.; Park, J.Y.; Kim, J.H.; Kim, H.G. Out of pile and in file performance of advanced zirconium alloy (HANA) for high burn up fuel. J. Nucl. Sci. Technol. 2006, 43, 977–983. [Google Scholar]
- Sawarn, T.K.; Shriwashaw, R.S.; Banerjee, S.; Samanta, A.; Kumar, S.; Sunil, S.; Shah, P.K.; Singh, R.N. Influence of temperature and hydrogen content on the transient mechanical properties of Zircaloy-4 fuel cladding. Prog. Nucl. Energ. 2022, 153, 104439. [Google Scholar] [CrossRef]
- Jia, Y.; Lin, X.; Zou, X.; Han, W. The research and development history, current situation, and development trend of zirconium alloys. China Mater. Prog. 2022, 41, 354–370. [Google Scholar]
- Pang, C.; Li, H.; Zhao, W.; Zhang, C. Influence of Nb content on the mechanical behavior of zirconium alloys. J. Phys. Conf. Ser. 2022, 2353, 012003. [Google Scholar] [CrossRef]
- Zhao, W.; Wei, T.; Liao, J.; Song, P.; Peng, X.; Liao, Z.; Peng, Q.; He, X. High performance oxidation behavior of Zr-4 and Zr-Sn-Nb alloy in different oxidation ambient. J. Alloys Compd. 2021, 887, 161396. [Google Scholar] [CrossRef]
- Slobodyan, M.S. Arc welding of zirconium and its alloys: A review. Prog. Nucl. Energ. 2021, 133, 103630. [Google Scholar] [CrossRef]
- Slobodyan, M. Resistance, electron and laser beam welding of zirconium alloys for nuclear applications: A review. Nucl. Eng. Technol. 2021, 53, 1049–1078. [Google Scholar] [CrossRef]
- Annette, O.B. Welding Handbook, 9th ed.; AWS: Miami, FL, USA, 2015. [Google Scholar]
- Li, N.; Zhang, M.; Niu, J.; Ye, J.L. Study on Corrosion Behavior of Zr-702 zirconium plate TIG welded joint in sulfuric acid environment. Rare. Metal. Mat. Eng. 2022, 51, 4618–4623. [Google Scholar]
- Tonpe, S.; Saibaba, N.; Jayaraj, R.N.; Shankar, A.R.; Mudali, U.K.; Raj, B. Process development for fabric of Zircaloy-4 solvent assembly for reprocessing of spent nuclear fuel. Energy Procedia 2011, 7, 459–467. [Google Scholar] [CrossRef]
- Kashkarov, E.B.; Kudiiarov, V.N.; Kurdyumov, N.; Krinitcyn, M.G.; Sidelev, D.V. Hydrogenation behavior of Cr-coated laser beam welds of E110 zirconium alloy. J. Nucl. Mater. 2022, 570, 153980. [Google Scholar] [CrossRef]
- Sidelev, D.V.; Kashkarov, E.B.; Grudinin, V.A.; Krinitcyn, M.G. High-temperature oxidation of Cr-coated laser beam welds made from E110 zirconium alloy. Corros. Sci. 2022, 195, 110018. [Google Scholar] [CrossRef]
- Kashkarov, E.; Afornu, B.; Sidelev, D.; Krinitcyn, M.; Gouws, V.; Lider, A. Recent advances in protective coatings for accident tolerant Zr-based fuel claddings. Coatings 2021, 11, 557. [Google Scholar] [CrossRef]
- Węglowski, M.S.; Błacha, S.; Phillips, A. Electron beam welding—Techniques and trends—Review. Vacuum 2016, 130, 72–92. [Google Scholar] [CrossRef]
- Dong, J.; Zhong, W.; Zhang, Z.; Gao, J.; He, X. Microstructure transformation and pore formation mechanism of Mo-14Re alloy weld by vacuum electron beam welding. Vacuum 2023, 218, 112594. [Google Scholar] [CrossRef]
- Jha, M.N.; Pratihar, D.K.; Bapat, A.V.; Dey, V.; Ali, M.; Bagchi, A.C. Knowledge based systems using neural networks for electric beam welding process of reactive material (Zircaloy-4). J. Intell. Manuf. 2014, 25, 1315–1333. [Google Scholar] [CrossRef]
- Parga, C.J.; Van Rooyen, I.J.; Coryell, B.D.; Lloyd, W.R.; Valenti, L.N.; Usman, H. Room temperature mechanical properties of electric beam welded zircaloy-4 sheet. J. Mater. Process. Tech. 2017, 241, 73–85. [Google Scholar] [CrossRef]
- Mishra, P.; Jathar, V.P.; Singh, J.L.; Sah, D.N.; Shah, P.K.; Anantharaman, S. In reactor degradation of fuel and clading in fuel pins operated with weld defects. J. Nucl. Mater. 2013, 439, 217–223. [Google Scholar] [CrossRef]
- Bandi, B.; Dinda, S.K.; Kar, J.; Roy, J.J.; Srirangam, P. Effect of weld parameters on porosity formation in electric beam welded Zircaloy-4 joints: X-ray tomography study. Vacuum 2018, 158, 172–179. [Google Scholar] [CrossRef]
- Zhang, B.; Li, X.; Wang, T.; Wang, X. Microstructure and corrosion behavior of Zr-702 joined by electric beam welding. Vacuum 2015, 121, 159–165. [Google Scholar] [CrossRef]
- Yao, M.Y.; Zhou, B.X.; Li, Q.; Liu, W.Q.; Chu, Y.L. The effect of alloy modifications on hydrogen uptake of zirconium alloy welding specifications during corrosion tests. J. Nucl. Mater. 2006, 350, 195–201. [Google Scholar] [CrossRef]
- Chen, H.; Long, C.; Wei, T.; Gao, W.; Xiao, H.; Chen, L. Effect of Ni interlayer on partial transient liquid phase bonding of Zr–Sn–Nb alloy and 304 stainless steel. Mater. Design 2014, 60, 358–362. [Google Scholar] [CrossRef]
- Chen, B.; Bi, Y.; An, J.; Xie, Z.; Luo, Z. Formation mechanism, microstructure and mechanical properties in current-introduced solid-state welding of dissimilar zirconium alloy. MFGLET 2024, 40, 1–5. [Google Scholar] [CrossRef]
- Wei, L.F.; Chen, B.; Wang, S.Z.; Yong, W.; Zhou, M.B. Low cycle fatigue properties of hydrogenated welding sheets of Zr–Sn–Nb alloy using funnel-shaped flat specimens. Nucl. Eng. Technol. 2020, 5, 1724–1731. [Google Scholar]
- Bharadwaj, V.; Rai, A.K.; Upadhyaya, B.N.; Singh, R.; Rai, S.K.; Bindra, K.S. A study on effect of heat input on mode of welding, microstructure and mechanical strength in pulsed laser welding of Zr-2.5 wt.% Nb alloy. J. Nucl. Mater. 2022, 564, 153685. [Google Scholar] [CrossRef]
- Tao, W.; Cai, C.; Li, L.; Chen, Y.; Wang, Y. Pulsed laser spot welding of intersection points for Zircaloy-4 spacer grid assembly. Mater. Design 2013, 52, 487–494. [Google Scholar] [CrossRef]
- Fan, Q.S. Study on the Microstructure of Zr-Sn-Nb-Fe Zirconium Alloy; University of Technology: Chengdu, China, 2015. [Google Scholar]
- Long, F.; Griffiths, M.; Yao, Z.; Daymond, M.R. Characterization of phases in the Zr Nb Fe ternary system at the Zr Nb rich side of the phase diagram. J. Nucl. Mater. 2020, 534, 152142. [Google Scholar] [CrossRef]
- Toffolon, C.; Servant, C.; Gachon, J.C.; Sundman, B. Reassessment of the Nb Sn system. J. Phase. Equilib. 2002, 23, 134. [Google Scholar] [CrossRef]
- Sarah, L. Kernel average misorientation confidence index correlation from FIB sliced Ni Fe Cr alloy surface. Microsc. Microana 2011, 17, 424. [Google Scholar]
- Chen, Y.; Tsai, Y.; Tung, P.; Tsai, S.; Chen, C.; Wang, S.; Yang, J. Phase quantification in low carbon Nb Mo bearing steel by electron backscatter diffusion technology coupled with kernel average misorientation. Mater. Charact. 2018, 139, 49–58. [Google Scholar] [CrossRef]
- Miao, Y.; Mo, K.; Park, J.S.; Almer, J.; Massey, C.; Havrilak, C.; Nelson, A.T.; Connaway, H.; Yacout, A.M. In Situ synchrotron tense investments on ultrasonic additive manufactured (UAM) zirconium. J. Nucl. Mater. 2022, 568, 153843. [Google Scholar] [CrossRef]
- Mahlalela, S.S.; Pistorius, P.G.H. Microstructural characterization of laser beam and gas tungsten arc welded zirconium-2.5 Nb. J. S. Afr. Inst. Min. Metall. 2017, 117, 947–953. [Google Scholar] [CrossRef]
- Xu, W.F.; Liu, J.H.; Chen, D.L.; Luan, G.H.; Yao, J.S. Improvements of strength and conductivity in aluminum alloy joints via rapid cooling during friction still welding. Mat. Sci. Eng. A 2012, 548, 89–98. [Google Scholar] [CrossRef]
- Choi, Y.; Inoue, H. Crystallographic texture development and its effect on corrosion behavior of pilgered Zirconium alloy tubes. Mater. Trans. 2010, 51, 652–658. [Google Scholar] [CrossRef]
- Preuss, M.; Frankel, P.; Polatidis, E.; Wei, J.; Wang, P.; Smith, J.; Blat-Yrieix, M. Studies regarding corrosion mechanisms in zirconium alloys. J. ASTM Int. 2011, 8, 1–23. [Google Scholar] [CrossRef]
- Cai, C.; Li, L.; Tao, W.; Peng, G.; Wang, X. Weld bead size, microstructure and corrosion behavior of zirconium alloys joints welded by pulsed laser spot welding. J. Mater. Eng. Perform. 2016, 25, 3783–3792. [Google Scholar] [CrossRef]


| Acceleration Voltage /kV | Focus Current /mA | Welding Beam Current /mA | Welding Speed /(mm·min−1) | Working Distance /mm |
|---|---|---|---|---|
| 60 | 714 * | 26–28 | 480 | 190.5 |
| Point Position | Sn | Cr | Fe | Zr | Nb | Possible Phases |
|---|---|---|---|---|---|---|
| A | 0.89 | 1.22 | 1.29 | 18.12 | 78.48 | β-Nb |
| B | 0.8 | 0 | 0 | 99.2 | 0 | α-Zr |
| WZ | HAZ | BM | |
|---|---|---|---|
| Tensile strength (MPa) | 499 | 496 | 447 |
| Yield strength (MPa) | 368 | 386 | 337 |
| Elongation (%) | 12.5 | 12.5 | 18.0 |
| Sample 1 | Sample 2 | Sample 3 | Average Value | |
|---|---|---|---|---|
| WZ | 20.5 | 17 | 18 | 18.5 |
| BM | 31.3 | 31.5 | 32.3 | 31.7 |
Disclaimer/Publisher’s Note: The statements, opinions and data contained in all publications are solely those of the individual author(s) and contributor(s) and not of MDPI and/or the editor(s). MDPI and/or the editor(s) disclaim responsibility for any injury to people or property resulting from any ideas, methods, instructions or products referred to in the content. |
© 2024 by the authors. Licensee MDPI, Basel, Switzerland. This article is an open access article distributed under the terms and conditions of the Creative Commons Attribution (CC BY) license (https://creativecommons.org/licenses/by/4.0/).
Share and Cite
Zhao, Y.; Zhang, A.; Yue, H.; Wang, H.; Xin, Y.; Zhou, Y. Study of Microstructure and Performance Evaluation of Zr-Sn-Nb Joints by Electron Beam Welding. Materials 2024, 17, 980. https://doi.org/10.3390/ma17050980
Zhao Y, Zhang A, Yue H, Wang H, Xin Y, Zhou Y. Study of Microstructure and Performance Evaluation of Zr-Sn-Nb Joints by Electron Beam Welding. Materials. 2024; 17(5):980. https://doi.org/10.3390/ma17050980
Chicago/Turabian StyleZhao, Yanli, Anrui Zhang, Huifang Yue, Houqin Wang, Yong Xin, and Yi Zhou. 2024. "Study of Microstructure and Performance Evaluation of Zr-Sn-Nb Joints by Electron Beam Welding" Materials 17, no. 5: 980. https://doi.org/10.3390/ma17050980