
Ferroelectric Phase Transition in Barium Titanate Revisited with Ab Initio Molecular Dynamics

Abstract
:1. Introduction
2. Methods
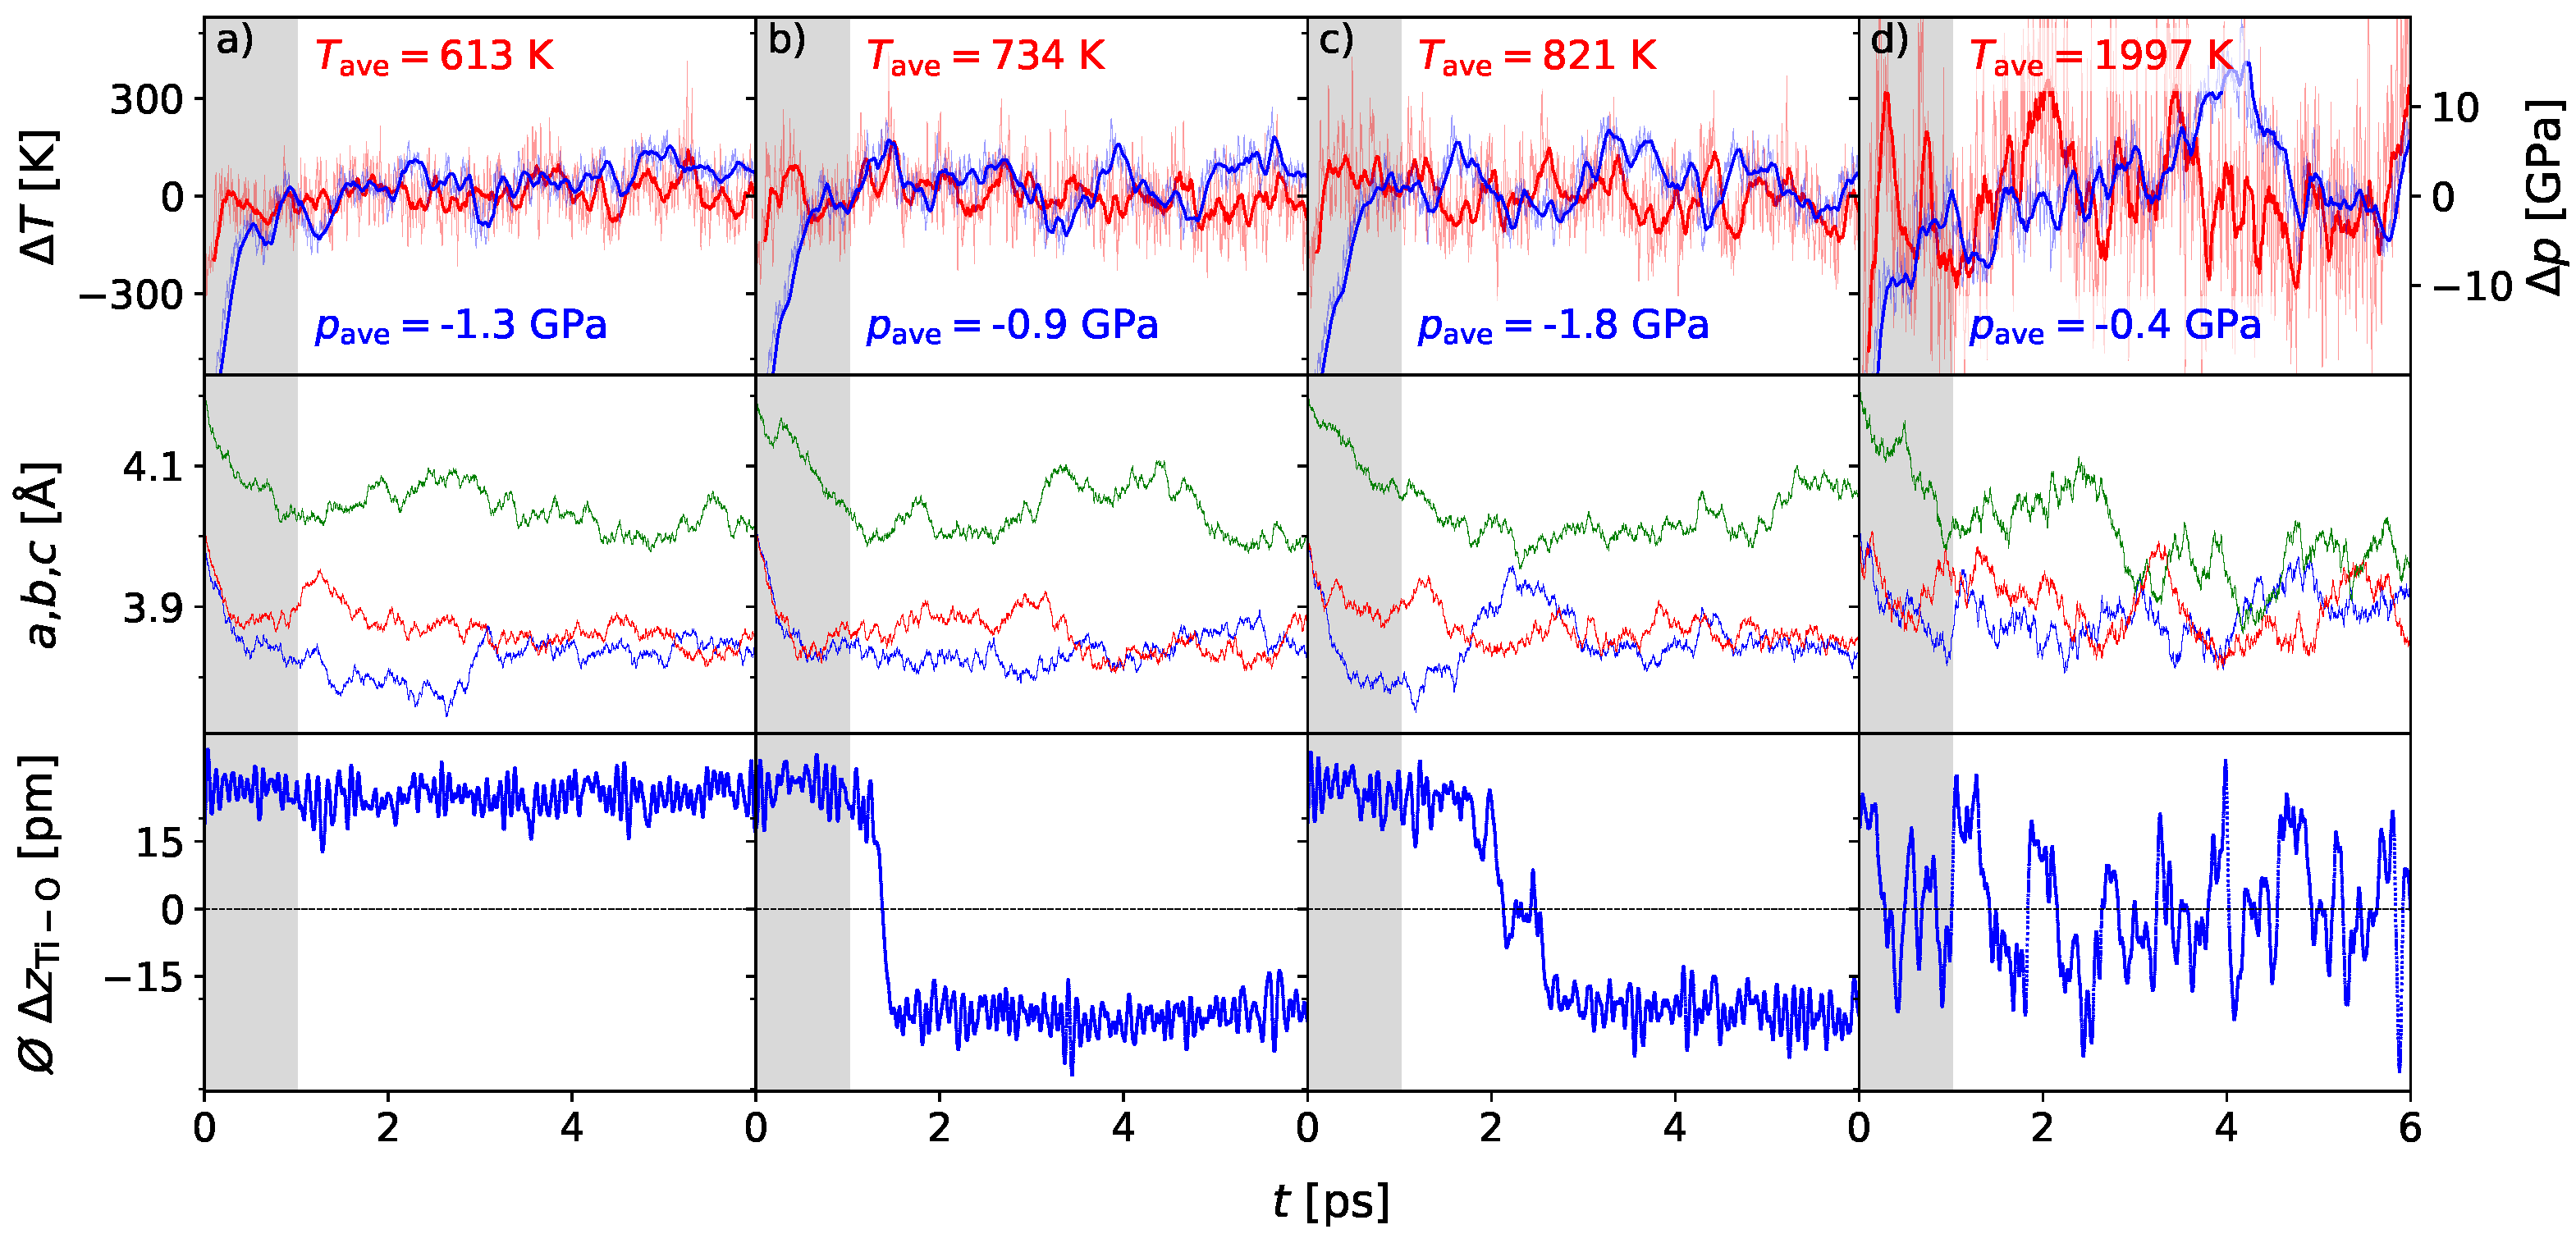
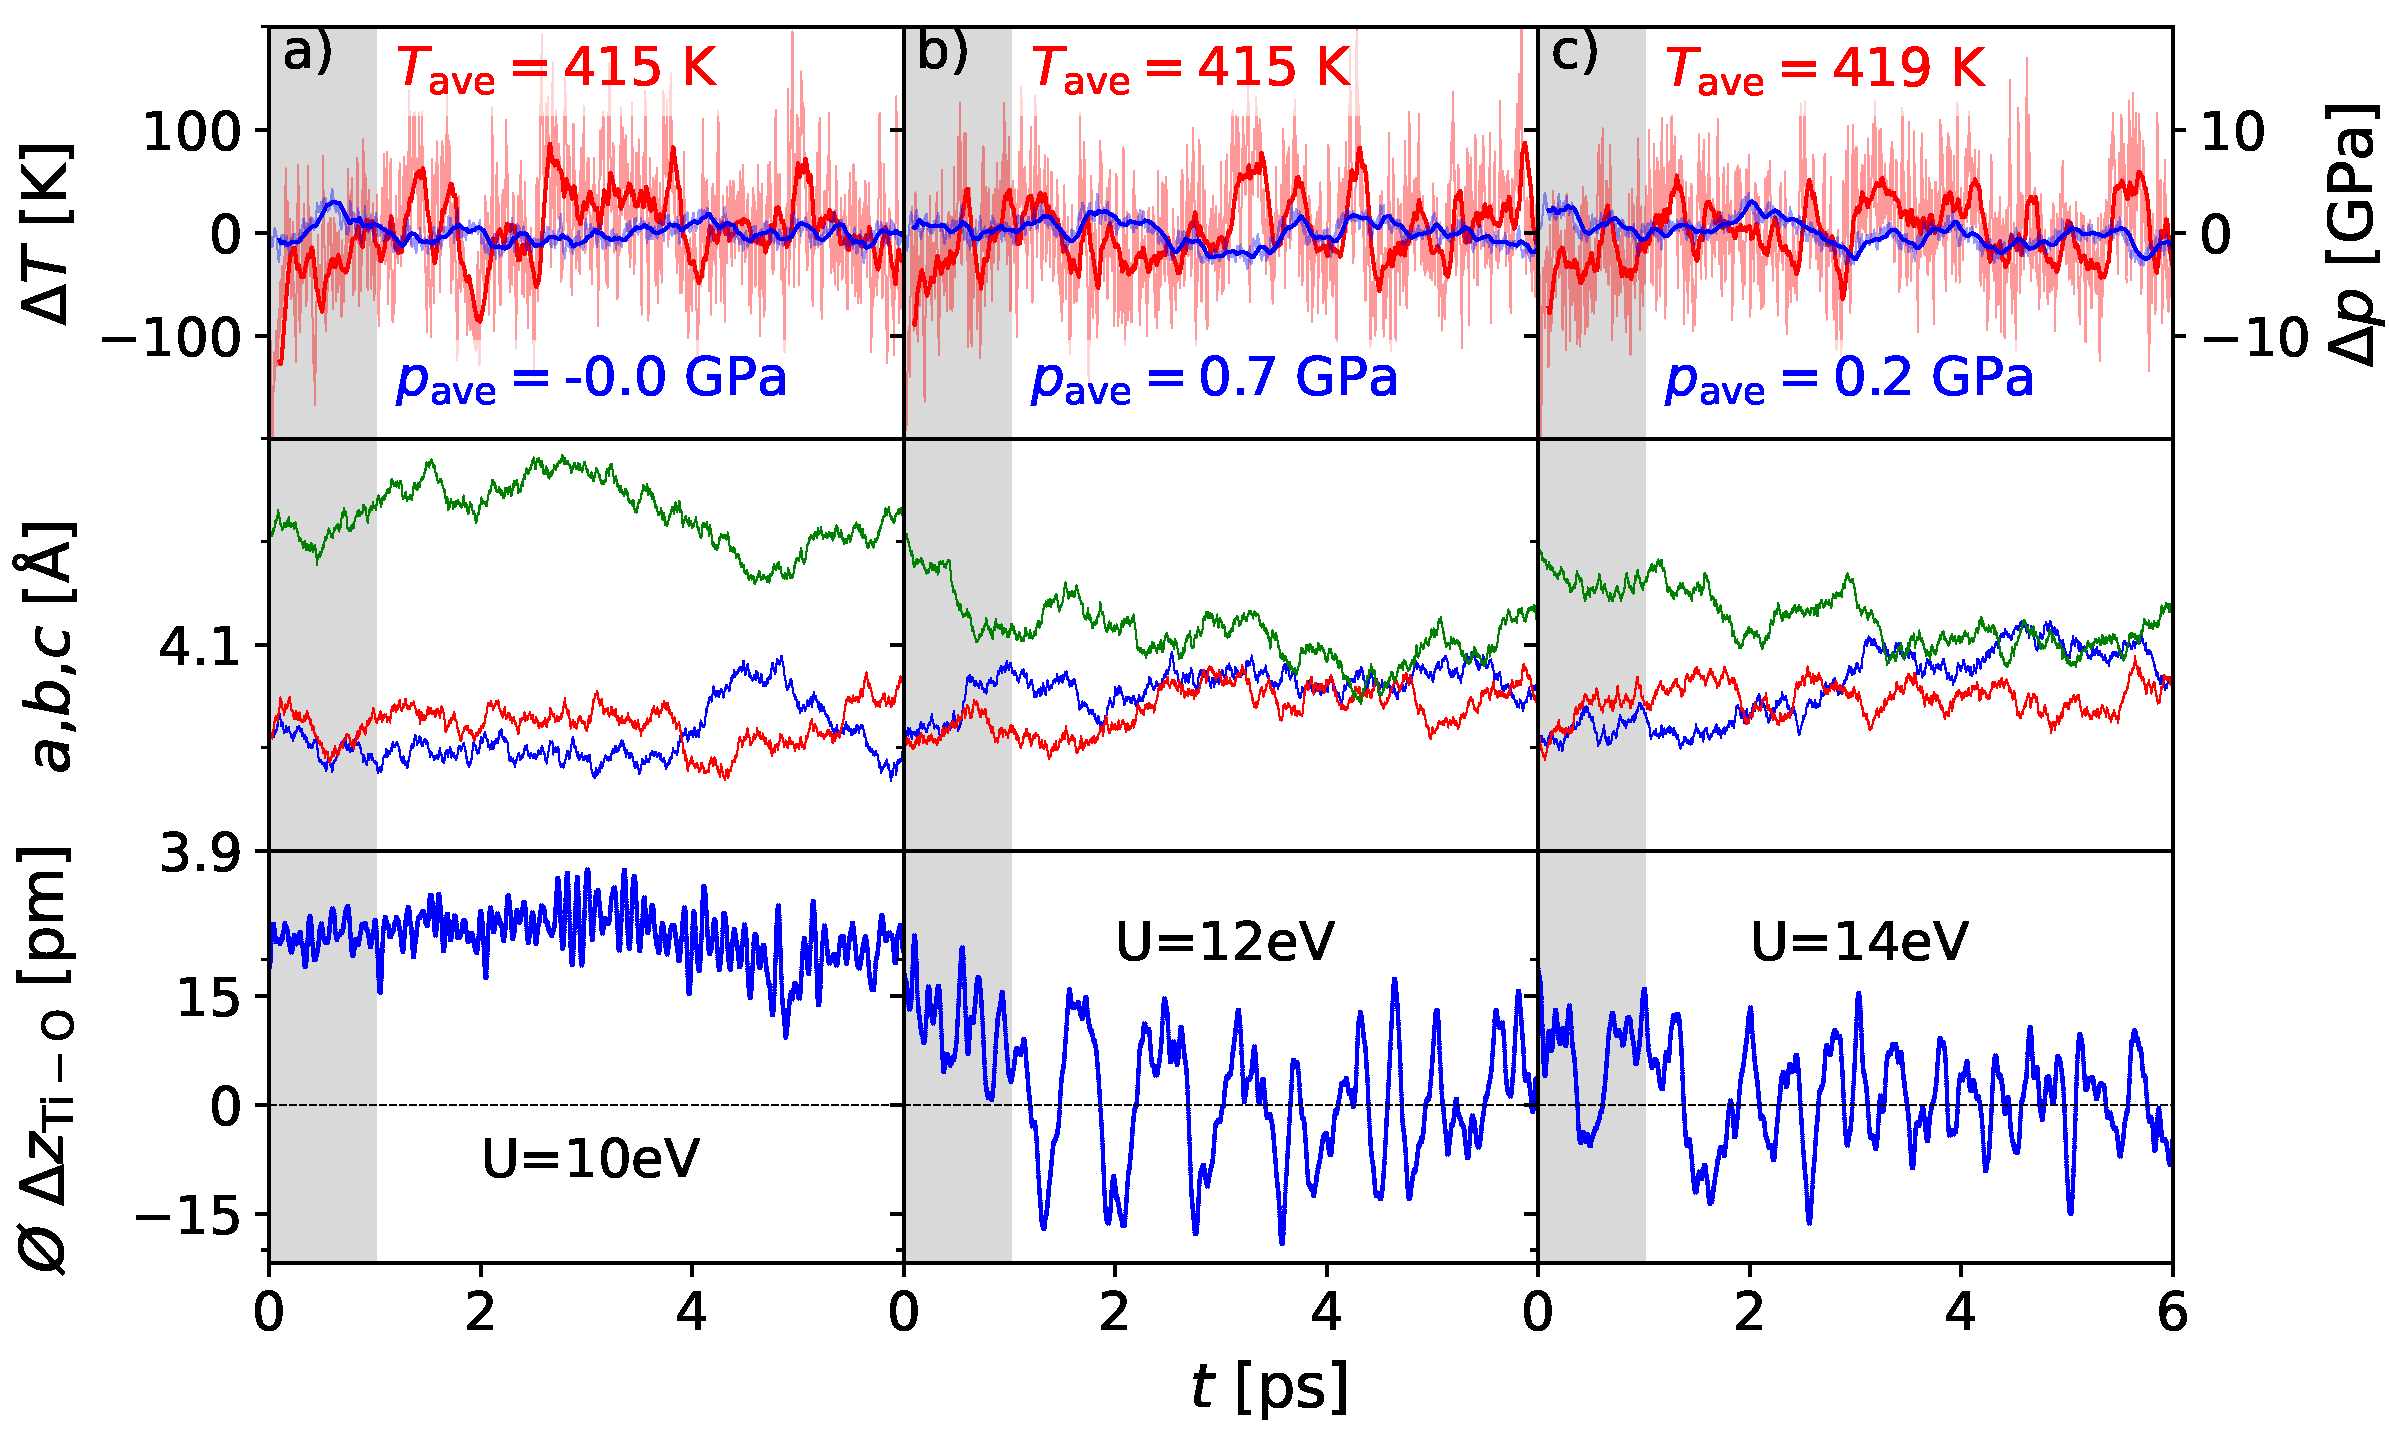
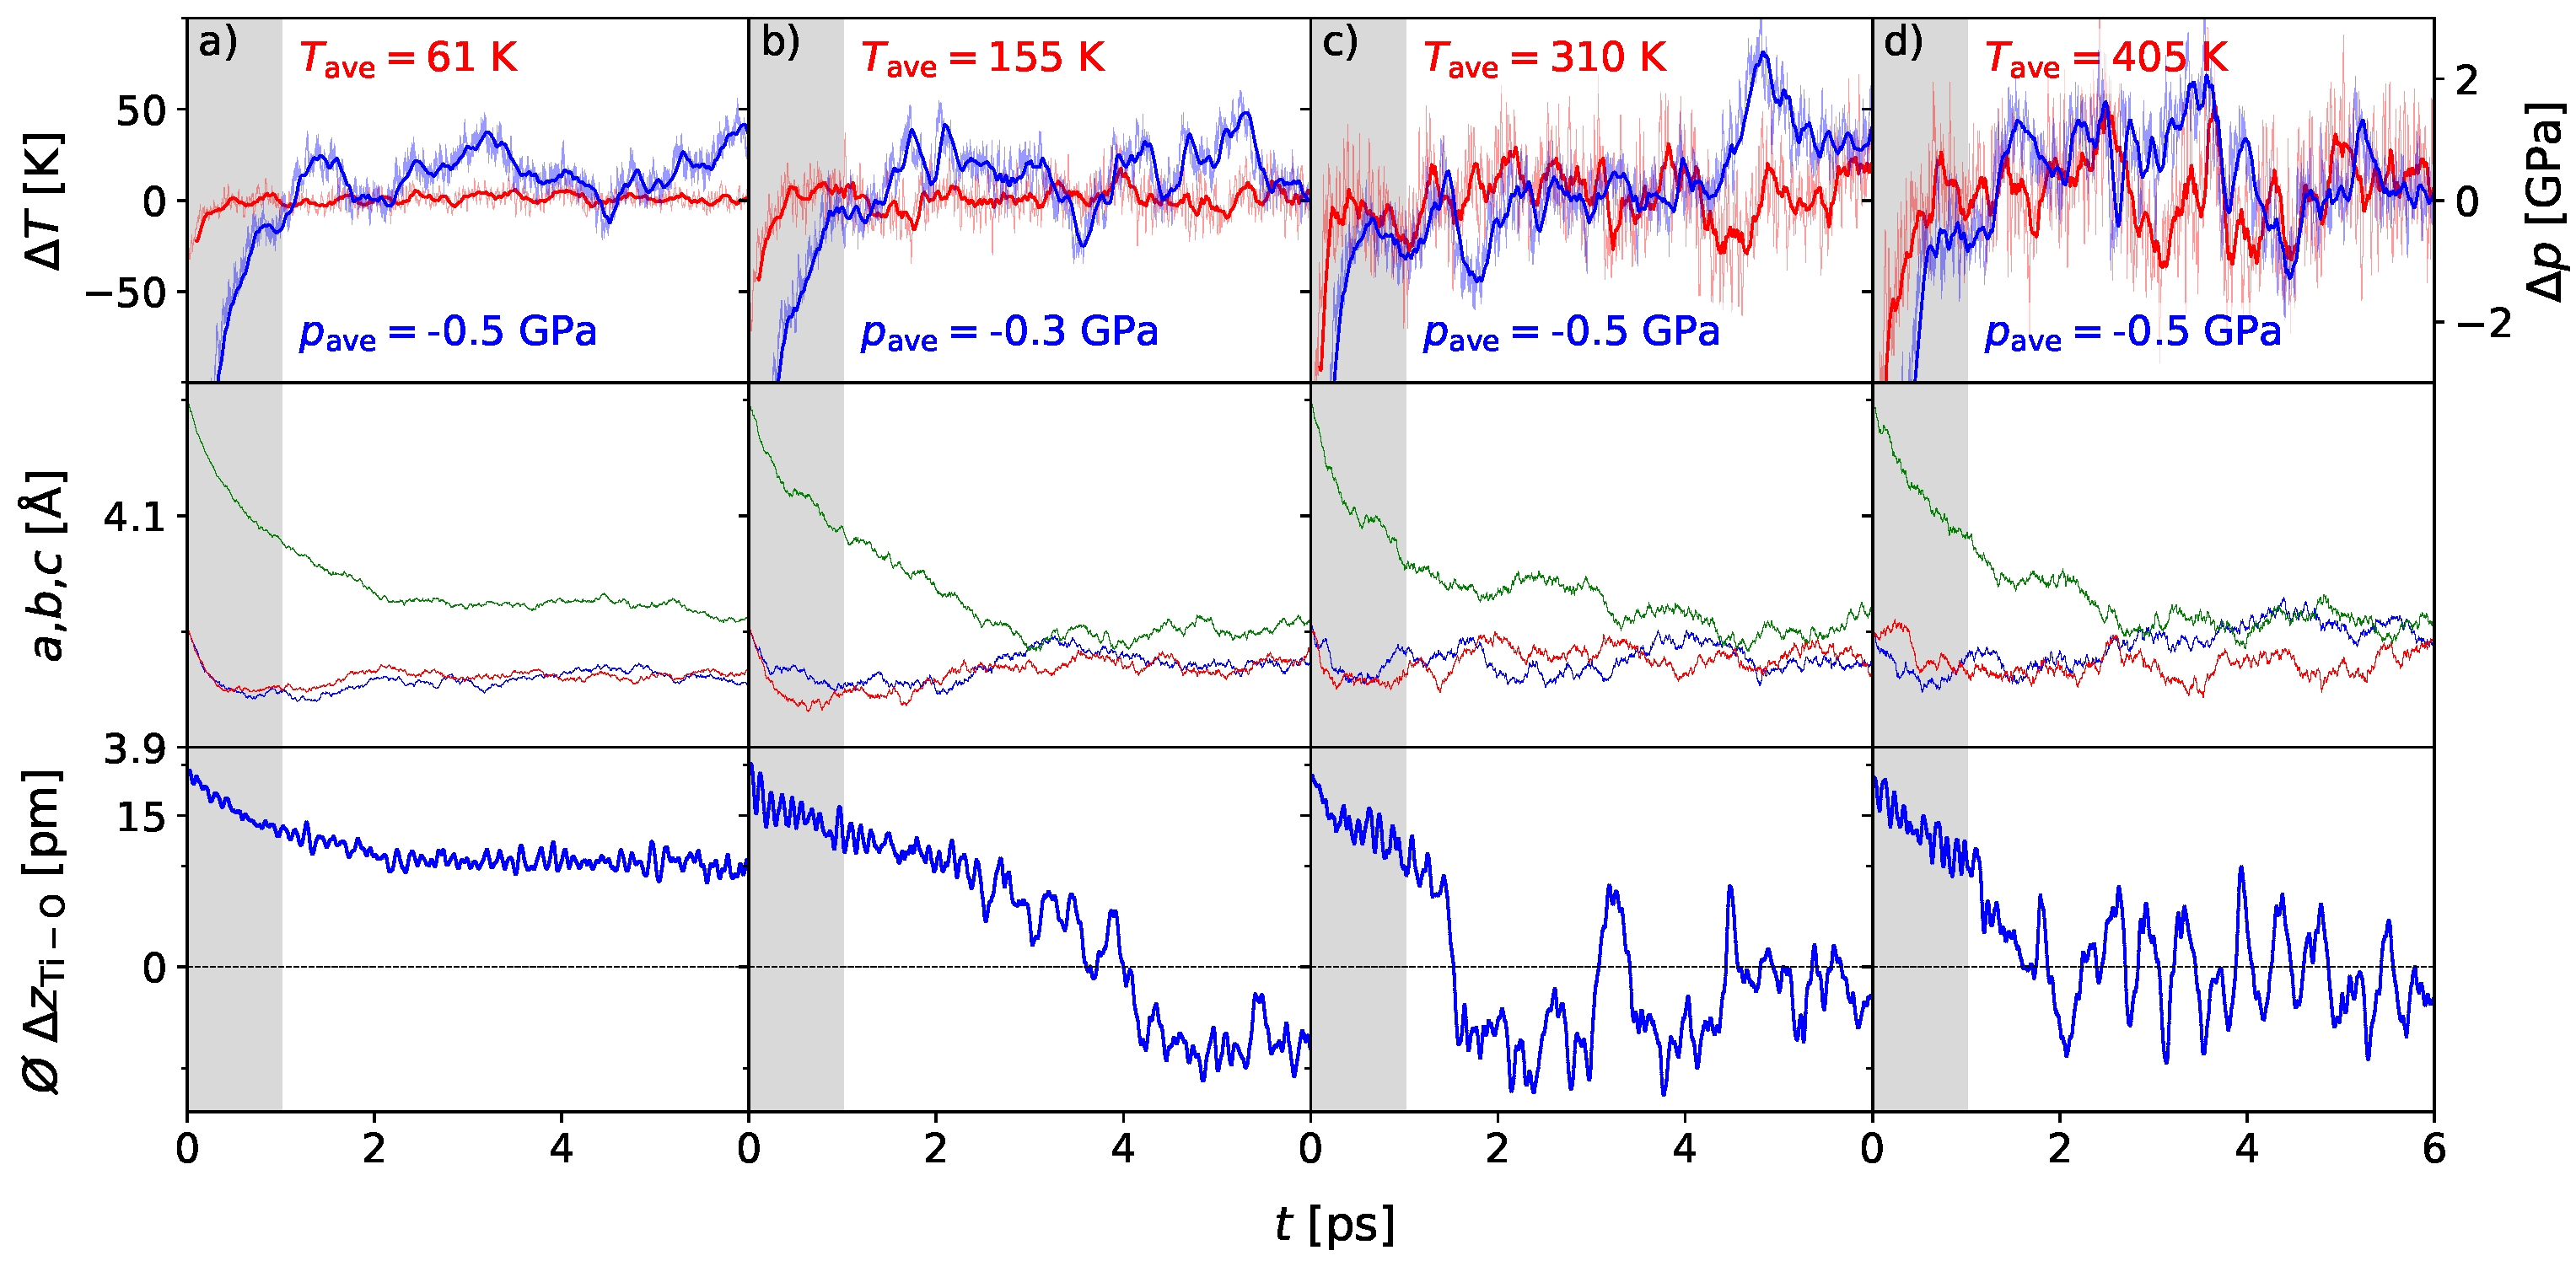
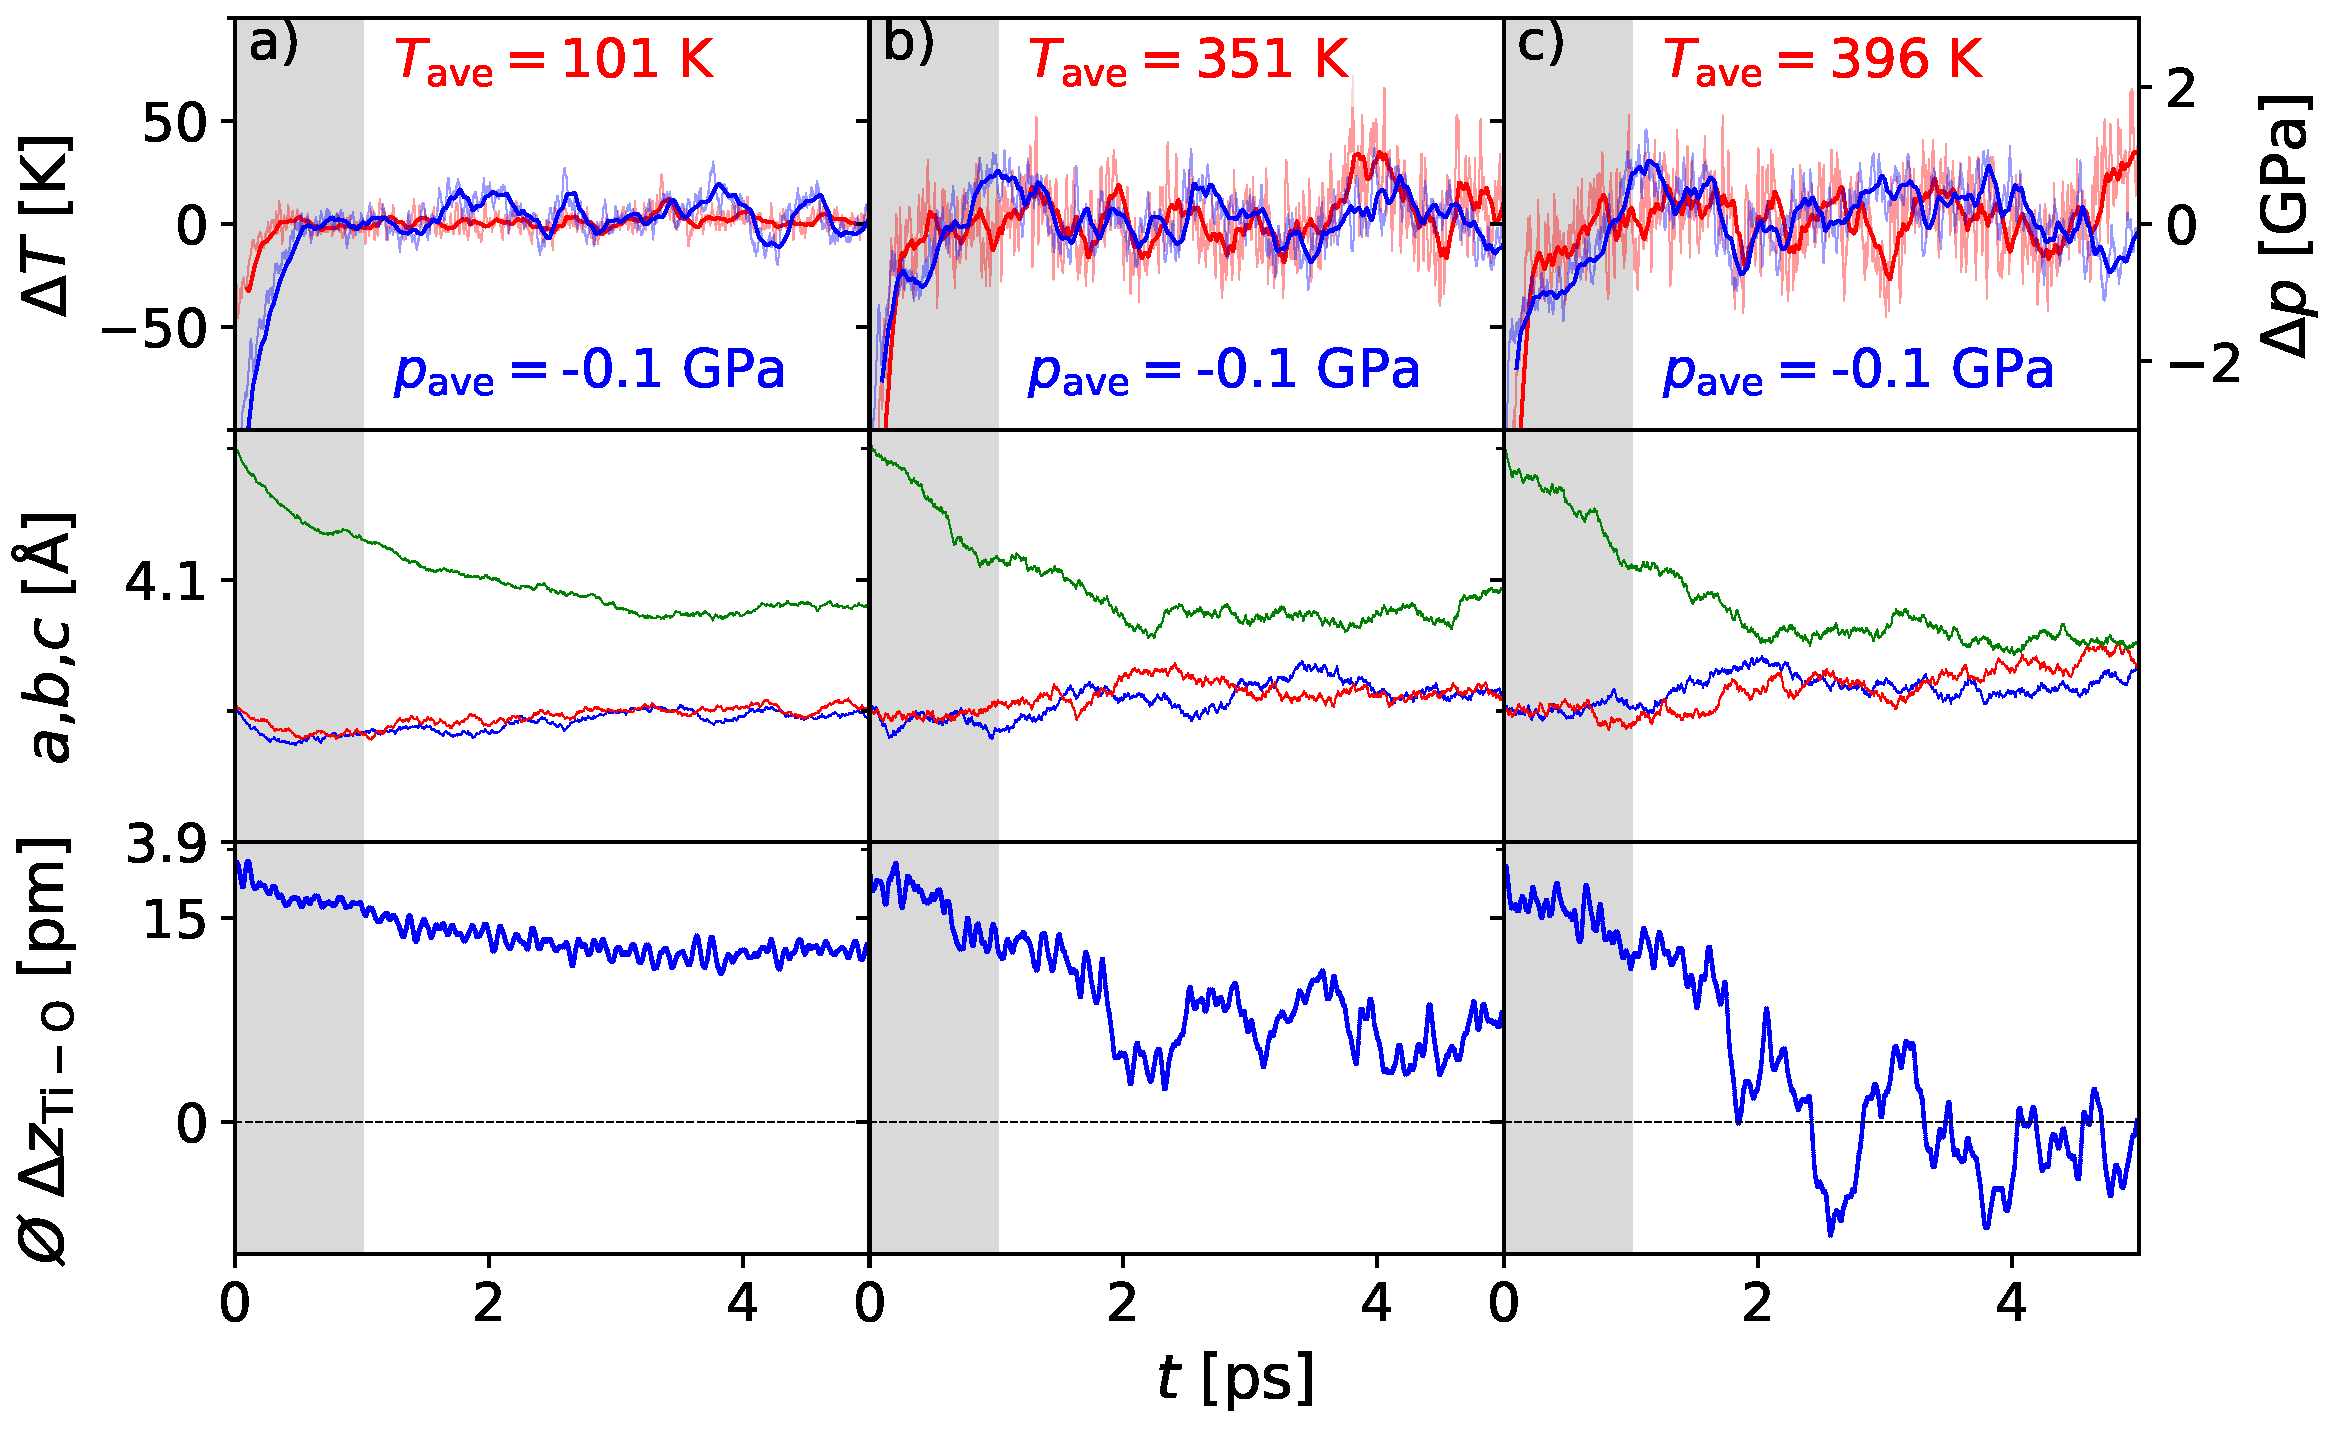
3. Results
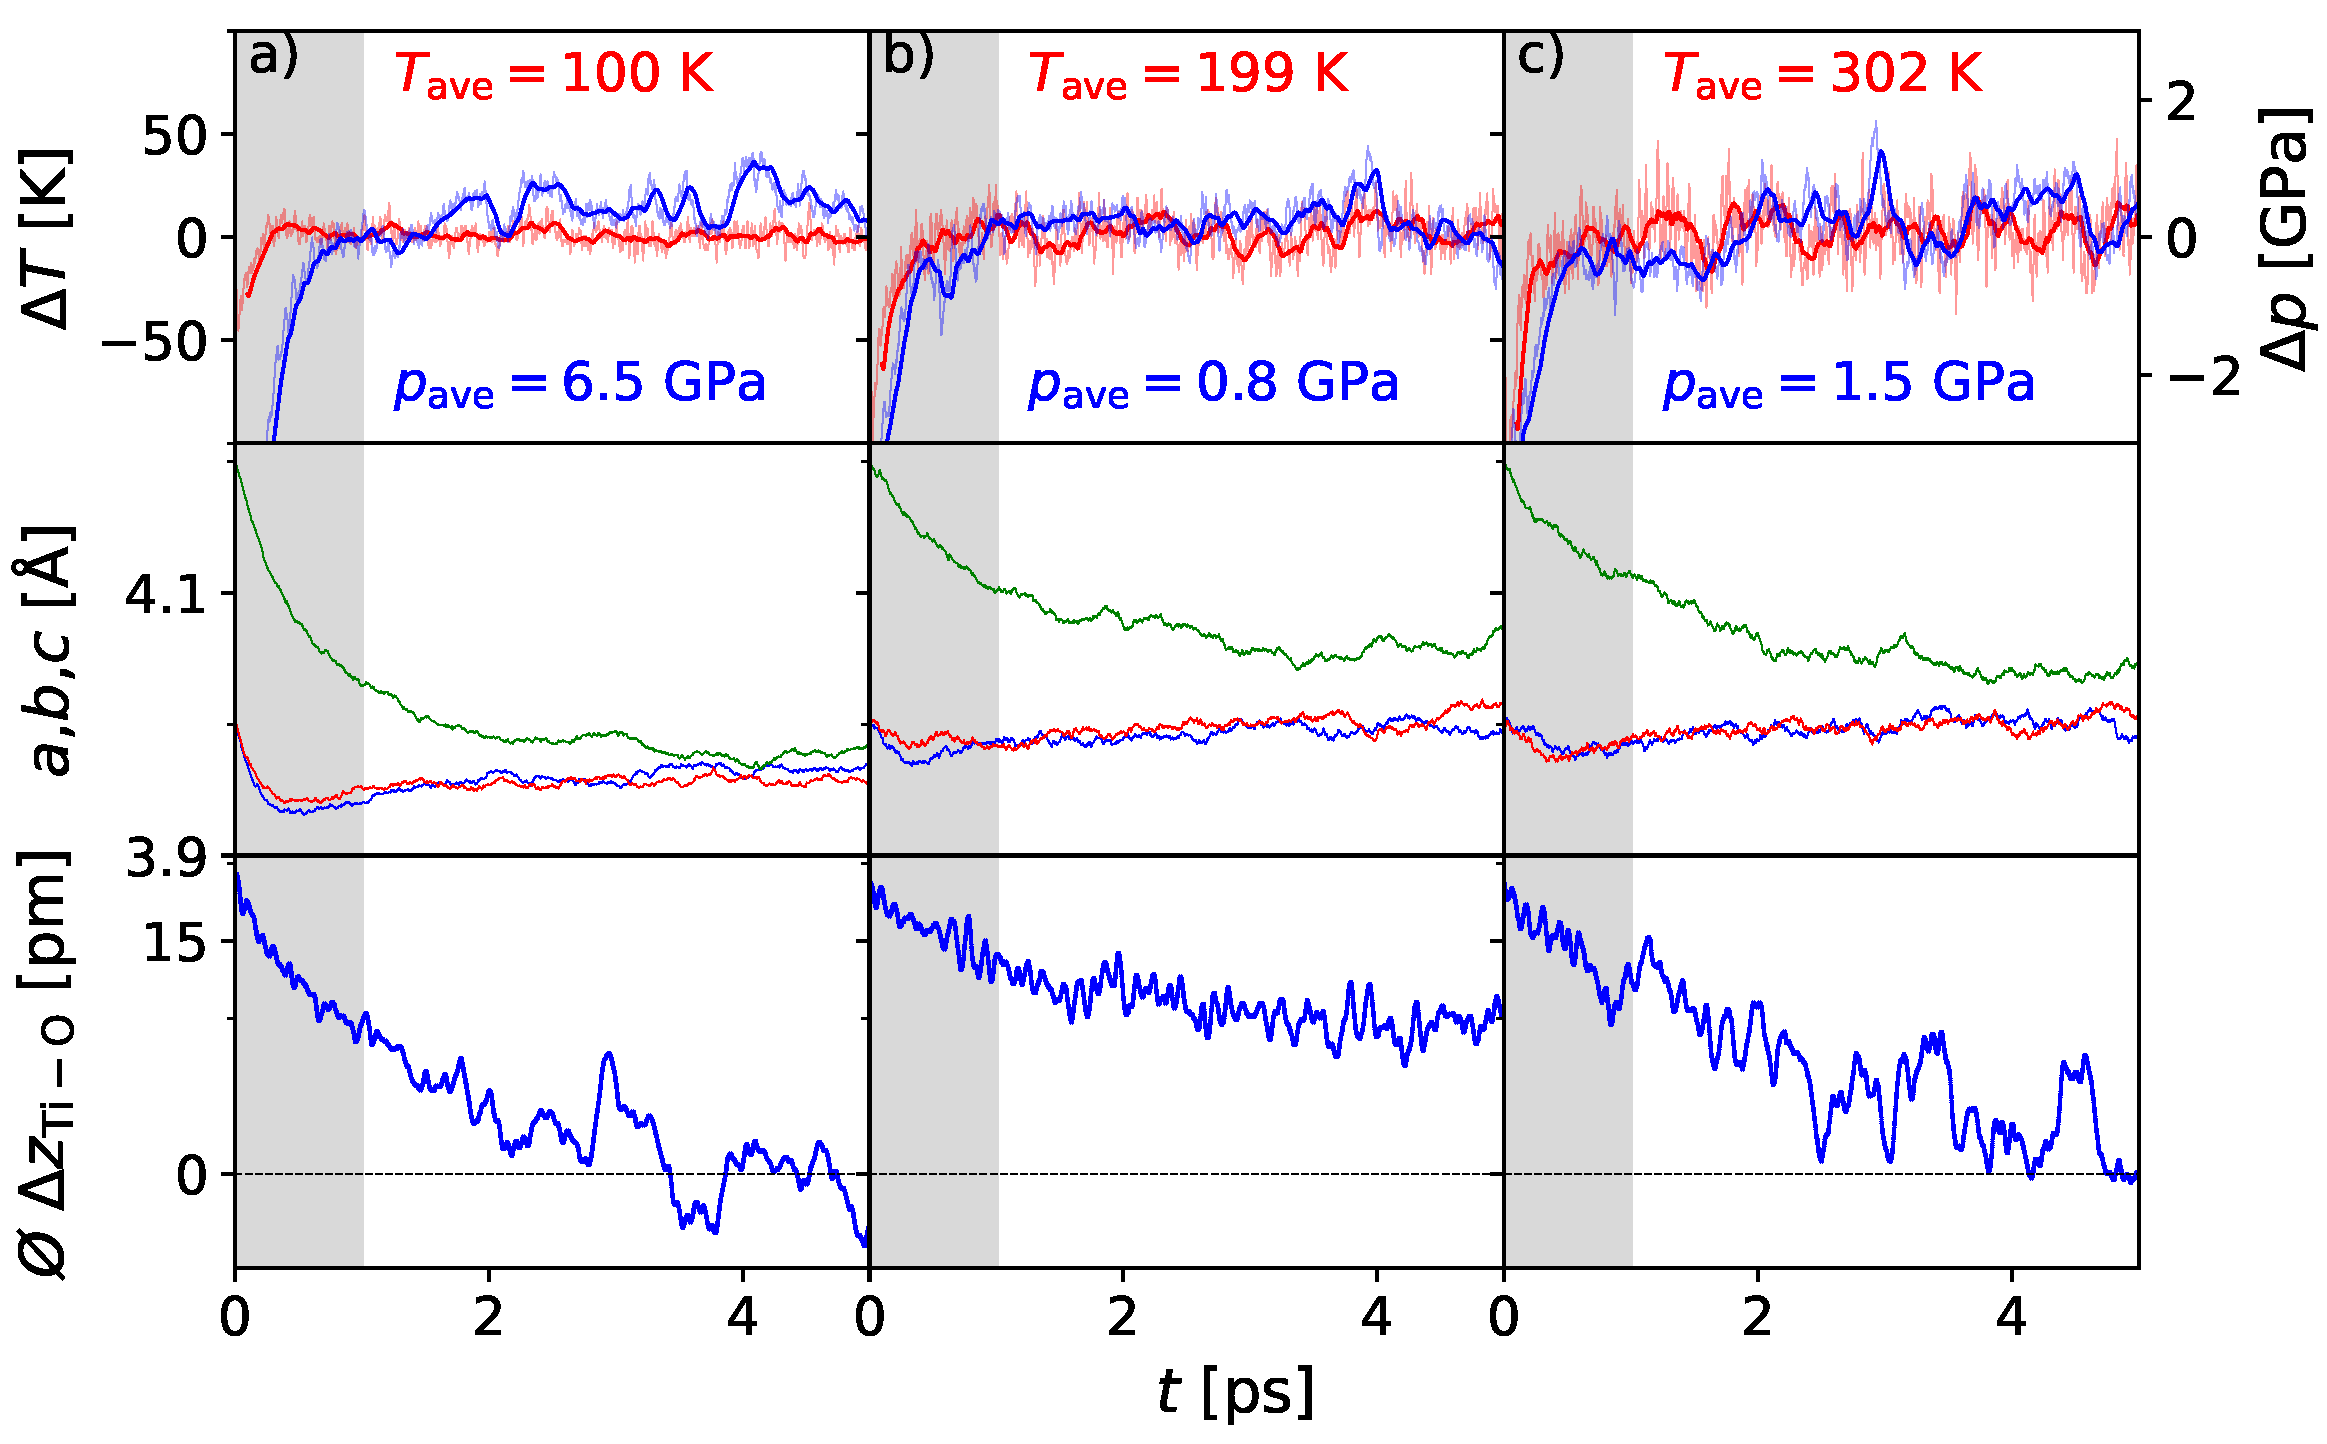
3.1. Polarization Switching Due to Temperature
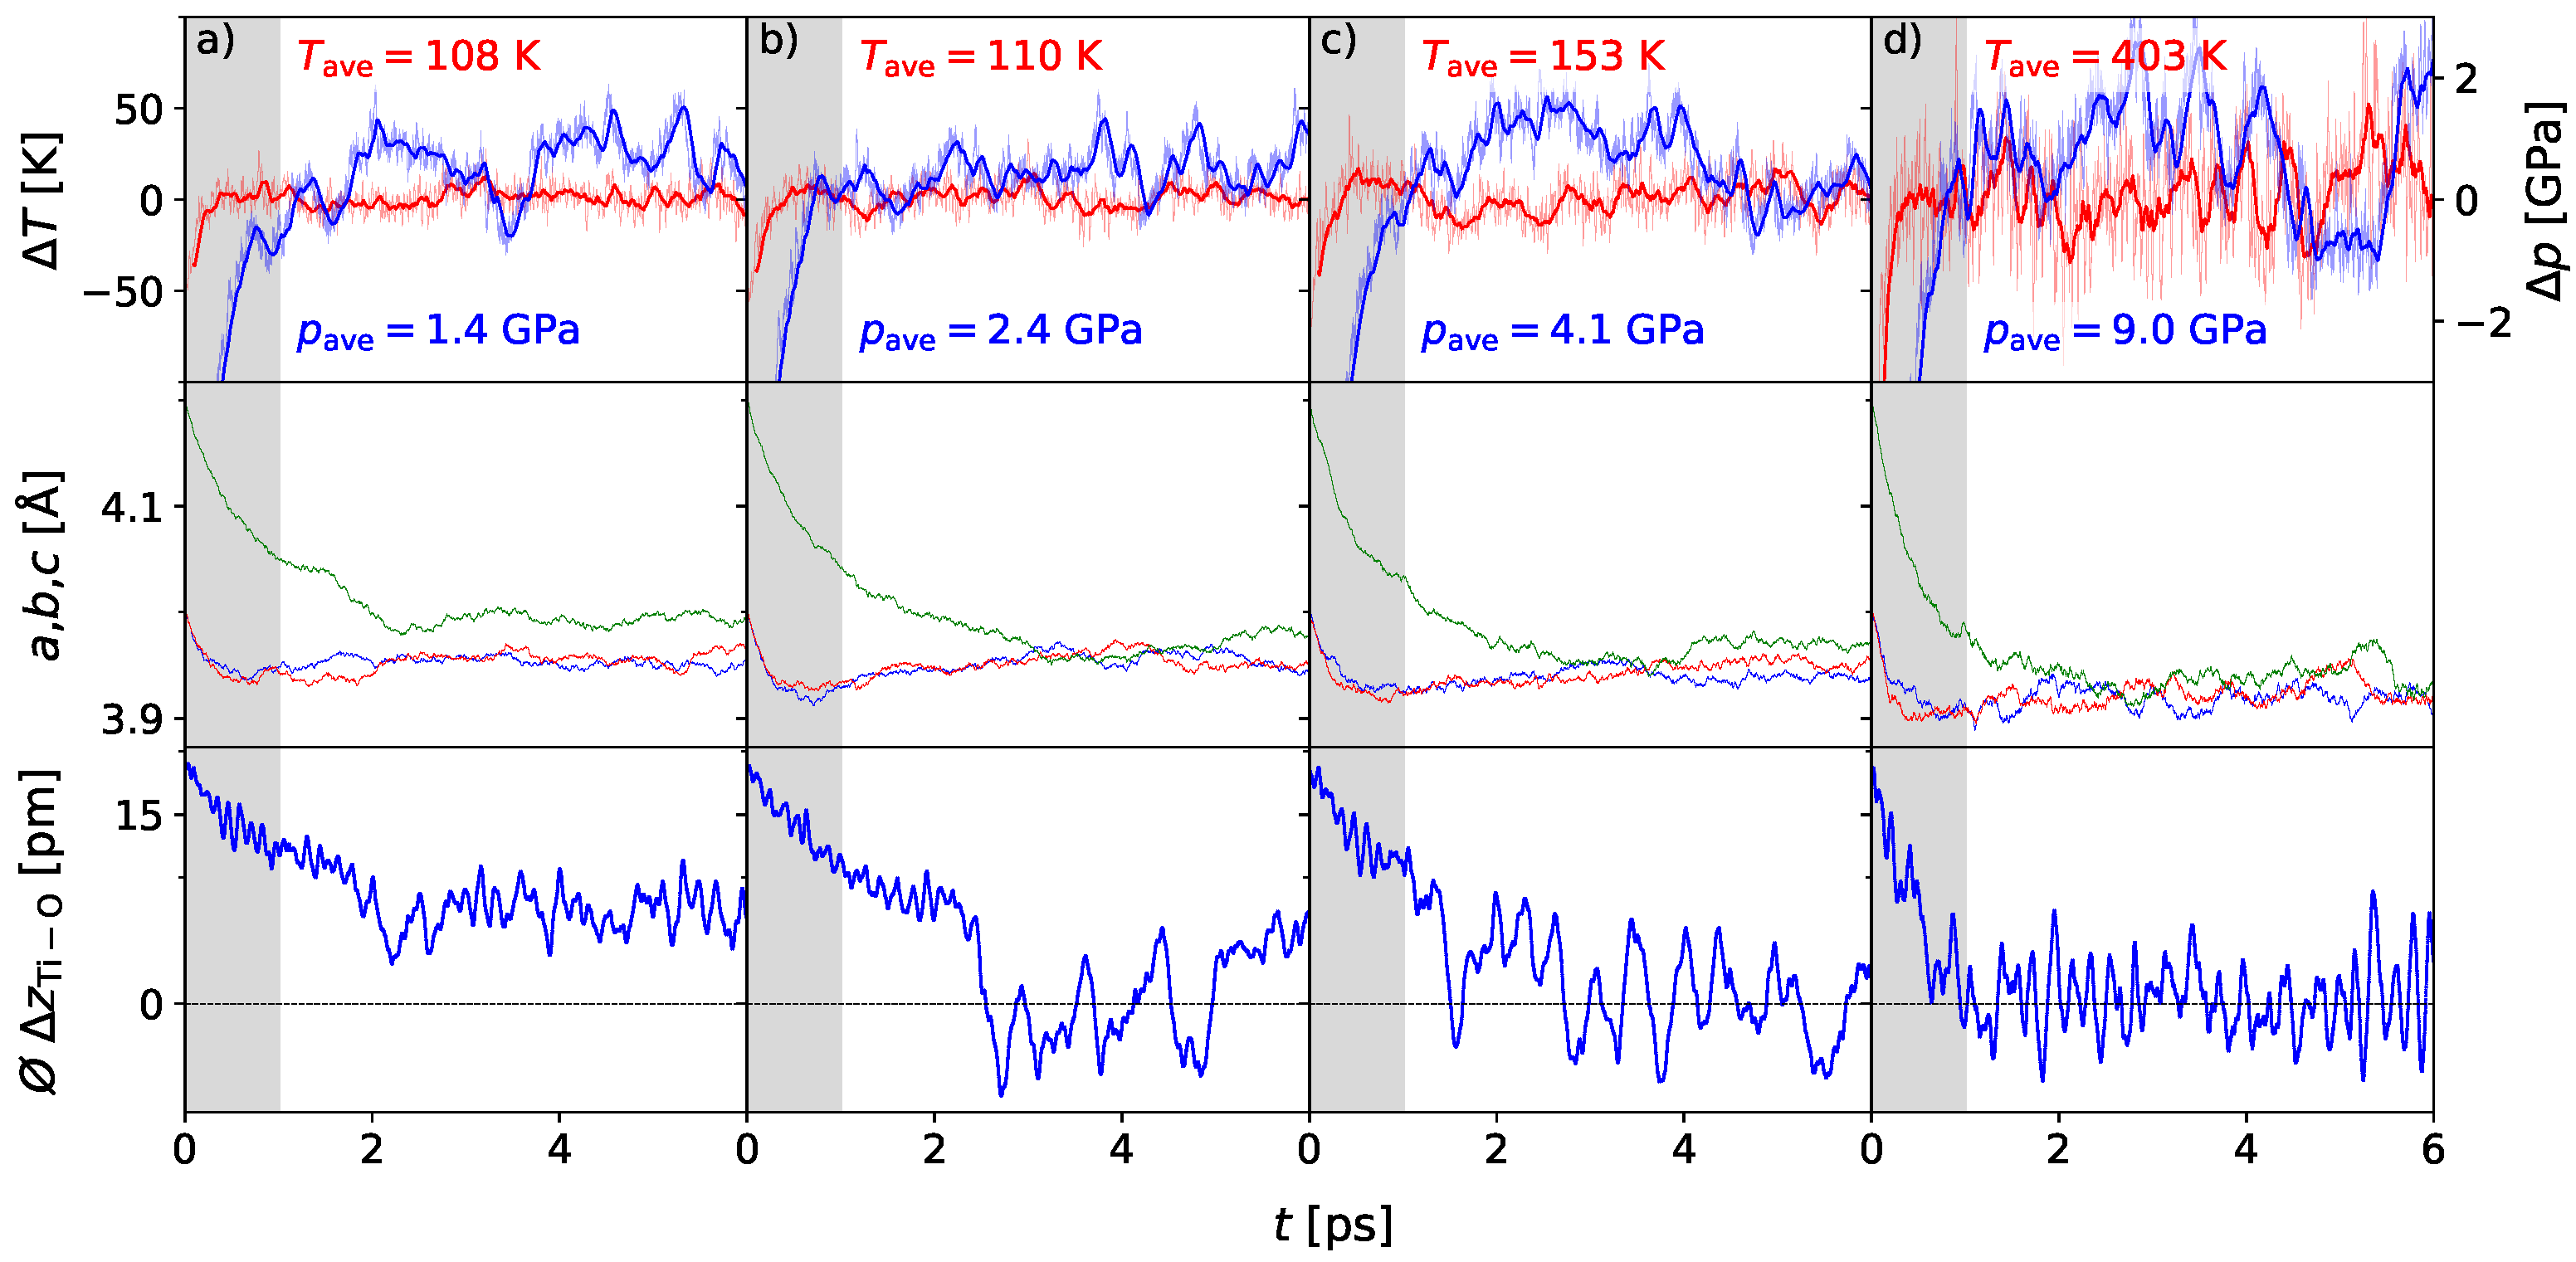
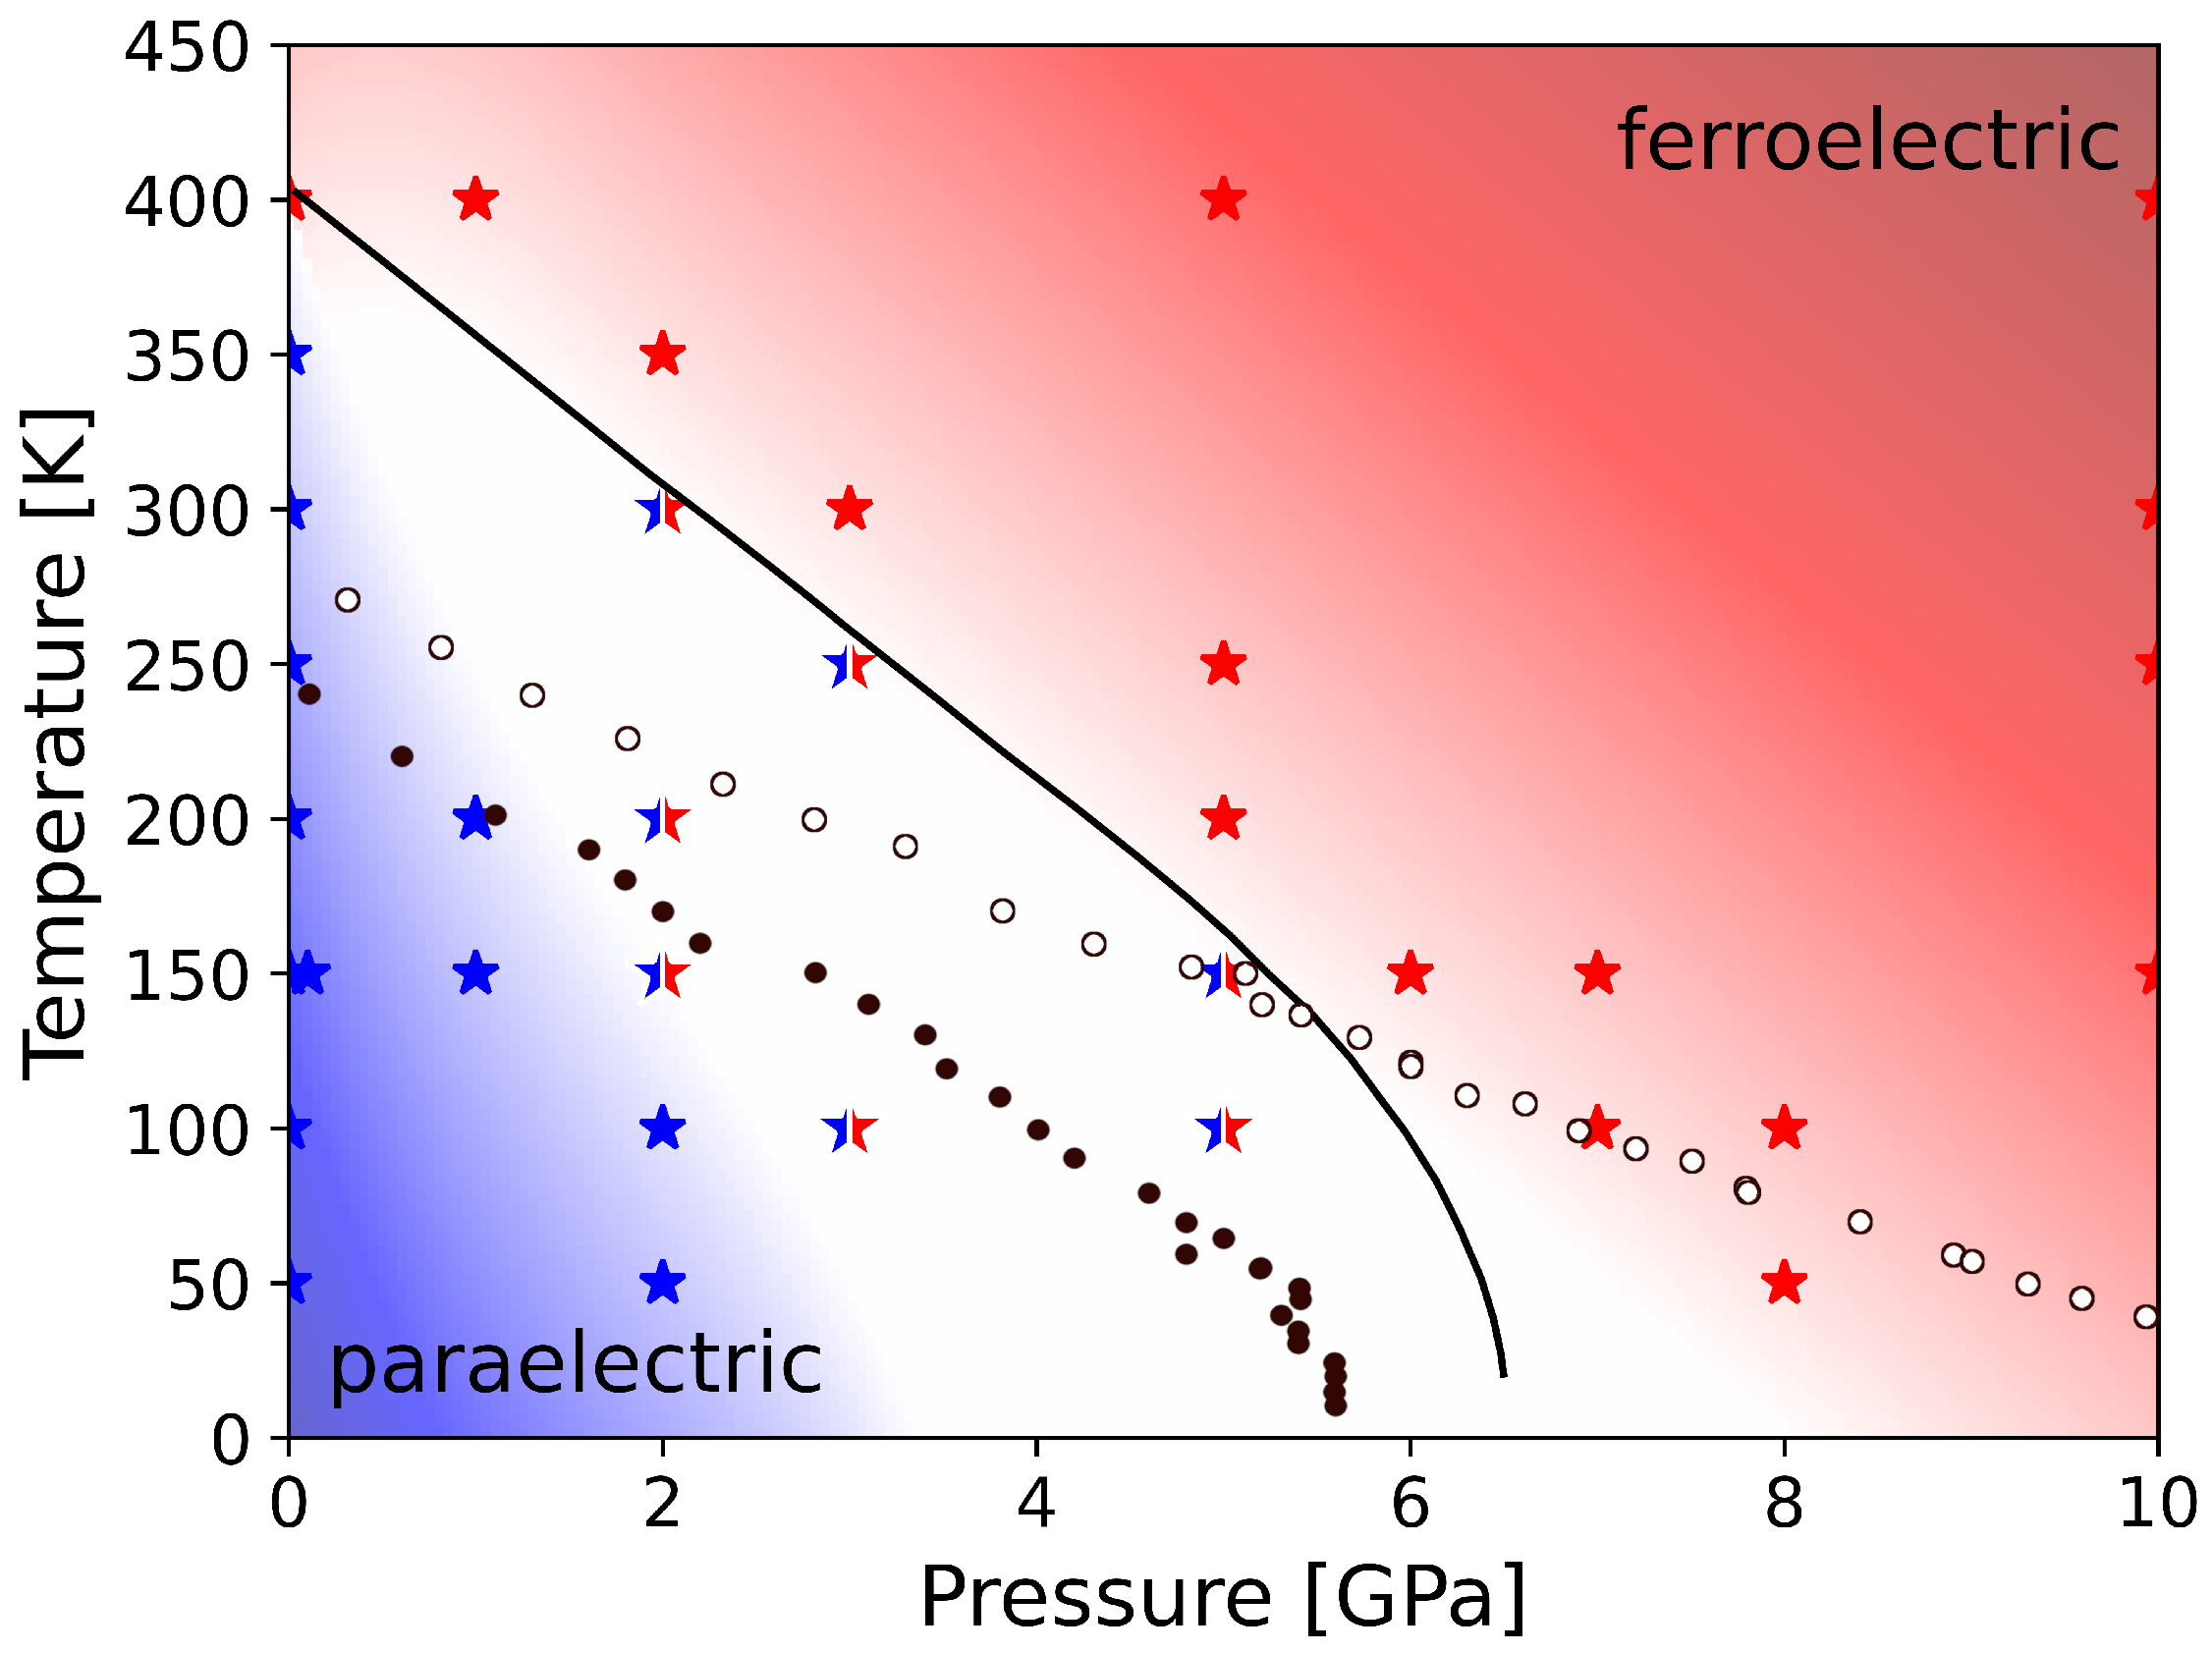
3.2. Influence of Pressure on the Phase Transition
4. Conclusions
Supplementary Materials
Author Contributions
Funding
Institutional Review Board Statement
Informed Consent Statement
Data Availability Statement
Acknowledgments
Conflicts of Interest
References
- Lines, M.E.; Glass, A.M. Principles and Applications of Ferroelectrics and Related Materials; Oxford University Press: Oxford, UK, 2001. [Google Scholar]
- Onishi, T. Ferroelectric Perovskites for High-Speed Memory: A Mechanism Revealed by Quantum Bonding Motion; Springer Nature: Berlin/Heidelberg, Germany, 2022. [Google Scholar]
- Picinin, A.; Lente, M.H.; Eiras, J.A.; Rino, J.P. Theoretical and experimental investigations of polarization switching in ferroelectric materials. Phys. Rev. B 2004, 69, 064117. [Google Scholar] [CrossRef]
- Jaykhedkar, N.; Tripathy, N.; Shah, V.; Pujari, B.; Premkumar, S. A comprehensive study of pressure dependent phase transitions in ferroelectric PbTiO3, PbZrO3 and BaTiO3. Mater. Chem. Phys. 2020, 254, 123545. [Google Scholar] [CrossRef]
- Uchino, K. Piezoelectric Actuators and Ultrasonic Motors; Springer Science & Business Media: Berlin/Heidelberg, Germany, 1996; Volume 1. [Google Scholar]
- Karaki, T.; Yan, K.; Adachi, M. Barium titanate piezoelectric ceramics manufactured by two-step sintering. Jpn. J. Appl. Phys. 2007, 46, 7035. [Google Scholar] [CrossRef]
- Buessem, W.; Cross, L.; Goswami, A. Phenomenological theory of high permittivity in fine-grained barium titanate. J. Am. Ceram. Soc. 1966, 49, 33–36. [Google Scholar] [CrossRef]
- Bersuker, I. On the origin of ferroelectricity in perovskite-type crystals. Phys. Lett. 1966, 20, 589–590. [Google Scholar] [CrossRef]
- Chen, K.H.; Chen, Y.C.; Chen, Z.S.; Yang, C.F.; Chang, T.C. Temperature and frequency dependence of the ferroelectric characteristics of BaTiO3 thin films for nonvolatile memory applications. Appl. Phys. A 2007, 89, 533–536. [Google Scholar] [CrossRef]
- Yun, W.S.; Urban, J.J.; Gu, Q.; Park, H. Ferroelectric properties of individual barium titanate nanowires investigated by scanned probe microscopy. Nano Lett. 2002, 2, 447–450. [Google Scholar] [CrossRef]
- Ishidate, T.; Abe, S.; Takahashi, H.; Môri, N. Phase Diagram of BaTiO3. Phys. Rev. Lett. 1997, 78, 2397–2400. [Google Scholar] [CrossRef]
- Glazer, A. Simple ways of determining perovskite structures. Acta Crystallogr. Sect. A Cryst. Phys. Diffr. Theor. Gen. Crystallogr. 1975, 31, 756–762. [Google Scholar] [CrossRef]
- Xiang, H.J.; Guennou, M.; Íñiguez, J.; Kreisel, J.; Bellaiche, L. Rules and mechanisms governing octahedral tilts in perovskites under pressure. Phys. Rev. B 2017, 96, 054102. [Google Scholar] [CrossRef]
- Chaves, A.S.; Barreto, F.C.S.; Nogueira, R.A.; Zẽks, B. Thermodynamics of an eight-site order-disorder model for ferroelectrics. Phys. Rev. B 1976, 13, 207–212. [Google Scholar] [CrossRef]
- Comes, R.; Lambert, M.; Guinier, A. The chain structure of BaTiO3 and KNbO3. Solid State Commun. 1968, 6, 715–719. [Google Scholar] [CrossRef]
- Cochran, W. Crystal Stability and the Theory of Ferroelectricity. Phys. Rev. Lett. 1959, 3, 412–414. [Google Scholar] [CrossRef]
- Harada, J.; Axe, J.D.; Shirane, G. Neutron-Scattering Study of Soft Modes in Cubic BaTiO3. Phys. Rev. B 1971, 4, 155–162. [Google Scholar] [CrossRef]
- Bilz, H.; Benedek, G.; Bussmann-Holder, A. Theory of ferroelectricity: The polarizability model. Phys. Rev. B 1987, 35, 4840–4849. [Google Scholar] [CrossRef] [PubMed]
- Cohen, R.E.; Krakauer, H. Electronic structure studies of the differences in ferroelectric behavior of BaTiO3 and PbTiO3. Ferroelectrics 1992, 136, 65–83. [Google Scholar] [CrossRef]
- Müller, K.; Luspin, Y.; Servoin, J.; Gervais, F. Displacive-order-disorder crossover at the ferroelectric-paraelectric phase transitions of BaTiO3 and LiTaO3. J. Phys. Lett. 1982, 43, 537–542. [Google Scholar] [CrossRef]
- Eliovich, Y.A.; Targonskii, A.; Darinskii, A.; Prosekov, P.; Pisarevsky, Y.V.; Blagov, A.; Akkuratov, V.; Lomonov, V.; Kocharyan, V.; Mkrtchyan, A.; et al. Multiple-Wave Interaction of X-rays in a Paratellurite Crystal under Excitation of Ultrasonic Vibrations. J. Surf. Investig. X-ray Synchrotron Neutron Tech. 2019, 13, 570–577. [Google Scholar] [CrossRef]
- Eliovich, Y.A.; Ovchinnikova, E.; Kozlovskaya, K.; Zschornak, M.; Weigel, T.; Ludt, C.; Blagov, A.; Dmitrienko, V.; Pisarevskii, Y.V.; Koval’chuk, M. Possibility of Controlled Variation of the Atomic Crystal Structure of Paratellurite by Means of the Excitation of an Ultrasonic Standing Wave. JETP Lett. 2022, 115, 456–460. [Google Scholar] [CrossRef]
- Zschornak, M.; Gemming, S.; Gutmann, E.; Weißbach, T.; Stöcker, H.; Leisegang, T.; Riedl, T.; Tränkner, M.; Gemming, T.; Meyer, D. Surface modeling and chemical solution deposition of SrTiO3)n Ruddlesden–Popper phases. Acta Mater. 2010, 58, 4650–4659. [Google Scholar] [CrossRef]
- Ludt, C.; Zschornak, M. Electronic structure of the homologous series of Ruddlesden–Popper phases SrO(SrTiO3)n, (n = 0–3, ∞). Zeitschrift für Kristallographie-Cryst. Mater. 2022, 237, 201–214. [Google Scholar] [CrossRef]
- Stöcker, H.; Zschornak, M.; Leisegang, T.; Shakhverdova, I.; Gemming, S.; Meyer, D.C. Electric field mediated switching of mechanical properties of strontium titanate at room temperature. Cryst. Res. Technol. 2010, 45, 13–17. [Google Scholar] [CrossRef]
- Stöcker, H.; Hanzig, J.; Zschornak, M.; Mehner, E.; Jachalke, S.; Richter, C.; Hanzig, F.; Meutzner, F.; Leisegang, T.; Meyer, D.C. Strontium titanate: From symmetry changes to functionality. Cryst. Res. Technol. 2017, 52, 1600222. [Google Scholar] [CrossRef]
- Ludt, C.; Ovchinnikova, E.; Kulikov, A.; Novikov, D.; Gemming, S.; Meyer, D.C.; Zschornak, M. Interactions of Ruddlesden-Popper Phases and Migration-Induced Field-Stabilized Polar Phase in Strontium Titanate. Crystals 2021, 11, 693. [Google Scholar] [CrossRef]
- Diéguez, O.; Tinte, S.; Antons, A.; Bungaro, C.; Neaton, J.B.; Rabe, K.M.; Vanderbilt, D. Ab initio study of the phase diagram of epitaxial BaTiO3. Phys. Rev. B 2004, 69, 212101. [Google Scholar] [CrossRef]
- Luspin, Y.; Servoin, J.; Gervais, F. Soft mode spectroscopy in barium titanate. J. Phys. C Solid State Phys. 1980, 13, 3761. [Google Scholar] [CrossRef]
- Ma, S.; Wang, X.; Zhou, J.; Li, L.; Sun, C.Q. Thermal stability of the nanostructured BaTiO3 determined by long and short range interactions: A dual-shell model. J. Appl. Phys. 2010, 107, 064102. [Google Scholar] [CrossRef]
- Akbarian, D.; Yilmaz, D.E.; Cao, Y.; Ganesh, P.; Dabo, I.; Munro, J.; Van Ginhoven, R.; van Duin, A.C.T. Understanding the influence of defects and surface chemistry on ferroelectric switching: A ReaxFF investigation of BaTiO3. Phys. Chem. Chem. Phys. 2019, 21, 18240–18249. [Google Scholar] [CrossRef]
- Zhou, L.; Zhang, X.L.; Cao, Y.Y.; Zheng, F.; Gao, H.; Liu, H.F.; Ma, Z. Prediction of flexoelectricity in BaTiO3 using molecular dynamics simulations. Chin. Phys. B 2023, 32, 017701. [Google Scholar] [CrossRef]
- Qi, Y.; Liu, S.; Grinberg, I.; Rappe, A.M. Atomistic description for temperature-driven phase transitions in BaTiO3. Phys. Rev. B 2016, 94, 134308. [Google Scholar] [CrossRef]
- Marx, D.; Hutter, J. Ab Initio Molecular Dynamics: Basic Theory and Advanced Methods; Cambridge University Press: Cambridge, UK, 2009. [Google Scholar]
- Kresse, G.; Furthmüller, J.; Hafner, J. Theory of the crystal structures of selenium and tellurium: The effect of generalized-gradient corrections to the local-density approximation. Phys. Rev. B 1994, 50, 13181–13185. [Google Scholar] [CrossRef]
- Kresse, G.; Furthmüller, J. Efficiency of ab-initio total energy calculations for metals and semiconductors using a plane-wave basis set. Comput. Mater. Sci. 1996, 6, 15–50. [Google Scholar] [CrossRef]
- Kresse, G.; Furthmüller, J. Efficient iterative schemes for ab initio total-energy calculations using a plane-wave basis set. Phys. Rev. B 1996, 54, 11169–11186. [Google Scholar] [CrossRef] [PubMed]
- Kresse, G.; Joubert, D. From ultrasoft pseudopotentials to the projector augmented-wave method. Phys. Rev. B 1999, 59, 1758–1775. [Google Scholar] [CrossRef]
- Perdew, J.P.; Ruzsinszky, A.; Csonka, G.I.; Vydrov, O.A.; Scuseria, G.E.; Constantin, L.A.; Zhou, X.; Burke, K. Restoring the Density-Gradient Expansion for Exchange in Solids and Surfaces. Phys. Rev. Lett. 2008, 100, 136406. [Google Scholar] [CrossRef] [PubMed]
- Allen, M.P.; Tildesley, D.J. Computer Simulation of Liquids; Oxford University Press: Oxford, UK, 2017. [Google Scholar]
- Hoover, W.G.; Ladd, A.J.C.; Moran, B. High-Strain-Rate Plastic Flow Studied via Nonequilibrium Molecular Dynamics. Phys. Rev. Lett. 1982, 48, 1818–1820. [Google Scholar] [CrossRef]
- Evans, D.J. Computer “experiment” for nonlinear thermodynamics of Couette flow. J. Chem. Phys. 1983, 78, 3297–3302. [Google Scholar] [CrossRef]
- Parrinello, M.; Rahman, A. Crystal Structure and Pair Potentials: A Molecular-Dynamics Study. Phys. Rev. Lett. 1980, 45, 1196–1199. [Google Scholar] [CrossRef]
- Parrinello, M.; Rahman, A. Polymorphic transitions in single crystals: A new molecular dynamics method. J. Appl. Phys. 1981, 52, 7182–7190. [Google Scholar] [CrossRef]
- Ali, A.; Khan, I.; Ali, Z.; Khan, F.; Ahmad, I. First-principles study of BiFeO3 and BaTiO3 in tetragonal structure. Int. J. Mod. Phys. B 2019, 33, 1950231. [Google Scholar] [CrossRef]
- Sakayori, K.i.; Matsui, Y.; Abe, H.; Nakamura, E.; Kenmoku, M.; Hara, T.; Ishikawa, D.; Kokubu, A.; Hirota, K.i.; Ikeda, T. Curie Temperature of BaTiO3. Jpn. J. Appl. Phys. 1995, 34, 5443. [Google Scholar] [CrossRef]
- Yang, L.J.; Wu, L.Z.; Dong, S. First-principles study of the relaxor ferroelectricity of Ba(Zr, Ti)O3*. Chin. Phys. B 2015, 24, 127702. [Google Scholar] [CrossRef]
- Blagov, A.; Pisarevskii, Y.V.; Targonskii, A.; Eliovich, Y.A.; Koval’chuk, M. Evolution of X-ray rocking curves for paratellurite and lithium fluoride crystals under intense ultrasound. Phys. Solid State 2017, 59, 973–976. [Google Scholar] [CrossRef]
- Marchenkov, N.; Kulikov, A.; Targonsky, A.; Eliovich, Y.; Pisarevsky, Y.; Seregin, A.; Blagov, A.; Kovalchuk, M. LiNbO3-based bimorph piezoactuator for fast X-ray experiments: Resonant mode. Sens. Actuators A Phys. 2019, 293, 48–55. [Google Scholar] [CrossRef]
- Íñiguez, J.; Vanderbilt, D. First-Principles Study of the Temperature-Pressure Phase Diagram of BaTiO3. Phys. Rev. Lett. 2002, 89, 115503. [Google Scholar] [CrossRef]


Disclaimer/Publisher’s Note: The statements, opinions and data contained in all publications are solely those of the individual author(s) and contributor(s) and not of MDPI and/or the editor(s). MDPI and/or the editor(s) disclaim responsibility for any injury to people or property resulting from any ideas, methods, instructions or products referred to in the content. |
© 2024 by the authors. Licensee MDPI, Basel, Switzerland. This article is an open access article distributed under the terms and conditions of the Creative Commons Attribution (CC BY) license (https://creativecommons.org/licenses/by/4.0/).
Share and Cite
Ludt, C.; Meyer, D.C.; Zschornak, M. Ferroelectric Phase Transition in Barium Titanate Revisited with Ab Initio Molecular Dynamics. Materials 2024, 17, 1023. https://doi.org/10.3390/ma17051023
Ludt C, Meyer DC, Zschornak M. Ferroelectric Phase Transition in Barium Titanate Revisited with Ab Initio Molecular Dynamics. Materials. 2024; 17(5):1023. https://doi.org/10.3390/ma17051023
Chicago/Turabian StyleLudt, Christian, Dirk C. Meyer, and Matthias Zschornak. 2024. "Ferroelectric Phase Transition in Barium Titanate Revisited with Ab Initio Molecular Dynamics" Materials 17, no. 5: 1023. https://doi.org/10.3390/ma17051023