
Hydrogen Impact: A Review on Diffusibility, Embrittlement Mechanisms, and Characterization
 and
and 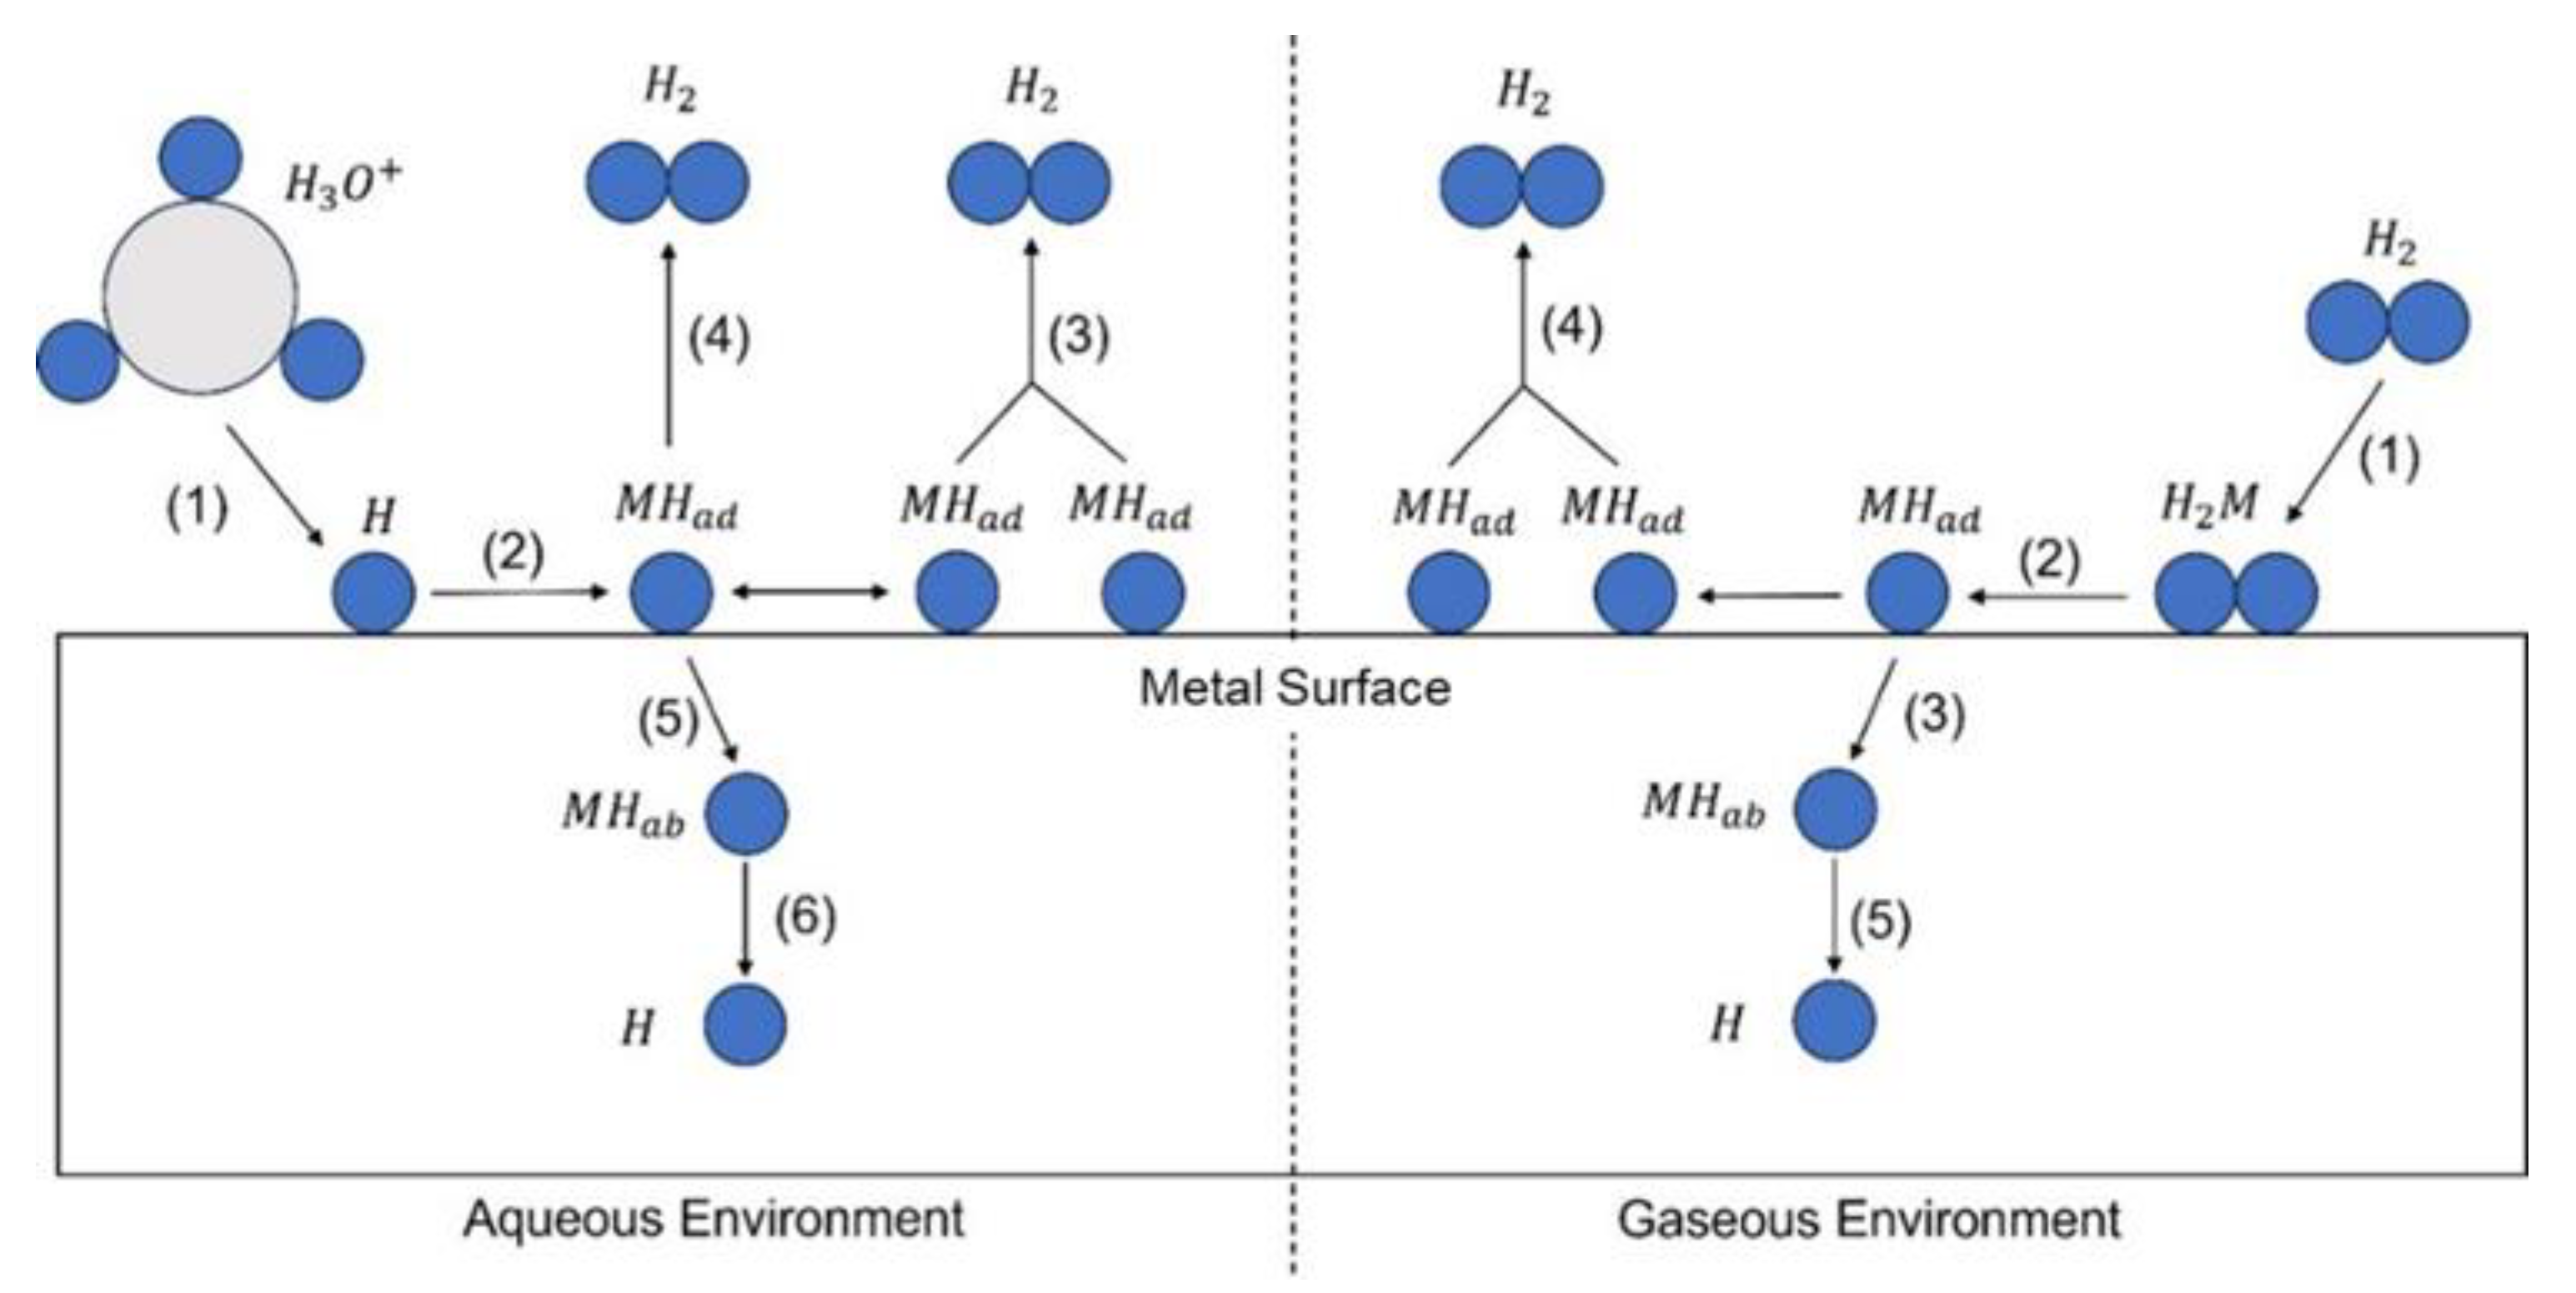
Abstract
:1. Introduction
2. Entry of Gaseous and Aqueous Hydrogen into Metals
3. Mechanisms of Hydrogen Diffusion

4. Characterization Techniques for the Measurement of Hydrogen Diffusion
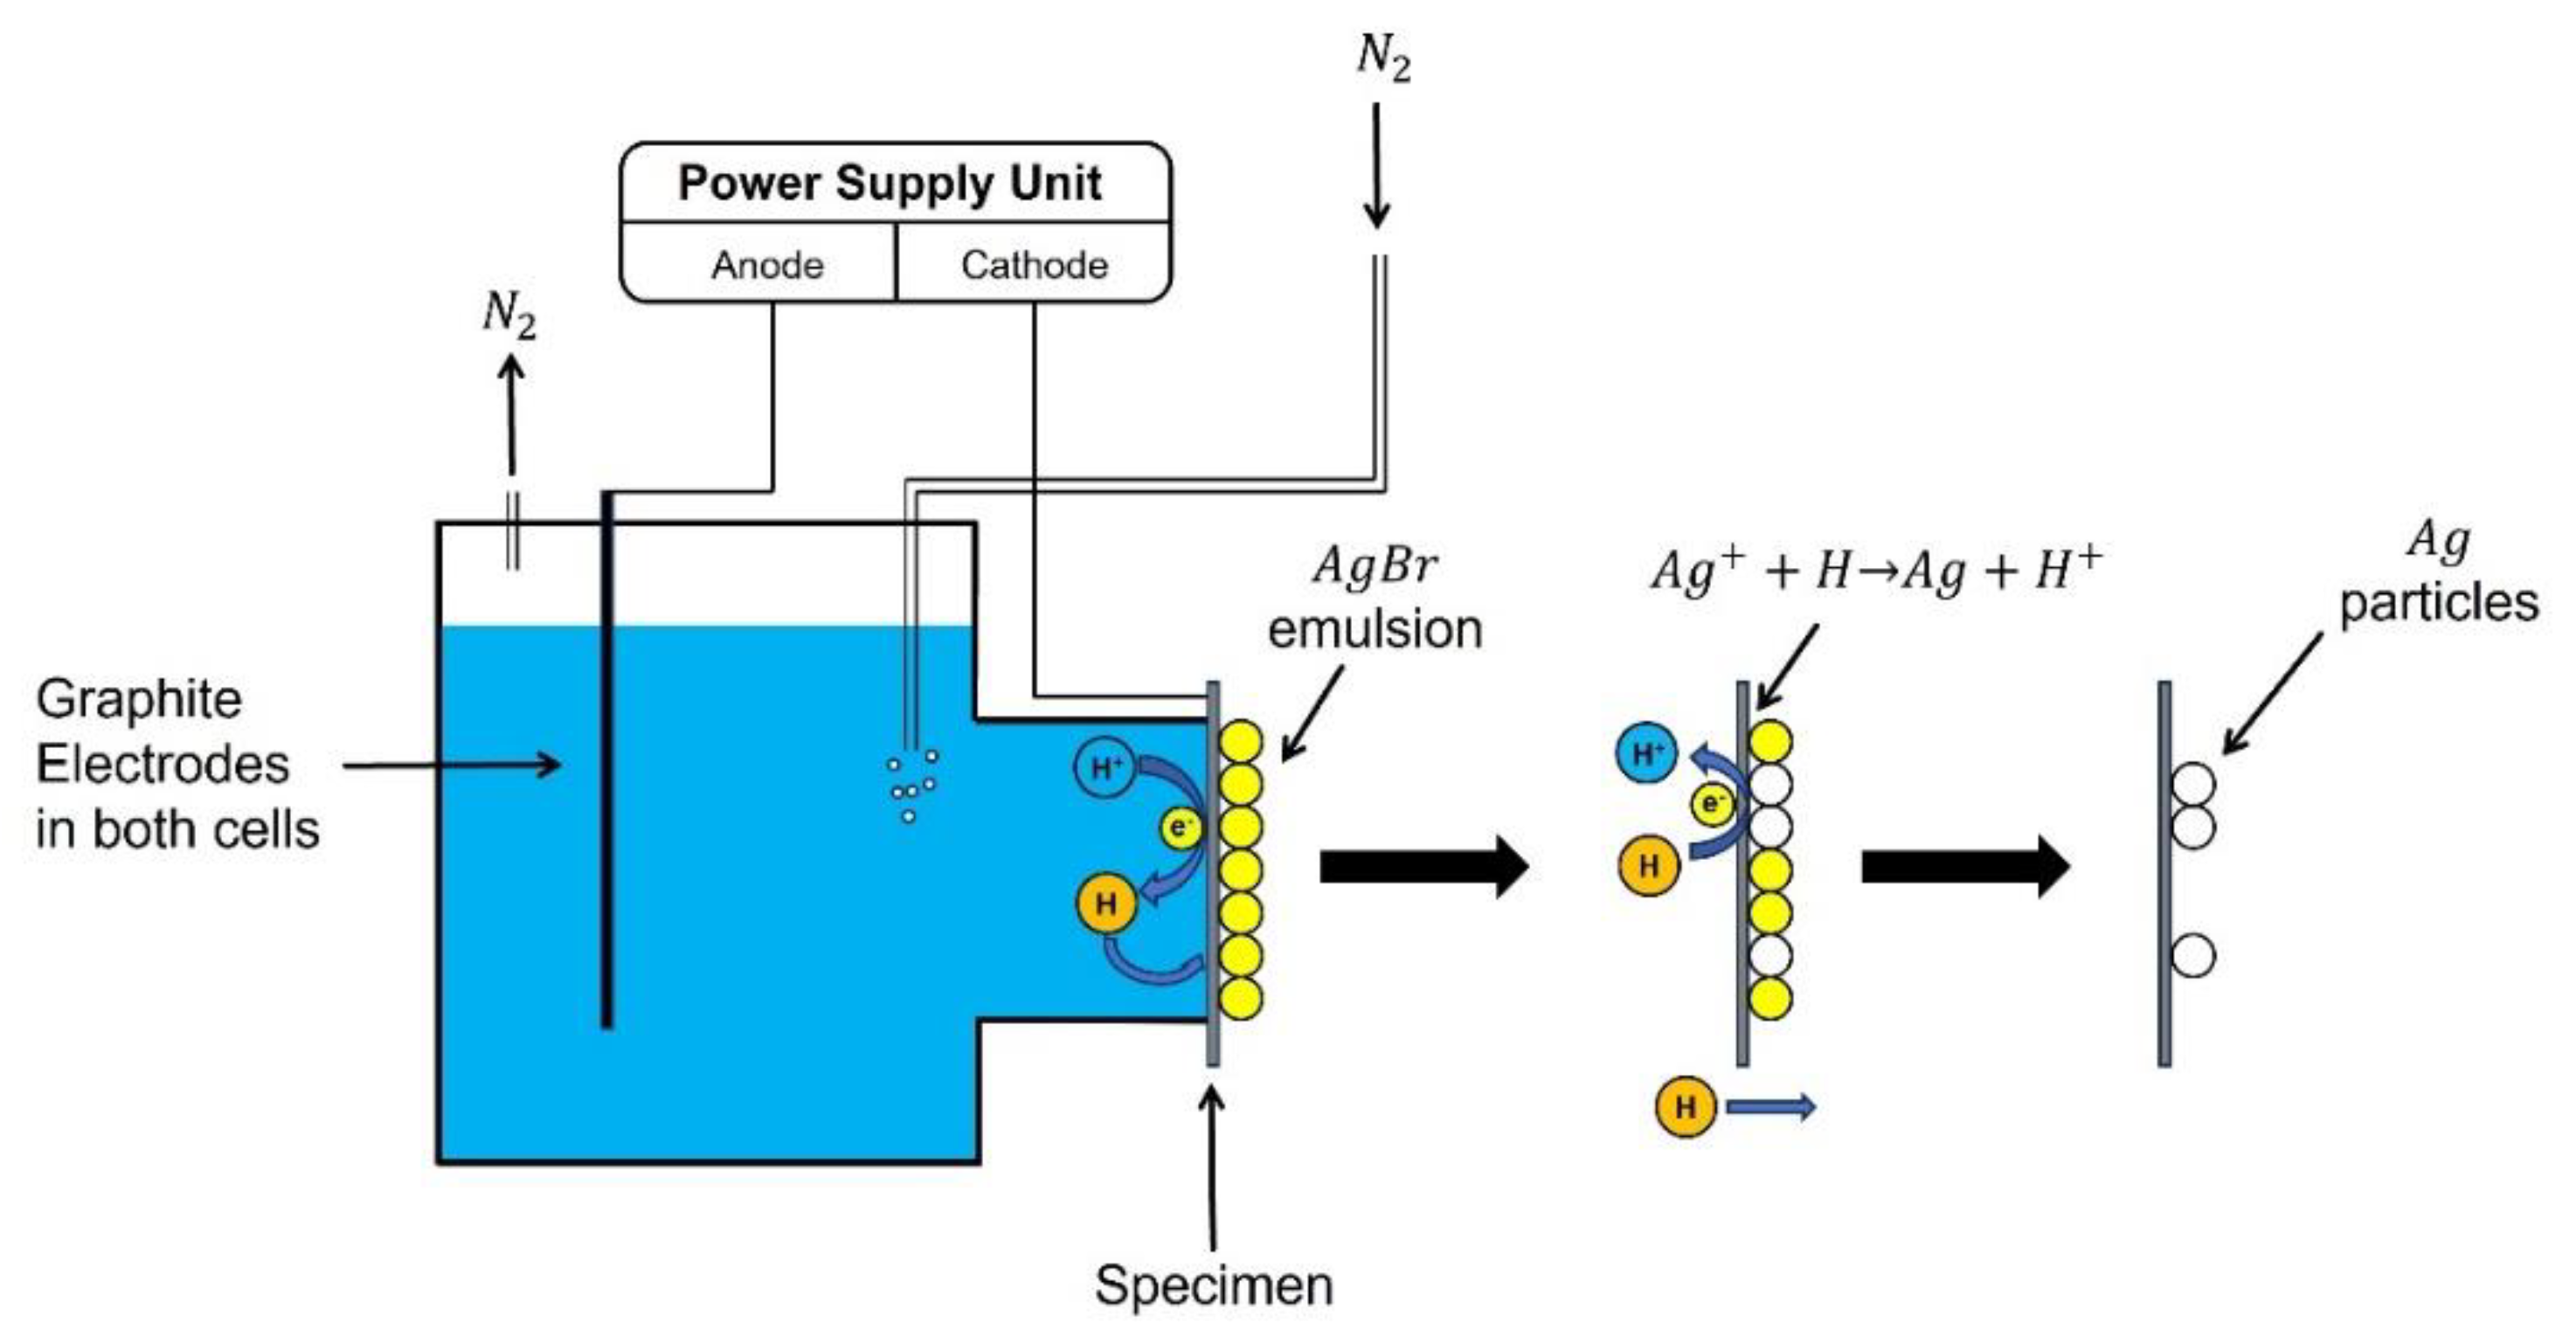
4.1. Hydrogen Microprint Technique
4.2. Hydrogen Permeation Tests
4.2.1. Electrochemical Permeation
4.2.2. Gaseous Permeation
- The need for a dedicated gas line system, with specialized valves and pressure gauges.
- An intricate, tightly sealed arrangement to prevent any potential hydrogen leakage.
- All components must be resilient against hydrogen embrittlement and able to withstand test pressures.
- Presence of hydrogen in the charging cell prior to the completion of pressurization, can lead to inaccurate measurements.
- For experiments across a spectrum of temperatures, the test apparatus must be robust enough to withstand such temperature fluctuations.

4.2.3. Permeation Test Results Analysis
5. Factors Affecting Hydrogen Diffusion into Metals
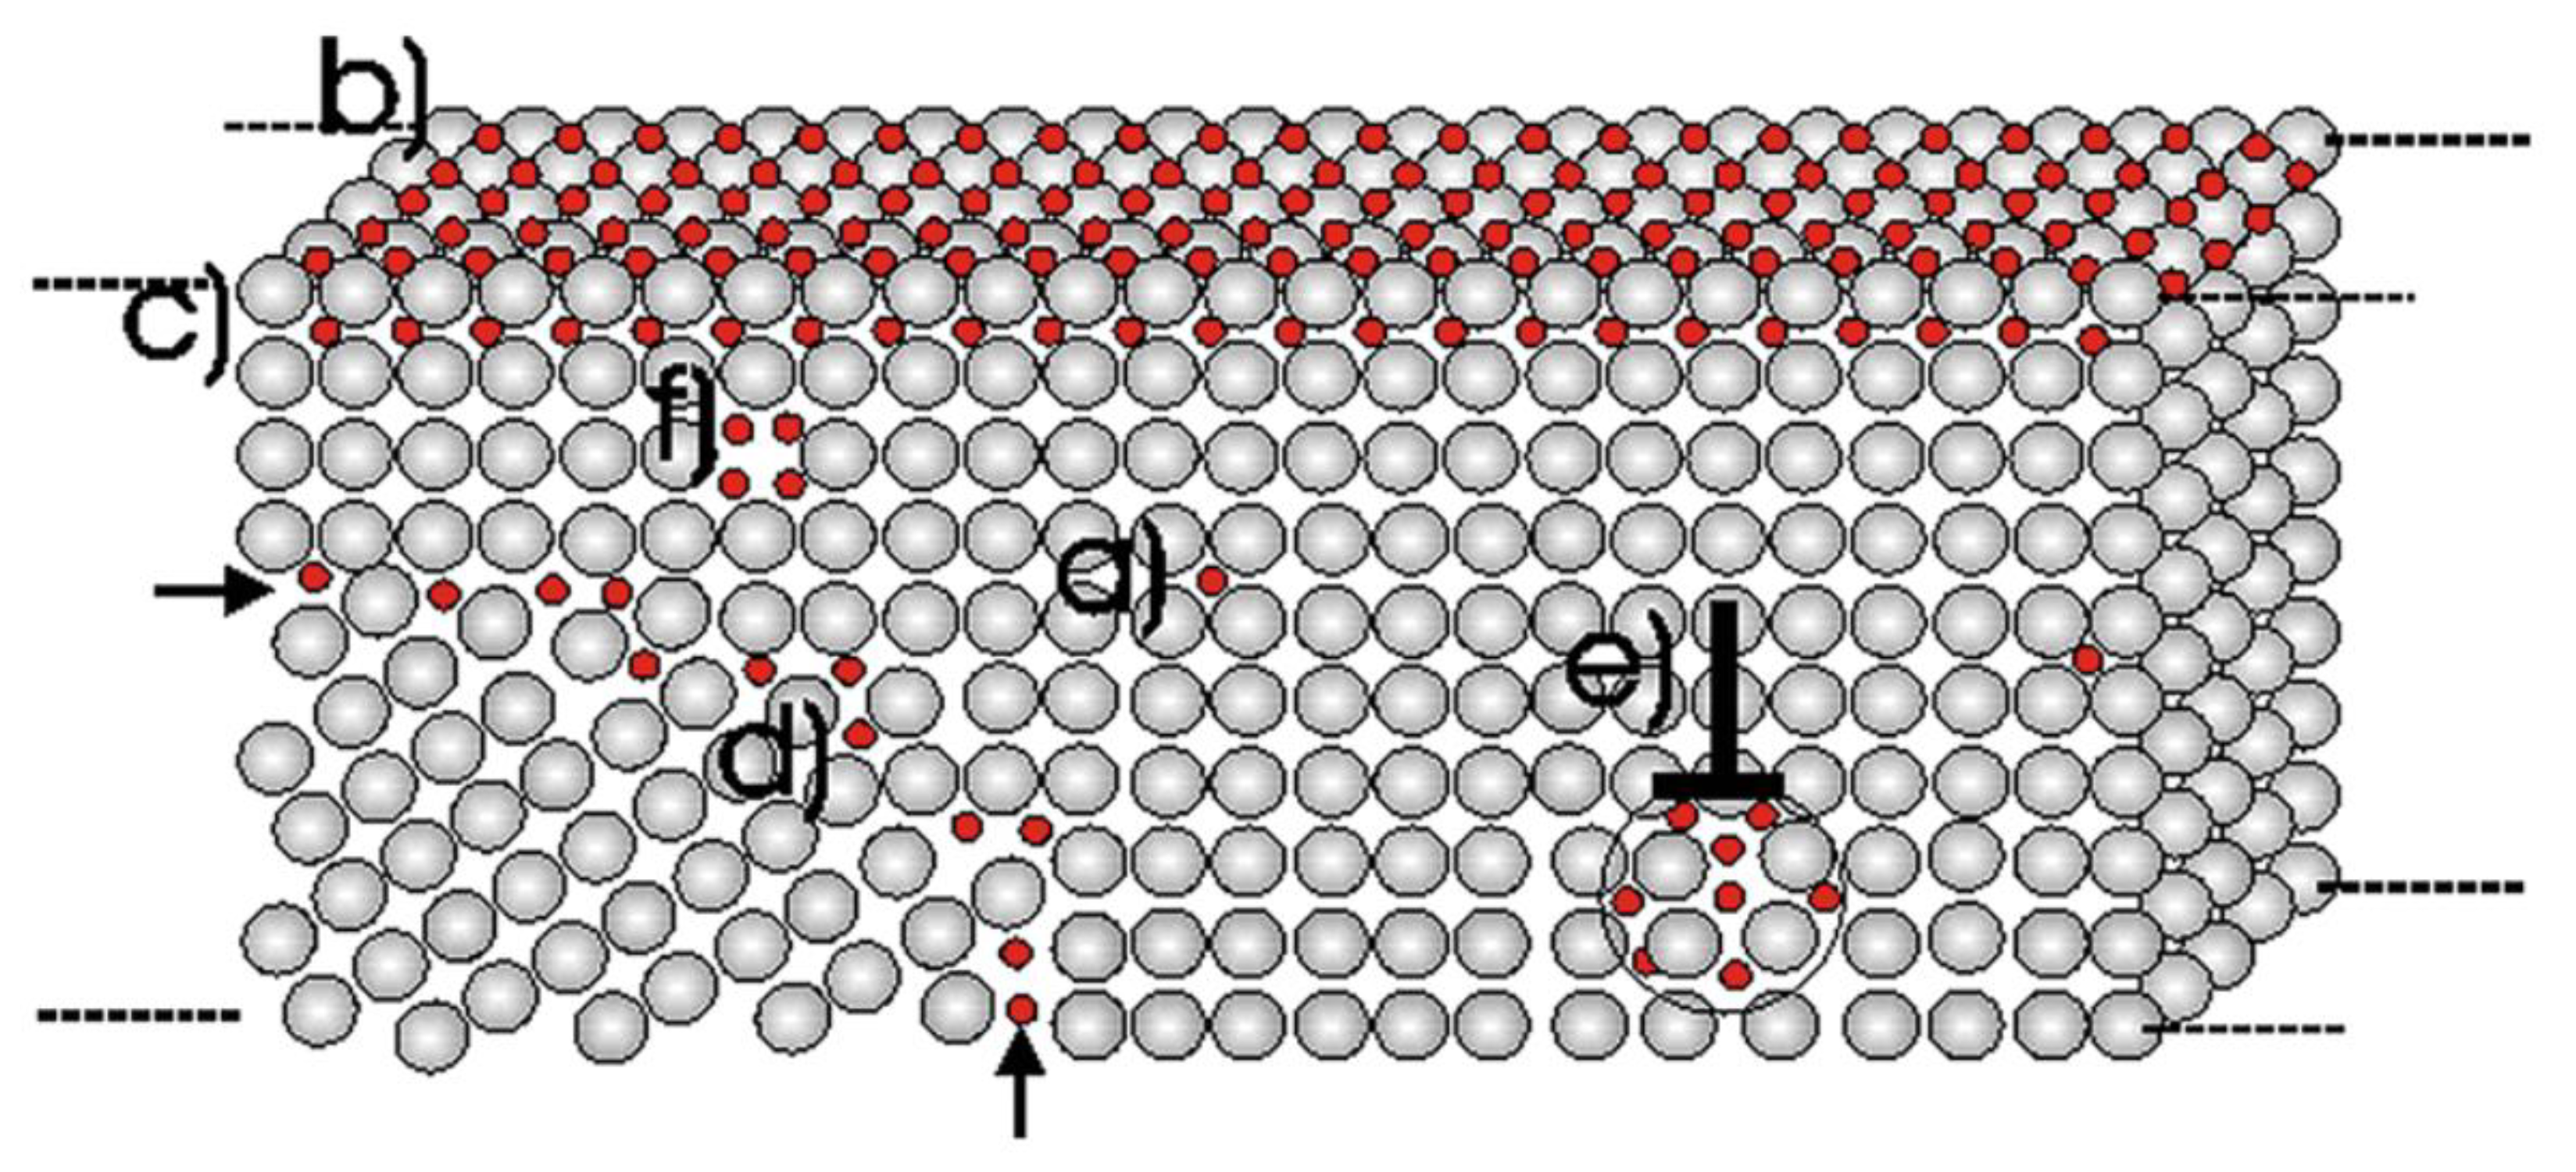
5.1. Hydrogen Trapping
5.1.1. Hydrogen Trapping Mechanism
5.1.2. Classification of Hydrogen Traps
5.1.3. Effects of Hydrogen Traps on Hydrogen Diffusion Behavior
Solute-Atom Hydrogen Traps
Grain Size and Grain Boundaries
Dislocations
5.2. Effect of Microstructure
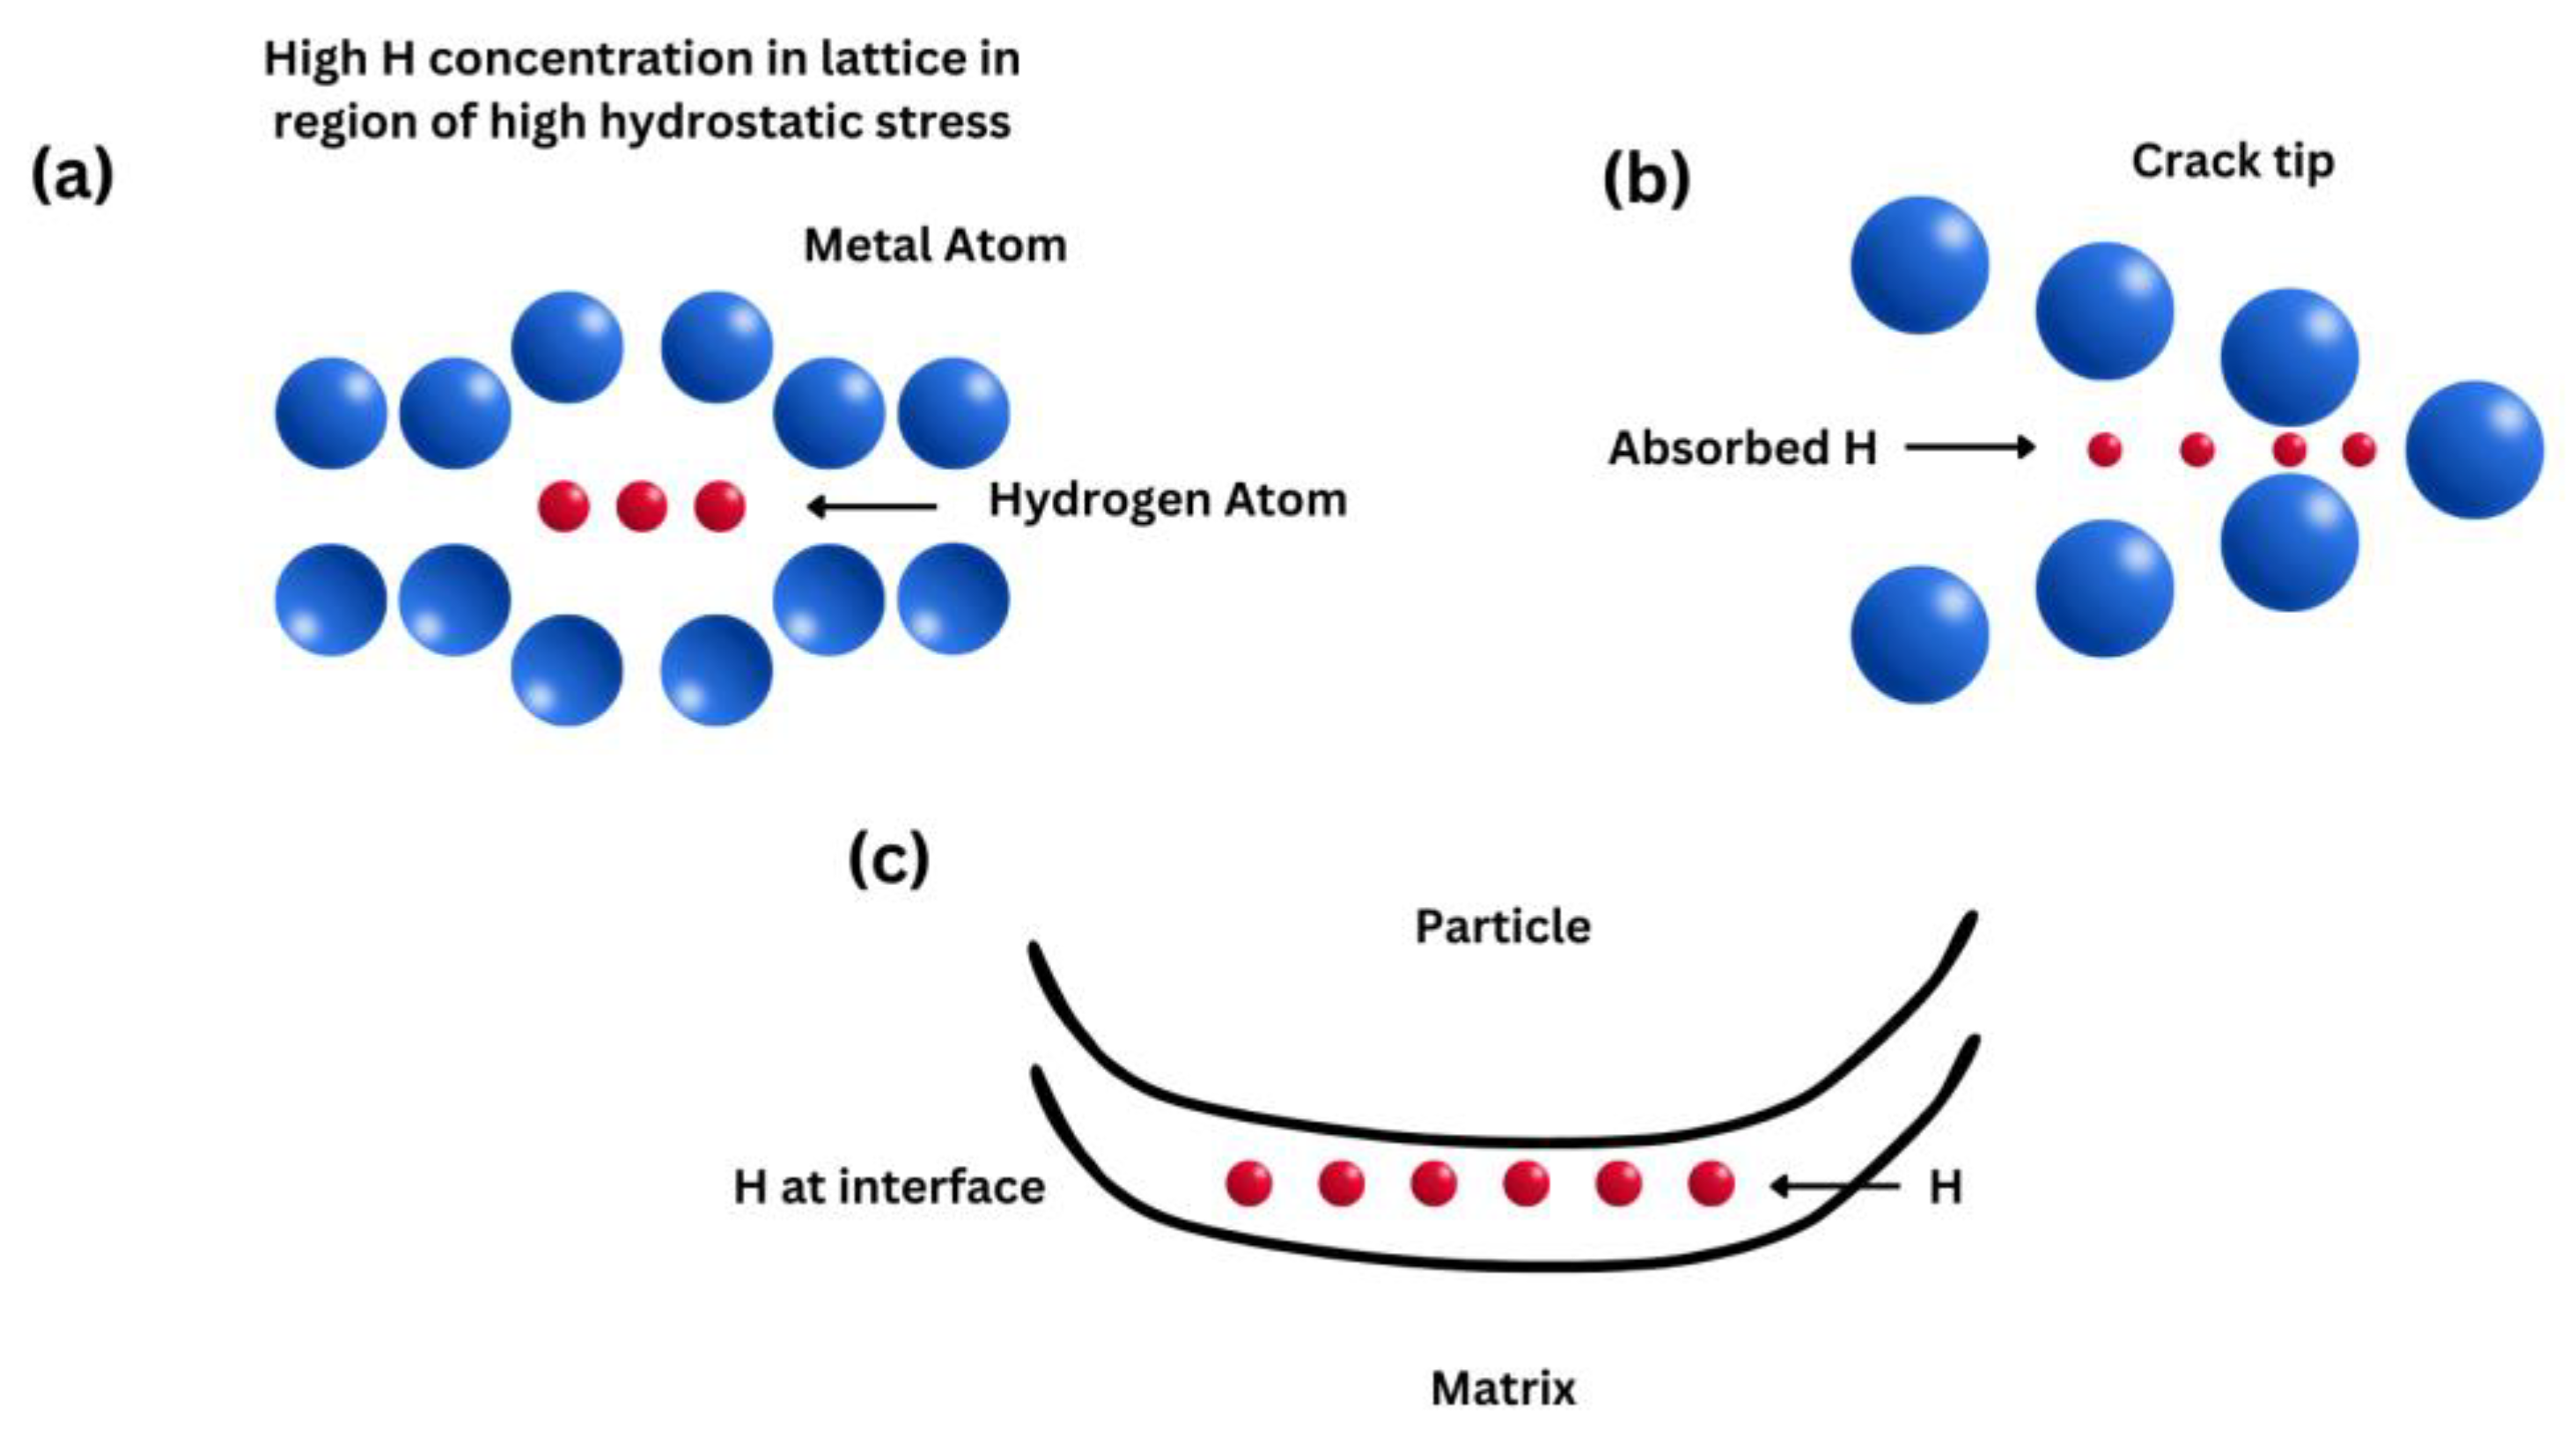
6. Proposed Mechanisms of Hydrogen Embrittlement
6.1. Hydrogen-Enhanced Decohesion Mechanism (HEDE)
6.2. Hydrogen Pressure Theory
6.3. Hydrogen-Enhanced Localized Plasticity (HELP)
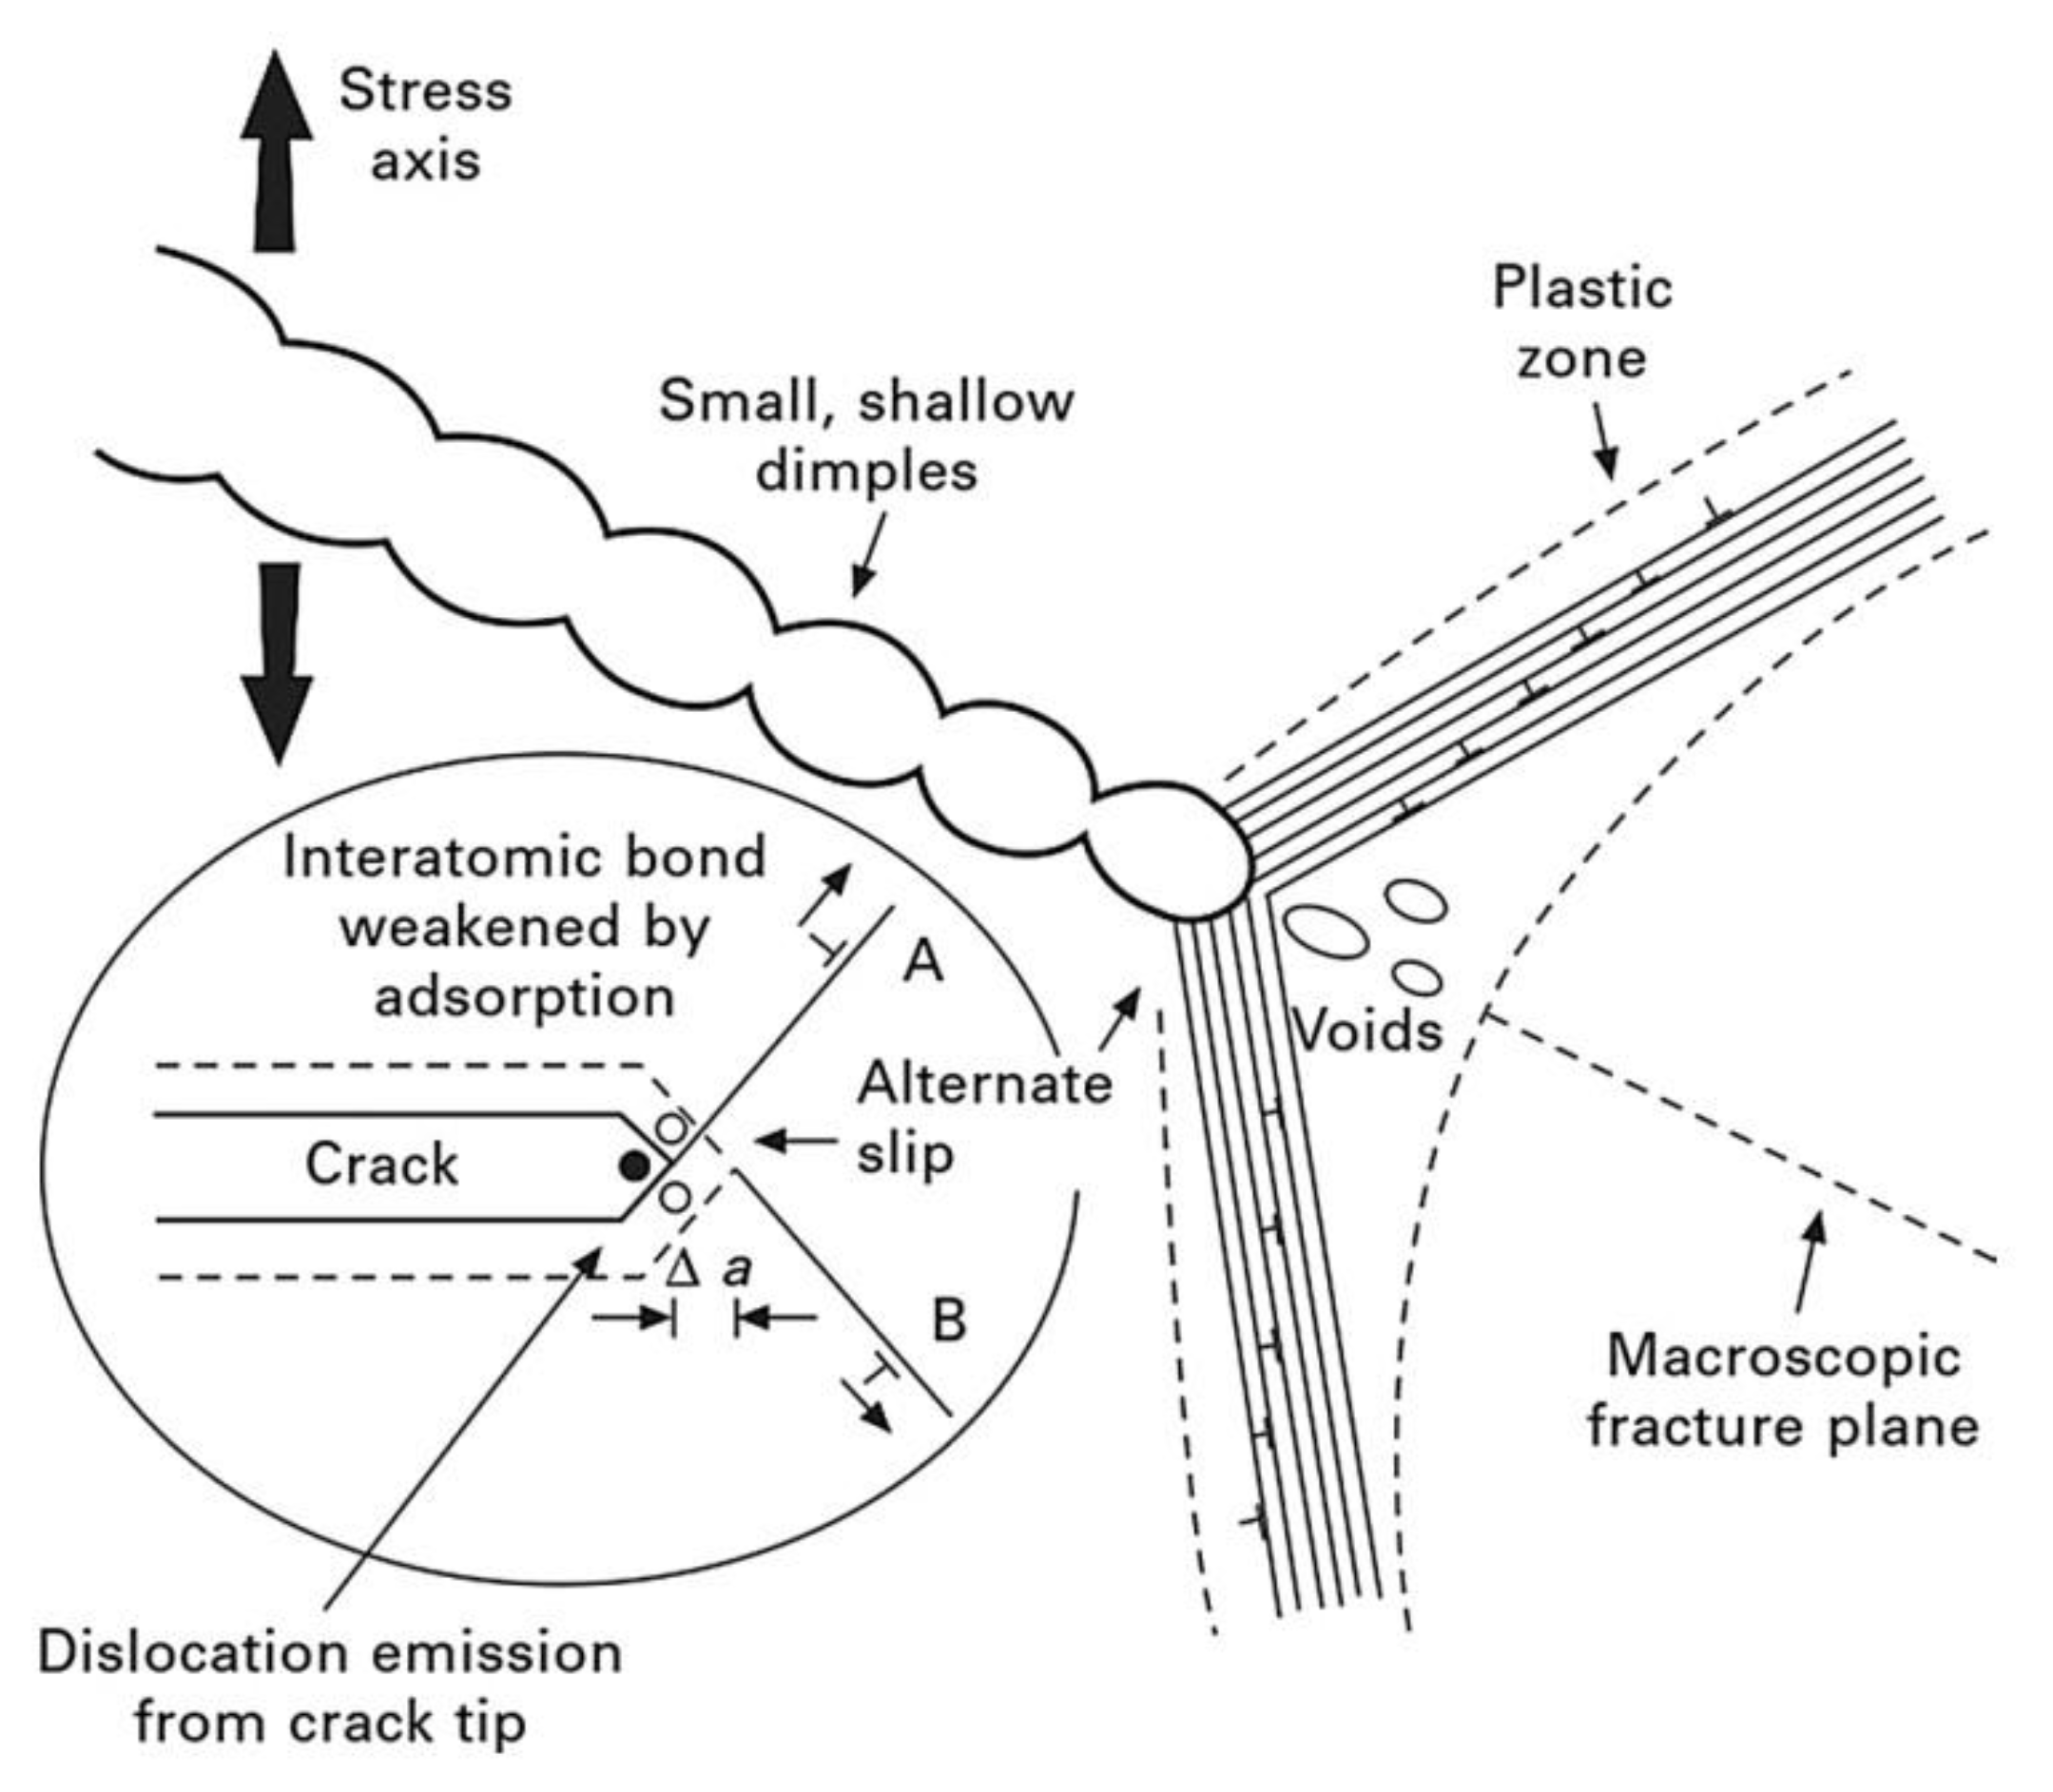
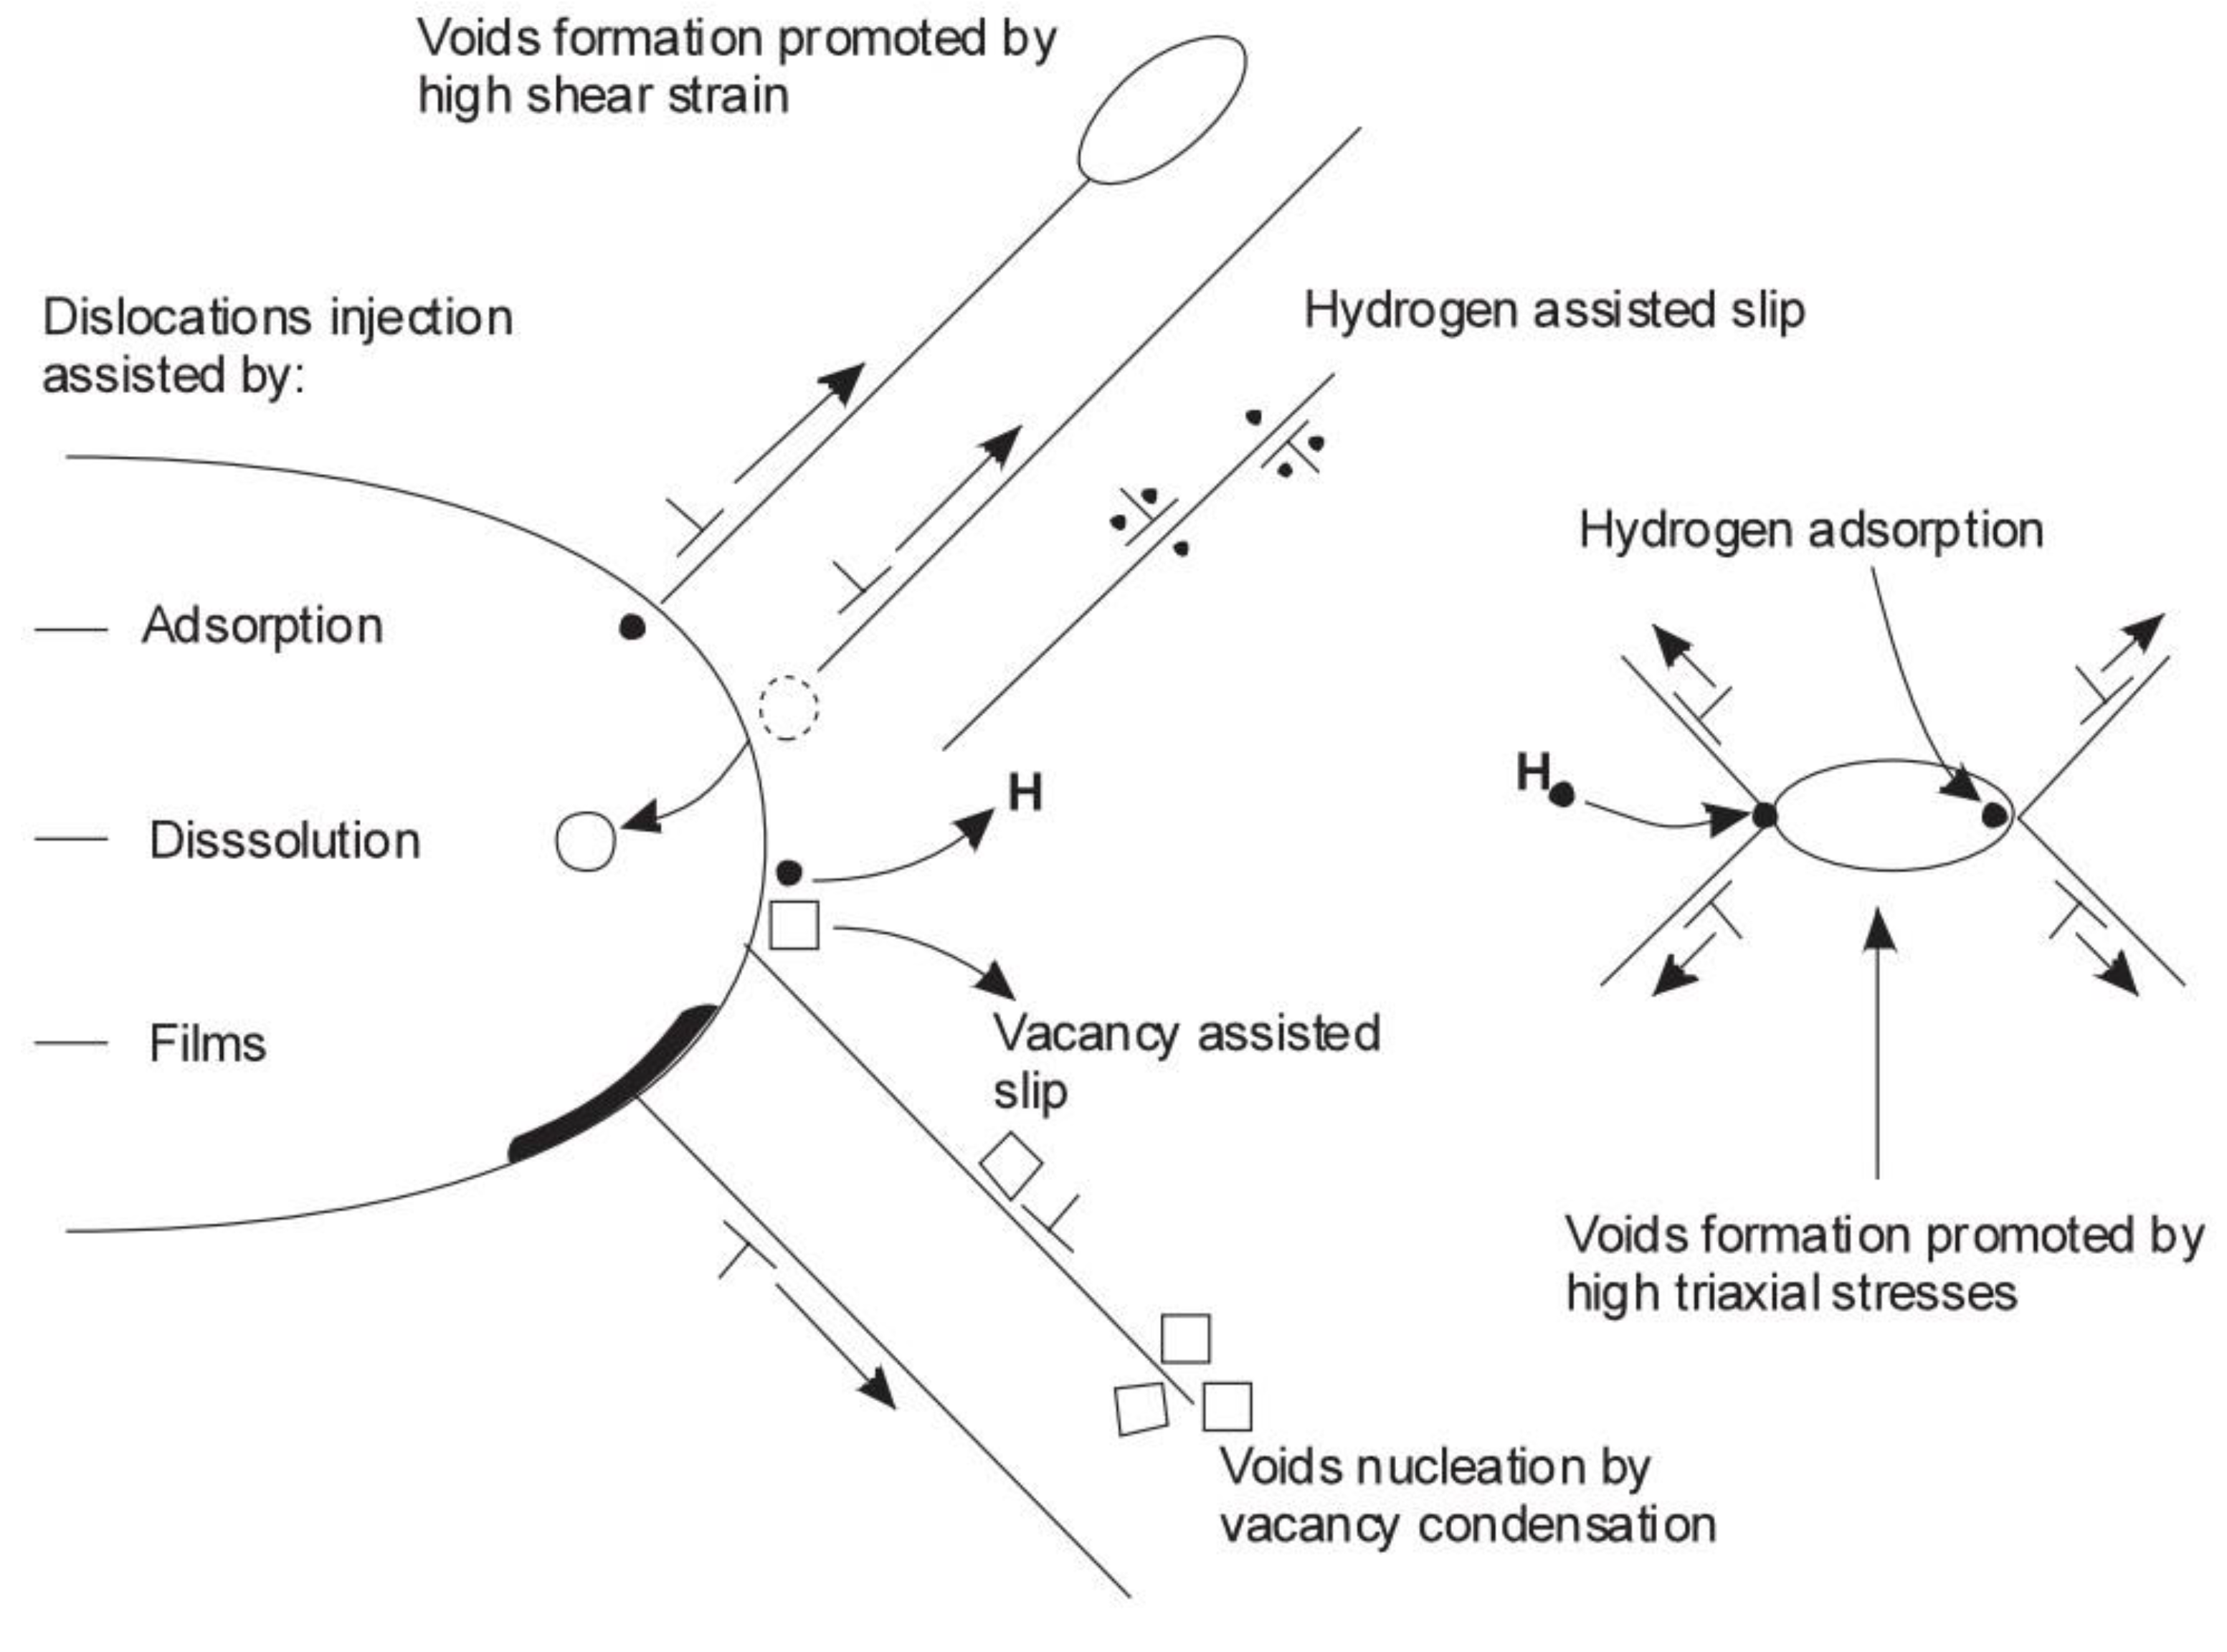
6.4. Adsorption-Induced Dislocation Emission (AIDE)
6.5. Hydride Formation
6.6. Hydrogen-Induced Reduction in Surface Energy
6.7. Hydrogen-Enhanced Macroscopic Plasticity (HEMP)
6.8. Hydrogen Assisted Microvoid Coalescence
7. Hydrogen Embrittlement Characterization Techniques
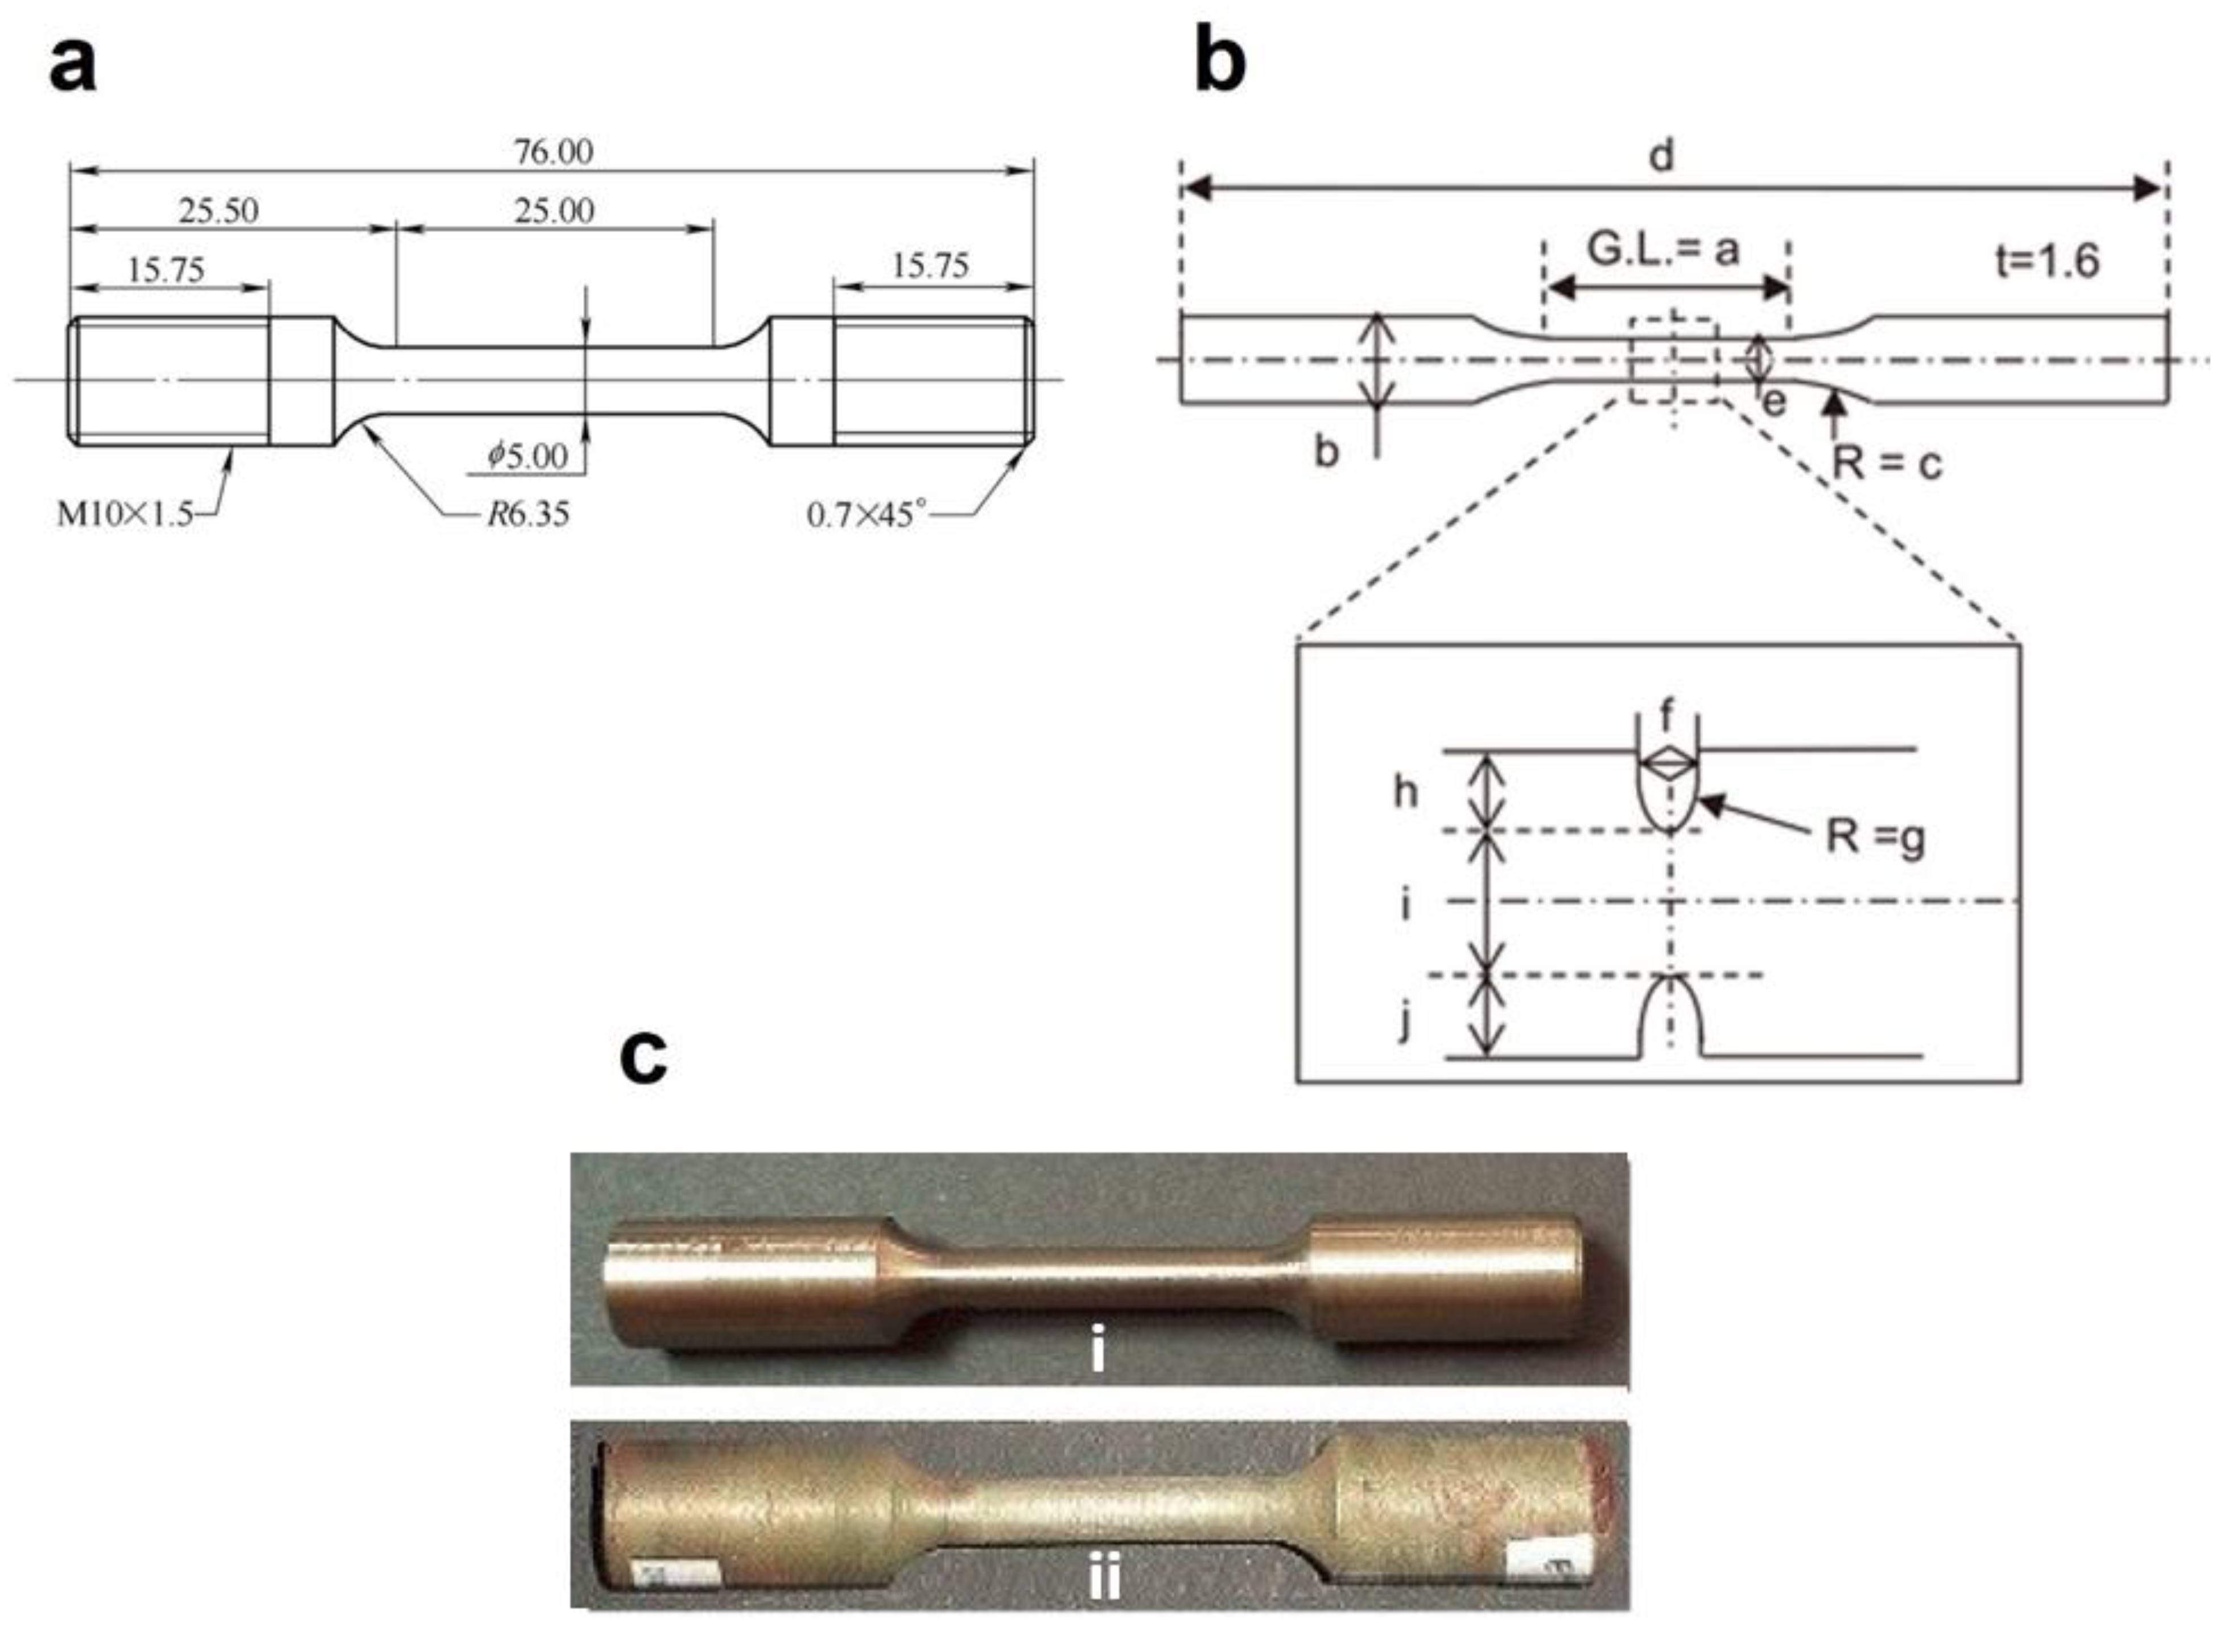
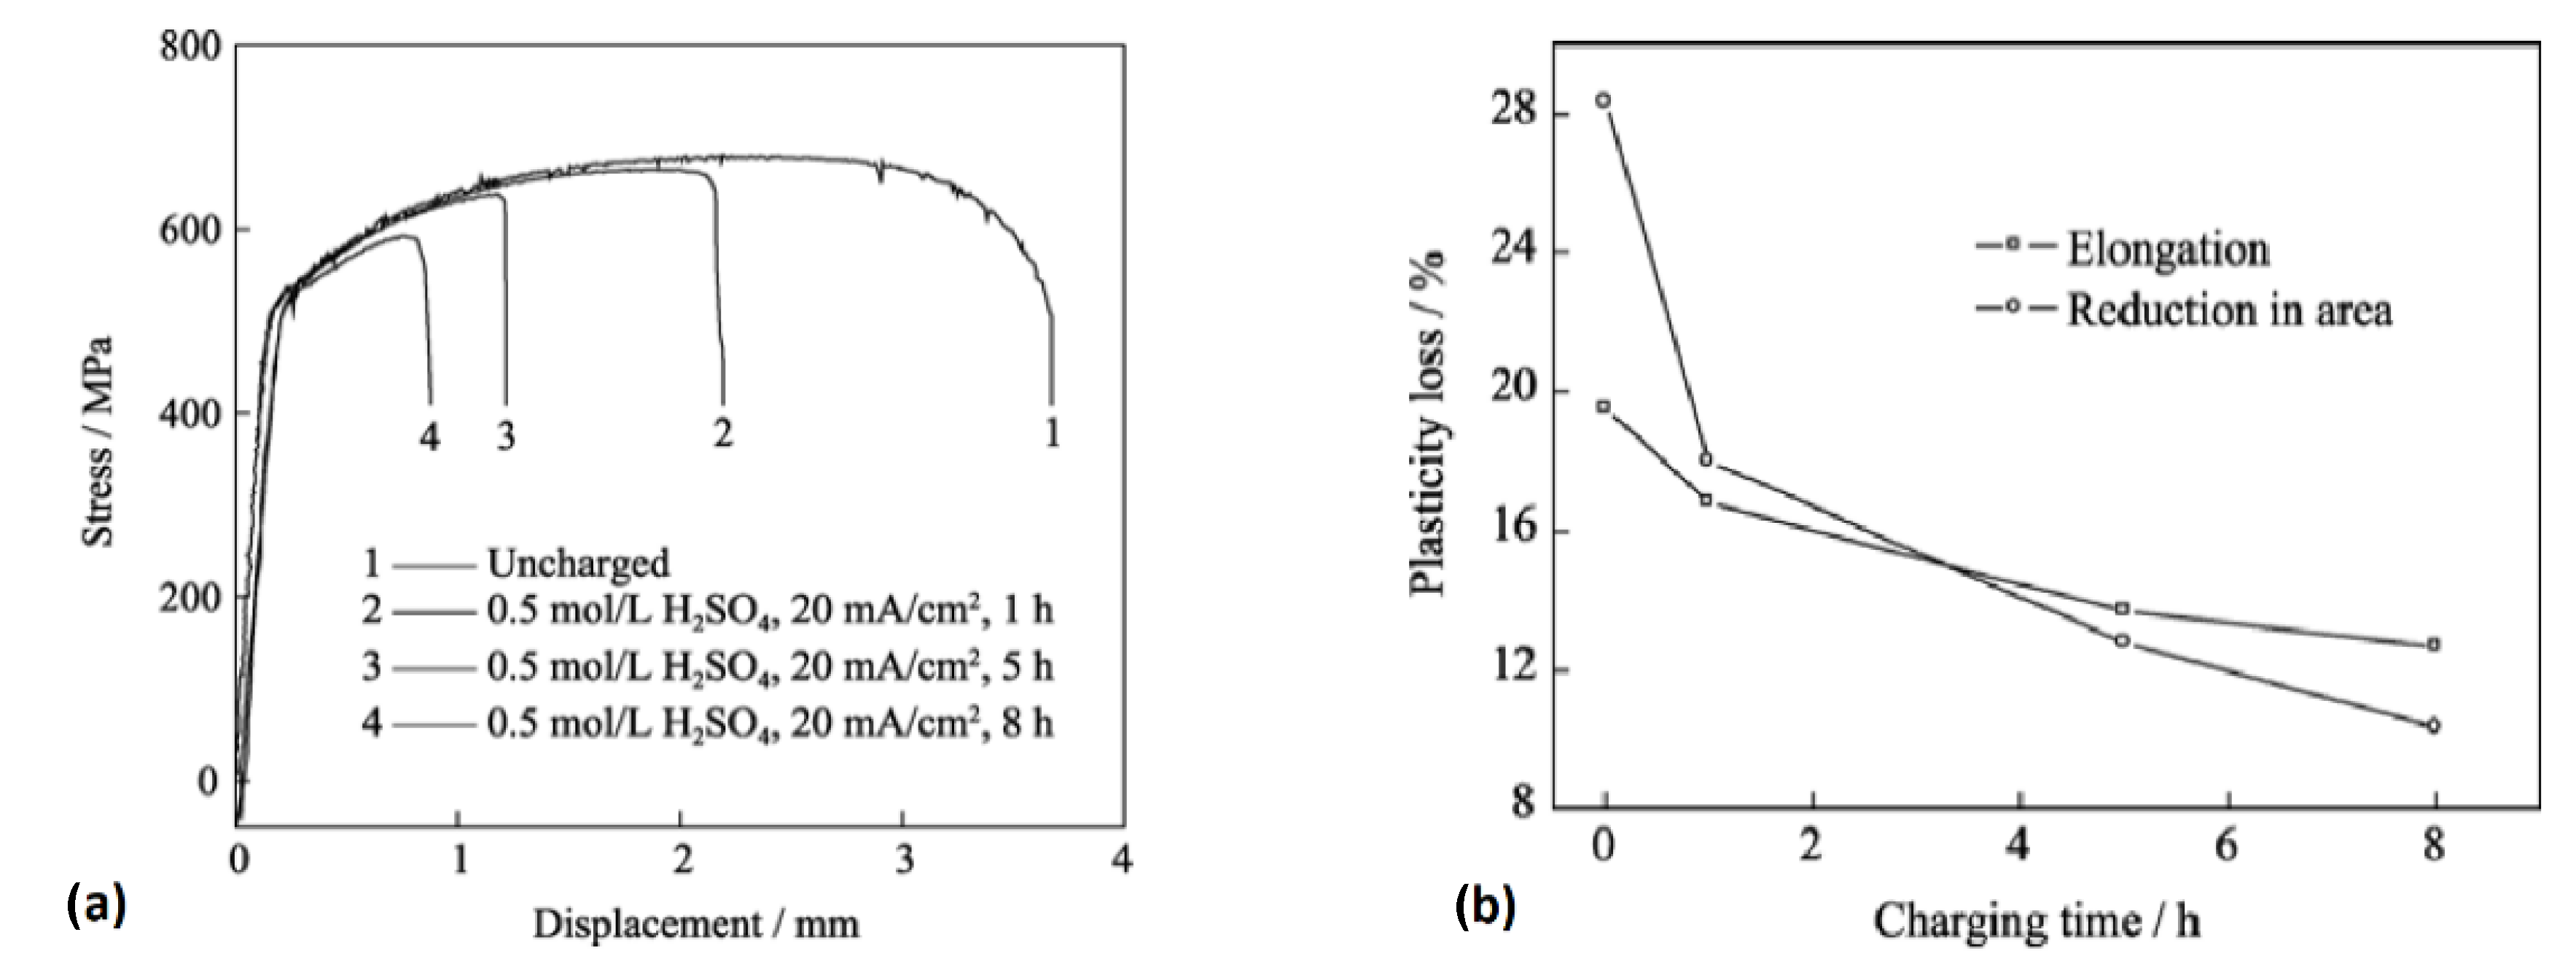
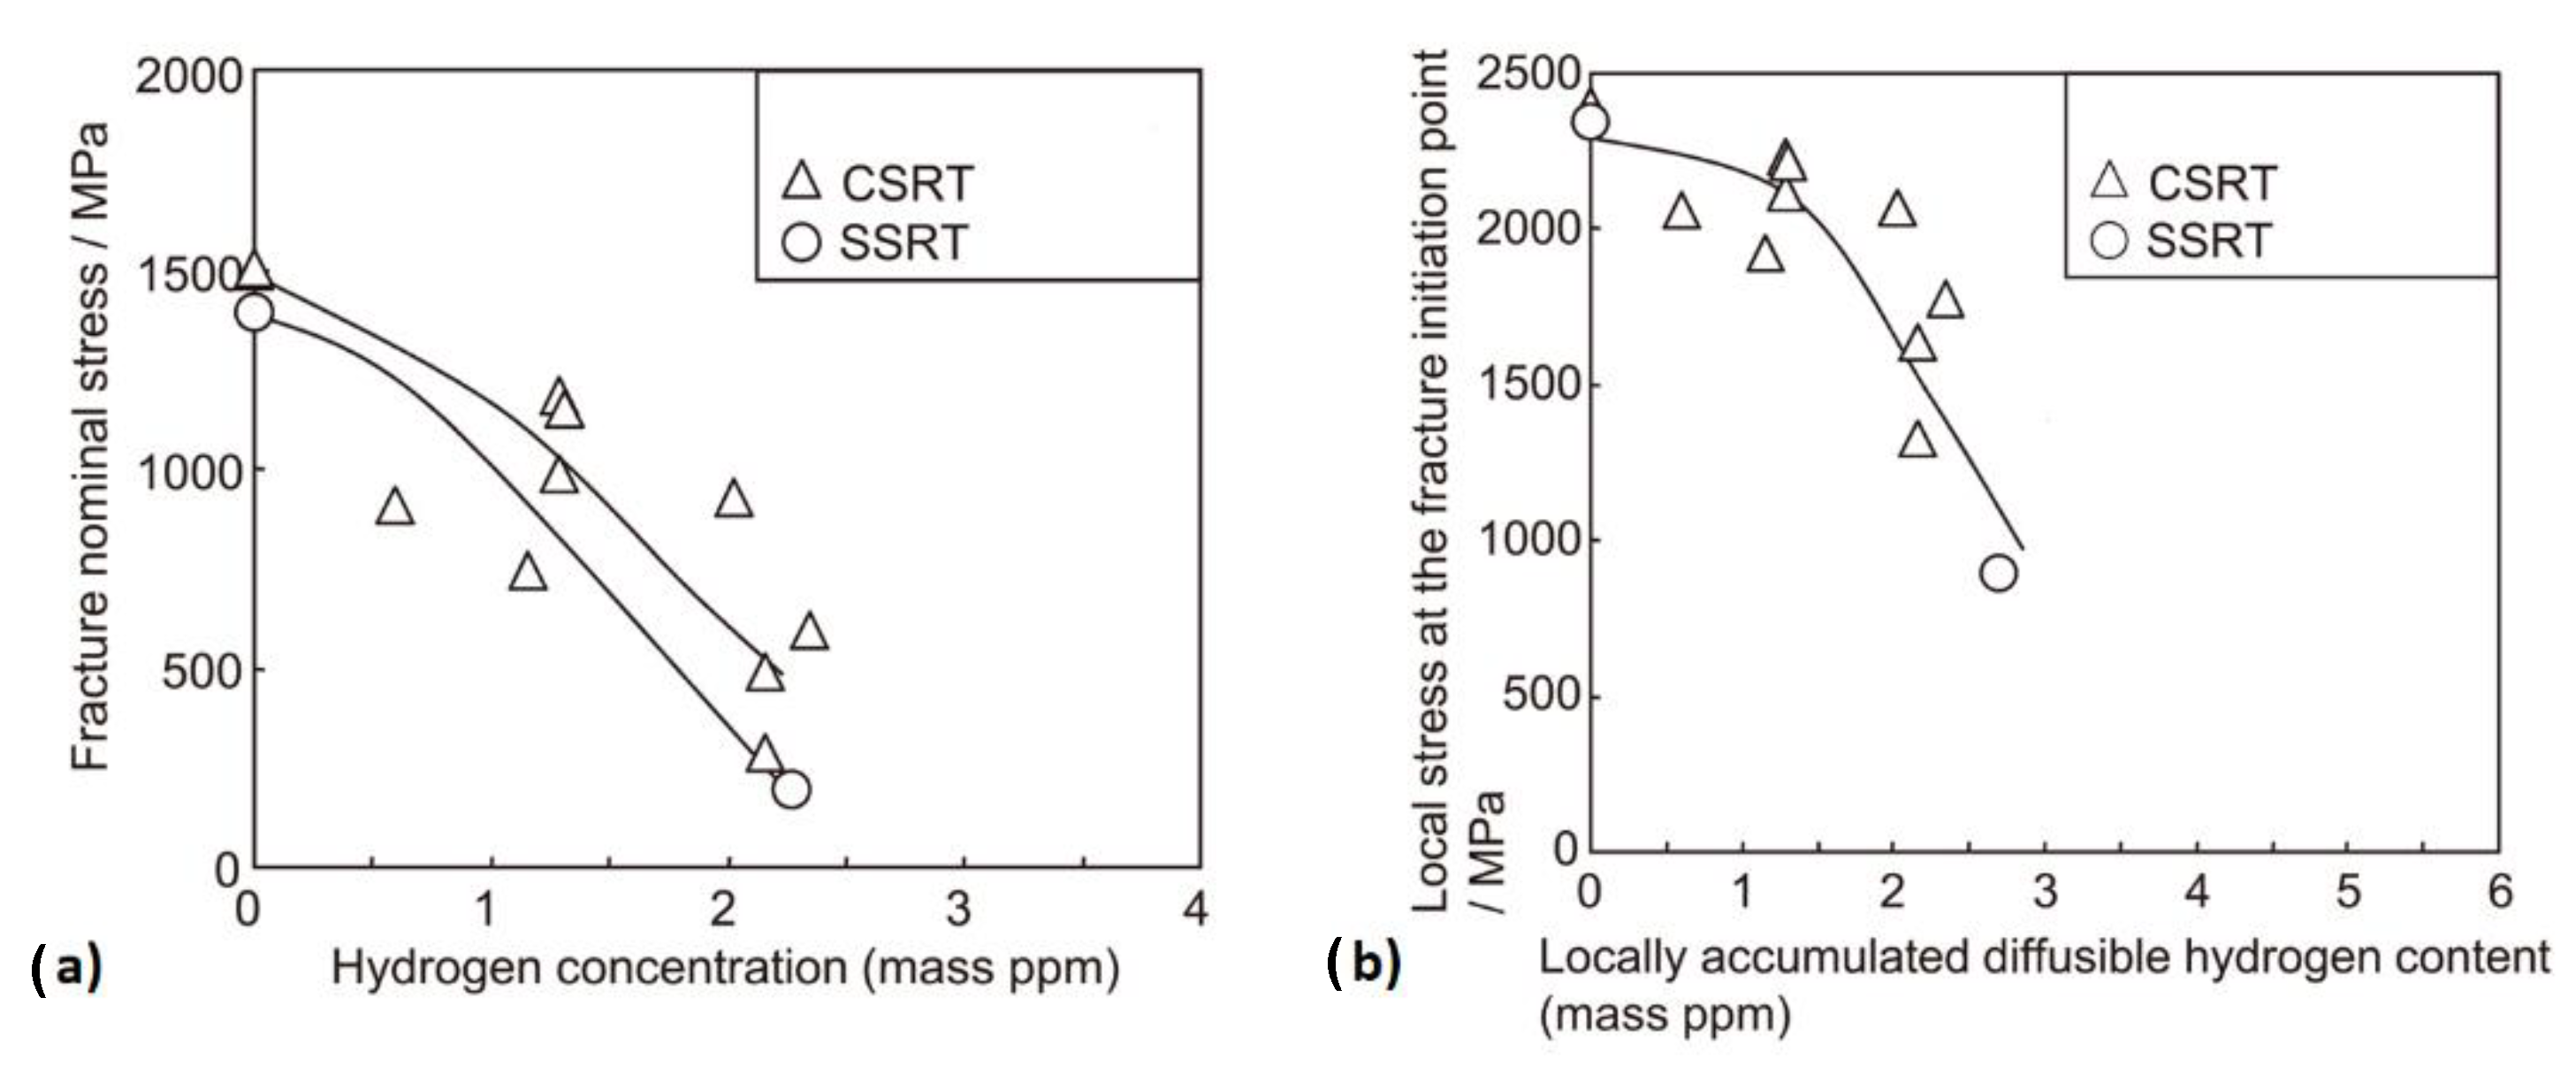
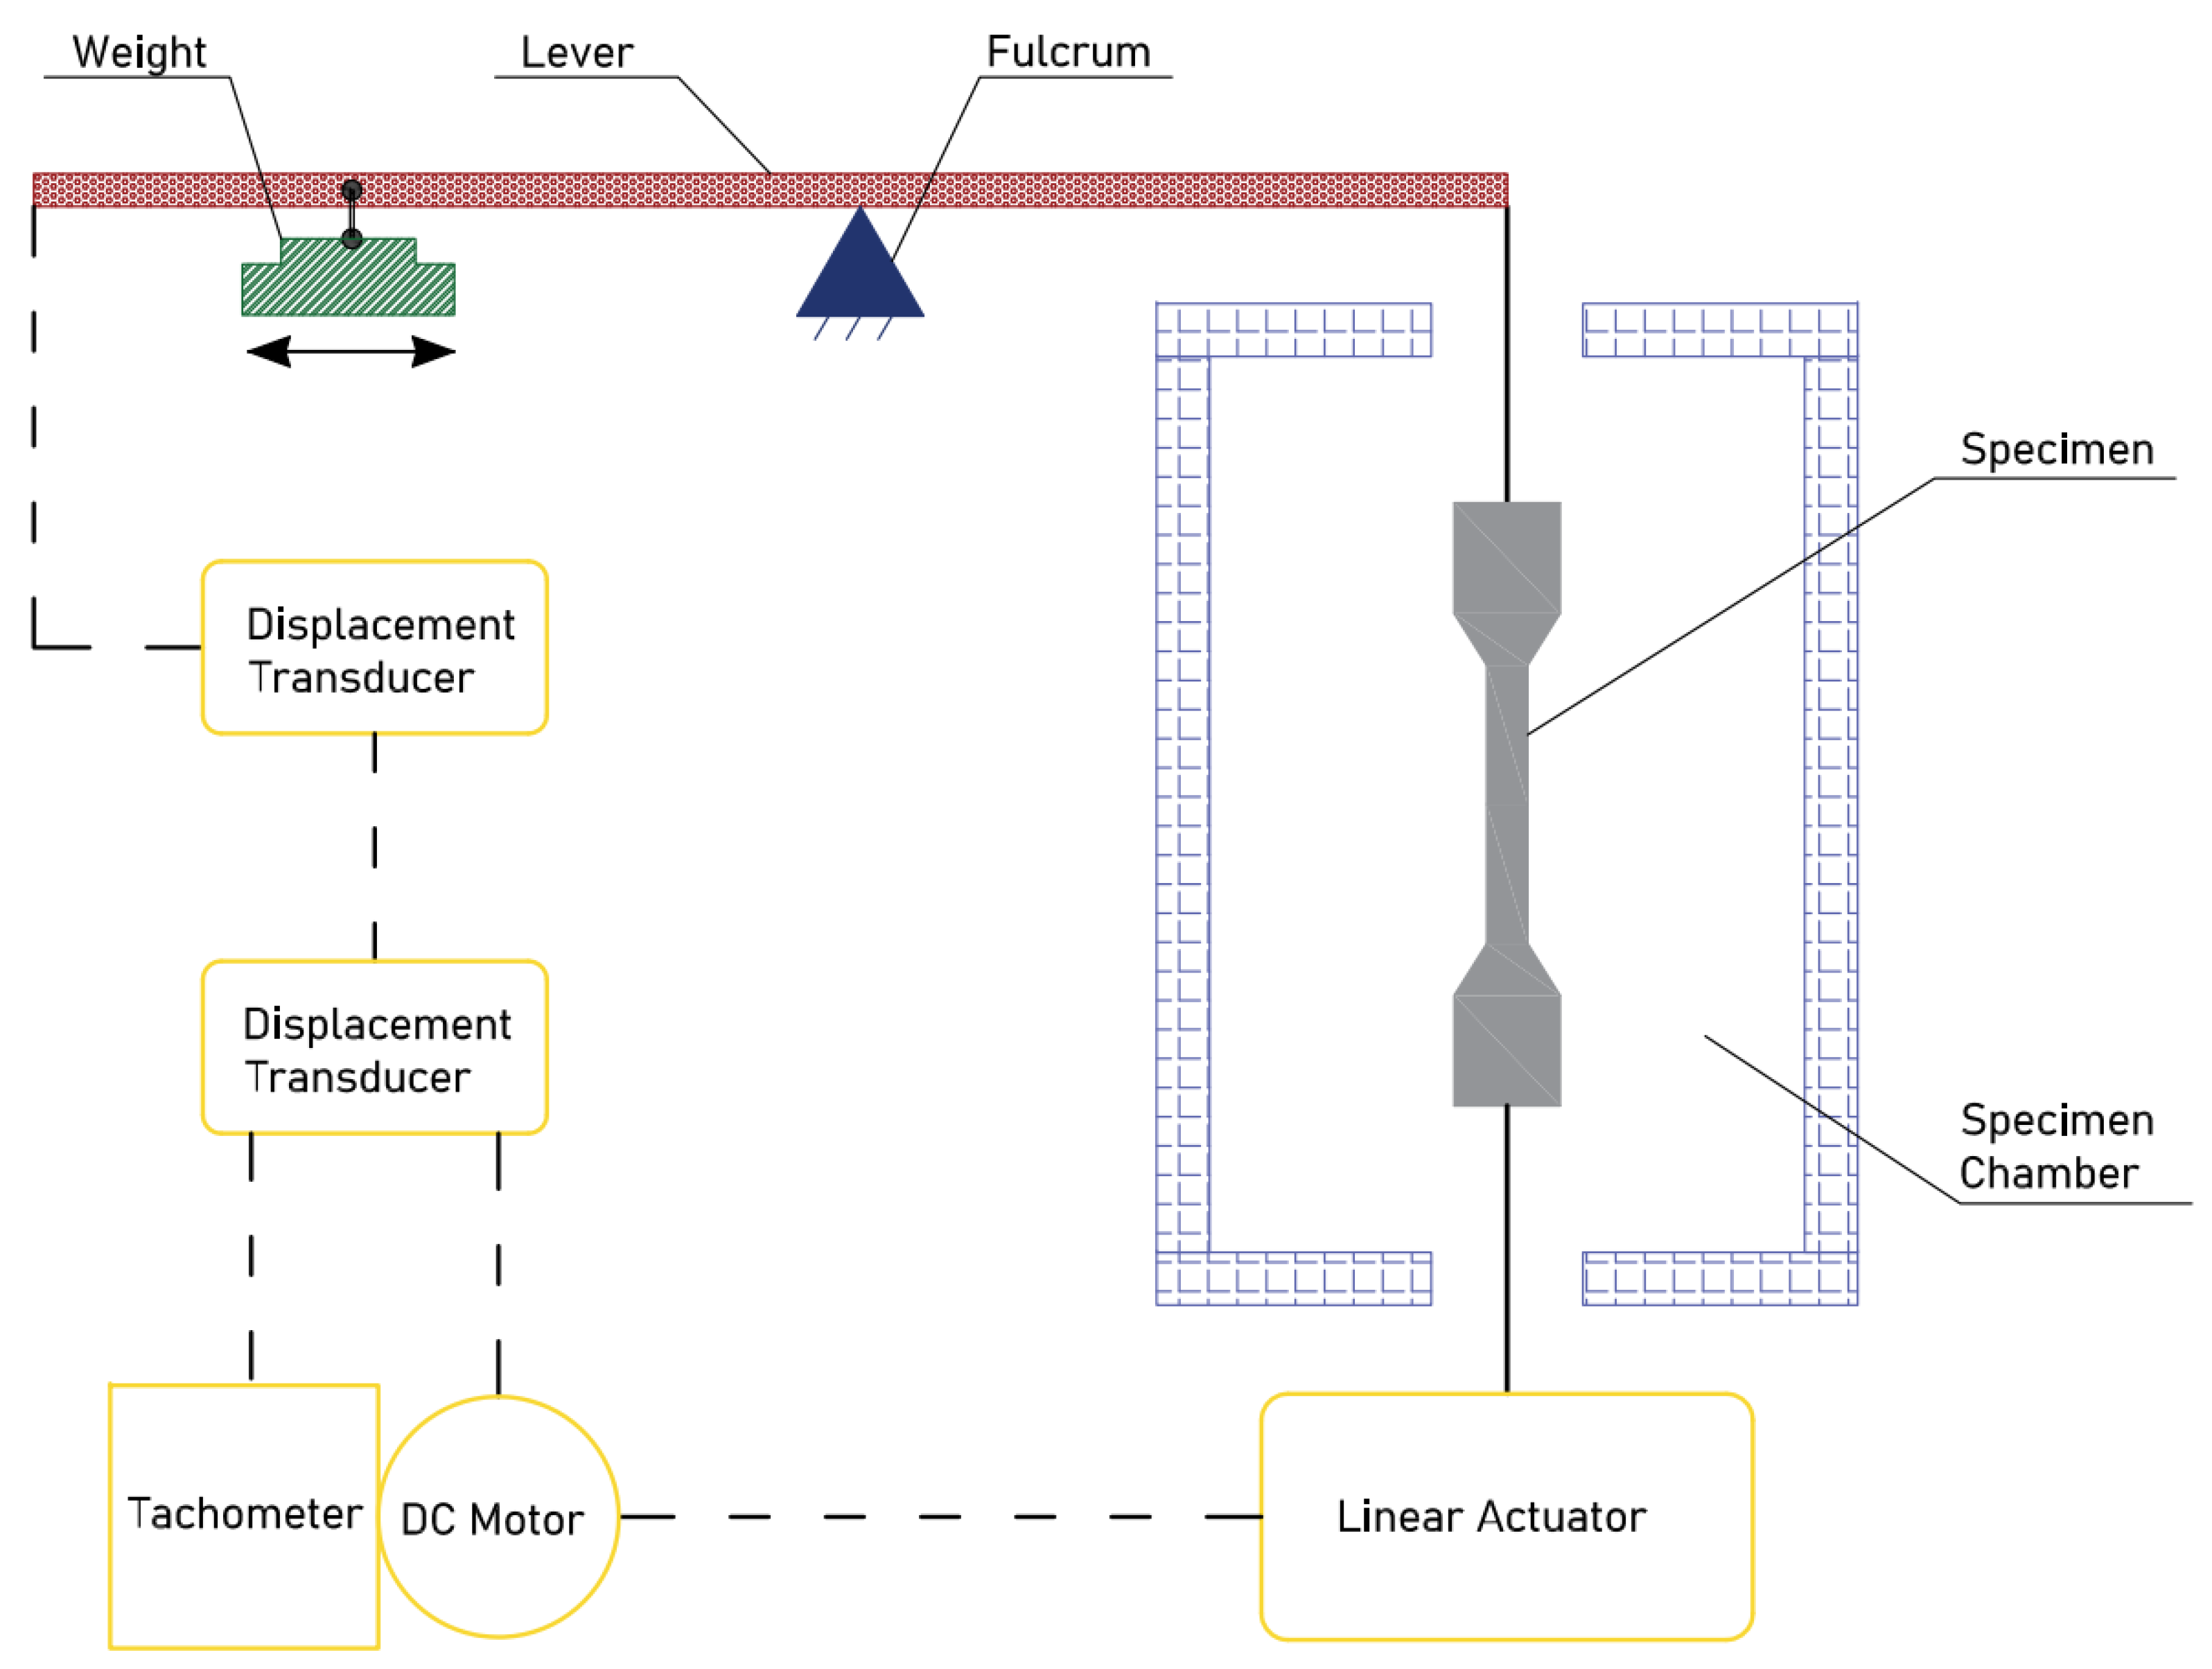
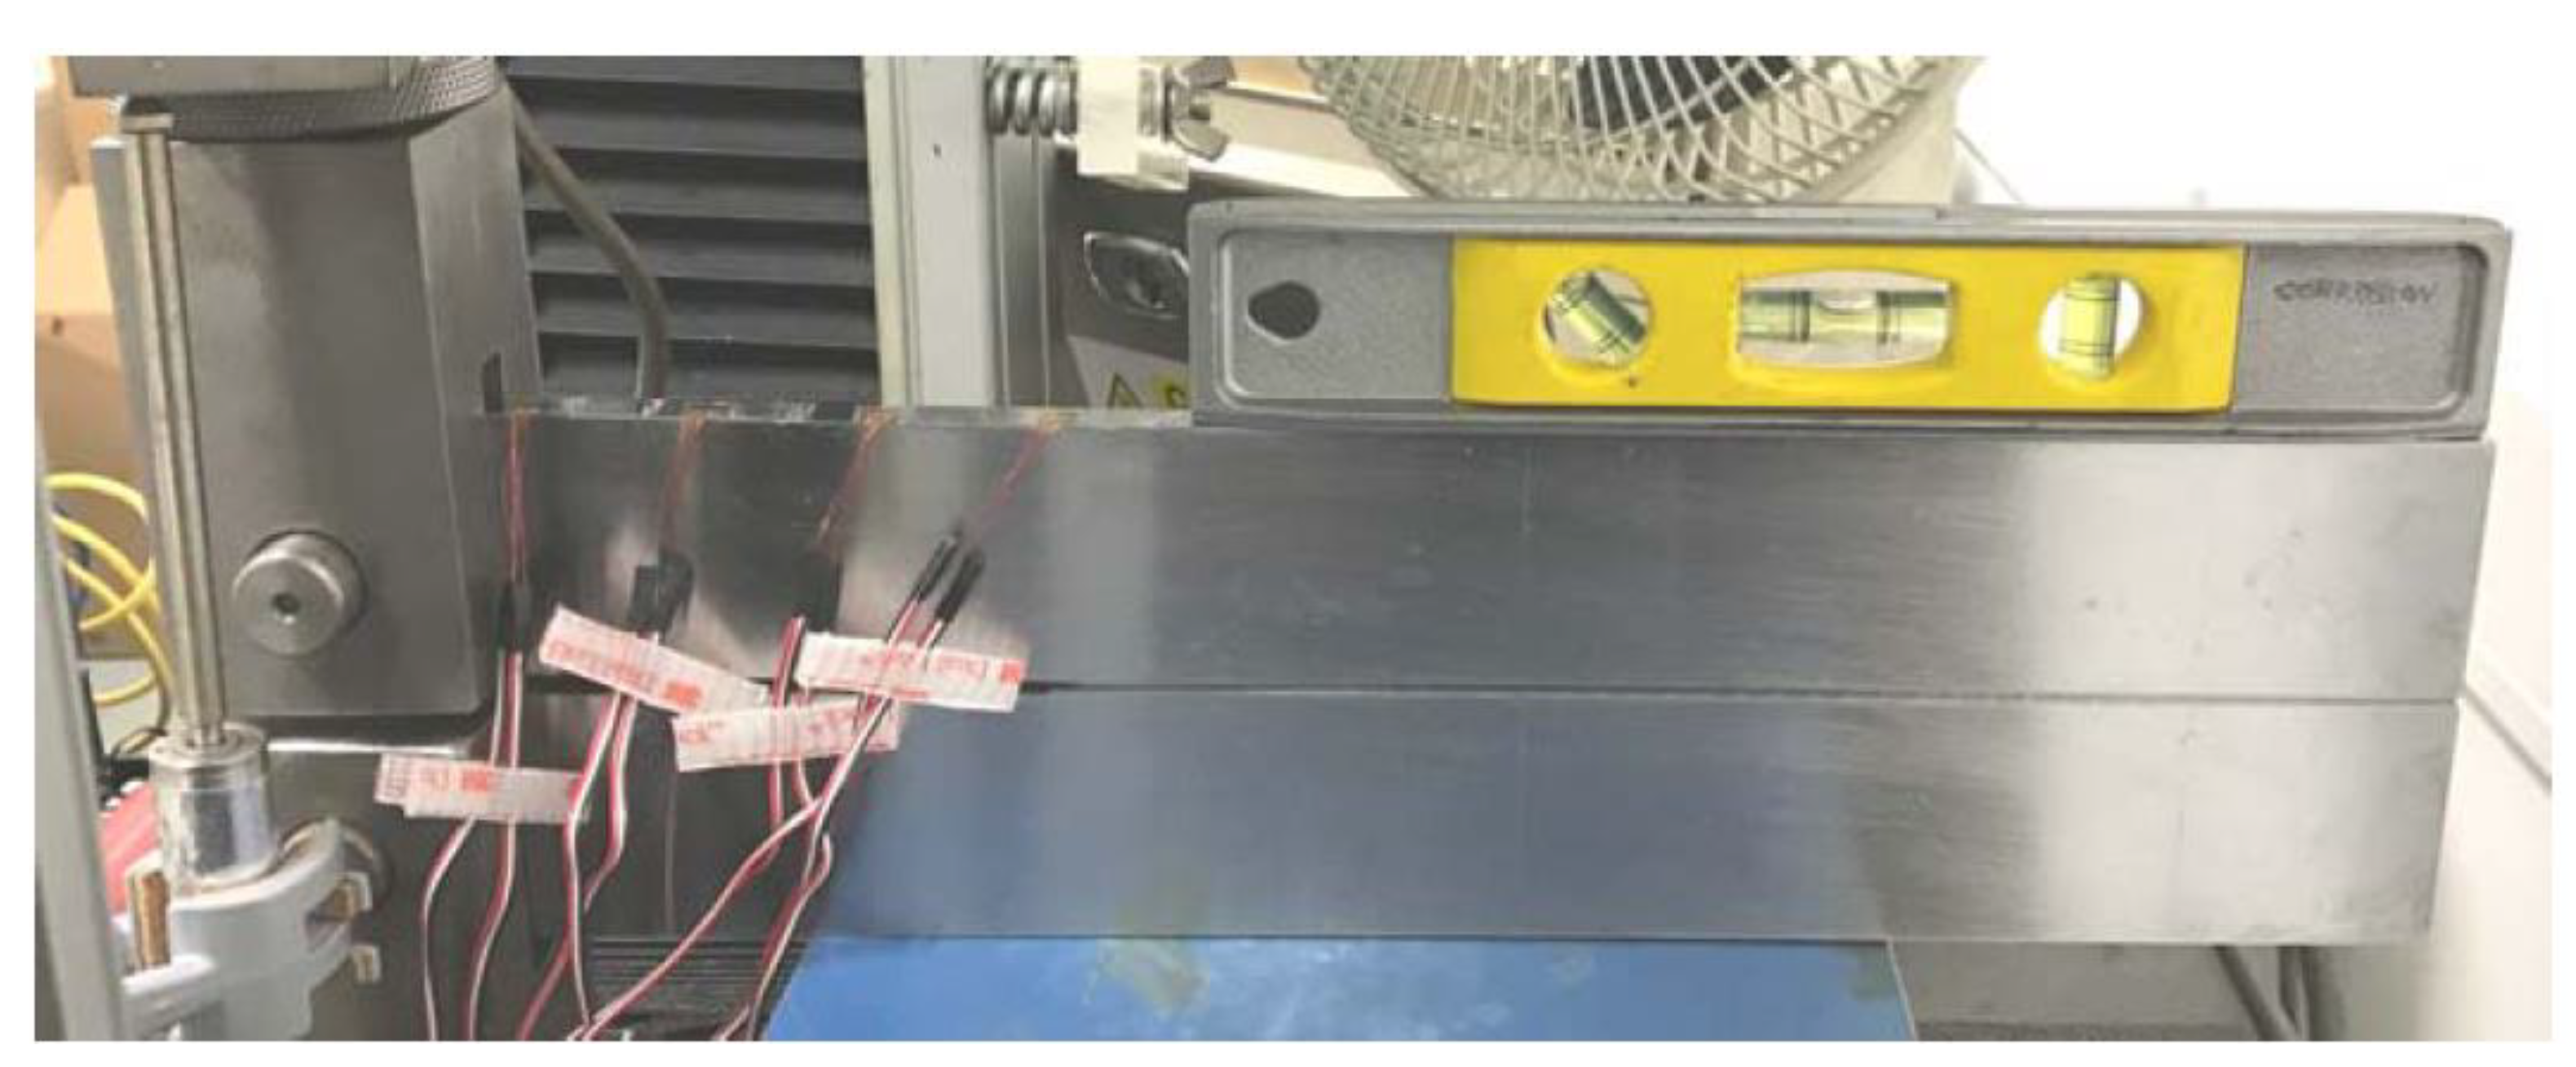
7.1. Tensile Tests
7.2. Double Cantilever Beam Test
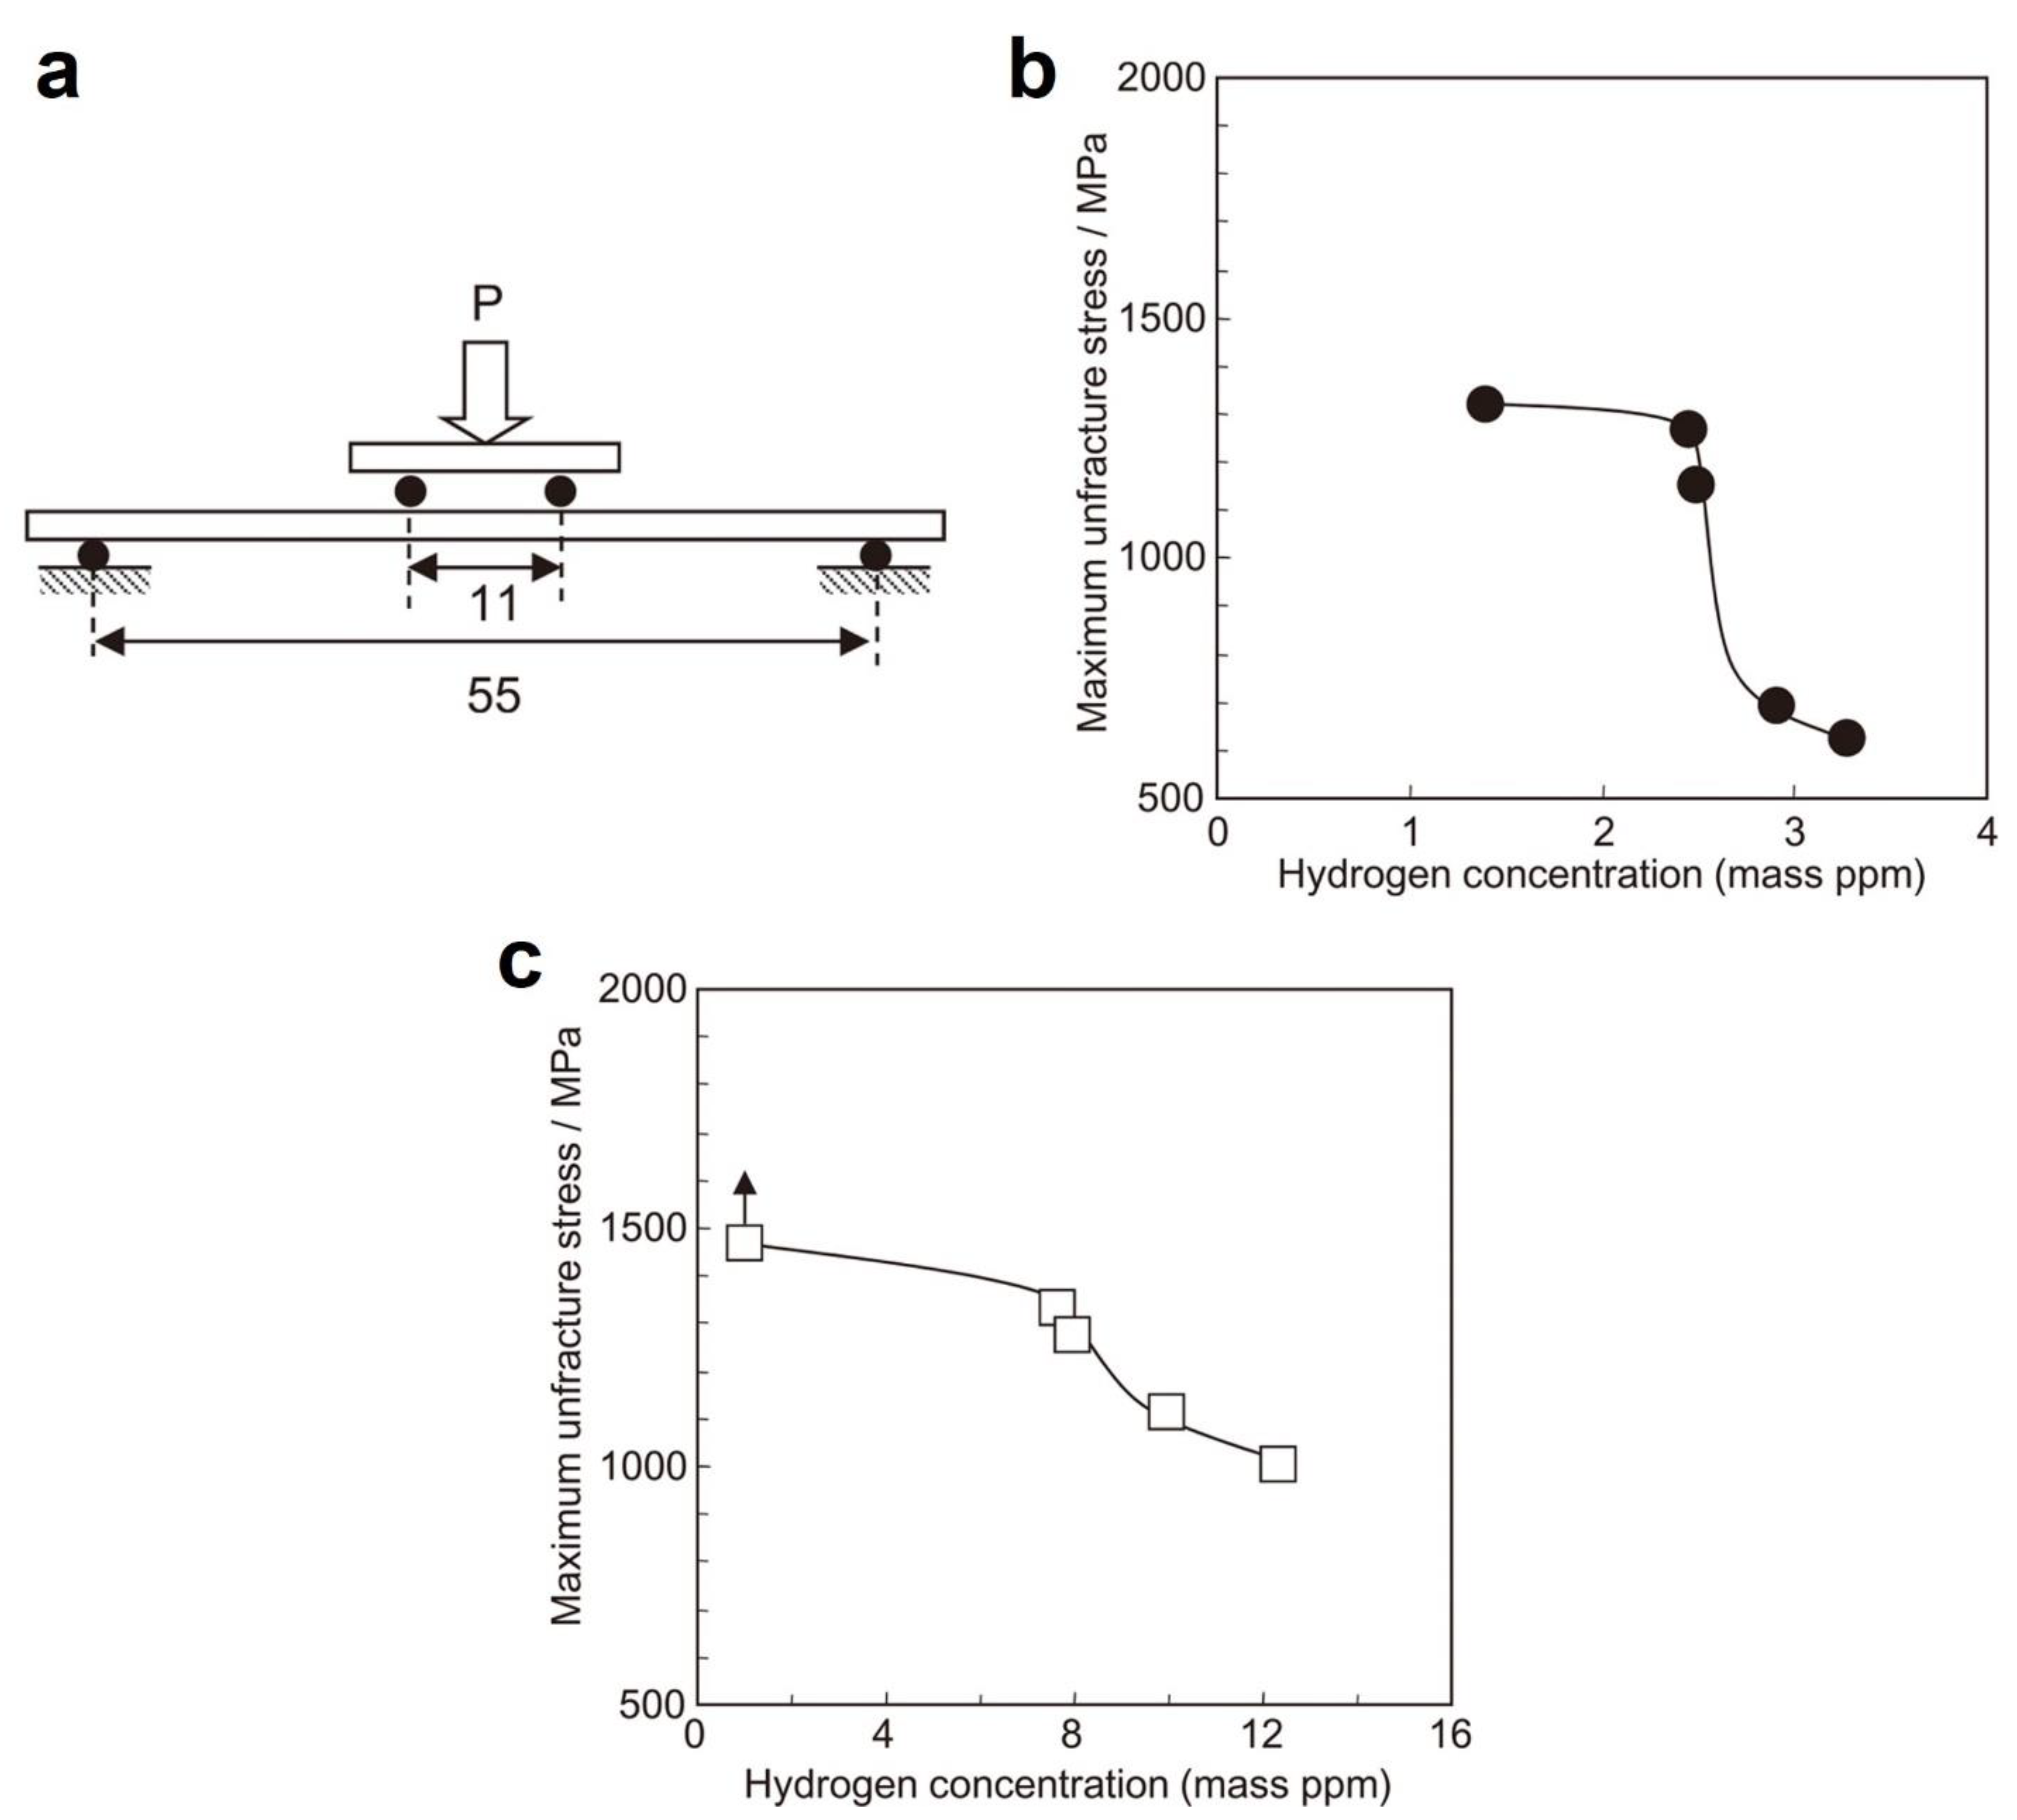
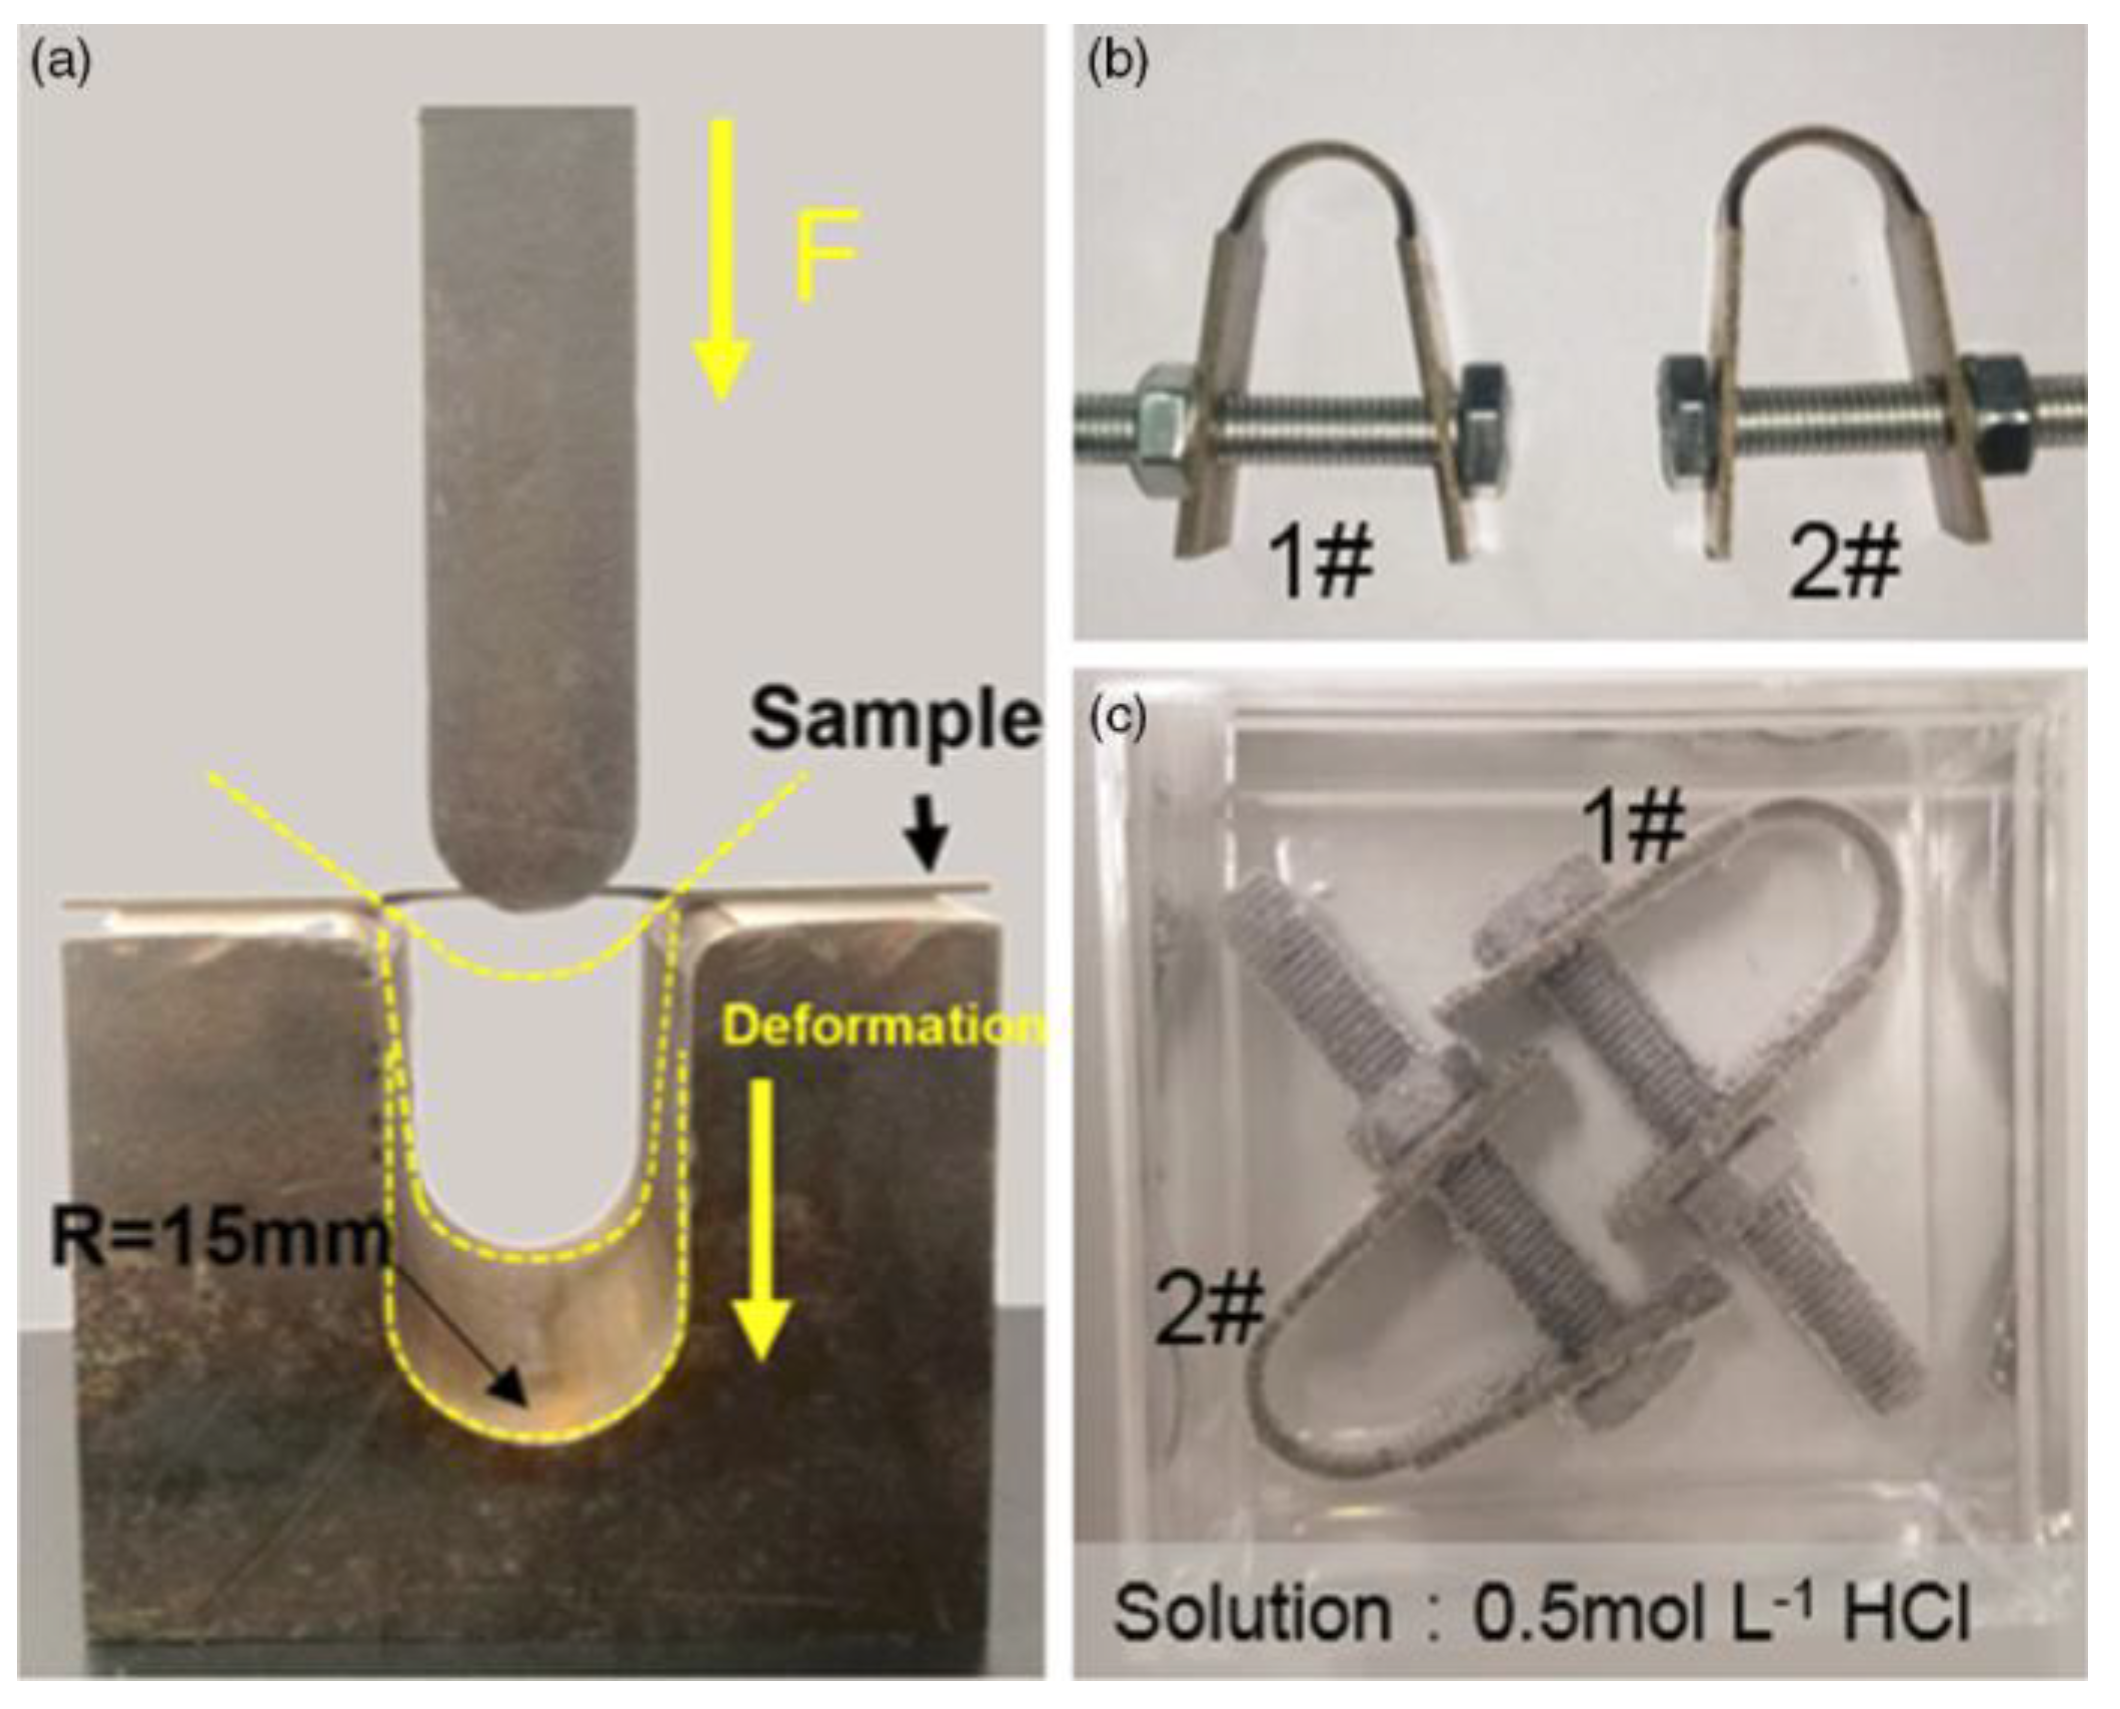
7.3. Bent Beam Test
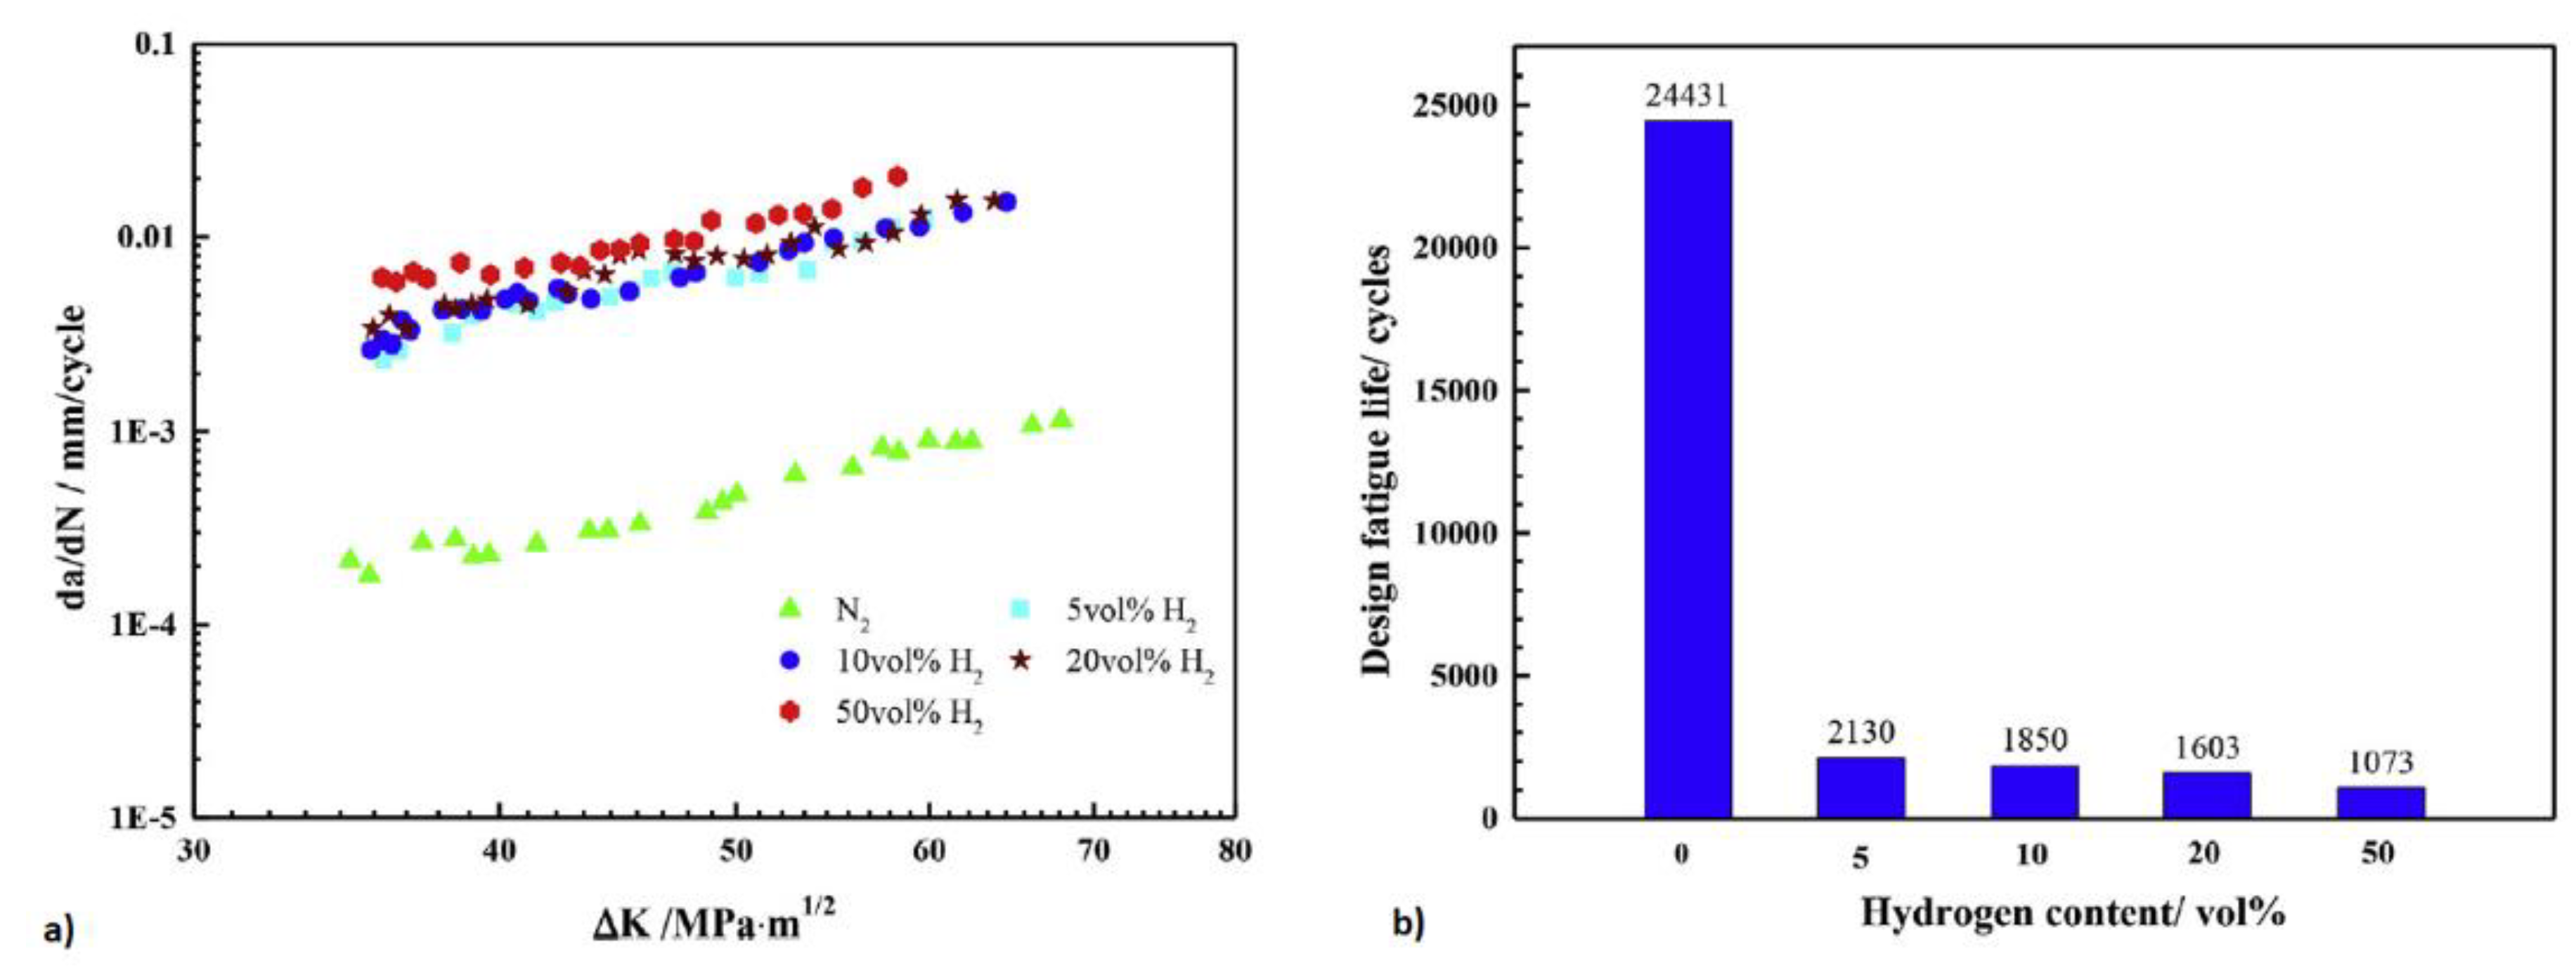
7.4. Fatigue Test
8. Conclusions
- The interaction of hydrogen with metals involves three steps: physisorption, chemisorption, and diffusion into the steel.
- The diffusion of hydrogen into metals is influenced by various factors. The impact of hydrogen traps is particularly significant. Point defects, line defects, plane defects, and volumetric defects in metal–hydrogen can all serve as hydrogen traps. These traps can be classified as reversible and irreversible based on their binding energy, but a case-by-case analysis is also pertinent. For instance, some traps might transition from being irreversible hydrogen traps at room temperature to reversible traps at elevated temperatures due to the temperature dependency of trap binding energy. Notably, though grain boundaries can expedite hydrogen diffusion due to the short-circuit effect, an excessively high density of grain boundaries can decrease the rate of hydrogen diffusion, as nodal points can capture hydrogen. Additionally, hydrogen can promote the clustering of vacancies in metals, leading to the formation of voids. As a consequence, molecular hydrogen can develop within these voids. This could result in severe degradation of the metal, which should be avoided.
- The microstructure of metals also significantly influences hydrogen diffusion. For instance, cementite is considered one of the microstructures that enables rapid hydrogen diffusion. Apart from microstructures, the influence of phase boundaries is also pivotal, like the martensite/ferrite, martensite/austenite, and ferrite/austenite phase boundaries which act as reversible hydrogen traps.
- It is evident that studying the behavior of hydrogen diffusion in metals should take into consideration all potential influencing factors. Therefore, a practical approach to understanding the impact of hydrogen traps on hydrogen permeation involves conducting specific permeation experiments for a given material and focusing on measuring and characterizing various types of hydrogen traps rather than concentrating on a single influencing factor. Moreover, the limitations posed by the present characterization methods demand the development of more innovative test techniques. Such a comprehensive investigation offers a more holistic perspective on hydrogen diffusion mechanisms and is instrumental in devising effective strategies to address and mitigate hydrogen-induced problems in materials.
Author Contributions
Funding
Conflicts of Interest
Nomenclature
| List of Symbols | Definition |
| HE | hydrogen embrittlement |
| HIC | hydrogen-induced cracking |
| physisorption | physical adsorption |
| chemisorption | chemical adsorption |
| fcc | face-centered cubic |
| hcp | hexagonal close-packed |
| bcc | body-centered cubic |
| O sites | octahedral sites |
| T sites | tetrahedral sites |
| HMT | hydrogen microprint technique |
| SEM | scanning electron microscopy |
| TEM | transmission electron microscopy |
| silver bromide | |
| sodium nitrite | |
| sodium thiosulfate | |
| ammonium thiocyanate | |
| thiourea | |
| acetic acid | |
| sodium acetate | |
| PSU | power supply unit |
| Pt | platinum |
| SSRT | slow strain rate tension test |
| CGHAZ | coarse-grained heat-affected zone |
| diffusion flux | |
| diffusion coefficient | |
| concentration gradient | |
| the change in concentration over time | |
| the second derivative of the concentration with respect to the distance | |
| () | the hydrogen concentration on the entry side (also referred to as charging side) in the hydrogen permeation test |
| ( | transient current in the hydrogen permeation test |
| () | the steady-state current in the hydrogen permeation test |
| () | the time elapsed from the beginning of the permeation test until the ratio of transient-to-steady-state current reaches 0.63 |
| () | the time calculated by extrapolating the linear portion of the rising hydrogen permeation current transient |
| () | the effective diffusion coefficient in the hydrogen permeation test |
| () | permeation flux at steady state in the hydrogen permeation test |
| () | background current in the hydrogen permeation test |
| () | total density of hydrogen trap |
| () | lattice diffusion coefficient of hydrogen |
| () | binding energy |
| () | the density of the interstitial sites in the steel |
| () | the density of irreversible traps in the steel |
| () | the density of reversible traps in the steel |
| () | dissolution enthalpy of hydrogen into steel |
| () | fugacity of hydrogen |
| LP | laser peening |
| HEDE | hydrogen-enhanced decohesion mechanism |
| CTOD | critical crack tip opening displacement |
| HELP | hydrogen-enhanced localized plasticity |
| AIDE | adsorption-induced dislocation emission |
| HEMP | hydrogen-enhanced macroscopic plasticity |
| TDA | thermal desorption analysis |
| CSRT | conventional strain rate test |
| elongation loss rate | |
| area reduction rate | |
| elongation before charging | |
| elongation after charging | |
| area reduction before charging | |
| area reduction after charging | |
| threshold stress | |
| LIST | linearly increasing stress testing |
| SCC | stress corrosion cracking |
| TWIP | twinning-induced plasticity |
| DCB | double cantilever beam |
| SSC | sulfide stress cracking |
| threshold stress intensity factor for SSC | |
| initial stress intensity factor | |
| critical stress intensity factor | |
| a | DCB and fatigue test—specimen crack length |
| P | DCB test—lift-off load |
| h | DCB test—specimen height of each arm |
| B | DCB test—specimen thickness |
| Bn | DCB test—specimen web thickness |
| EDM | electro-discharged machine |
| sulfuric acid | |
| D | bent beam test—deflection |
| S | bent beam test—nominal outer fiber pseudo-stress |
| l | bent beam test—distance between centerlines of end supports |
| E | elastic modulus |
| t | bent beam test—thickness of test specimen |
| T | bent beam test result |
| n | bent beam test—total number of specimens tested |
| DFS | delayed fracture strength |
| hydrochloric acid | |
| FGCR | fatigue crack growth rate |
| HAFCGR | hydrogen-affected fatigue crack growth rate |
| CT | compact tension |
| N | fatigue test—number of the cycles |
| ΔK | fatigue test variation in the stress intensity factor |
References
- Johnson, W.H., II. On Some Remarkable Changes Produced in Iron and Steel by the Action of Hydrogen and Acids. Proc. R. Soc. Lond. 1875, 23, 168–179. [Google Scholar] [CrossRef]
- Gangloff, R.P.; Somerday, B.P. Gaseous Hydrogen Embrittlement of Materials in Energy Technologies: Mechanisms, Modelling and Future Developments; Elsevier: Amsterdam, The Netherlands, 2012; ISBN 0857095374. [Google Scholar]
- Alvaro, A.; Jensen, I.T.; Kheradmand, N.; Løvvik, O.M.; Olden, V. Hydrogen Embrittlement in Nickel, Visited by First Principles Modeling, Cohesive Zone Simulation and Nanomechanical Testing. Int. J. Hydrogen Energy 2015, 40, 16892–16900. [Google Scholar] [CrossRef]
- Lu, X.; Wang, D. Effect of Hydrogen on Deformation Behavior of Alloy 725 Revealed by In-Situ Bi-Crystalline Micropillar Compression Test. J. Mater. Sci. Technol. 2021, 67, 243–253. [Google Scholar] [CrossRef]
- Bhadeshia, H.K.D.H. Prevention of Hydrogen Embrittlement in Steels. ISIJ Int. 2016, 56, 24–36. [Google Scholar] [CrossRef]
- Deng, Y.; Barnoush, A. Hydrogen Embrittlement Revealed via Novel in Situ Fracture Experiments Using Notched Micro-Cantilever Specimens. Acta Mater. 2018, 142, 236–247. [Google Scholar] [CrossRef]
- Koyama, M.; Akiyama, E.; Lee, Y.-K.; Raabe, D.; Tsuzaki, K. Overview of Hydrogen Embrittlement in High-Mn Steels. Int. J. Hydrogen Energy 2017, 42, 12706–12723. [Google Scholar] [CrossRef]
- Martin, M.L.; Dadfarnia, M.; Nagao, A.; Wang, S.; Sofronis, P. Enumeration of the Hydrogen-Enhanced Localized Plasticity Mechanism for Hydrogen Embrittlement in Structural Materials. Acta Mater. 2019, 165, 734–750. [Google Scholar] [CrossRef]
- Li, X.; Zhang, J.; Fu, Q.; Song, X.; Shen, S.; Li, Q. A Comparative Study of Hydrogen Embrittlement of 20SiMn2CrNiMo, PSB1080 and PH13-8Mo High Strength Steels. Mater. Sci. Eng. A 2018, 724, 518–528. [Google Scholar] [CrossRef]
- Li, X.; Zhang, J.; Shen, S.; Wang, Y.; Song, X. Effect of Tempering Temperature and Inclusions on Hydrogen-Assisted Fracture Behaviors of a Low Alloy Steel. Mater. Sci. Eng. A 2017, 682, 359–369. [Google Scholar] [CrossRef]
- Neeraj, T.; Srinivasan, R.; Li, J. Hydrogen Embrittlement of Ferritic Steels: Observations on Deformation Microstructure, Nanoscale Dimples and Failure by Nanovoiding. Acta Mater. 2012, 60, 5160–5171. [Google Scholar] [CrossRef]
- Zhu, X.; Li, W.; Hsu, T.Y.; Zhou, S.; Wang, L.; Jin, X. Improved Resistance to Hydrogen Embrittlement in a High-Strength Steel by Quenching–Partitioning–Tempering Treatment. Scr. Mater. 2015, 97, 21–24. [Google Scholar] [CrossRef]
- Zhou, P.; Li, W.; Zhu, X.; Li, Y.; Jin, X.; Chen, J. Graphene Containing Composite Coatings as a Protective Coatings against Hydrogen Embrittlement in Quenching & Partitioning High Strength Steel. J. Electrochem. Soc. 2016, 163, D160. [Google Scholar]
- Zhao, T.; Liu, Z.; Xu, X.; Li, Y.; Du, C.; Liu, X. Interaction between Hydrogen and Cyclic Stress and Its Role in Fatigue Damage Mechanism. Corros. Sci. 2019, 157, 146–156. [Google Scholar] [CrossRef]
- Ronevich, J.A.; Somerday, B.P.; San Marchi, C.W. Effects of Microstructure Banding on Hydrogen Assisted Fatigue Crack Growth in X65 Pipeline Steels. Int. J. Fatigue 2016, 82, 497–504. [Google Scholar] [CrossRef]
- Alvaro, A.; Wan, D.; Olden, V.; Barnoush, A. Hydrogen Enhanced Fatigue Crack Growth Rates in a Ferritic Fe-3 Wt% Si Alloy and a X70 Pipeline Steel. Eng. Fract. Mech. 2019, 219, 106641. [Google Scholar] [CrossRef]
- Ogawa, Y.; Matsunaga, H.; Yamabe, J.; Yoshikawa, M.; Matsuoka, S. Fatigue Limit of Carbon and CrMo Steels as a Small Fatigue Crack Threshold in High-Pressure Hydrogen Gas. Int. J. Hydrogen Energy 2018, 43, 20133–20142. [Google Scholar] [CrossRef]
- Wang, R. Effects of Hydrogen on the Fracture Toughness of a X70 Pipeline Steel. Corros. Sci. 2009, 51, 2803–2810. [Google Scholar] [CrossRef]
- Chatzidouros, E.V.; Traidia, A.; Devarapalli, R.S.; Pantelis, D.I.; Steriotis, T.A.; Jouiad, M. Effect of Hydrogen on Fracture Toughness Properties of a Pipeline Steel under Simulated Sour Service Conditions. Int. J. Hydrogen Energy 2018, 43, 5747–5759. [Google Scholar] [CrossRef]
- Song, Y.; Chai, M.; Yang, B.; Han, Z.; Ai, S.; Liu, Y.; Cheng, G.; Li, Y. Investigation of the Influence of Pre-Charged Hydrogen on Fracture Toughness of as-Received 2.25 Cr1Mo0. 25V Steel and Weld. Materials 2018, 11, 1068. [Google Scholar] [CrossRef]
- Bhuiyan, M.S.; Toda, H.; Shimizu, K.; Su, H.; Uesugi, K.; Takeuchi, A.; Watanabe, Y. The Role of Hydrogen on the Local Fracture Toughness Properties of 7XXX Aluminum Alloys. Metall. Mater. Trans. A 2018, 49, 5368–5381. [Google Scholar] [CrossRef]
- Pallaspuro, S.; Yu, H.; Kisko, A.; Porter, D.; Zhang, Z. Fracture Toughness of Hydrogen Charged As-Quenched Ultra-High-Strength Steels at Low Temperatures. Mater. Sci. Eng. A 2017, 688, 190–201. [Google Scholar] [CrossRef]
- Yamabe, J.; Yoshikawa, M.; Matsunaga, H.; Matsuoka, S. Effects of Hydrogen Pressure, Test Frequency and Test Temperature on Fatigue Crack Growth Properties of Low-Carbon Steel in Gaseous Hydrogen. Procedia Struct. Integr. 2016, 2, 525–532. [Google Scholar] [CrossRef]
- Staehle, R.W. Fundamental Aspects of Stress Corrosion Cracking; National Association of Corrosion Engineers: Houston, TX, USA, 1969; p. 3. [Google Scholar]
- Kittel, C.; McEuen, P. Introduction to Solid State Physics; John Wiley & Sons: Hoboken, NJ, USA, 2018; ISBN 1119454166. [Google Scholar]
- Smialowski, M. Hydrogen in Steel: Effect of Hydrogen on Iron and Steel during Production, Fabrication, and Use; Elsevier: Amsterdam, The Netherlands, 2014; ISBN 1483213714. [Google Scholar]
- Smialowski, M. Chapter 1—Metals and hydrogen. In Hydrogen in Steel; Smialowski, M., Ed.; Pergamon: Oxford, UK, 1962; pp. 1–24. ISBN 978-0-08-009697-1. [Google Scholar]
- Tien, C. Chapter 1—Introduction. In Introduction to Adsorption; Tien, C., Ed.; Elsevier: Amsterdam, The Netherlands, 2019; pp. 1–6. ISBN 978-0-12-816446-4. [Google Scholar]
- Atkins, P.W.; De Paula, J. Atkins’ Physical Chemistry; Oxford University Press: Oxford, UK, 2014; ISBN 019969740X. [Google Scholar]
- Christmann, K. Interaction of Hydrogen with Solid Surfaces. Surf. Sci. Rep. 1988, 9, 1–163. [Google Scholar] [CrossRef]
- Liu, Q.; Atrens, A. A Critical Review of the Influence of Hydrogen on the Mechanical Properties of Medium-Strength Steels. Corros. Rev. 2013, 31, 85–103. [Google Scholar] [CrossRef]
- Lu, X.; Wang, D.; Johnsen, R. Hydrogen Diffusion and Trapping in Nickel-Based Alloy 625: An Electrochemical Permeation Study. Electrochim. Acta 2022, 421, 140477. [Google Scholar] [CrossRef]
- Martin, F.; Feaugas, X.; Oudriss, A.; Tanguy, D.; Briottet, L.; Kittel, J. State of Hydrogen in Matter: Fundamental Ad/Absorption, Trapping and Transport Mechanisms. In Mechanics-Microstructure-Corrosion Coupling; Elsevier: Amsterdam, The Netherlands, 2019; pp. 171–197. [Google Scholar]
- Popov, B.N.; Lee, J.-W.; Djukic, M.B. Hydrogen Permeation and Hydrogen-Induced Cracking. In Handbook of Environmental Degradation of Materials; Elsevier: Amsterdam, The Netherlands, 2018; pp. 133–162. [Google Scholar]
- Liu, Q.; Atrens, A.D.; Shi, Z.; Verbeken, K.; Atrens, A. Determination of the Hydrogen Fugacity during Electrolytic Charging of Steel. Corros. Sci. 2014, 87, 239–258. [Google Scholar] [CrossRef]
- Protopopoff, E.; Marcus, P. Surface Effects on Hydrogen Entry into Metals; Marcel Dekker: New York, NY, USA, 2002. [Google Scholar]
- Li, X.; Ma, X.; Zhang, J.; Akiyama, E.; Wang, Y.; Song, X. Review of Hydrogen Embrittlement in Metals: Hydrogen Diffusion, Hydrogen Characterization, Hydrogen Embrittlement Mechanism and Prevention. Acta Metall. Sin. Engl. Lett. 2020, 33, 759–773. [Google Scholar] [CrossRef]
- Kirchheim, R.; Pundt, A. 25—Hydrogen in Metals. In Physical Metallurgy, 5th ed.; Laughlin, D.E., Hono, K., Eds.; Elsevier: Oxford, UK, 2014; pp. 2597–2705. ISBN 978-0-444-53770-6. [Google Scholar]
- Flynn, C.P.; Stoneham, A.M. Quantum Theory of Diffusion with Application to Light Interstitials in Metals. Phys. Rev. B 1970, 1, 3966. [Google Scholar] [CrossRef]
- Paxton, A.T. From Quantum Mechanics to Physical Metallurgy of Steels. Mater. Sci. Technol. 2014, 30, 1063–1070. [Google Scholar] [CrossRef]
- Gillan, M.J. Quantum Transition State Theory and the Diffusion of Hydrogen in Metals. J. Less Common Met. 1991, 172–174, 529–537. [Google Scholar] [CrossRef]
- Díaz, A.; Alegre, J.M.; Cuesta, I.I. A Review on Diffusion Modelling in Hydrogen Related Failures of Metals. Eng. Fail. Anal. 2016, 66, 577–595. [Google Scholar] [CrossRef]
- Fukai, Y. Phase Diagrams and Statistical Thermodynamics of Binary M-H Systems. In The Metal-Hydrogen System: Basic Bulk Properties; Fukai, Y., Ed.; Springer: Berlin/Heidelberg, Germany, 1993; pp. 1–42. ISBN 978-3-662-02801-8. [Google Scholar]
- Ovejero-García, J. Hydrogen Microprint Technique in the Study of Hydrogen in Steels. J. Mater. Sci. 1985, 20, 2623–2629. [Google Scholar] [CrossRef]
- Jack, T.A. Investigation of Hydrogen Induced Cracking Susceptibility of API 5L X65 Pipeline Steels. Master’s Thesis, University of Saskatchewan, Saskatoon, SK, Canada, 2021. [Google Scholar]
- Thomas, A.; Szpunar, J.A. Hydrogen Diffusion and Trapping in X70 Pipeline Steel. Int. J. Hydrogen Energy 2020, 45, 2390–2404. [Google Scholar] [CrossRef]
- Ronevich, J.A.; Speer, J.G.; Krauss, G.; Matlock, D.K. Improvement of the Hydrogen Microprint Technique on AHSS Steels. Metallogr. Microstruct. Anal. 2012, 1, 79–84. [Google Scholar] [CrossRef]
- Devanathan, M.A.V.; Stachurski, Z. The Adsorption and Diffusion of Electrolytic Hydrogen in Palladium. Proc. R. Soc. Lond. A Math. Phys. Sci. 1962, 270, 90–102. [Google Scholar]
- Zhao, W.; Zhang, T.; Zhao, Y.; Sun, J.; Wang, Y. Hydrogen Permeation and Embrittlement Susceptibility of X80 Welded Joint under High-Pressure Coal Gas Environment. Corros. Sci. 2016, 111, 84–97. [Google Scholar] [CrossRef]
- ASTM G148-97; Standard Practice for Evaluation of Hydrogen Uptake, Permeation, and Transport in Metals by an Electrochemical Technique. ASTM International: West Conshohocken, PA, USA, 2011.
- Ajito, S.; Hojo, T.; Koyama, M.; Akiyama, E. Effects of Ammonium Thiocyanate and PH of Aqueous Solutions on Hydrogen Absorption into Iron under Cathodic Polarization. ISIJ Int. 2021, 61, 1209–1214. [Google Scholar] [CrossRef]
- Fuji, H.; Fujishiro, T.; Hara, T. Effect of Ammonium Thiocyanate on Hydrogen Entry Behavior of Low Alloy Steel under Galvanostatic Cathode Charging. ISIJ Int. 2021, 61, 1151–1158. [Google Scholar] [CrossRef]
- Mohtadi-Bonab, M.A.; Szpunar, J.A.; Razavi-Tousi, S.S. A Comparative Study of Hydrogen Induced Cracking Behavior in API 5L X60 and X70 Pipeline Steels. Eng. Fail. Anal. 2013, 33, 163–175. [Google Scholar] [CrossRef]
- Fallahmohammadi, E.; Bolzoni, F.; Lazzari, L. Measurement of Lattice and Apparent Diffusion Coefficient of Hydrogen in X65 and F22 Pipeline Steels. Int. J. Hydrogen Energy 2013, 38, 2531–2543. [Google Scholar] [CrossRef]
- Koren, E.; Hagen, C.M.H.; Wang, D.; Lu, X.; Johnsen, R.; Yamabe, J. Experimental Comparison of Gaseous and Electrochemical Hydrogen Charging in X65 Pipeline Steel Using the Permeation Technique. Corros. Sci. 2023, 215, 111025. [Google Scholar] [CrossRef]
- Zhang, S.; Li, J.; An, T.; Zheng, S.; Yang, K.; Lv, L.; Xie, C.; Chen, L.; Zhang, L. Investigating the Influence Mechanism of Hydrogen Partial Pressure on Fracture Toughness and Fatigue Life by In-Situ Hydrogen Permeation. Int. J. Hydrogen Energy 2021, 46, 20621–20629. [Google Scholar] [CrossRef]
- Wang, C.; Zhang, J.; Liu, C.; Hu, Q.; Zhang, R.; Xu, X.; Yang, H.; Ning, Y.; Li, Y. Study on Hydrogen Embrittlement Susceptibility of X80 Steel through In-Situ Gaseous Hydrogen Permeation and Slow Strain Rate Tensile Tests. Int. J. Hydrogen Energy 2023, 48, 243–256. [Google Scholar] [CrossRef]
- Cheng, Y.F. Analysis of Electrochemical Hydrogen Permeation through X-65 Pipeline Steel and Its Implications on Pipeline Stress Corrosion Cracking. Int. J. Hydrogen Energy 2007, 32, 1269–1276. [Google Scholar] [CrossRef]
- Turnbull, A. 4—Hydrogen Diffusion and Trapping in Metals. In Gaseous Hydrogen Embrittlement of Materials in Energy Technologies; Gangloff, R.P., Somerday, B.P., Eds.; Woodhead Publishing: Sawston, UK, 2012; Volume 1, pp. 89–128. ISBN 978-0-85709-536-7. [Google Scholar]
- Zakroczymski, T. Adaptation of the Electrochemical Permeation Technique for Studying Entry, Transport and Trapping of Hydrogen in Metals. Electrochim. Acta 2006, 51, 2261–2266. [Google Scholar] [CrossRef]
- Doyle, D.M.; Palumbo, G.; Aust, K.T.; El-Sherik, A.M.; Erb, U. The Influence of Intercrystalline Defects on Hydrogen Activity and Transport in Nickel. Acta Metall. Et. Mater. 1995, 43, 3027–3033. [Google Scholar] [CrossRef]
- Rudomilova, D.; Prošek, T.; Salvetr, P.; Knaislová, A.; Novák, P.; Kodým, R.; Schimo-Aichhorn, G.; Muhr, A.; Duchaczek, H.; Luckeneder, G. The Effect of Microstructure on Hydrogen Permeability of High Strength Steels. Mater. Corros. 2020, 71, 909–917. [Google Scholar] [CrossRef]
- Song, Y.; Han, Z.; Chai, M.; Yang, B.; Liu, Y.; Cheng, G.; Li, Y.; Ai, S. Effect of Cementite on the Hydrogen Diffusion/Trap Characteristics of 2.25 Cr-1Mo-0.25 V Steel with and without Annealing. Materials 2018, 11, 788. [Google Scholar] [CrossRef]
- Dong, C.F.; Liu, Z.Y.; Li, X.G.; Cheng, Y.F. Effects of Hydrogen-Charging on the Susceptibility of X100 Pipeline Steel to Hydrogen-Induced Cracking. Int. J. Hydrogen Energy 2009, 34, 9879–9884. [Google Scholar] [CrossRef]
- Haq, A.J.; Muzaka, K.; Dunne, D.P.; Calka, A.; Pereloma, E.V. Effect of Microstructure and Composition on Hydrogen Permeation in X70 Pipeline Steels. Int. J. Hydrogen Energy 2013, 38, 2544–2556. [Google Scholar] [CrossRef]
- Zhou, P.; Li, W.; Zhao, H.; Jin, X. Role of Microstructure on Electrochemical Hydrogen Permeation Properties in Advanced High Strength Steels. Int. J. Hydrogen Energy 2018, 43, 10905–10914. [Google Scholar] [CrossRef]
- San Marchi, C.; Somerday, B.P.; Robinson, S.L. Permeability, Solubility and Diffusivity of Hydrogen Isotopes in Stainless Steels at High Gas Pressures. Int. J. Hydrogen Energy 2007, 32, 100–116. [Google Scholar] [CrossRef]
- JO’M, B.; Subramanyan, P.K. The Equivalent Pressure of Molecular Hydrogen in Cavities within Metals in Terms of the Overpotential Developed during the Evolution of Hydrogen. Electrochim. Acta 1971, 16, 2169–2179. [Google Scholar]
- Sandler, S.I. Chemical, Biochemical, and Engineering Thermodynamics; John Wiley & Sons: Hoboken, NJ, USA, 2017; ISBN 047050479X. [Google Scholar]
- Venezuela, J.; Tapia-Bastidas, C.; Zhou, Q.; Depover, T.; Verbeken, K.; Gray, E.; Liu, Q.; Liu, Q.; Zhang, M.; Atrens, A. Determination of the Equivalent Hydrogen Fugacity during Electrochemical Charging of 3.5 NiCrMoV Steel. Corros. Sci. 2018, 132, 90–106. [Google Scholar] [CrossRef]
- Atrens, A.; Mezzanotte, D.; Fiore, N.F.; Genshaw, M.A. Electrochemical Studies of Hydrogen Diffusion and Permeability in Ni. Corros. Sci. 1980, 20, 673–684. [Google Scholar] [CrossRef]
- Liu, Q.; Gray, E.; Venezuela, J.; Zhou, Q.; Tapia-Bastidas, C.; Zhang, M.; Atrens, A. Equivalent Hydrogen Fugacity during Electrochemical Charging of 980DP Steel Determined by Thermal Desorption Spectroscopy. Adv. Eng. Mater. 2018, 20, 1700469. [Google Scholar] [CrossRef]
- Polfus, J.M.; Løvvik, O.M.; Bredesen, R.; Peters, T. Hydrogen Induced Vacancy Clustering and Void Formation Mechanisms at Grain Boundaries in Palladium. Acta Mater. 2020, 195, 708–719. [Google Scholar] [CrossRef]
- Lee, S.-M.; Lee, J.-Y. The Trapping and Transport Phenomena of Hydrogen in Nickel. Metall. Trans. A 1986, 17, 181–187. [Google Scholar] [CrossRef]
- Chu, W. Hydrogen Embrittlement and Stress Corrosion: Fundamentals; Science Press: Beijing, China, 2013; ISBN 9787030388841. [Google Scholar]
- Frappart, S.; Feaugas, X.; Creus, J.; Thebault, F.; Delattre, L.; Marchebois, H. Study of the Hydrogen Diffusion and Segregation into Fe–C–Mo Martensitic HSLA Steel Using Electrochemical Permeation Test. J. Phys. Chem. Solids 2010, 71, 1467–1479. [Google Scholar] [CrossRef]
- Pressouyre, G.M. Trap Theory of Hydrogen Embrittlement. Acta Metall. 1980, 28, 895–911. [Google Scholar] [CrossRef]
- Mohtadi-Bonab, M.A.; Eskandari, M.; Szpunar, J.A. Texture, Local Misorientation, Grain Boundary and Recrystallization Fraction in Pipeline Steels Related to Hydrogen Induced Cracking. Mater. Sci. Eng. A 2015, 620, 97–106. [Google Scholar] [CrossRef]
- Pressouyre, G.M.; Bernstein, I.M. An Example of the Effect of Hydrogen Trapping on Hydrogen Embrittlement. Metall. Trans. A 1981, 12, 835–844. [Google Scholar] [CrossRef]
- Fu, Y.; Li, T.; Yan, Y.-B.; Wang, X.-Y.; Zhu, M.-L.; Xuan, F.-Z. A First Principles Study on H-Atom Interaction with Bcc Metals. Int. J. Hydrogen Energy 2023, 48, 9911–9920. [Google Scholar] [CrossRef]
- Beck, W.; Bockris, J.O.M.; Genshaw, M.A.; Subramanyan, P.K. Diffusivity and Solubility of Hydrogen as a Function of Composition in Fe-Ni Alloys. Metall. Trans. 1971, 2, 883–888. [Google Scholar] [CrossRef]
- Fukuda, K.; Tojo, A.; Matsumoto, R. Evaluating Solubility and Diffusion Coefficient of Hydrogen in Martensitic Steel Using Computational Mechanics. Mater. Trans. 2020, 61, 1287–1293. [Google Scholar] [CrossRef]
- Pressouyre, G.M.; Bernstein, I.M. A Quantitative Analysis of Hydrogen Trapping. Metall. Trans. A 1978, 9, 1571–1580. [Google Scholar] [CrossRef]
- Zaw, A.K.; Chernov, I.I.; Staltsov, M.S.; Kalin, B.A.; Efimov, V.S. Hydrogen Retention by Vanadium-Titanium Alloys. Inorg. Mater. Appl. Res. 2015, 6, 138–142. [Google Scholar] [CrossRef]
- Paul, A.; Laurila, T.; Vuorinen, V.; Divinski, S.V. Short-Circuit Diffusion. In Thermodynamics, Diffusion and the Kirkendall Effect in Solids; Paul, A., Laurila, T., Vuorinen, V., Divinski, S.V., Eds.; Springer International Publishing: Cham, Switzerland, 2014; pp. 429–491. ISBN 978-3-319-07461-0. [Google Scholar]
- Oudriss, A.; Creus, J.; Bouhattate, J.; Savall, C.; Peraudeau, B.; Feaugas, X. The Diffusion and Trapping of Hydrogen along the Grain Boundaries in Polycrystalline Nickel. Scr. Mater. 2012, 66, 37–40. [Google Scholar] [CrossRef]
- Ichimura, M.; Sasajima, Y.; Imabayashi, M. Grain Boundary Effect on Diffusion of Hydrogen in Pure Aluminum. Mater. Trans. JIM 1991, 32, 1109–1114. [Google Scholar] [CrossRef]
- Choo, W.Y.; Lee, J.Y. Effect of Cold Working on the Hydrogen Trapping Phenomena in Pure Iron. Metall. Trans. A 1983, 14, 1299–1305. [Google Scholar] [CrossRef]
- Hull, D.; Bacon, D.J. Chapter 2—Observation of Dislocations. In Introduction to Dislocations, 5th ed.; Hull, D., Bacon, D.J., Eds.; Butterworth-Heinemann: Oxford, UK, 2011; pp. 21–41. ISBN 978-0-08-096672-4. [Google Scholar]
- Song, Y.; Huang, S.; Sheng, J.; Agyenim-Boateng, E.; Jiang, Y.; Liu, Q.; Zhu, M. Improvement of Hydrogen Embrittlement Resistance of 2205 Duplex Stainless Steel by Laser Peening. Int. J. Hydrogen Energy 2023, 48, 18930–18945. [Google Scholar] [CrossRef]
- Kurkela, M.; Latanision, R.M. The Effect of Plastic Deformation on the Transport of Hydrogen in Nickel. Scr. Metall. 1979, 13, 927–932. [Google Scholar] [CrossRef]
- Chêne, J.; Brass, A.M. Hydrogen Transport by Mobile Dislocations in Nickel Base Superalloy Single Crystals. Scr. Mater. 1999, 40, 537–542. [Google Scholar] [CrossRef]
- Mohtadi-Bonab, M.A.; Masoumi, M. Different Aspects of Hydrogen Diffusion Behavior in Pipeline Steel. J. Mater. Res. Technol. 2023, 24, 4762–4783. [Google Scholar] [CrossRef]
- Park, G.T.; Koh, S.U.; Jung, H.G.; Kim, K.Y. Effect of Microstructure on the Hydrogen Trapping Efficiency and Hydrogen Induced Cracking of Linepipe Steel. Corros. Sci. 2008, 50, 1865–1871. [Google Scholar] [CrossRef]
- Turnbull, A.; Hutchings, R.B. Analysis of Hydrogen Atom Transport in a Two-Phase Alloy. Mater. Sci. Eng. A 1994, 177, 161–171. [Google Scholar] [CrossRef]
- Van den Eeckhout, E.; Laureys, A.; Van Ingelgem, Y.; Verbeken, K. Hydrogen Permeation through Deformed and Heat-Treated Armco Pure Iron. Mater. Sci. Technol. 2017, 33, 1515–1523. [Google Scholar] [CrossRef]
- Pfeil, L.B. The Effect of Occluded Hydrogen on the Tensile Strength of Iron. Proc. R. Soc. Lond. Ser. A Contain. Pap. A Math. Phys. Character 1926, 112, 182–195. [Google Scholar]
- Troiano, A.R. The Role of Hydrogen and Other Interstitials in the Mechanical Behavior of Metals. Trans. ASM 1960, 52, 54–81. [Google Scholar] [CrossRef]
- Wipf, H. Hydrogen in Metals; Springer: Berlin/Heidelberg, Germany, 1997; Volume 3. [Google Scholar]
- Sun, B.; Wang, D.; Lu, X.; Wan, D.; Ponge, D.; Zhang, X. Current Challenges and Opportunities toward Understanding Hydrogen Embrittlement Mechanisms in Advanced High-Strength Steels: A Review. Acta Metall. Sin. Engl. Lett. 2021, 34, 741–754. [Google Scholar] [CrossRef]
- Martínez-Pañeda, E.; del Busto, S.; Niordson, C.F.; Betegón, C. Strain Gradient Plasticity Modeling of Hydrogen Diffusion to the Crack Tip. Int. J. Hydrogen Energy 2016, 41, 10265–10274. [Google Scholar] [CrossRef]
- Katzarov, I.H.; Paxton, A.T. Hydrogen Embrittlement II. Analysis of Hydrogen-Enhanced Decohesion across (111) Planes in α-Fe. Phys. Rev. Mater. 2017, 1, 033603. [Google Scholar] [CrossRef]
- Lynch, S. Hydrogen Embrittlement Phenomena and Mechanisms. Corros. Rev. 2012, 30, 105–123. [Google Scholar] [CrossRef]
- Dwivedi, S.K.; Vishwakarma, M. Hydrogen Embrittlement in Different Materials: A Review. Int. J. Hydrogen Energy 2018, 43, 21603–21616. [Google Scholar] [CrossRef]
- Choudhary, S.; Vishwakarma, M.; Dwivedi, S.K. Evaluation and Prevention of Hydrogen Embrittlement by NDT Methods: A Review. Mater. Proc. 2021, 6, 18. [Google Scholar]
- Kappes, M.; Iannuzzi, M.; Carranza, R.M. Hydrogen Embrittlement of Magnesium and Magnesium Alloys: A Review. J. Electrochem. Soc. 2013, 160, C168. [Google Scholar] [CrossRef]
- Zapffe, C.A.; Sims, C.E. Hydrogen Embrittlement, Internal Stress and Defects in Steel. Trans. Aime 1941, 145, 225–271. [Google Scholar]
- Beachem, C.D. A New Model for Hydrogen-Assisted Cracking (Hydrogen “Embrittlement”). Metall. Mater. Trans. B 1972, 3, 441–455. [Google Scholar] [CrossRef]
- Pradhan, A.; Vishwakarma, M.; Dwivedi, S.K. A Review: The Impact of Hydrogen Embrittlement on the Fatigue Strength of High Strength Steel. Mater. Today Proc. 2020, 26, 3015–3019. [Google Scholar] [CrossRef]
- Song, J.; Curtin, W.A. Atomic Mechanism and Prediction of Hydrogen Embrittlement in Iron. Nat. Mater. 2013, 12, 145–151. [Google Scholar] [CrossRef]
- Sofronis, P.; Robertson, I.M. Transmission Electron Microscopy Observations and Micromechanical/Continuum Models for the Effect of Hydrogen on the Mechanical Behaviour of Metals. Philos. Mag. A 2002, 82, 3405–3413. [Google Scholar] [CrossRef]
- Robertson, I.M. The Effect of Hydrogen on Dislocation Dynamics. Eng. Fract. Mech. 2001, 68, 671–692. [Google Scholar] [CrossRef]
- Robertson, I.M.; Sofronis, P.; Nagao, A.; Martin, M.L.; Wang, S.; Gross, D.W.; Nygren, K.E. Hydrogen Embrittlement Understood. Metall. Mater. Trans. A 2015, 46, 2323–2341. [Google Scholar] [CrossRef]
- Hirth, J.P. Effects of Hydrogen on the Properties of Iron and Steel. Metall. Trans. A 1980, 11, 861–890. [Google Scholar] [CrossRef]
- Matsui, H.; Kimura, H.; Kimura, A. The Orientation Dependence of the Yield and Flow Stress of High Purity Iron Single Crystals Doped with Hydrogen. In Strength of Metals and Alloys; Elsevier: Amsterdam, The Netherlands, 1979; pp. 977–982. [Google Scholar]
- Li, X.; Zhang, J.; Akiyama, E.; Fu, Q.; Li, Q. Hydrogen Embrittlement Behavior of Inconel 718 Alloy at Room Temperature. J. Mater. Sci. Technol. 2019, 35, 499–502. [Google Scholar] [CrossRef]
- Xie, D.; Li, S.; Li, M.; Wang, Z.; Gumbsch, P.; Sun, J.; Ma, E.; Li, J.; Shan, Z. Hydrogenated Vacancies Lock Dislocations in Aluminium. Nat. Commun. 2016, 7, 13341. [Google Scholar] [CrossRef] [PubMed]
- Wu, X.; Zhang, H.; Yang, M.; Jia, W.; Qiu, Y.; Lan, L. From the Perspective of New Technology of Blending Hydrogen into Natural Gas Pipelines Transmission: Mechanism, Experimental Study, and Suggestions for Further Work of Hydrogen Embrittlement in High-Strength Pipeline Steels. Int. J. Hydrogen Energy 2022, 47, 8071–8090. [Google Scholar] [CrossRef]
- Lynch, S.P. Hydrogen Embrittlement and Liquid-Metal Embrittlement in Nickel Single Crystals. Scr. Metall. 1979, 13, 1051–1056. [Google Scholar] [CrossRef]
- Lynch, S.P. Mechanisms of Hydrogen Assisted Cracking—A Review. In Proceedings of the International Conference on Hydrogen Effects on Material Behaviour and Corrosion Deformation Interactions, Moran, WY, USA, 22–26 September 2002; pp. 449–466. [Google Scholar]
- Westlake, D.G. Generalized Model for Hydrogen Embrittlement; Argonne National Laboratory: Lemont, IL, USA, 1969. [Google Scholar]
- Birnbaum, H.K. Mechanisms of Hydrogen Related Fracture of Metals/Hydrogen Effects on Materials Behavior; Moody, N.R., Thompson, A.W., Eds.; TMS: Warrendale, PA, USA, 1990; pp. 639–658. [Google Scholar]
- Birnbaum, H.K.; Robertson, I.M.; Sofronis, P.; Teter, D. Mechanisms of Hydrogen Related Fracture—A Review. In Proceedings of the Second International Conference on Corrosion-Deformation Interactions. CDI’96, Nice, France, 24–26 September 1996; pp. 172–195. [Google Scholar]
- Uhlig, H.H. Evaluation of Stress-Corrosion Cracking Mechanisms; Academic Press: Cambridge, MA, USA, 1969. [Google Scholar]
- Song, E.J.; Bhadeshia, H.; Suh, D.-W. Effect of Hydrogen on the Surface Energy of Ferrite and Austenite. Corros. Sci. 2013, 77, 379–384. [Google Scholar] [CrossRef]
- Zhou, C.; Huang, Q.; Guo, Q.; Zheng, J.; Chen, X.; Zhu, J.; Zhang, L. Sulphide Stress Cracking Behaviour of the Dissimilar Metal Welded Joint of X60 Pipeline Steel and Inconel 625 Alloy. Corros. Sci. 2016, 110, 242–252. [Google Scholar] [CrossRef]
- Liu, Q.; Zhou, Q.; Venezuela, J.; Zhang, M.; Atrens, A. Evaluation of the Influence of Hydrogen on Some Commercial DP, Q&P and TWIP Advanced High-Strength Steels during Automobile Service. Eng. Fail. Anal. 2018, 94, 249–273. [Google Scholar]
- Dwivedi, S.K.; Vishwakarma, M. Effect of Hydrogen in Advanced High Strength Steel Materials. Int. J. Hydrogen Energy 2019, 44, 28007–28030. [Google Scholar] [CrossRef]
- Ćwiek, J.; Michalska-Ćwiek, J. Evaluation of Hydrogen Degradation of High-Strength Weldable Steels. J. Achiev. Mater. Manuf. Eng. 2010, 42, 103–110. [Google Scholar]
- Koyama, M.; Rohwerder, M.; Tasan, C.C.; Bashir, A.; Akiyama, E.; Takai, K.; Raabe, D.; Tsuzaki, K. Recent Progress in Microstructural Hydrogen Mapping in Steels: Quantification, Kinetic Analysis, and Multi-Scale Characterisation. Mater. Sci. Technol. 2017, 33, 1481–1496. [Google Scholar] [CrossRef]
- Li, H.; Niu, R.; Li, W.; Lu, H.; Cairney, J.; Chen, Y.-S. Hydrogen in Pipeline Steels: Recent Advances in Characterization and Embrittlement Mitigation. J. Nat. Gas Sci. Eng. 2022, 105, 104709. [Google Scholar] [CrossRef]
- Dong, C.; Xiao, K.; Liu, Z.; Yang, W.; Li, X. Hydrogen Induced Cracking of X80 Pipeline Steel. Int. J. Miner. Metall. Mater. 2010, 17, 579–586. [Google Scholar] [CrossRef]
- Elhoud, A.M.; Renton, N.C.; Deans, W.F. Hydrogen Embrittlement of Super Duplex Stainless Steel in Acid Solution. Int. J. Hydrogen Energy 2010, 35, 6455–6464. [Google Scholar] [CrossRef]
- Liu, Y.; Wang, M.; Liu, G. Effect of Hydrogen on Ductility of High Strength 3Ni–Cr–Mo–V Steels. Mater. Sci. Eng. A 2014, 594, 40–47. [Google Scholar] [CrossRef]
- Li, L.; Song, B.; Cai, Z.; Liu, Z.; Cui, X. Effect of Vanadium Content on Hydrogen Diffusion Behaviors and Hydrogen Induced Ductility Loss of X80 Pipeline Steel. Mater. Sci. Eng. A 2019, 742, 712–721. [Google Scholar] [CrossRef]
- Takagi, S.; Hagihara, Y.; Hojo, T.; Urushihara, W.; Kawasaki, K. Comparison of Hydrogen Embrittlement Resistance of High Strength Steel Sheets Evaluated by Several Methods. ISIJ Int. 2016, 56, 685–692. [Google Scholar] [CrossRef]
- Hojo, T.; Kobayashi, J.; Sugimoto, K.; Nagasaka, A.; Akiyama, E. Effects of Alloying Elements Addition on Delayed Fracture Properties of Ultra High-Strength TRIP-Aided Martensitic Steels. Metals 2019, 10, 6. [Google Scholar] [CrossRef]
- Zhong, Y.; Zhou, C.; Chen, S.; Wang, R. Effects of Temperature and Pressure on Stress. Corrosion Cracking Behavior of 310S Stainless Steel in Chloride Solution. Chin. J. Mech. Eng. 2017, 30, 200–206. [Google Scholar] [CrossRef]
- Natividad, C.; Salazar, M.; Contreras, A.; Albiter, A.; Pérez, R.; Gonzalez-Rodriguez, J.G. Sulfide Stress Cracking Susceptibility of Welded X-60 and X-65 Pipeline Steels. Corrosion 2006, 62, 375–382. [Google Scholar] [CrossRef]
- Parkins, R.N. Development of Strain-Rate Testing and Its Implications; ASTM International: Conshohocken, PA, USA, 1979. [Google Scholar]
- ASTM G129-21; Standard Practice for Slow Strain Rate Testing to Evaluate the Susceptibility of Metallic Materials to Environmentally Assisted Cracking. ASTM International: West Conshohocken, PA, USA, 2021.
- Basukumar, H.K.; Arun, K. V Experimental Investigation on Hydrogen Embrittlement of EN47 Spring Steel. IOP Conf. Ser. Mater. Sci. Eng. 2021, 1126, 012077. [Google Scholar] [CrossRef]
- Hagihara, Y. Evaluation of Delayed Fracture Characteristics of High-Strength Bolt Steels by CSRT. ISIJ Int. 2012, 52, 292–297. [Google Scholar] [CrossRef]
- Hagihara, Y.; Ito, C.; Hisamori, N.; Suzuki, H.; Takai, K.; Akiyama, E. Evaluation of Delayed Fracture Characteristics of High Strength Steel Based on CSRT Method. Tetsu Hagane/J. Iron Steel Inst. Jpn. 2008, 94, 215–221. [Google Scholar] [CrossRef]
- Koyama, M.; Tasan, C.C.; Akiyama, E.; Tsuzaki, K.; Raabe, D. Hydrogen-Assisted Decohesion and Localized Plasticity in Dual-Phase Steel. Acta Mater. 2014, 70, 174–187. [Google Scholar] [CrossRef]
- Atrens, A.; Dannhäuser, G.; Bäro, G. Stress-Corrosion-Cracking of Zircaloy-4 Cladding Tubes: Part 1. Threshold in the Presence of Iodine. J. Nucl. Mater. 1984, 126, 91–102. [Google Scholar] [CrossRef]
- Atrens, A.; Oehlert, A. Linearly-Increasing-Stress Testing of Carbon Steel in 4 N NaNO3 and in Bayer Liquor. J. Mater. Sci. 1998, 33, 783–788. [Google Scholar] [CrossRef]
- Atrens, A.; Brosnan, C.C.; Ramamurthy, S.; Oehlert, A.; Smith, I.O. Linearly Increasing Stress Test (LIST) for SCC Research. Meas. Sci. Technol. 1993, 4, 1281. [Google Scholar] [CrossRef]
- Winzer, N.; Atrens, A.; Dietzel, W.; Song, G.; Kainer, K.U. Comparison of the Linearly Increasing Stress Test and the Constant Extension Rate Test in the Evaluation of Transgranular Stress Corrosion Cracking of Magnesium. Mater. Sci. Eng. A 2008, 472, 97–106. [Google Scholar] [CrossRef]
- Baldy, M.F. Sulfide Stress Cracking of Steels for API Grade N-80 Tubular Products. Corrosion 1961, 17, 509t–513t. [Google Scholar] [CrossRef]
- NACE International. Laboratory Testing of Metals for Resistance to Specific Forms of Environmental Cracking in H2S Environments: Standard Test Method; NACE International: Houston, TX, USA, 1996; ISBN 157590036X. [Google Scholar]
- ASTM E1681-03; Standard Test Method for Determining Threshold Stress Intensity Factor for Environment-Assisted Cracking of Metallic Materials. ASTM International: West Conshohocken, PA, USA, 2008.
- Greer, J.B. Results of Interlaboratory Sulfide Stress Cracking Using the NACE t-1f-9 Proposed Test Method; Exxon Production Research Co.: Houston, TX, USA, 1977. [Google Scholar]
- ASTM G49-85; Standard Practice for Preparation and Use of Direct Tension Stress-Corrosion Test. ASTM International: West Conshohocken, PA, USA, 2011.
- Venezuela, J.; Liu, Q.; Zhang, M.; Zhou, Q.; Atrens, A. A Review of Hydrogen Embrittlement of Martensitic Advanced High-Strength Steels. Corros. Rev. 2016, 34, 153–186. [Google Scholar] [CrossRef]
- Al-Mansour, M.; Alfantazi, A.M.; El-Boujdaini, M. Sulfide Stress Cracking Resistance of API-X100 High Strength Low Alloy Steel. Mater. Des. 2009, 30, 4088–4094. [Google Scholar] [CrossRef]
- Carneiro, R.A.; Ratnapuli, R.C.; Lins, V.d.F.C. The Influence of Chemical Composition and Microstructure of API Linepipe Steels on Hydrogen Induced Cracking and Sulfide Stress Corrosion Cracking. Mater. Sci. Eng. A 2003, 357, 104–110. [Google Scholar] [CrossRef]
- Pontremoli, M.; Buzzichelli, G.; De Vito, A.; Bufalini, P. Composition, Microstructure and Properties of Pipeline Steels with High HIC and SSCC Resistance. In Proceedings of the XXII International Metallurgy Congress: Innovation for Quality (L’Innovazione per la Qualita), Bologna, Italy, 17–19 May 1988; Volume 2, pp. 1543–1561. [Google Scholar]
- Ume, K.; Taira, T.; Hyodo, T. Initiation and Propagation Morphology of Sulfide Stress Corrosion Cracking at Welds on Linepipe Steels; Ume, K., Taira, T., Hyodo, T., Kobayashi, Y., Eds.; Nippon Kokan K. K.: Tokyo, Japan, 1996; pp. 405–414. [Google Scholar]
- Li, S.; Chen, C.; Liu, Y.; Yu, H.; Wang, X. Influence of Surface Martensite Layer on Hydrogen Embrittlement of Fe-Mn-C-Mo Steels in Wet H2S Environment. Int. J. Hydrogen Energy 2018, 43, 16728–16736. [Google Scholar] [CrossRef]
- Seol, J.-B.; Jung, J.E.; Jang, Y.W.; Park, C.G. Influence of Carbon Content on the Microstructure, Martensitic Transformation and Mechanical Properties in Austenite/ε-Martensite Dual-Phase Fe–Mn–C Steels. Acta Mater. 2013, 61, 558–578. [Google Scholar] [CrossRef]
- Wei, Y.; Li, Y.; Zhu, L.; Liu, Y.; Lei, X.; Wang, G.; Wu, Y.; Mi, Z.; Liu, J.; Wang, H. Evading the Strength–Ductility Trade-off Dilemma in Steel through Gradient Hierarchical Nanotwins. Nat. Commun. 2014, 5, 3580. [Google Scholar] [CrossRef]
- So, K.H.; Kim, J.S.; Chun, Y.S.; Park, K.-T.; Lee, Y.-K.; Lee, C.S. Hydrogen Delayed Fracture Properties and Internal Hydrogen Behavior of a Fe–18Mn–1.5 Al–0.6 C TWIP Steel. ISIJ Int. 2009, 49, 1952–1959. [Google Scholar] [CrossRef]
- Shao, C.; Hui, W.; Zhang, Y.; Zhao, X.; Weng, Y. Effect of Intercritical Annealing Time on Hydrogen Embrittlement of Warm-Rolled Medium Mn Steel. Mater. Sci. Eng. A 2018, 726, 320–331. [Google Scholar] [CrossRef]
- Sponseller, D.L.; Sponseller, T.E. The Double Cantilever Beam (DCB) Test at Forty. BHM Berg-Und Hüttenmännische Monatshefte 2016, 1, 19–26. [Google Scholar] [CrossRef]
- Heady, R.B. Evaluation of Sulfide Corrosion Cracking Resistance in Low Alloy Steels. Corrosion 1977, 33, 98–107. [Google Scholar] [CrossRef]
- Sponseller, D.L. Interlaboratory Testing of Seven Alloys for SSC Resistance by the Double Cantilever Beam Method. Corrosion 1992, 48, 159–171. [Google Scholar] [CrossRef]
- Guntz, G.C.; Linne, C.; Puissochet, F.; Orlans-Joliet, B.; Popperling, R.; Fliethmann, J.M. DCB Test: A Review of Critical Parameters. In Proceedings of the NACE Corrosion, San Antonio, TX, USA, 25–30 April 1999; p. NACE-99606. [Google Scholar]
- Szklarz, K.E. Understanding the Size Effect in NACE TM0177 Method D (DCB) Testing and Implications for Users. In Proceedings of the NACE Corrosion, Houston, TX, USA, 11–16 March 2001; p. NACE-01074. [Google Scholar]
- Ernst, H.; Villasante, J.; Pachao, N. Specimen Geometry Effects on Crack Growth in Sour Environments. In Proceedings of the NACE Corrosion, Denver, CO, USA, 7–11 April 2002; p. NACE-02060. [Google Scholar]
- Morales, C.R.; Pérez, T.E.; Fitzsimons, G.L. Sulfide Stress Cracking: Some Osbervations about The Dcb Test. In Proceedings of the NACE Corrosion, New Orleans, LA, USA, 9–14 March 1997; p. NACE-97052. [Google Scholar]
- Asahi, H.; Sogo, Y.; Higashiyama, H. Effects of Test Conditions on KISSC Values Influenced by SSC Susceptibility of Materials. In Corrosion/1987, Paper No. 290; Houston, TX, USA, 1987. [Google Scholar]
- Asahi, H. Sulfide stress cracking resistance evaluation methods for steels used in oil field environments-features and problems. In CORROSION 91/29; Asahi, H., Tsukano, Y., Ueno, M., Eds.; NACE: Houston, TX, USA, 1991. [Google Scholar]
- Echaniz, G.; Morales, C.; Perez, T. The Effect of Microstructure on the K {Sub ISSC} Low Alloy Carbon Steels; NACE International: Houston, TX, USA, 1998. [Google Scholar]
- Szklarz, K.E.; Sutter, P.; Leyer, J.; Orlans-Joliet, B. NACE TM0177 Method D Test Procedure (DCB) Learnings from Comparative Laboratory Testing. In Proceedings of the NACE Corrosion, San Diego, CA, USA, 16–20 March 2003; p. NACE-03104. [Google Scholar]
- Linne, C.P.; Blanchard, F.; Puissochet, F.; Orlans-Joliet, B.J.; Hamilton, R.S. Heavy Wall Casing in C110 Grade for Sour Service; NACE International: Houston, TX, USA, 1998. [Google Scholar]
- Moderer, L.; Holzer, C.; Mori, G.; Klösch, G.; Klarner, J.; Sonnleitner, R. Einfluss Unterschiedlicher Testparameter Auf Den NACE Standard TM0177 DCB-Sauergastest. BHM Berg-Und Hüttenmännische Monatshefte 2013, 158, 348–354. [Google Scholar] [CrossRef]
- Maldonado, J.G.; Dent, P.; MacDonald, J.; Fowler, C. Sour Service Fitness for Purpose Testing of Linepipe Using Full Ring, 4-Point BB and Large DCBs. In Proceedings of the NACE Corrosion, Phoenix, AZ, USA, 15–19 April 2018; p. NACE-2018. [Google Scholar]
- Sun, Y.; Cheng, Y.F. Hydrogen Permeation and Distribution at a High-Strength X80 Steel Weld under Stressing Conditions and the Implication on Pipeline Failure. Int. J. Hydrogen Energy 2021, 46, 23100–23112. [Google Scholar] [CrossRef]
- Zhao, W.; Zhang, T.; He, Z.; Sun, J.; Wang, Y. Determination of the Critical Plastic Strain-Induced Stress of X80 Steel through an Electrochemical Hydrogen Permeation Method. Electrochim. Acta 2016, 214, 336–344. [Google Scholar] [CrossRef]
- Xing, Y.; Yang, Z.; Zhao, Q.; Qiao, L.; Yang, J.; Zhang, L. Stress-Based Hydrogen Damage Model of X80 Pipeline Steel and Its Damage Risk Assessment under Cathodic Interference. Int. J. Press. Vessel. Pip. 2023, 203, 104947. [Google Scholar] [CrossRef]
- Fraser, J.P.; Eldredge, G.G.; Treseder, R.S. Laboratory and Field Methods for Quantitative Study of Sulfide Corrosion Cracking. Corrosion 1958, 14, 37–43. [Google Scholar] [CrossRef]
- Hojo, T.; Zhou, Y.; Kobayashi, J.; Sugimoto, K.; Takemoto, Y.; Nagasaka, A.; Koyama, M.; Ajito, S.; Akiyama, E. Effects of Thermomechanical Processing on Hydrogen Embrittlement Properties of Ultrahigh-Strength TRIP-Aided Bainitic Ferrite Steels. Metals 2022, 12, 269. [Google Scholar] [CrossRef]
- Si, Y.; Tang, Y.; Xu, Z.; Yu, S.; Zhou, X.; Li, K.; Cao, P.; Ma, Y. Hydrogen Embrittlement and Microstructure Characterization of 1500 MPa Martensitic Steel. Steel Res. Int. 2022, 93, 2200295. [Google Scholar] [CrossRef]
- Briottet, L.; Moro, I.; Lemoine, P. Quantifying the Hydrogen Embrittlement of Pipeline Steels for Safety Considerations. Int. J. Hydrogen Energy 2012, 37, 17616–17623. [Google Scholar] [CrossRef]
- Ronevich, J.A.; D’Elia, C.R.; Hill, M.R. Fatigue Crack Growth Rates of X100 Steel Welds in High Pressure Hydrogen Gas Considering Residual Stress Effects. Eng. Fract. Mech. 2018, 194, 42–51. [Google Scholar] [CrossRef]
- ASTM E 647; Standard Test Method for Measurement of Fatigue Crack Growth Rates. American Society of Testing and Materials: Philadelphia, PA, USA, 2001.
- Cheng, A.; Chen, N.-Z. Fatigue Crack Growth Modelling for Pipeline Carbon Steels under Gaseous Hydrogen Conditions. Int. J. Fatigue 2017, 96, 152–161. [Google Scholar] [CrossRef]
- Paris, P.; Erdogan, F. A Critical Analysis of Crack Propagation Laws. J. Basic Eng. 1963, 85, 528–533. [Google Scholar] [CrossRef]
- Meng, B.; Gu, C.; Zhang, L.; Zhou, C.; Li, X.; Zhao, Y.; Zheng, J.; Chen, X.; Han, Y. Hydrogen Effects on X80 Pipeline Steel in High-Pressure Natural Gas/Hydrogen Mixtures. Int. J. Hydrogen Energy 2017, 42, 7404–7412. [Google Scholar] [CrossRef]


Disclaimer/Publisher’s Note: The statements, opinions and data contained in all publications are solely those of the individual author(s) and contributor(s) and not of MDPI and/or the editor(s). MDPI and/or the editor(s) disclaim responsibility for any injury to people or property resulting from any ideas, methods, instructions or products referred to in the content. |
© 2024 by the authors. Licensee MDPI, Basel, Switzerland. This article is an open access article distributed under the terms and conditions of the Creative Commons Attribution (CC BY) license (https://creativecommons.org/licenses/by/4.0/).
Share and Cite
Li, Q.; Ghadiani, H.; Jalilvand, V.; Alam, T.; Farhat, Z.; Islam, M.A. Hydrogen Impact: A Review on Diffusibility, Embrittlement Mechanisms, and Characterization. Materials 2024, 17, 965. https://doi.org/10.3390/ma17040965
Li Q, Ghadiani H, Jalilvand V, Alam T, Farhat Z, Islam MA. Hydrogen Impact: A Review on Diffusibility, Embrittlement Mechanisms, and Characterization. Materials. 2024; 17(4):965. https://doi.org/10.3390/ma17040965
Chicago/Turabian StyleLi, Qidong, Hesamedin Ghadiani, Vahid Jalilvand, Tahrim Alam, Zoheir Farhat, and Md. Aminul Islam. 2024. "Hydrogen Impact: A Review on Diffusibility, Embrittlement Mechanisms, and Characterization" Materials 17, no. 4: 965. https://doi.org/10.3390/ma17040965