
Phase Equilibria Related to NiGa5 in the Binary Ni-Ga System

1
Department of Materials Science and Engineering, National Taiwan University, Taipei 106216, Taiwan
2
Advanced Research Center for Green Materials Science & Technology, National Taiwan University, Taipei 106216, Taiwan
*
Author to whom correspondence should be addressed.
Materials 2024, 17(4), 883; https://doi.org/10.3390/ma17040883
Submission received: 18 January 2024
/
Revised: 8 February 2024
/
Accepted: 12 February 2024
/
Published: 14 February 2024
(This article belongs to the Special Issue Plastic Deformation, Strengthening and Toughening of Advanced Metallic Materials)
Abstract
:The assembly of Ga alloys with Ni or Ni alloy has been widely developed for various low-temperature applications in recent years. In the constituent Ni-Ga binary system, however, the phase equilibrium with the phase “NiGa5” and its stability has scarcely been investigated. The present study used the diffusion couple technique combined with SEM-EPMA and XRD analysis to examine the phase stability and the homogeneity range of the phase. The results show that “NiGa5” is a stable phase in the binary system with little homogeneity range and suggest that the peritectic reaction lies between 112.0 and 115.5 °C. This work provides new information for the modification of the Ga-rich low-T region of the Ni-Ga phase diagram.
1. Introduction
In recent years, the Ni-Ga system has gained significant attention due to growing interest in utilizing gallium and its alloys in conjunction with nickel or nickel alloys. Gallium alloys, characterized by liquidus temperatures lower than room temperature, have found applications in soft robotics and wearable devices owing to their inherent electrical conductivity and fluidicity. For example, Suin Kim et al. [1] and Kadri Bugra Ozutemiz et al. [2] incorporated the Electroless Nickel Immersion Gold (ENIG) finishing of electronic chips in contact with gallium alloys to fabricate flexible electronics with liquid metal circuits. Biao Ma et al. [3] dispersed Ni micro-particles in gallium alloys and magnetically patterned the conductive mixture. For the novel idea of non-thermal joining, pure gallium was utilized in transient liquid phase bonding at approximately 30 °C [4,5]. The addition of nickel to the copper substrate accelerated the growth of Intermetallic Compounds (IMCs), effectively reducing the time required to deplete the liquid phase and form a structurally sound joint [4,5,6]. In soldering applications, minor gallium additions in Sn-based solder was intended to enhance wettability, mechanical strength, maximum elongation, and suppress IMC overgrowth [7,8]. Nickel, on the other hand, is often plated on copper substrates to serve as the diffusion barrier layer [9]. Academic resources have extensively studied the rate of Ni or Ni alloy consumption through IMC formation or dissolution when immersed in gallium alloys [10,11,12,13].
In various technological applications, gallium reacts with nickel, forming IMCs during fabrication and service at temperatures ranging from room temperature to the typical tin-soldering temperature of 250 °C. Recently, a gallium-rich Ni-Ga IMC labeled “NiGa5” has been proposed in the low-temperature part of the binary system; however, uncertainties persist regarding its composition range, stable temperature, and whether it is a stable phase [14]. Consequently, the present experimental research was carried out to investigate the phase equilibria of the “NiGa5” IMC in the Ni-Ga binary system.
2. Literature Review
Yamazaki et al. [15] reported the formation of a Ga-rich unknown compound during mechanical alloying of Ni powder and liquid Ga. During this process, “NiGa4” is said to be produced by the reaction of this unknown phase and Ni.
Clemens Schmetterer et al. [14] investigated the Ga-rich region of the binary Ni-Ga system. They refuted the phase “NiGa4” crystallizing in a gamma-brass structure and substantiated the phase “Ni3Ga7” crystallizing in an Ir3Ge7 structure instead. In addition, they discovered unidentifiable XRD reflections, coinciding with those reported by Yamazaki et al. [15], in alloys with nominal compositions exceeding 80 at% Ga, and attributed the additional reflections to a new phase. Attempts to prepare a single-phase alloy or a single crystal of this new phase for crystal structure solving were unsuccessful. Therefore, this new phase, NiGa5, was assumed to be isostructural to PdGa5 with Ni replacing Pd, and the lattice constants and the tunable atomic position were determined by refining the powder XRD pattern of the specimens containing the additional reflections. Unfortunately, the phase was not found in the microstructure for microarea chemical analysis, and therefore the composition of the IMC was tentatively assumed to be NiGa5. The authors also stated that whether NiGa5 is a stable equilibrium phase is inconclusive because the as-quenched specimen had greater intensity of the phase than the annealed specimen.
Doyoung Lee et al. [16] prepared a Ni-Ga diffusion couple at temperatures from 250 to 350 °C followed by 2 min of air cooling and subsequent −20 °C freezing. The authors labelled two layers of IMCs in the cross-section: NiGax on the Ga-side and Ni3Ga7 on the Ni side. While the thickness of Ni3Ga7 increased with reaction time, that of NiGax did not show a clear tendency to change. Scattered values of composition of this NiGax phase, 85~91 at%, were reported in the study using EDX analysis. The authors found the XRD patterns of Ga-etched specimens inclusive of Ni3Ga7 and Ni reflections but exclusive of NiGax reflections. The authors attributed the absence of the reflection of NiGax to the nanocrystallinity or amorphism of the formed NiGax.
3. Materials and Methods
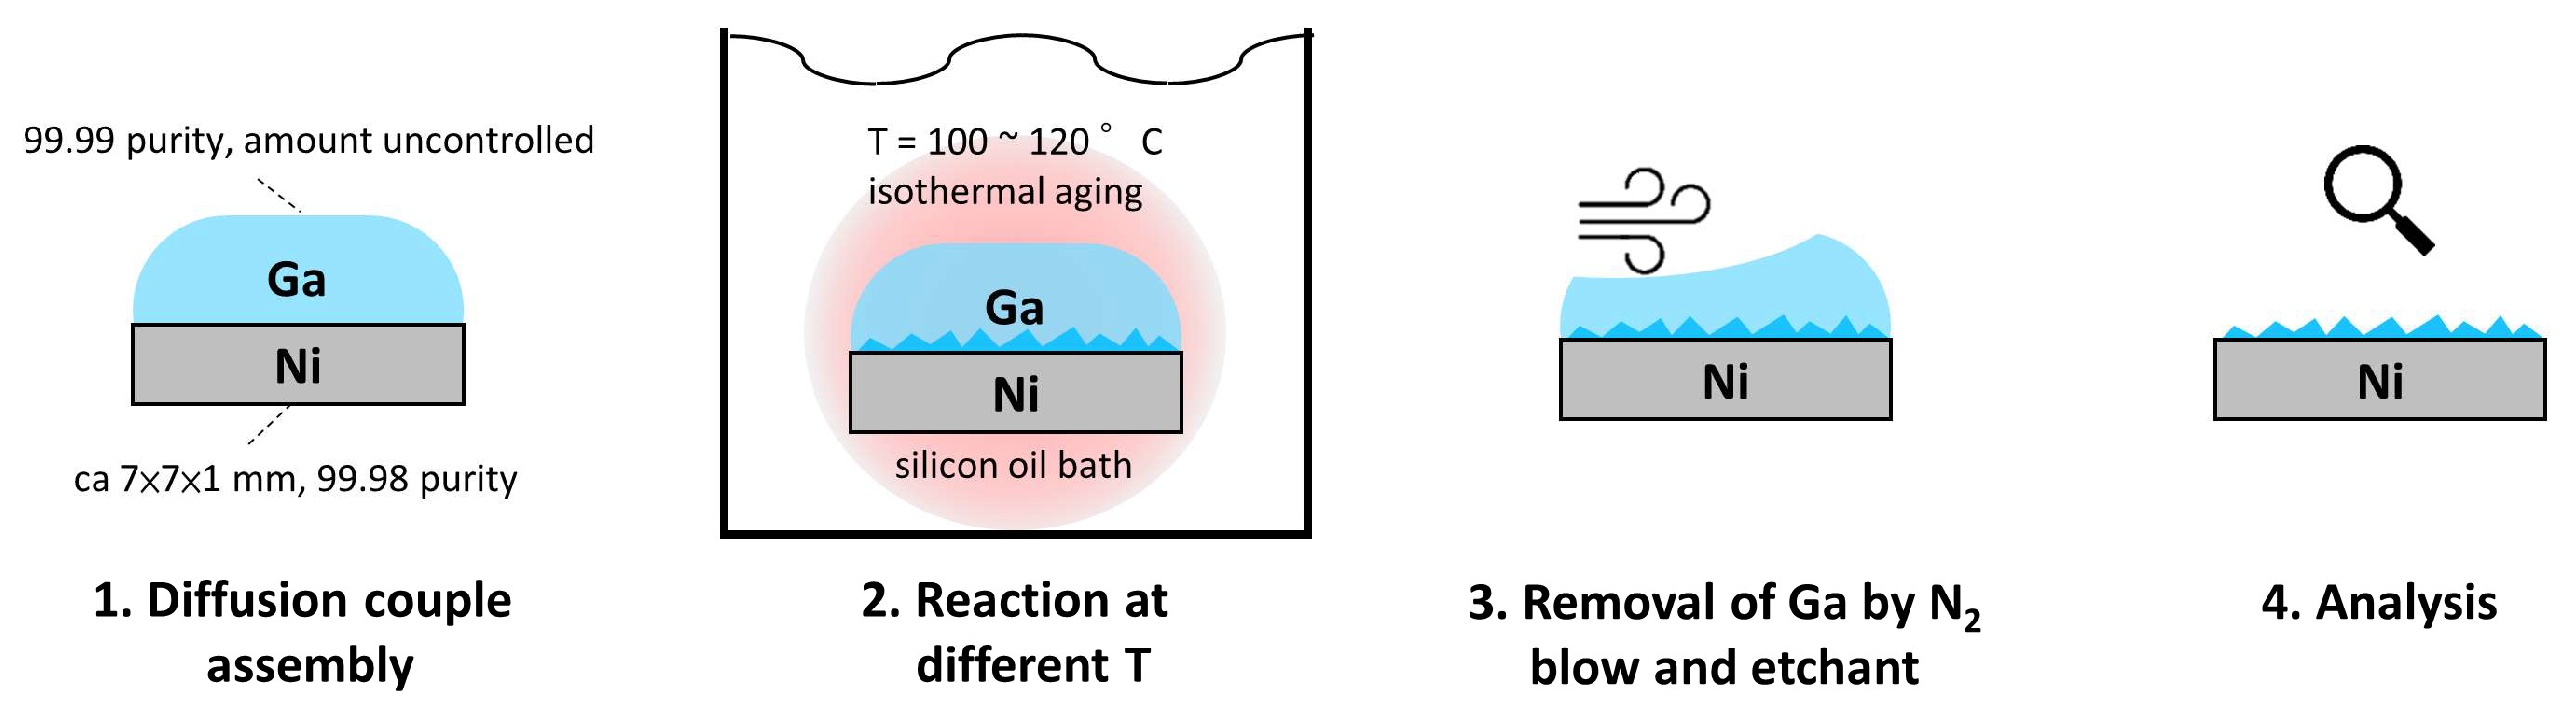
The bulk diffusion couples were prepared by assembling pure end members, Ni (99.98%, Goodfellow, Huntingdon, UK) and Ga (99.99%, Super Spark International Co., Taipei, New Taipei City, Taiwan). The nickel foil was cut into 0.8 cm square pieces and polished down to 1 μm diamond. The gallium was heated to melt in a water bath at 40 °C and placed on top of the nickel foil pieces. The assembled diffusion couples were then transferred into a circulating silicone oil bath for isothermal heat treatment with a controlled temperature stability of ±0.4 °C. The heat treatment was performed at 100.1, 110.1, 112.4, 115.1, and 117.4 °C for 168 h (7 days). Additional couples were annealed at 110.1 for 24 h (1 day) and 28 days for the metastability test. After heat treatment, the couple was taken from the bath, and, immediately, most of the molten gallium was blown away by using a nitrogen spray gun; the residual gallium was etched away in a solution of methanol–HCl (4% vol.) mixture, to prevent any possible IMC formation during storage at room temperature and to reveal the interdiffusion zone for reflection XRD analysis. The schematic plot of the sample preparation procedure is presented in Figure 1.
For phase identification, a 2θ-ω scan of X-ray diffraction (XRD) in reflection geometry was carried out on a diffractometer (TTRAX III, Rigaku, Tokyo, Japan) equipped with a CBO unit and a graphite monochromator. The specimens were placed on the thin film attachment with the interdiffusion zone facing the radiation. The radiation source was Cu Kα generated at 50 kV voltage and 300 mA current electron bombardment and collimated into a parallel light in the CBO unit.
Specimens to be examined by a scanning electron microscope and electron probe microanalyzer were embedded in epoxy resin (Epofix, Struers, Ballerup, Denmark) and the cross-sections were prepared following the conventional metallographic method. The final step was polishing with Buehler MasterPrep suspension against the porous neoprene cloth.
For quantitative analysis of the elemental composition, FE-EPMA (JEOL, Tokyo, Japan, JXA-8530F Plus) was employed to determine the composition of the obtained IMCs using built-in ZAF correction and applying GaN and Ni as the standards. The electron probe was set at 15 kV voltage and 20 nA current. The intensity of peak, upper background, and lower background were measured for 10, 5, and 5 s, respectively. Metallographic observation was performed under an optical microscope (Axio Scope A1, Zeiss, Jena, Germany) and an SEM (SU5000, Hitachi, Tokyo, Japan) with EDX installed (XFlash 6-60, Bruker, Billerica, MA, USA). The average thickness of each IMC layer was calculated by dividing the cross-sectional IMC area by the length of field of view.
4. Results and Discussion
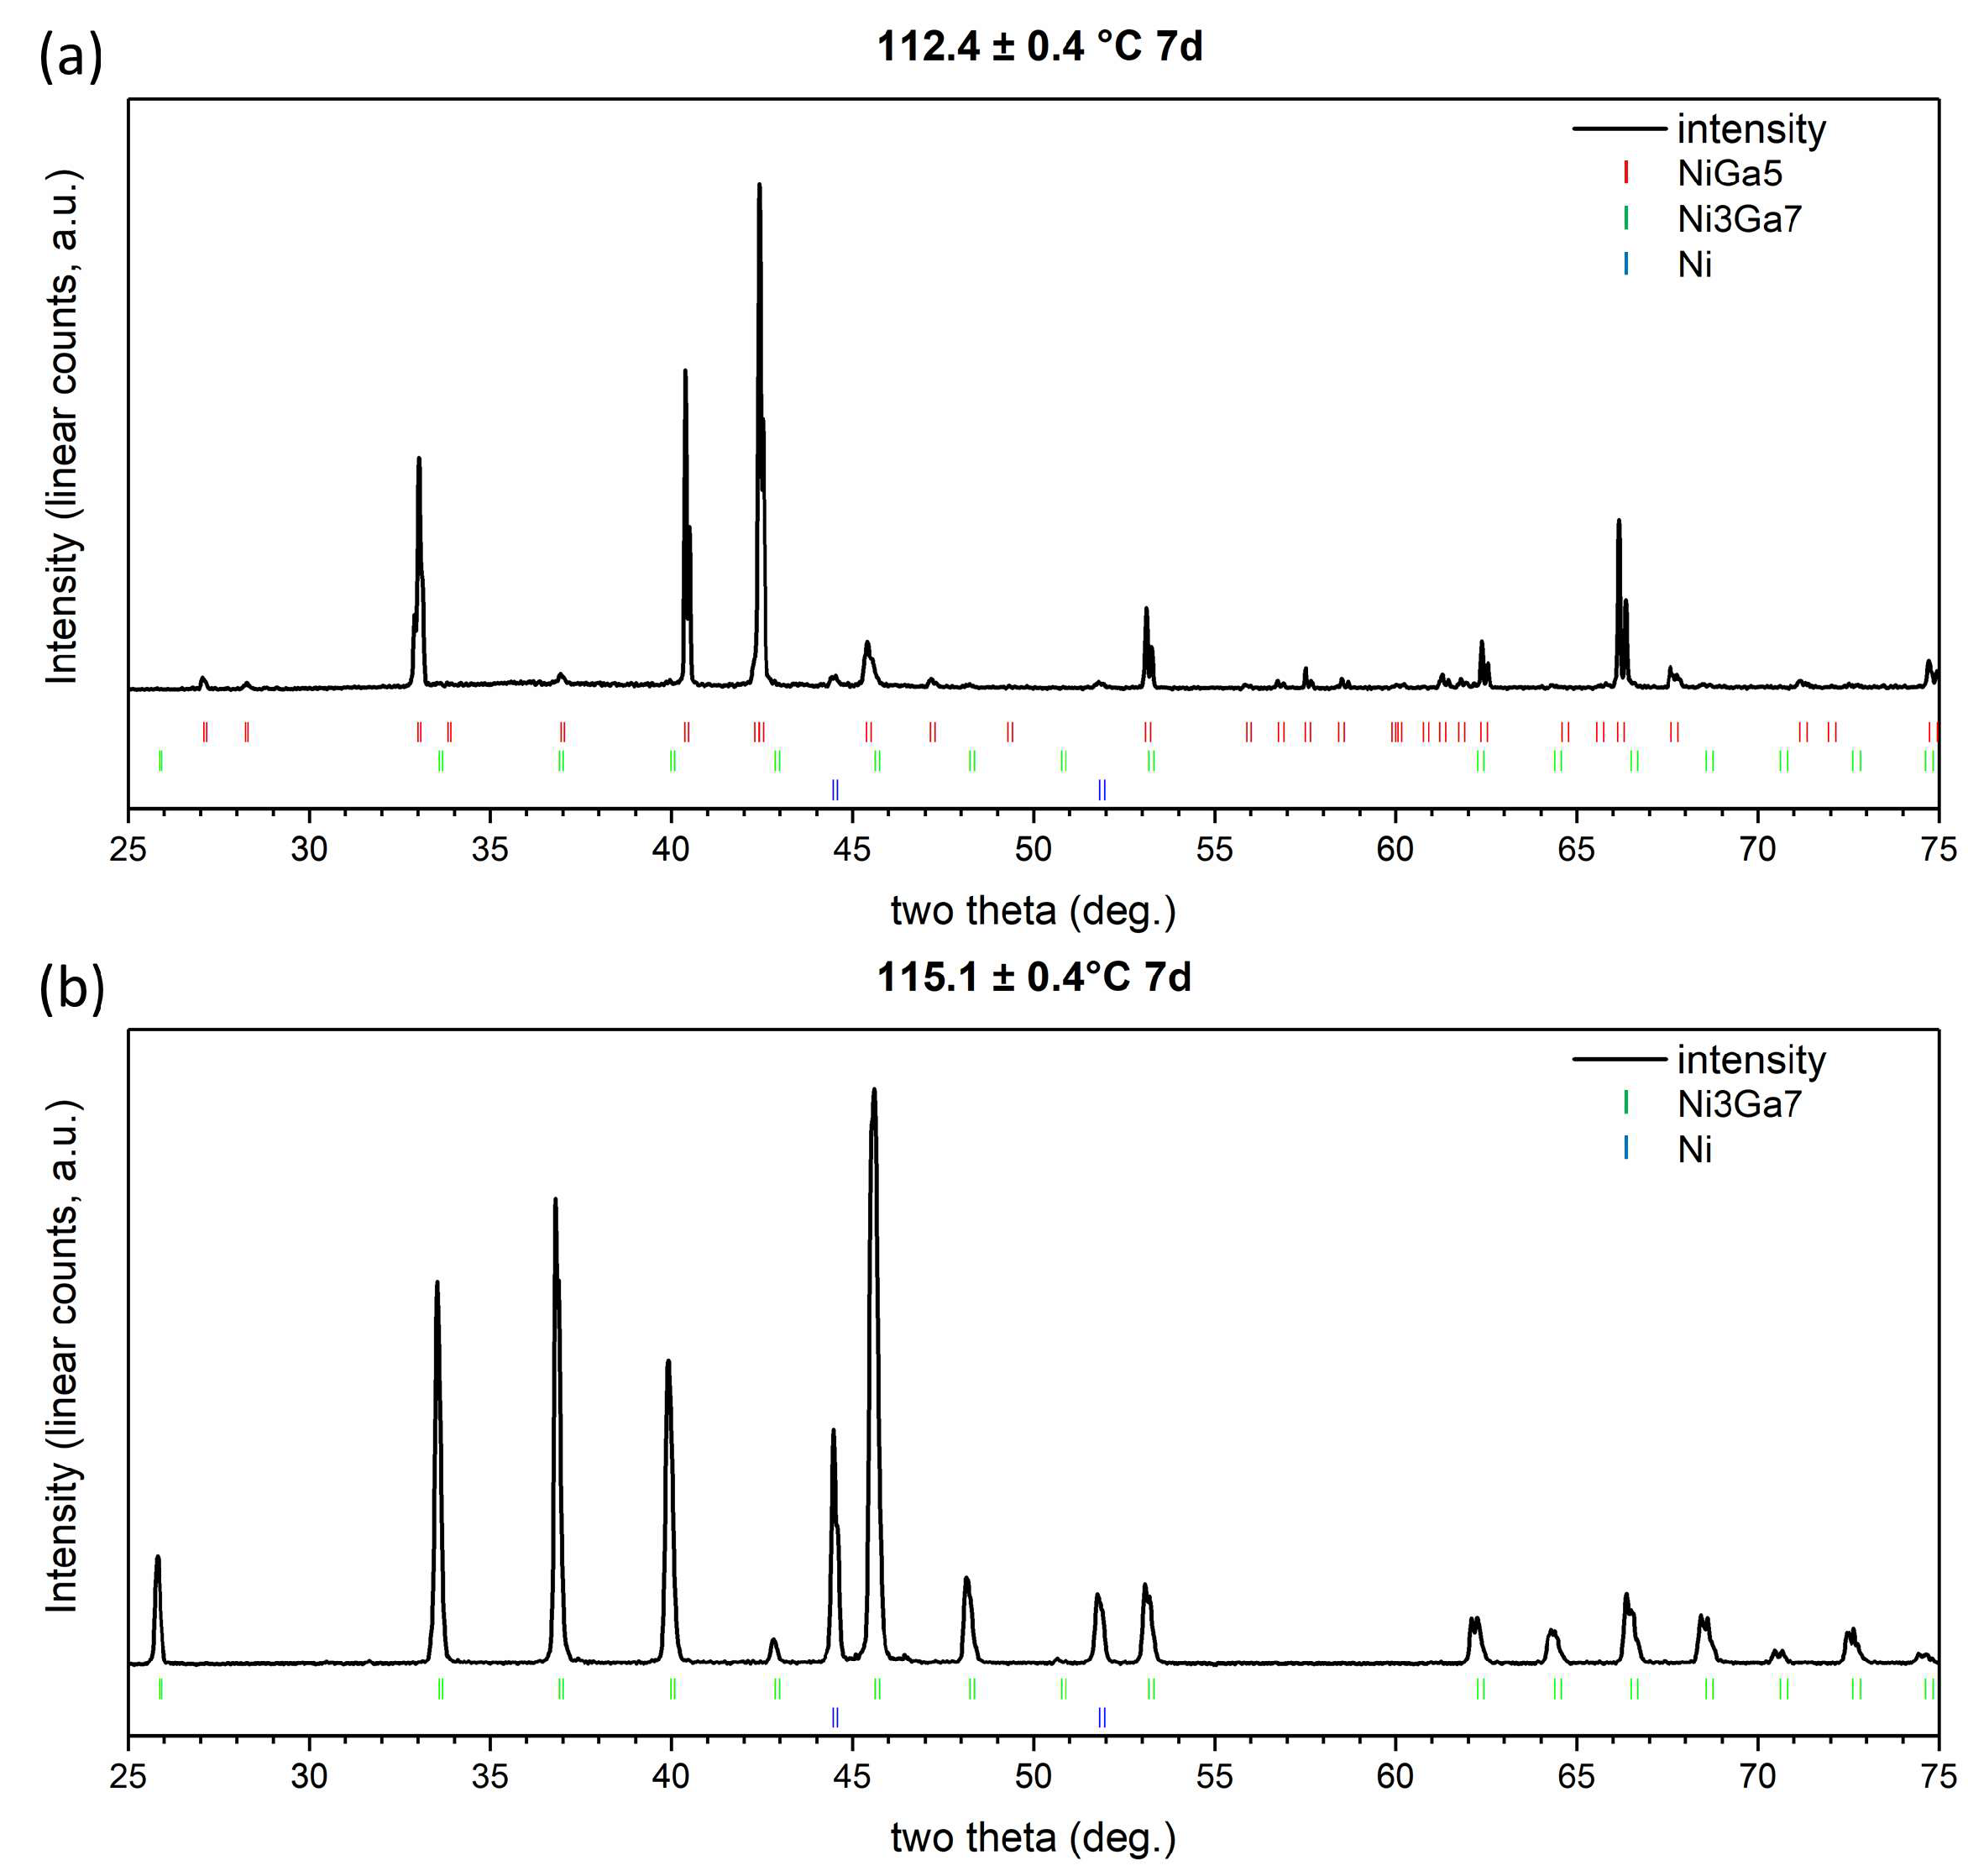
To identify the species of the IMCs formed in the interdiffusion zone, the experimentally obtained XRD patterns were compared with the theoretical diffraction patterns of possibly formed phases and the substrate. Crystal structure data (Table 1) of Ni3Ga7 [17], NiGa5 [14], and Ni [18] were input into VESTA software (Ver. 3.5.7) [19] to simulate the theoretical PXRD peak positions. The incident wavelengths were set as 0.154059 nm (Cu Kα1) and 0.154432 nm (Cu Kα2). Then, the simulated reflection positions were stacked at the bottom of the experimental patterns, as shown in Figure 2. For specimens isothermally annealed at 110.1 and 112.4 °C (Figure 2a), reflections of the NiGa5 phase can be identified. In contrast, the NiGa5 phase is absent in specimens isothermally annealed at 115.1 (Figure 2b) and 117.4 °C. The result suggests that the peritectic reaction exists in the binary system and, considering the temperature stability of the heating facility, the temperature of the invariant reaction is in between 112.0 and 115.5 °C.
Clemens Schmetterer et al. [14] conducted a non-ambient XRD experiment on a mixture containing the NiGa5 phase along with other binary Ni-Ga phases. They reported that the intensity of the phase decreased from 100 to 108 °C and disappeared at 125 °C; hence, the peritectic temperature was anticipated to lie between 100 and 108 °C. The present study used the diffusion couple techniques and obtained a more precise temperature range of the peritectic reaction.
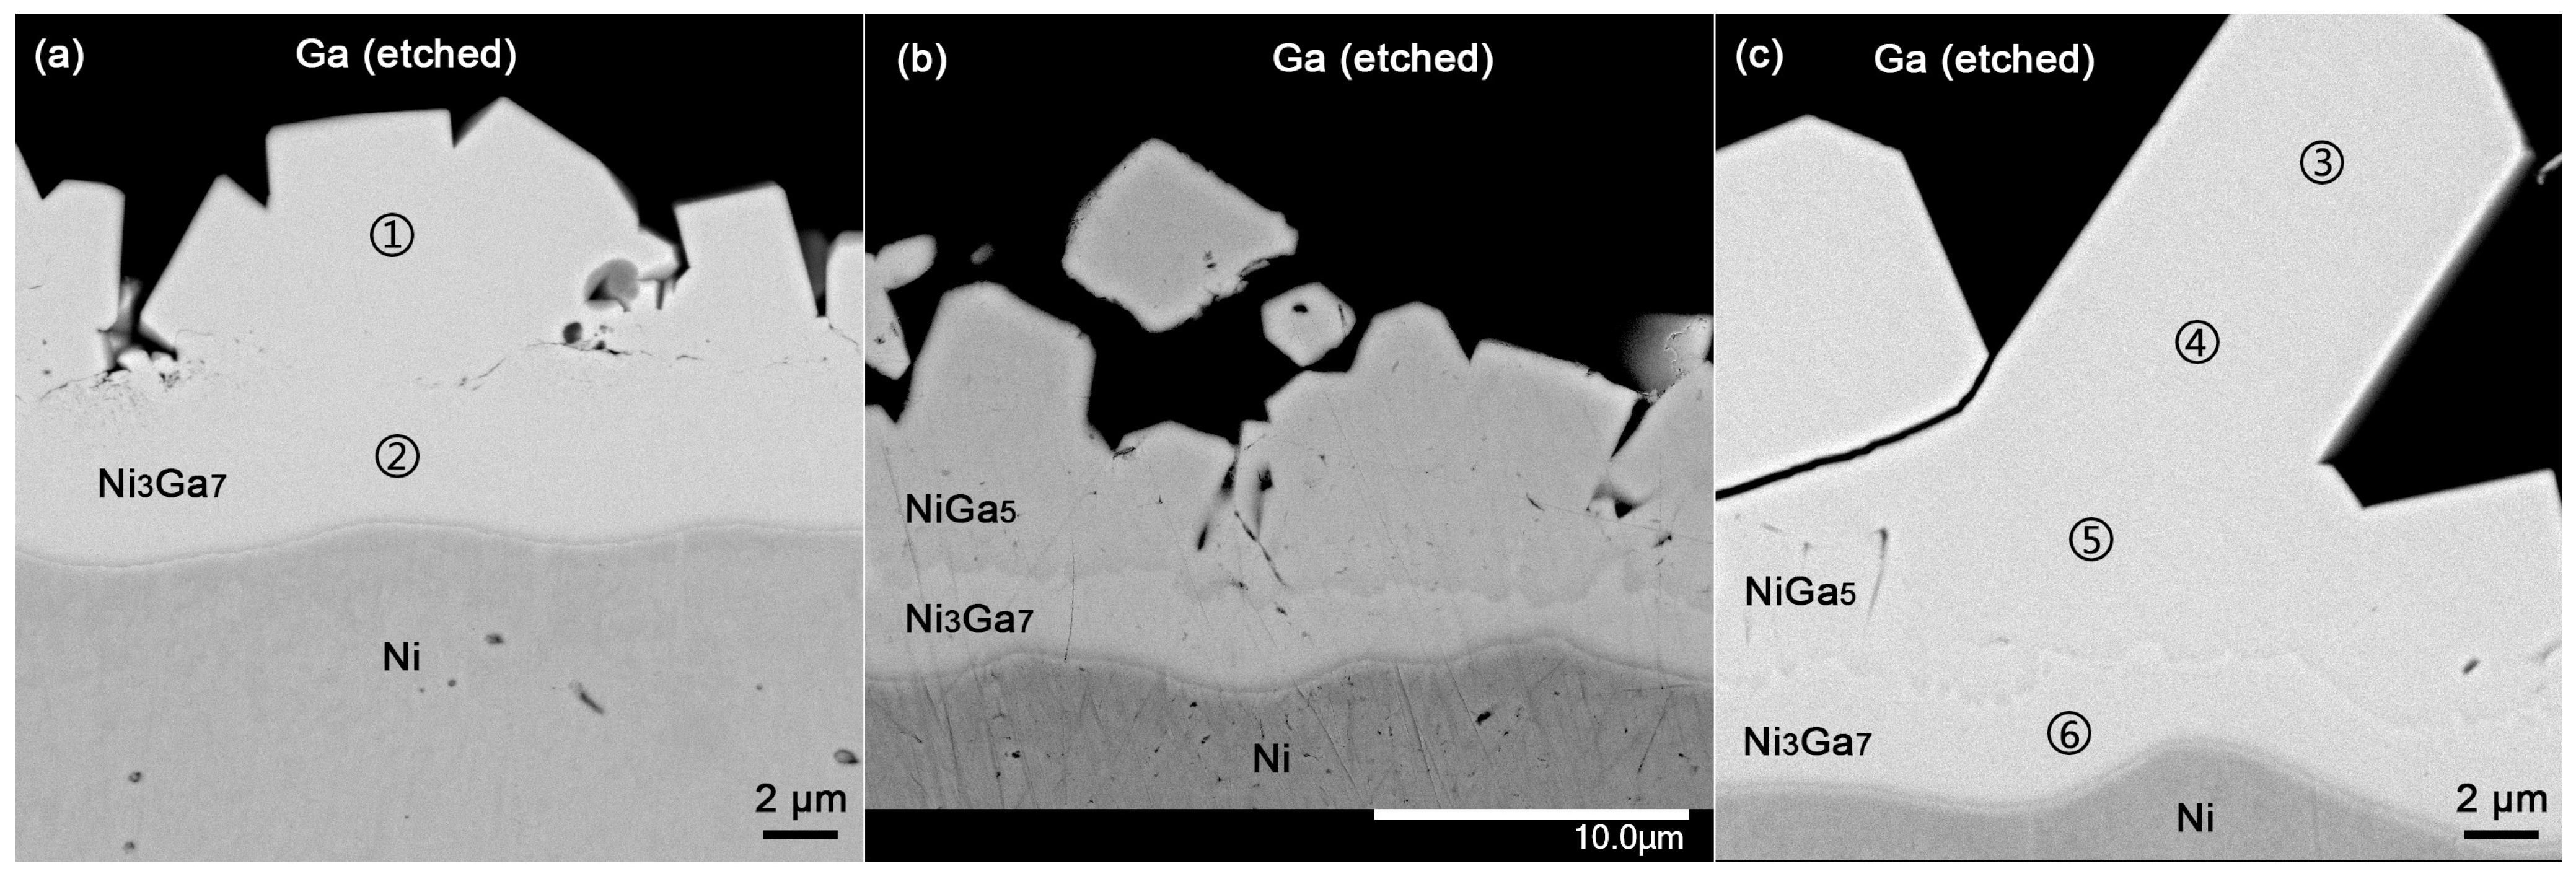
In order to double-confirm the grown phases metallographically and perform microarea composition analysis on each phase, the cross-sections of the diffusion couples were prepared and shown in Figure 3a–c. The NiGa5 phase was absent in the diffusion couple annealed at 115.1 °C and was present in the diffusion couple annealed at 112.4 °C, which is consistent with the XRD results. The interphase boundaries are shown by a light line adjacent to a dark line in the SEM images due to the edge effect. EPMA point analysis was conducted at the indicated positions and is summarized in Table 2. The composition gradient of the NiGa5 phase along the interdiffusion direction was small, suggesting a narrow homogeneity range of this phase above 100 °C. It is noticed that the measured compositions of NiGa5 and Ni3Ga7 are slightly more Ni-rich than the stoichiometry. This is because the K-line X-rays of Ga-excited Ni atoms of neighboring phases contain more Ni, causing additional boundary fluorescence of Ni K lines. This manifests in the fact that the harvested intensity and the un-normalized total weight percent increase as the site of point analysis approaches the Ni substrate. Therefore, it is believed that the IMCs are of stoichiometric compositions and that the measured off-stoichiometric compositions are due to the parasitic boundary fluorescence.
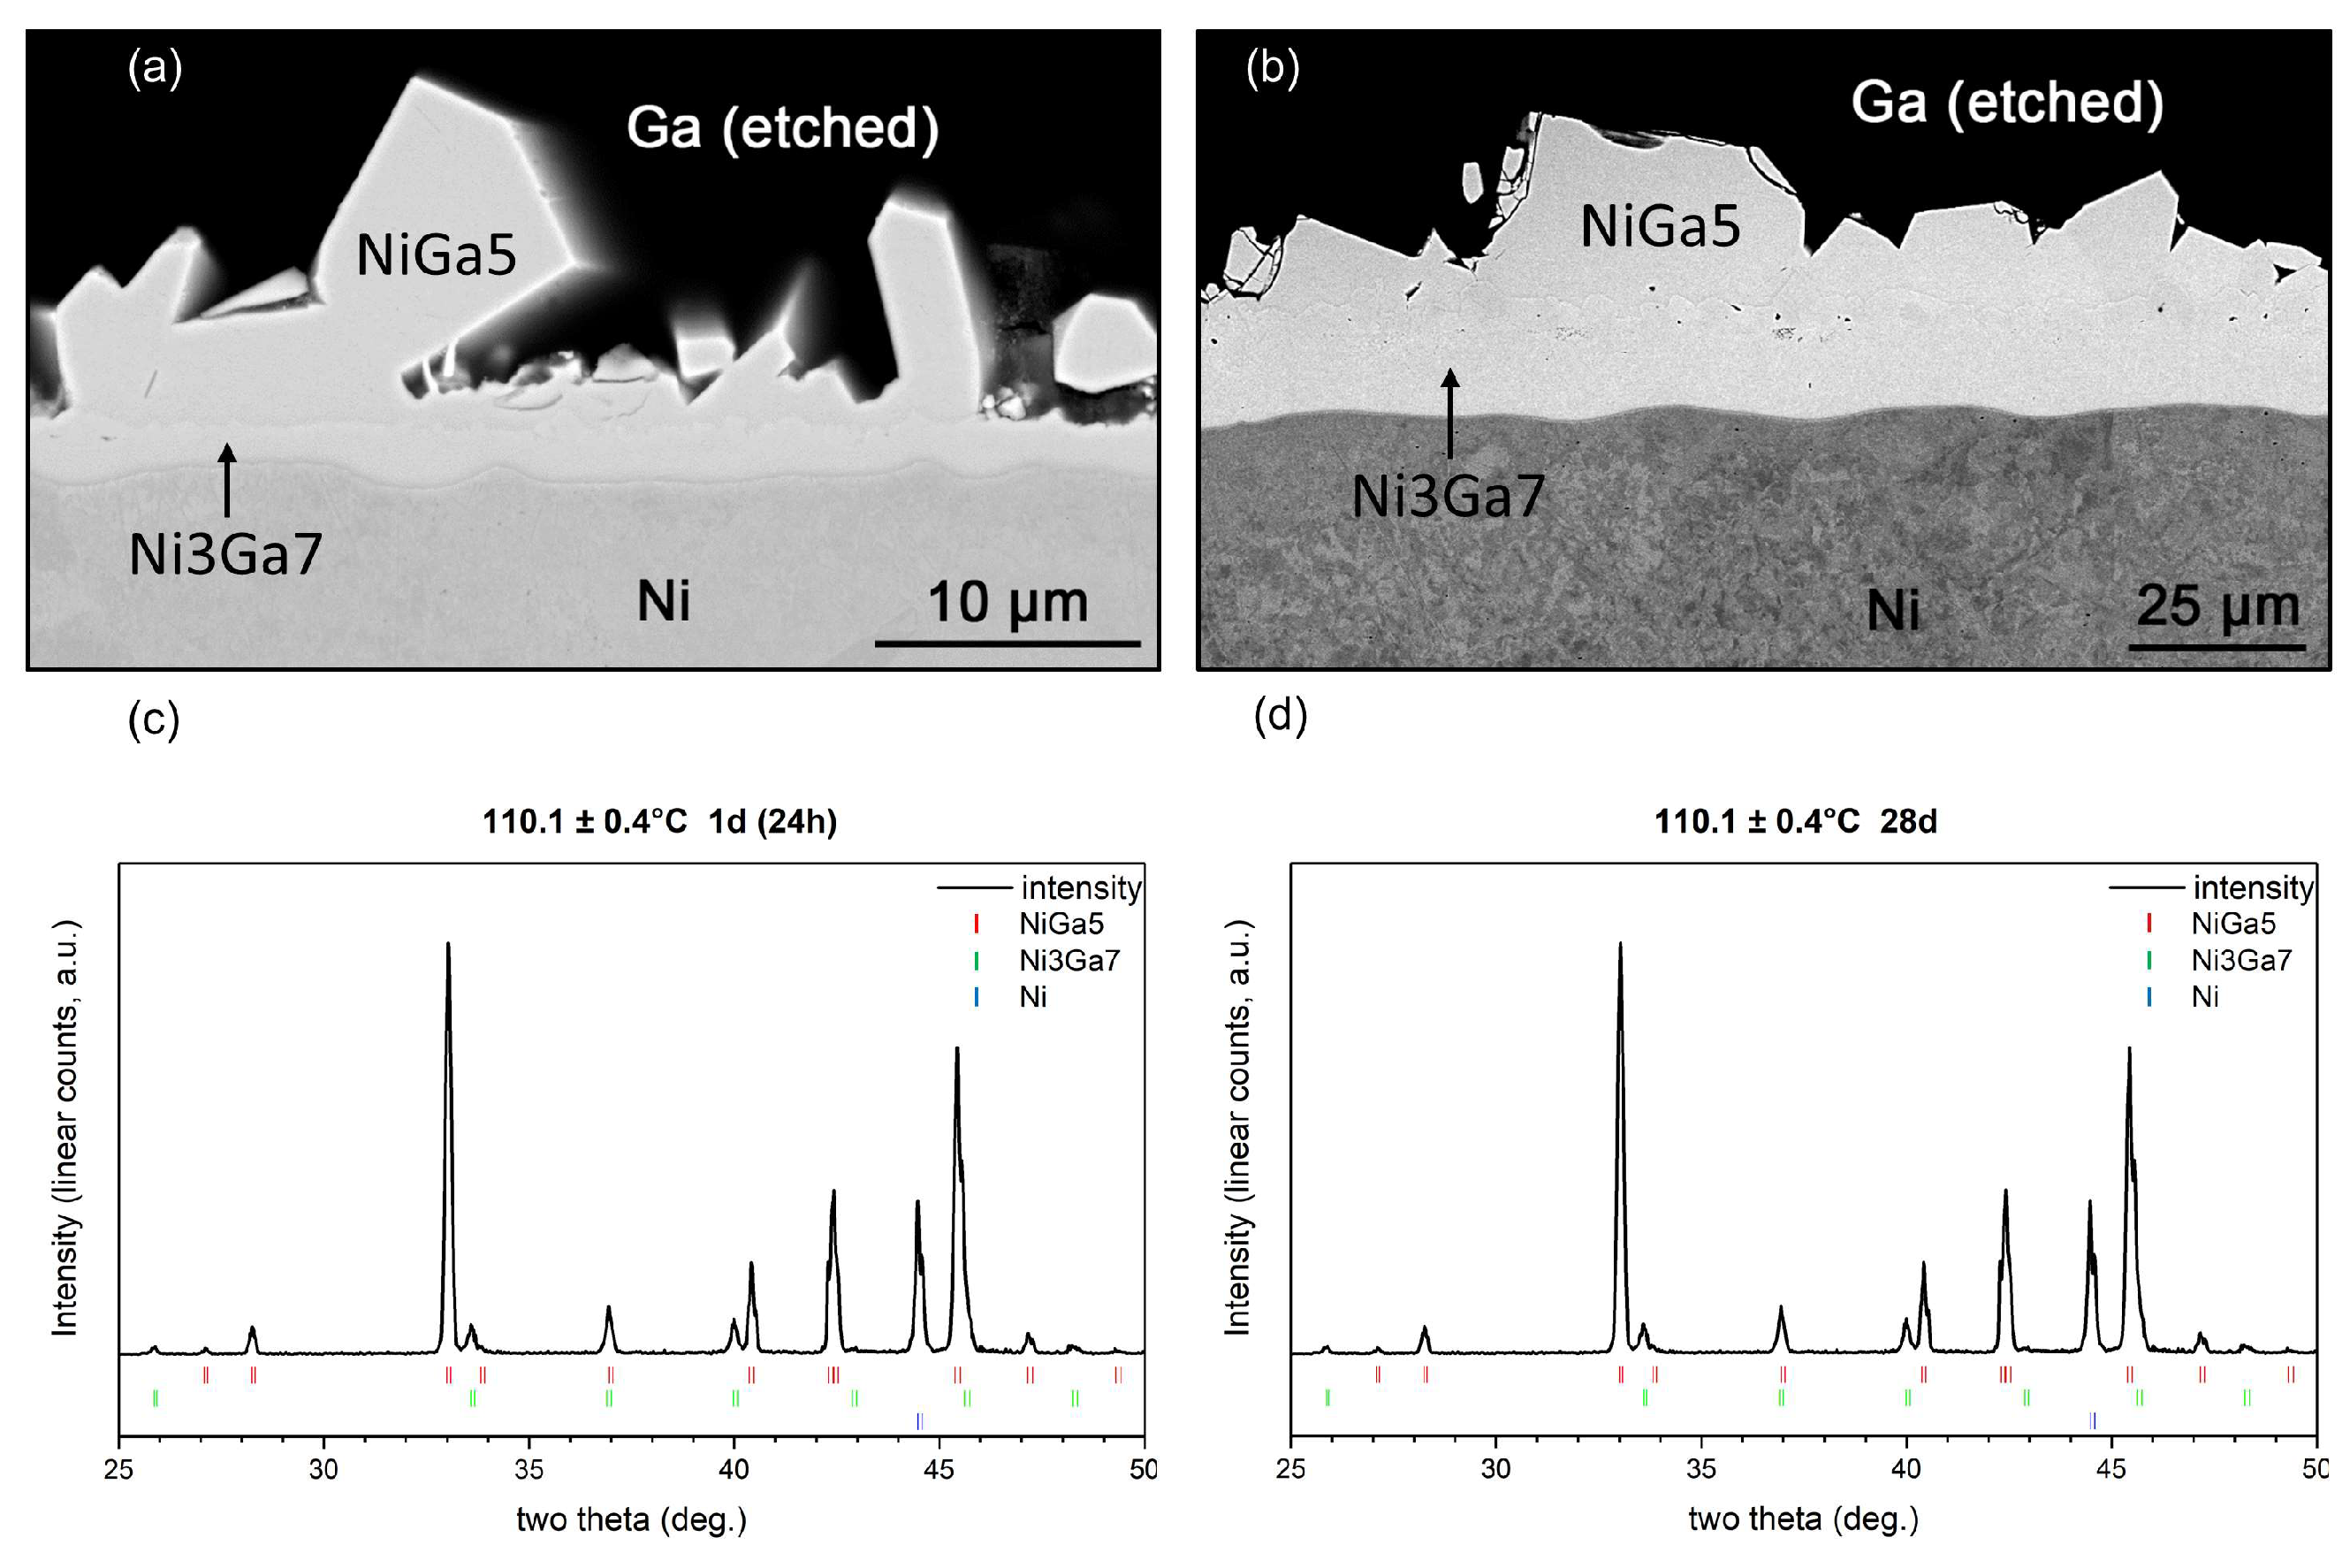
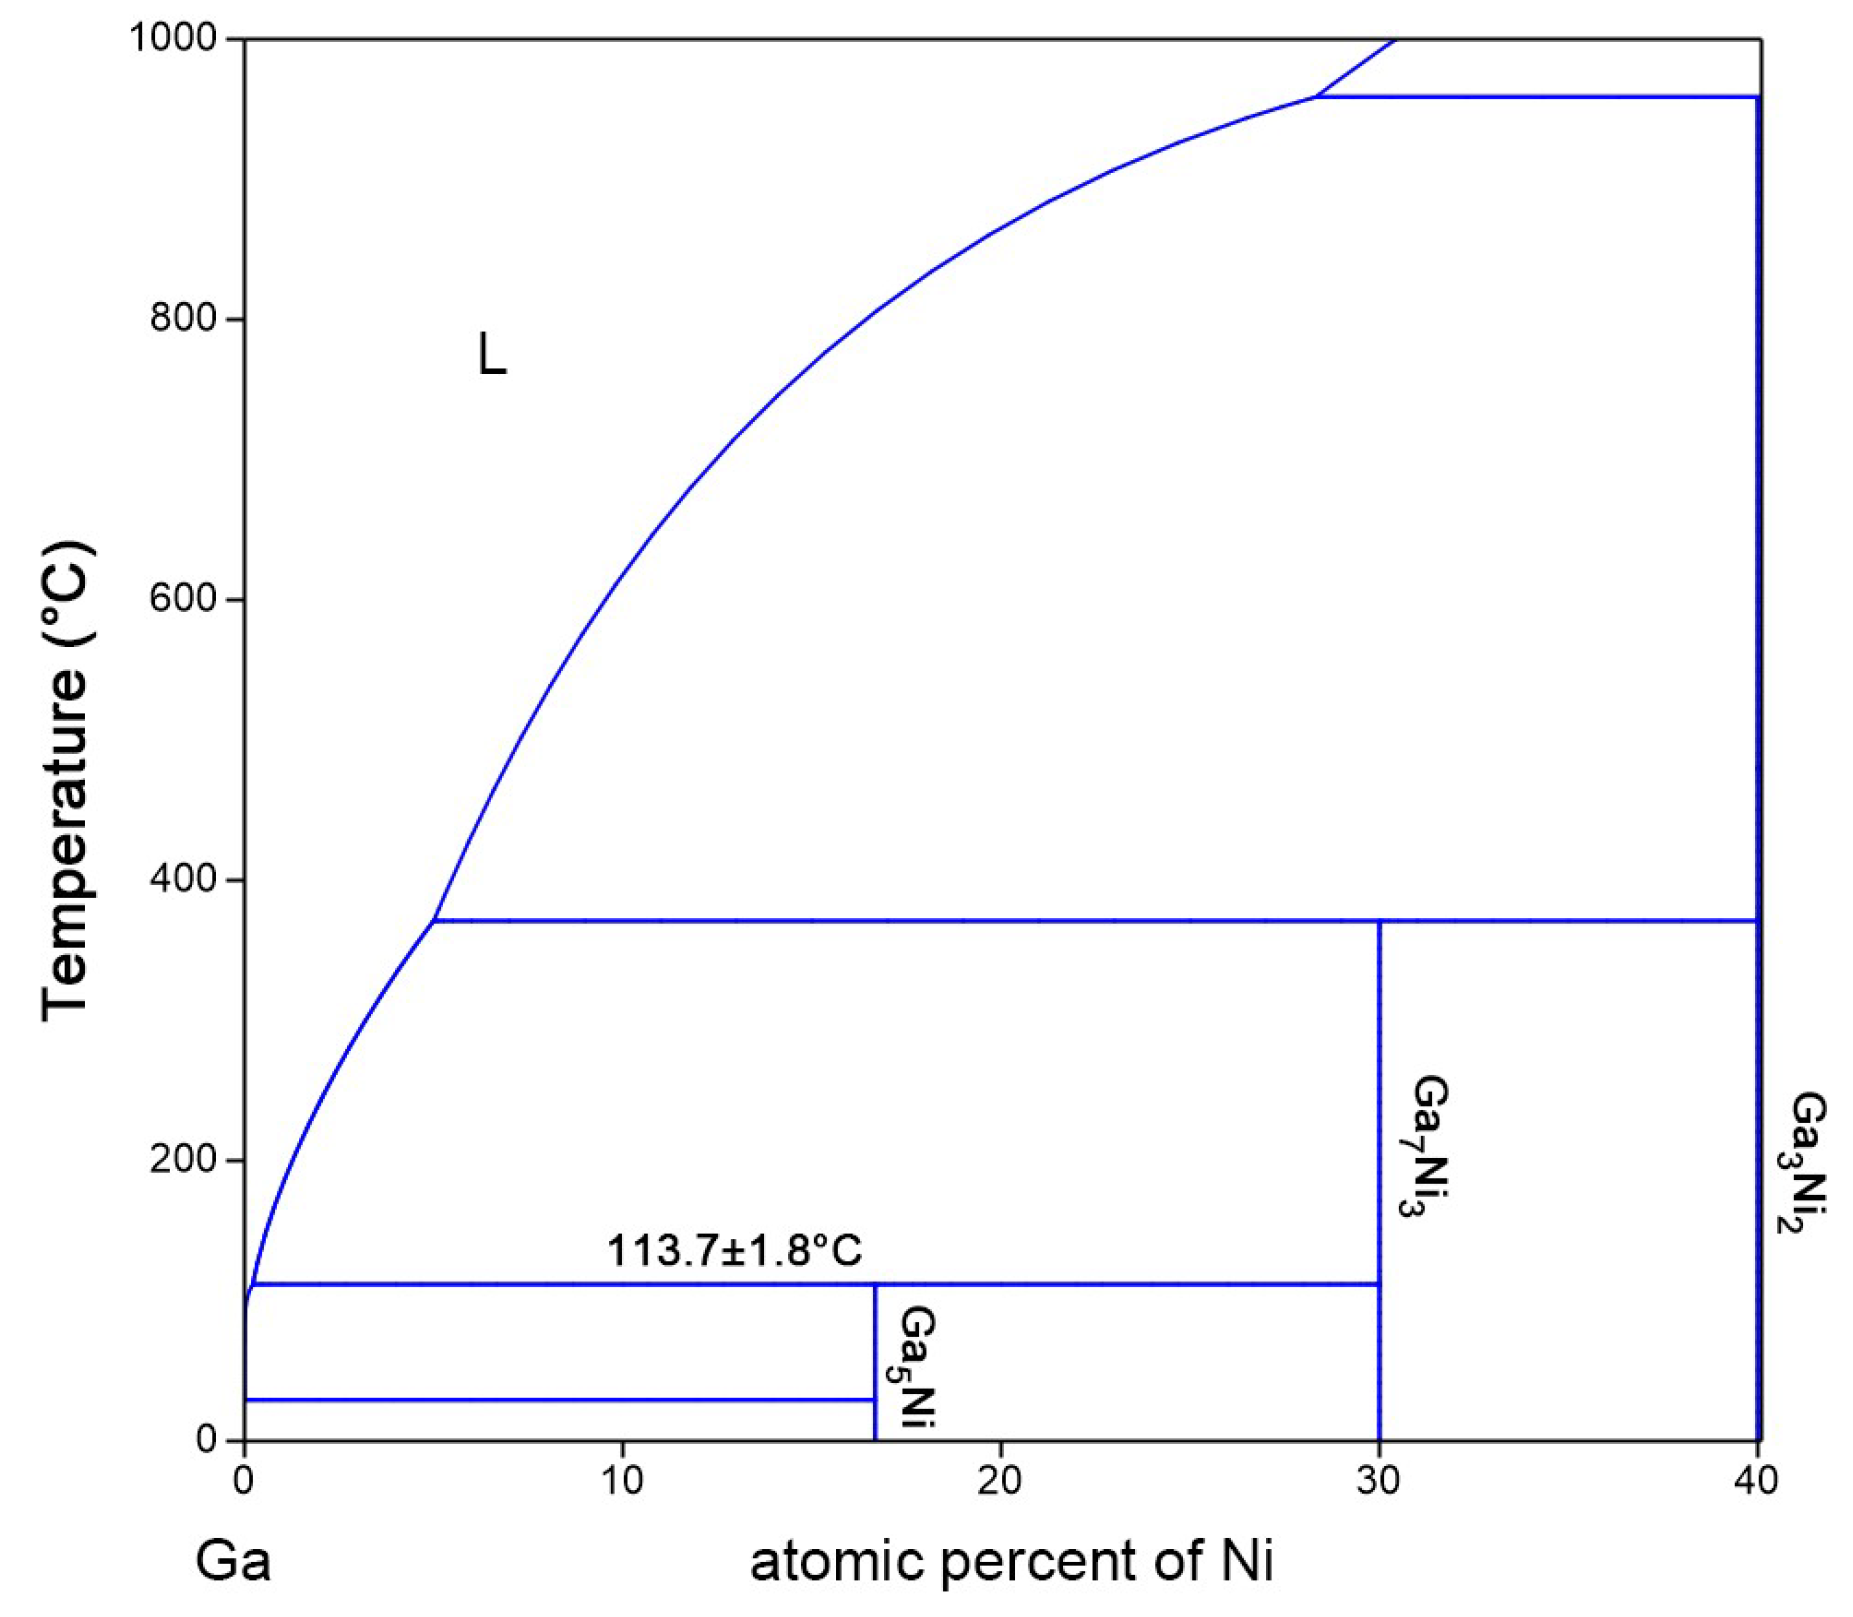
To determine the metastability of the NiGa5 phase, additional diffusion couples were prepared at 110.1 °C for 1 day and 28 days. Both diffusion couples showed two IMCs in the microstructure; one was NiGa5 (83.4 0.8 at% Ga) and the other was Ni3Ga7 (68.4 1.1 at% Ga), as indicated by multiple EDX point analysis. The XRD patterns also confirmed the species of the IMCs (Figure 4). Compared to the faceted NiGa5 layer of an average thickness of c.a. 2.6 um on the 1-day-annealed specimen, the NiGa5 layer on the 28-day-annealed specimen grew to an average thickness of 14.8 um as opposed to thickness decrease or decomposition. This fact signifies that NiGa5 is indeed a stable phase that does not decompose after prolonged heat treatment. Combined with the result of the product of the diffusion couples at different temperatures, it is suggested that the peritectic reaction be drawn in the binary equilibrium phase diagram, as demonstrated in Figure 5.
5. Conclusions
The Ga-rich low-T part of the Ni-Ga phase equilibrium has been investigated due to the lack of experimental literature regarding the NiGa5 phase. The homogeneity range of the NiGa5 phase, its peritectic temperature, and the evidence of its stability have been given. In addition, the present work demonstrated the usefulness of the diffusion couple technique in constructing low-temperature part of phase diagrams, particularly when there is difficulty equilibrating an ingot quenched from the liquid state due to a low diffusion rate or a thick primary phase.
Author Contributions
Conceptualization, C.-C.B.C. and C.R.K.; methodology, C.-C.B.C.; validation, C.-C.B.C.; formal analysis, C.-C.B.C.; investigation, C.-C.B.C.; resources, C.R.K.; data curation, C.-C.B.C.; writing—original draft preparation, C.-C.B.C.; writing—review and editing, C.-C.B.C. and C.R.K.; visualization, C.-C.B.C.; supervision, C.R.K.; project administration, C.R.K.; funding acquisition, C.R.K. All authors have read and agreed to the published version of the manuscript.
Funding
This research was financially supported by National Science and Technology Council (Taiwan, ROC) through Grant NSTC 111-2634-F-002-016.
Institutional Review Board Statement
Not applicable.
Informed Consent Statement
Not applicable.
Data Availability Statement
Data available upon reasonable request.
Conflicts of Interest
All authors declare no conflicts of interest.
References
- Kim, S.; Oh, J.; Jeong, D.; Bae, J. Direct wiring of eutectic gallium–indium to a metal electrode for soft sensor systems. ACS Appl. Mater. Interfaces 2019, 11, 20557–20565. [Google Scholar] [CrossRef] [PubMed]
- Ozutemiz, K.B.; Wissman, J.; Ozdoganlar, O.B.; Majidi, C. EGaIn–metal interfacing for liquid metal circuitry and microelectronics integration. Adv. Mater. Interfaces 2018, 5, 1701596. [Google Scholar] [CrossRef]
- Ma, B.; Xu, C.; Chi, J.; Chen, J.; Zhao, C.; Liu, H. A versatile approach for direct patterning of liquid metal using magnetic field. Adv. Funct. Mater. 2019, 29, 1901370. [Google Scholar] [CrossRef]
- Liu, S.; Tan, X.F.; McDonald, S.D.; Gu, Q.; Matsumura, S.; Nogita, K. Interfacial reactions between Ga and Cu-xNi (x = 0, 2, 6, 10, 14) substrates and the strength of Cu-xNi/Ga/Cu-xNi joints. Intermetallics 2021, 133, 107168. [Google Scholar] [CrossRef]
- Liu, S.; Zeng, G.; Yang, W.; McDonald, S.; Gu, Q.; Matsumura, S.; Nogita, K. Interfacial reactions between Ga and Cu-10Ni substrate at low temperature. ACS Appl. Mater. Interfaces 2020, 12, 21045–21056. [Google Scholar] [CrossRef] [PubMed]
- Lin, S.-k.; Yeh, C.-y.; Wang, M.-j. On the formation mechanism of solid-solution Cu-to-Cu joints in the Cu/Ni/Ga/Ni/Cu system. Mater. Charact. 2018, 137, 14–23. [Google Scholar] [CrossRef]
- Liu, N.-S.; Lin, K.-L. The effect of Ga content on the wetting reaction and interfacial morphology formed between Sn–8.55 Zn–0.5 Ag–0.1 Al–xGa solders and Cu. Scr. Mater. 2006, 54, 219–224. [Google Scholar] [CrossRef]
- Lin, S.-k.; Nguyen, T.L.; Wu, S.-c.; Wang, Y.-h. Effective suppression of interfacial intermetallic compound growth between Sn–58 wt.% Bi solders and Cu substrates by minor Ga addition. J. Alloys Compd. 2014, 586, 319–327. [Google Scholar] [CrossRef]
- Wang, C.-H.; Li, K.-T. Effects of Ga Addition on Interfacial Reactions Between Sn-Based Solders and Ni. J. Electron. Mater. 2016, 45, 6200–6207. [Google Scholar] [CrossRef]
- Barbier, F.; Blanc, J. Corrosion of martensitic and austenitic steels in liquid gallium. J. Mater. Res. 1999, 14, 737–744. [Google Scholar] [CrossRef]
- Gancarz, T.; Berent, K.; Schell, N.; Chulist, R. Interfacial phenomena between liquid Ga-based alloys and Ni substrate. J. Electron. Mater. 2019, 48, 5941–5947. [Google Scholar] [CrossRef]
- Dobosz, A.; Berent, K.; Bigos, A.; Gancarz, T. Interfacial phenomena between liquid alloy and Ni substrate covered by Ni–W layer. Mater. Lett. 2020, 277, 128299. [Google Scholar] [CrossRef]
- Kelman, L.R.; Wilkinson, W.D.; Yaggee, F.L. Resistance of Materials to Attack by Liquid Metals; Argonne National Lab. (ANL): Argonne, IL, USA, 1950. [Google Scholar] [CrossRef]
- Schmetterer, C.; Flandorfer, H.; Lengauer, C.L.; Bros, J.-P.; Ipser, H. The system Ga–Ni: A new investigation of the Ga-rich part. Intermetallics 2010, 18, 277–285. [Google Scholar] [CrossRef]
- Yamazaki, T.; Terayama, K.; Shimazaki, T.; Sugimoto, K. Mechanical alloying between Ni powder and liquid Ga. J. Mater. Sci. Lett. 1997, 16, 1357–1359. [Google Scholar] [CrossRef]
- Lee, D.; Kim, C.-L.; Sohn, Y. Formation and Growth of Intermetallic Compounds during Reactions between Liquid Gallium and Solid Nickel. Materials 2021, 14, 5694. [Google Scholar] [CrossRef] [PubMed]
- Häussermann, U.; Elding-Pontén, M.; Svensson, C.; Lidin, S. Compounds with the Ir3Ge7 structure type: Interpenetrating frameworks with flexible Bonding Properties. Chem.–A Eur. J. 1998, 4, 1007–1015. [Google Scholar] [CrossRef]
- Palenzona, A.; Cirafici, S. The ytterbium-nickel system. J. Less Common Met. 1973, 33, 361–367. [Google Scholar] [CrossRef]
- Momma, K.; Izumi, F. VESTA 3 for three-dimensional visualization of crystal, volumetric and morphology data. J. Appl. Crystallogr. 2011, 44, 1272–1276. [Google Scholar] [CrossRef]
Figure 1.
The flow chart of the sample preparation.

Figure 2.
XRD pattern of diffusion couples annealed at (a) 112.4 and (b) 115.1 °C.

Figure 3.
Micrographs of couples with positions of EPMA point analysis indicated: (a) annealed at 115.1 °C for 7 days; (b) annealed at 112.4 °C for 7 days; (c) annealed at 100.1 °C for 7 days. The numbers in the figures indicate the position of EPMA point analysis, and the corresponding results are presented in Table 2.

Figure 4.
Micrographs of couples annealed at 110.1 °C for (a) 24 h and (b) 28 d, and (c,d) the corresponding XRD patterns.
Figure 4.
Micrographs of couples annealed at 110.1 °C for (a) 24 h and (b) 28 d, and (c,d) the corresponding XRD patterns.

Figure 5.
The proposed phase diagram with the addition of the Ga5Ni phase. The uncertainty of the peritectic temperature is from the temperature stability of the silicon oil bath and the temperature difference of heat treatment performed on the diffusion couples. L denotes liquid.
Figure 5.
The proposed phase diagram with the addition of the Ga5Ni phase. The uncertainty of the peritectic temperature is from the temperature stability of the silicon oil bath and the temperature difference of heat treatment performed on the diffusion couples. L denotes liquid.


Table 1.
Selected crystallographic information of the chosen structure for each phase.
| Phase | Space Group | Lattice Constants (Å) | Reference |
|---|---|---|---|
| NiGa5 | I4/mcm | a = 6.3128, c = 9.7217 | [14] |
| Ni3Ga7 | Im3m | a = 8.4285 | [17] |
| Ni | Fm-3m | a = 3.525 | [18] |
Table 2.
EPMA point analysis result of positions indicated in Figure 3.
Table 2.
EPMA point analysis result of positions indicated in Figure 3.
| Diffusion Couple | Site | Ga (at%) | Ni (at%) | Σ mass % | Phase |
|---|---|---|---|---|---|
| 115.1 ± 0.4 °C 7 d | ① | 69.5 | 30.5 | 99.0 | Ni3Ga7 |
| ② | 68.7 | 31.3 | 101.0 | Ni3Ga7 | |
| 100.1 ± 0.4 °C 7 d | ③ | 81.2 | 18.8 | 99.4 | NiGa5 |
| ④ | 81.1 | 18.9 | 99.6 | NiGa5 | |
| ⑤ | 81.0 | 19.0 | 101.6 | NiGa5 | |
| ⑥ | 69.6 | 30.4 | 101.4 | Ni3Ga7 |
Disclaimer/Publisher’s Note: The statements, opinions and data contained in all publications are solely those of the individual author(s) and contributor(s) and not of MDPI and/or the editor(s). MDPI and/or the editor(s) disclaim responsibility for any injury to people or property resulting from any ideas, methods, instructions or products referred to in the content. |
© 2024 by the authors. Licensee MDPI, Basel, Switzerland. This article is an open access article distributed under the terms and conditions of the Creative Commons Attribution (CC BY) license (https://creativecommons.org/licenses/by/4.0/).
Share and Cite
MDPI and ACS Style
Chang, C.-C.B.; Kao, C.R. Phase Equilibria Related to NiGa5 in the Binary Ni-Ga System. Materials 2024, 17, 883. https://doi.org/10.3390/ma17040883
AMA Style
Chang C-CB, Kao CR. Phase Equilibria Related to NiGa5 in the Binary Ni-Ga System. Materials. 2024; 17(4):883. https://doi.org/10.3390/ma17040883
Chicago/Turabian StyleChang, Chih-Chia Bill, and C. R. Kao. 2024. "Phase Equilibria Related to NiGa5 in the Binary Ni-Ga System" Materials 17, no. 4: 883. https://doi.org/10.3390/ma17040883
Note that from the first issue of 2016, this journal uses article numbers instead of page numbers. See further details here.