
Influence of Unit Water Content Control on Concrete Performance in the Ready-Mixed Concrete Production Process

Abstract
:1. Introduction
2. Experimental Design
2.1. Concrete Mix Proportion
2.2. Experimental Items
3. Results and Analysis
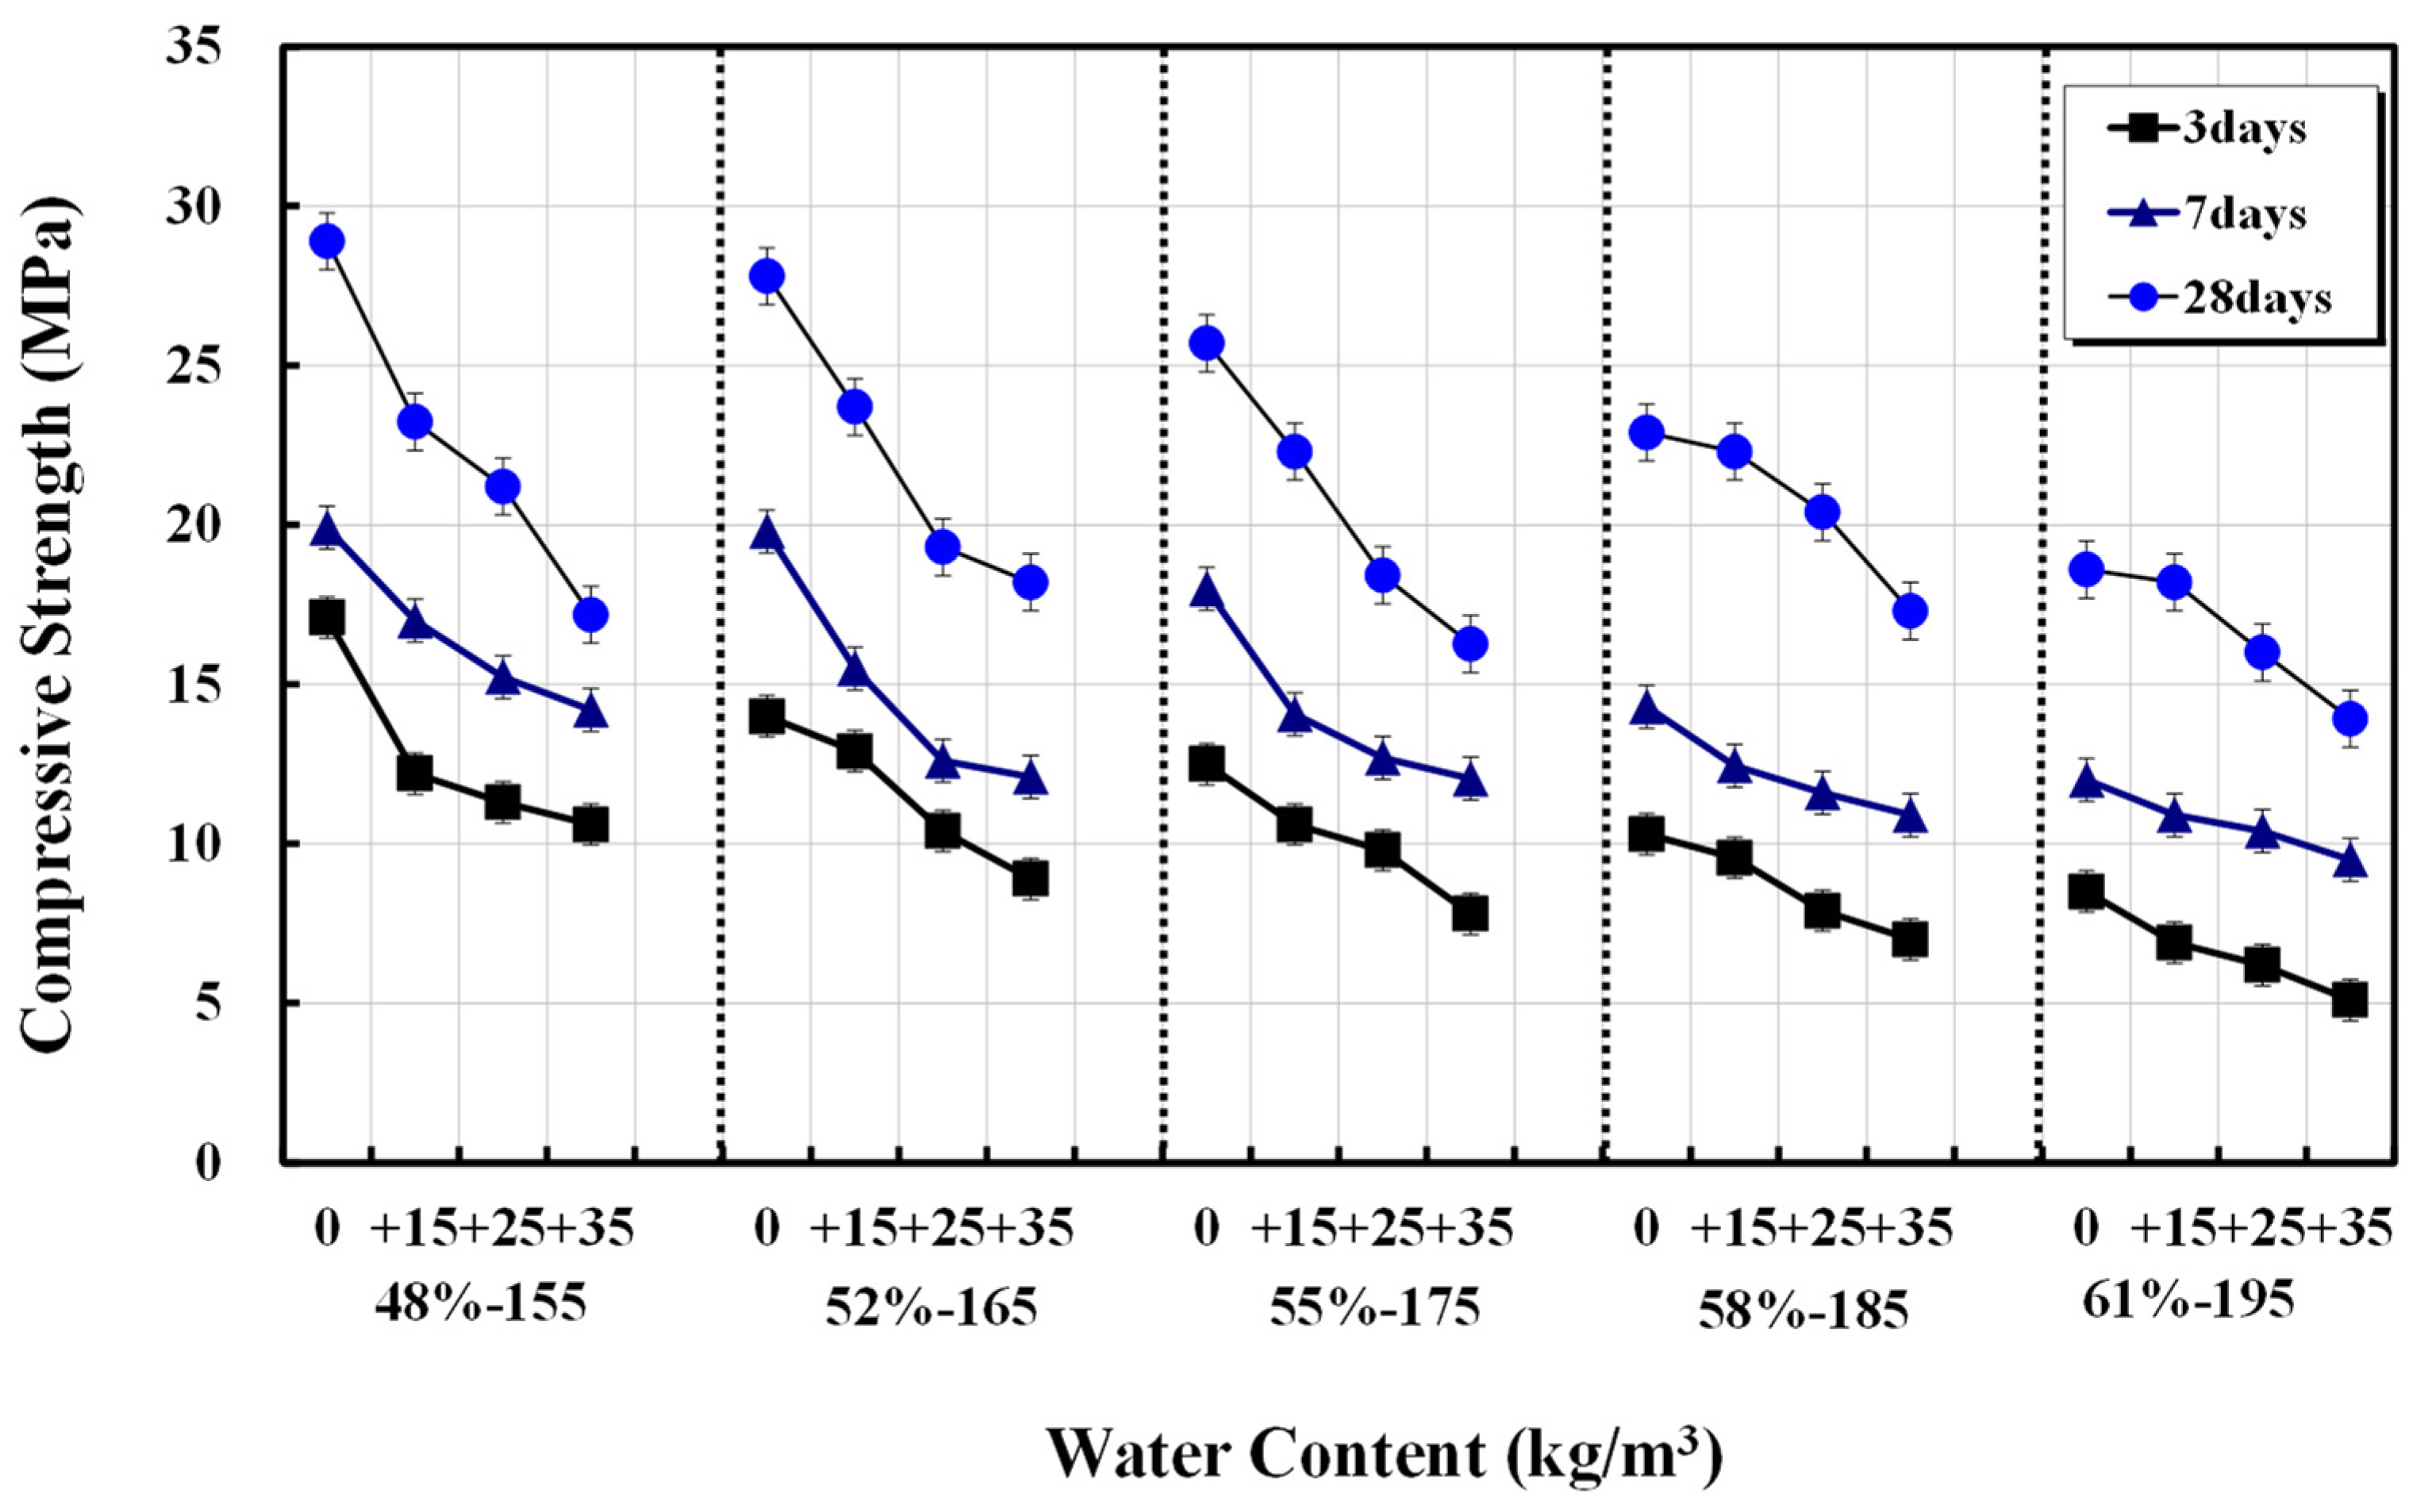
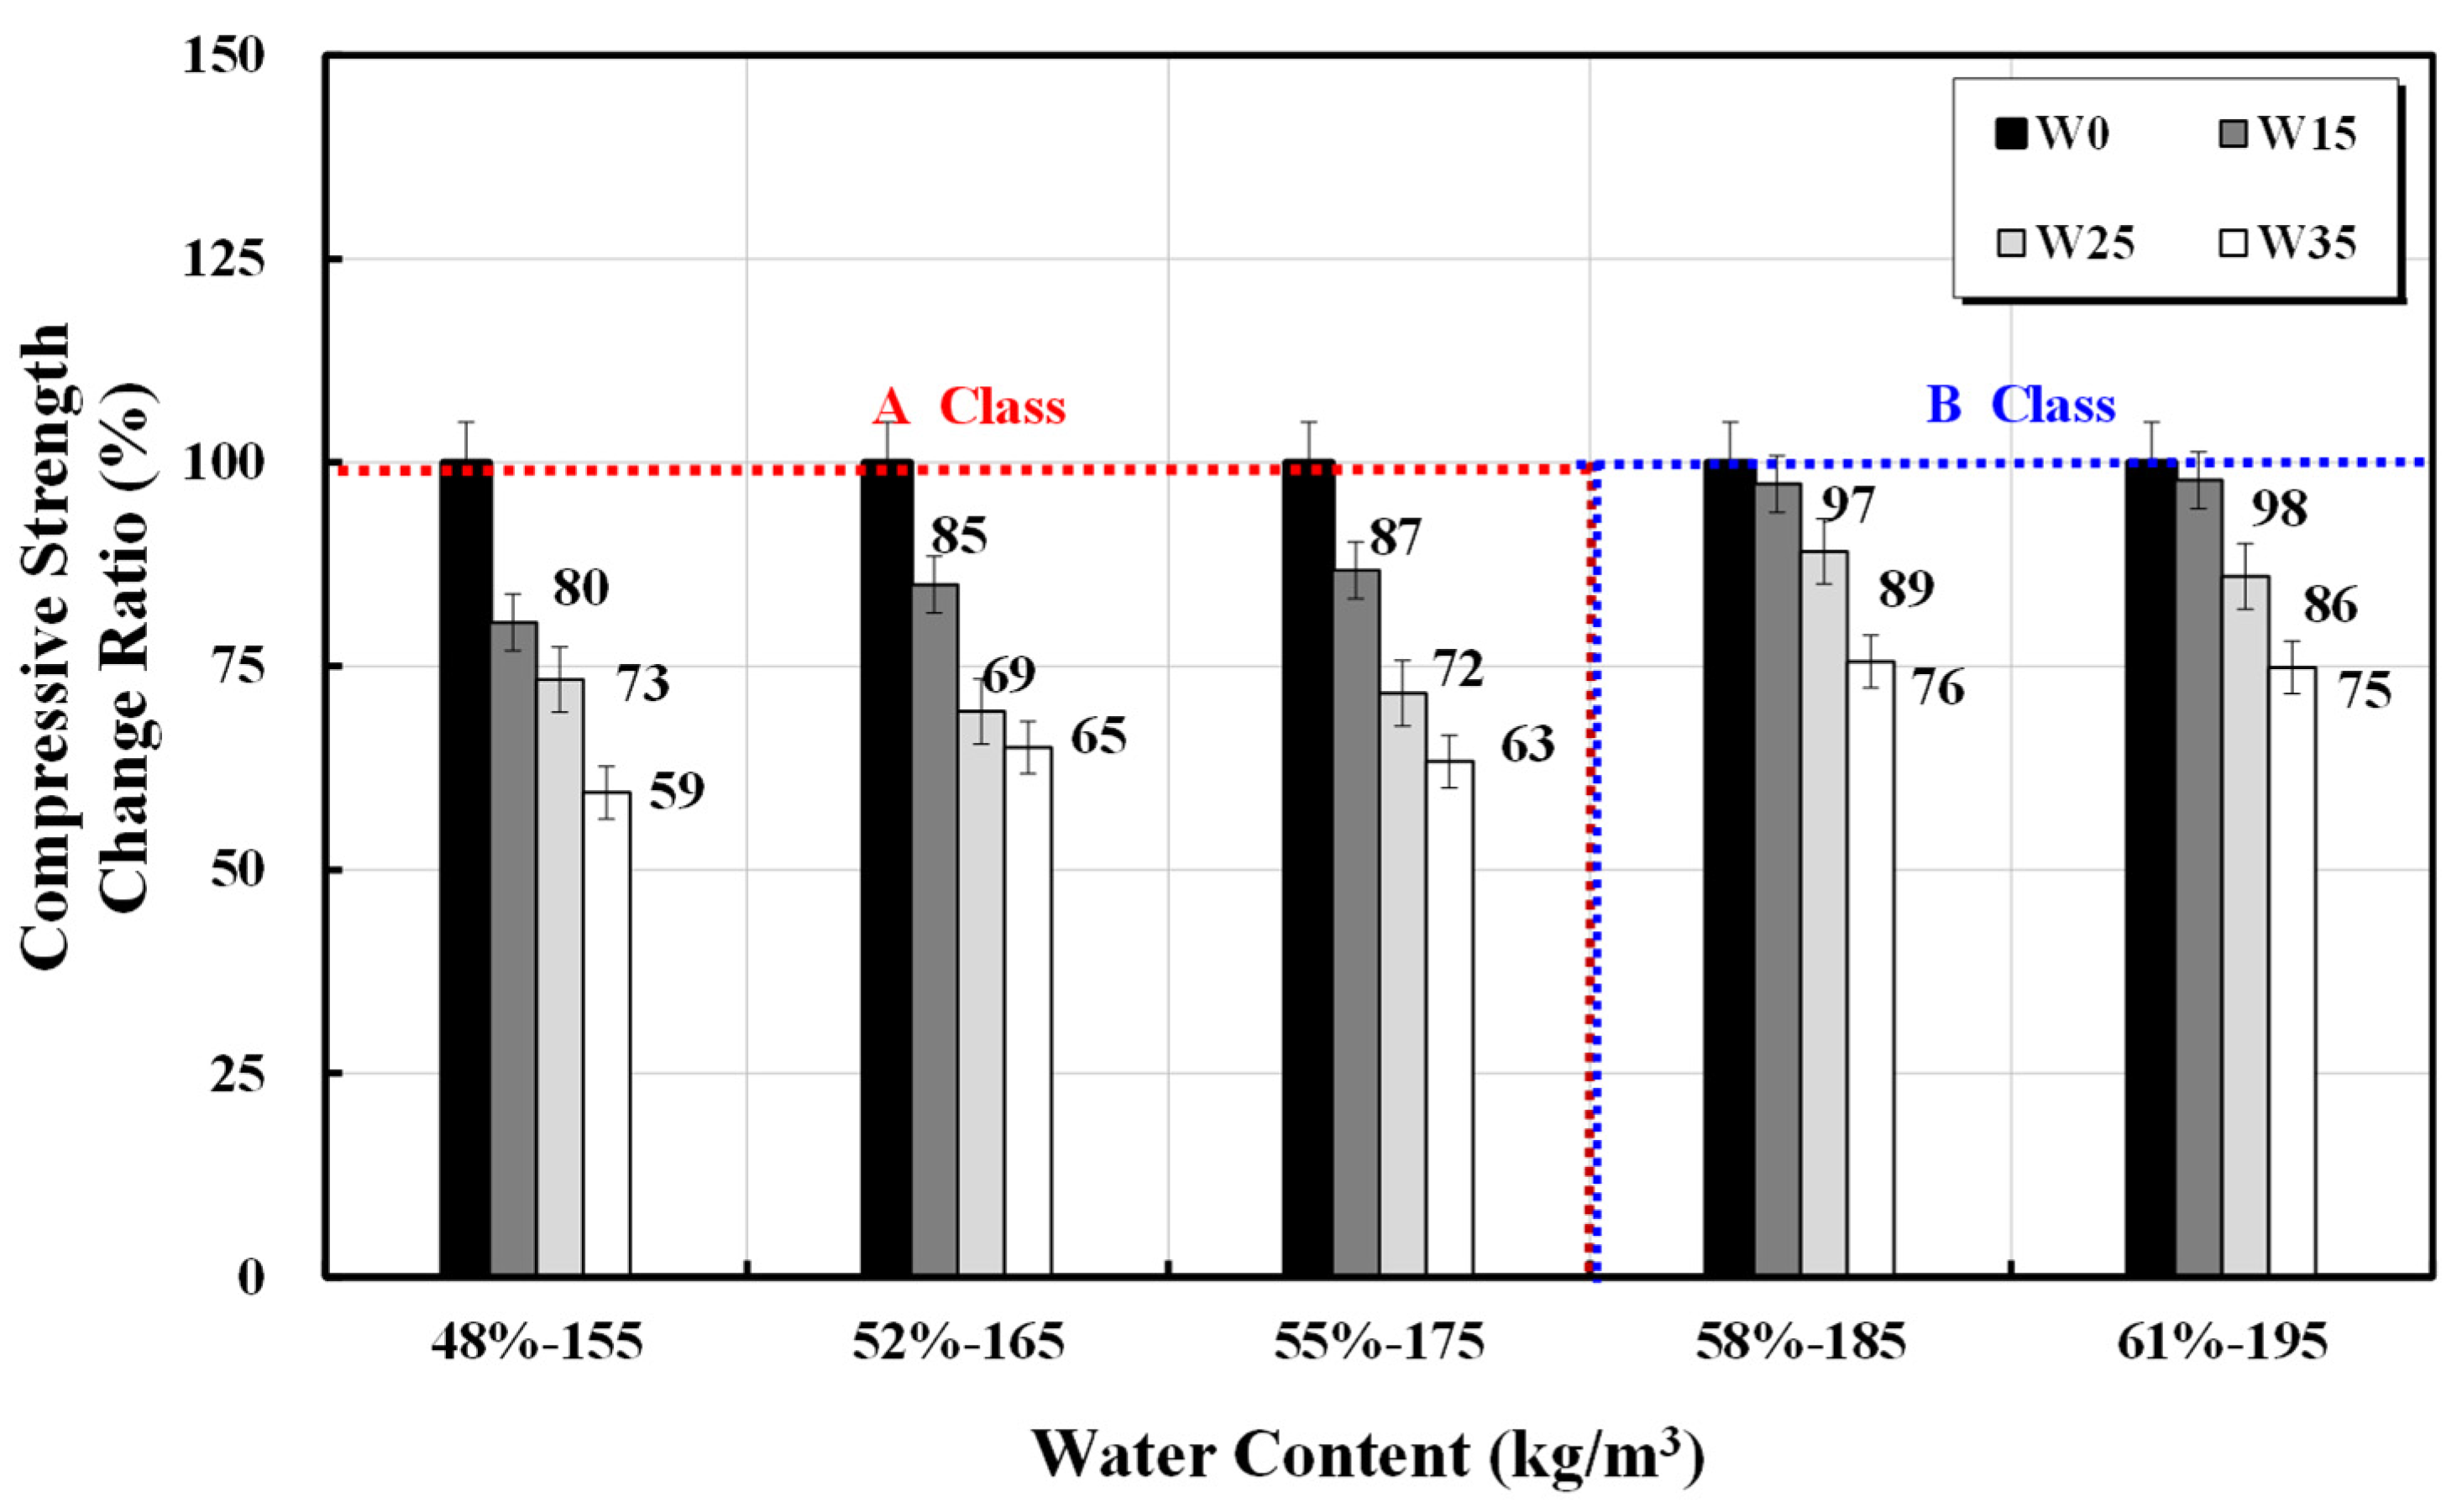
3.1. Compressive Strength
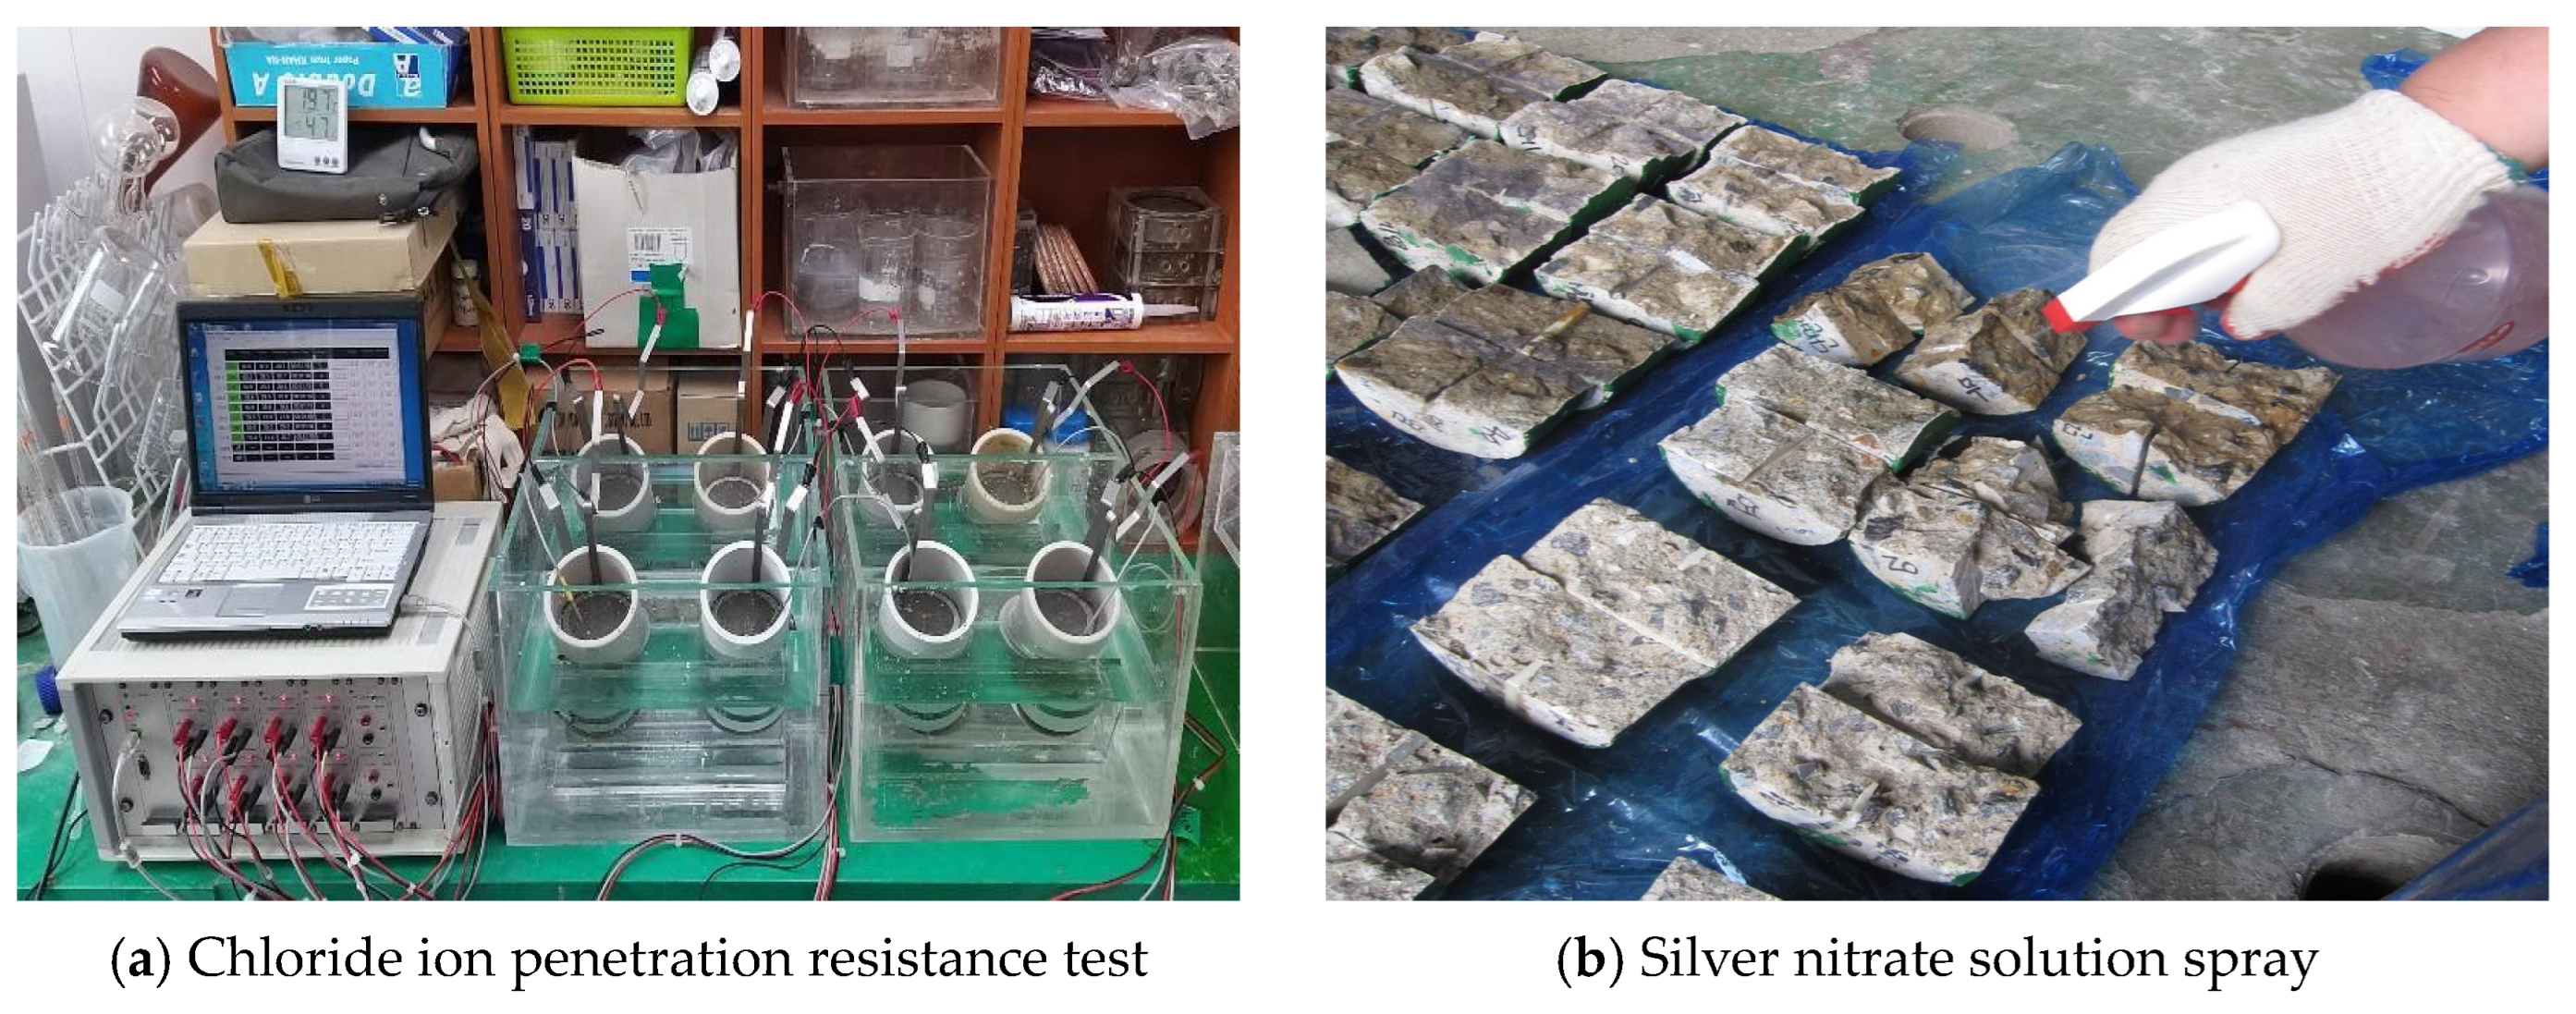
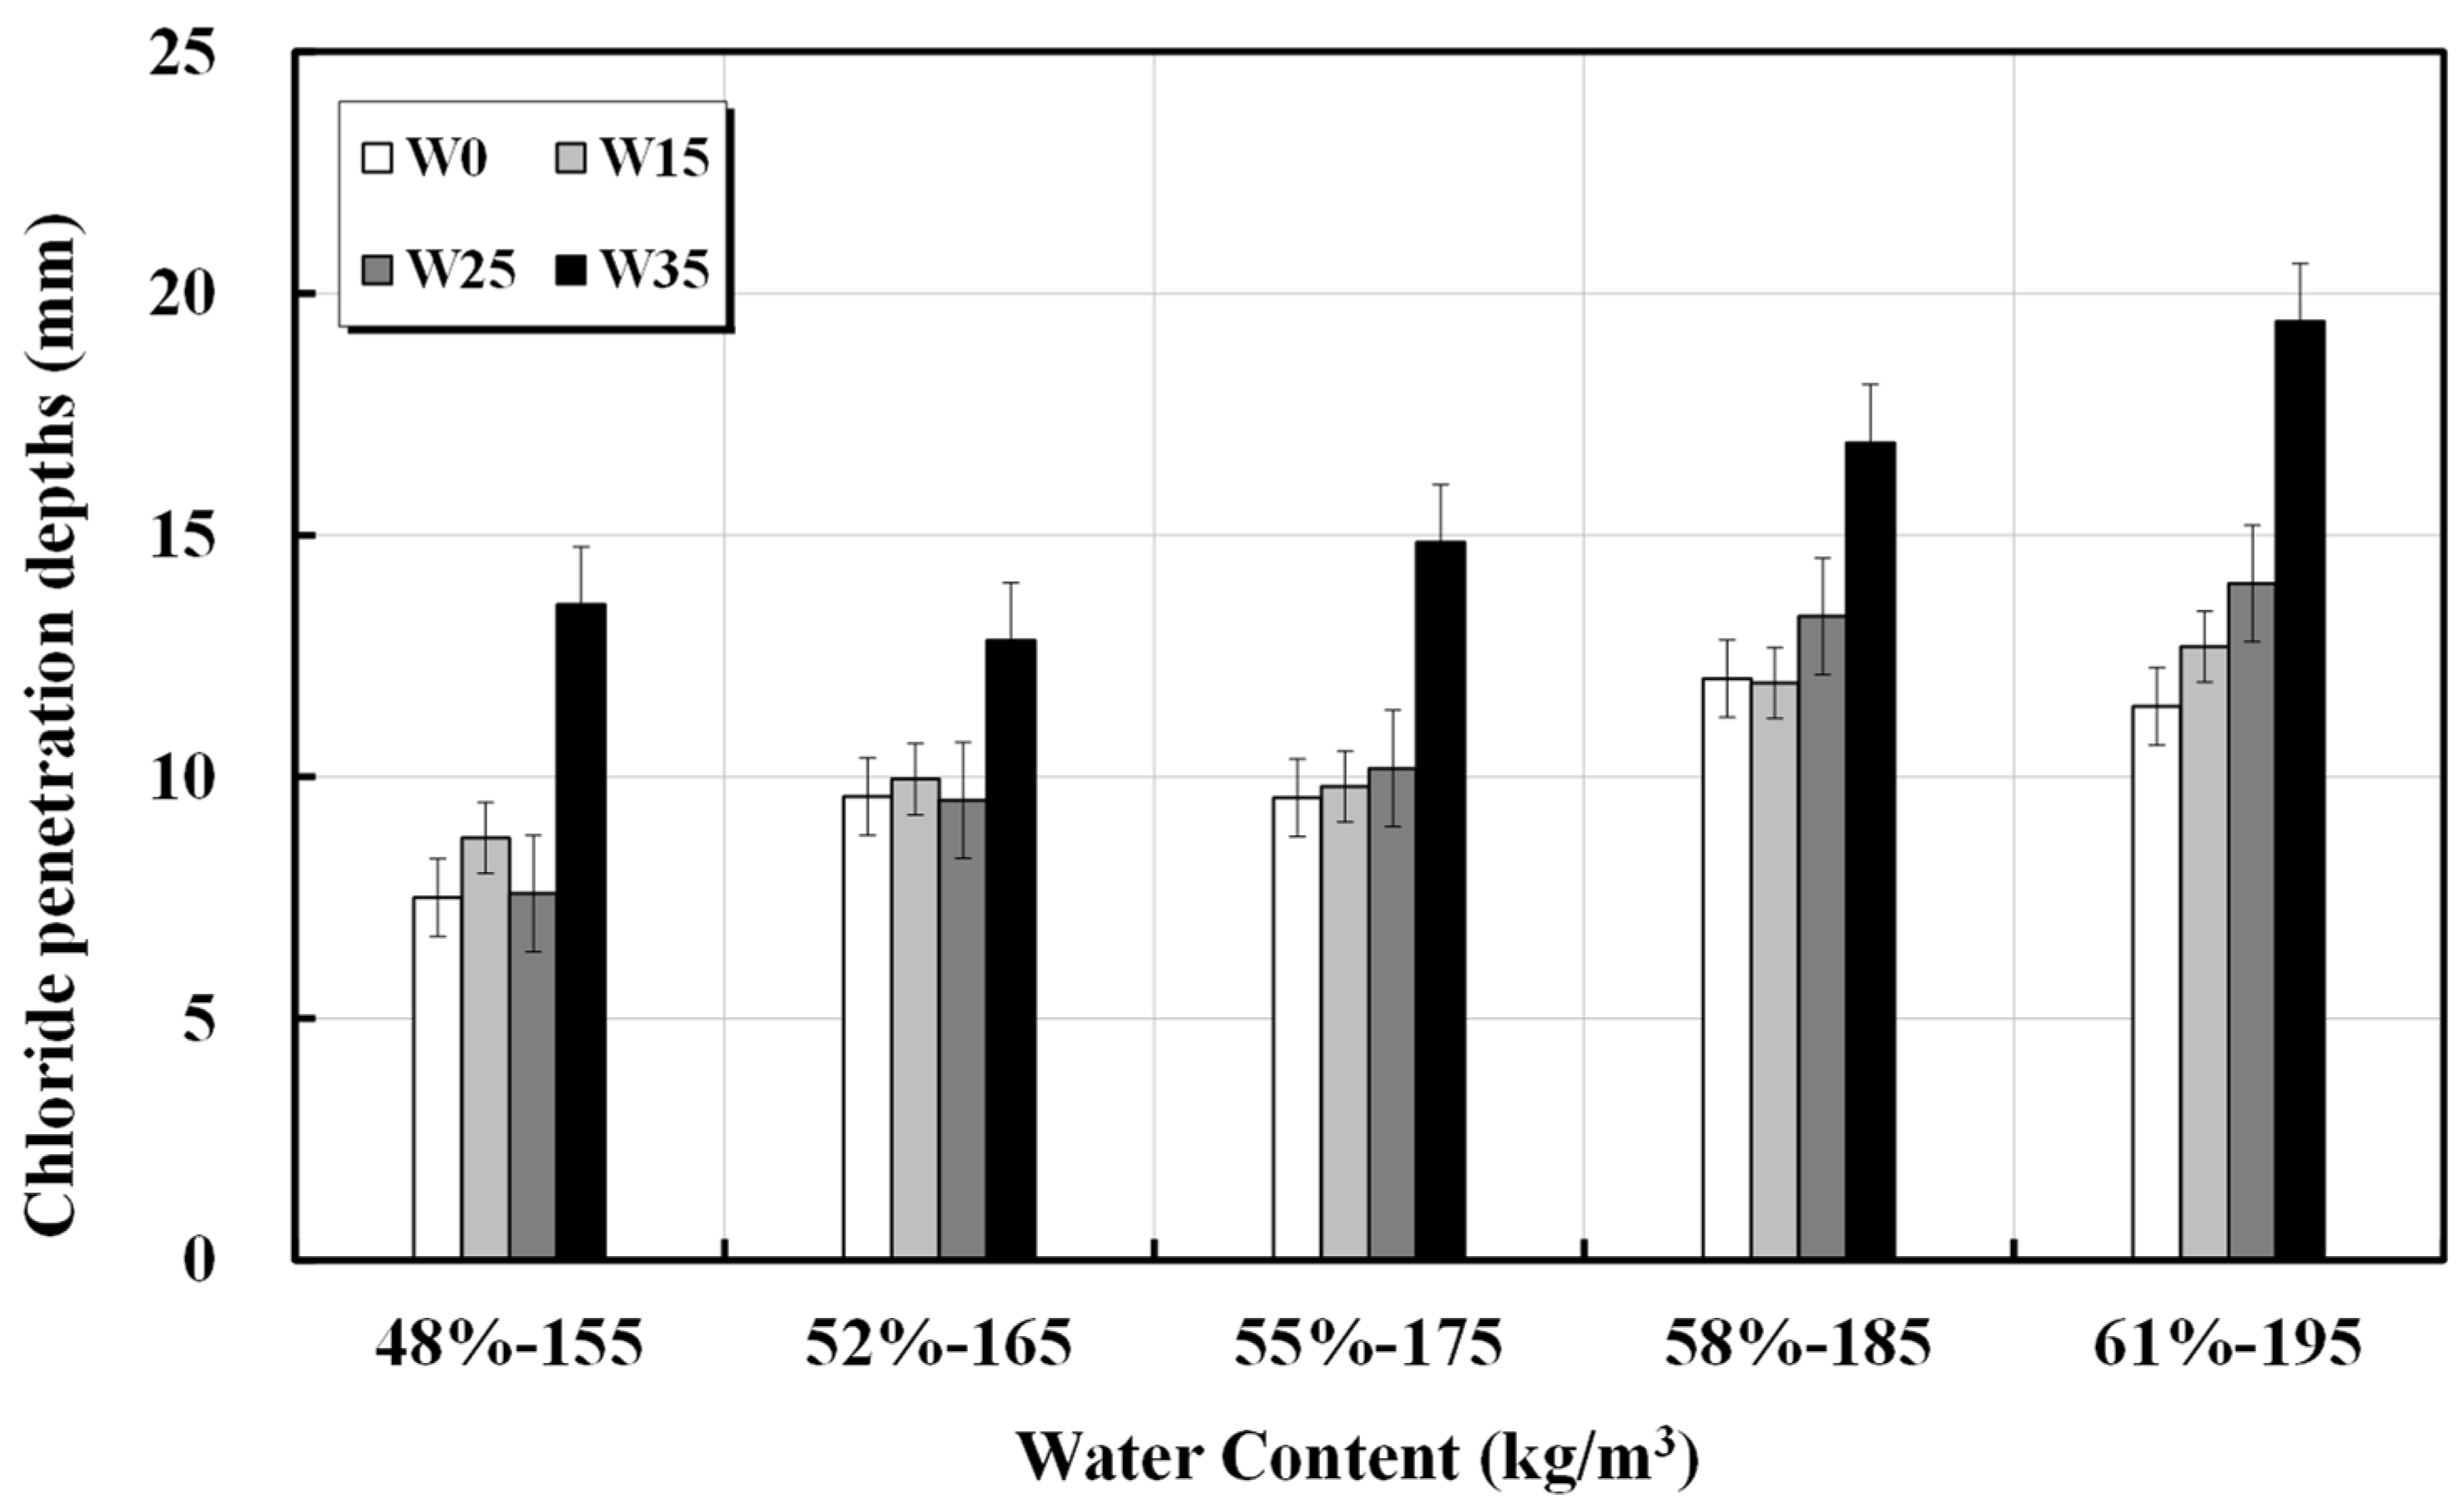
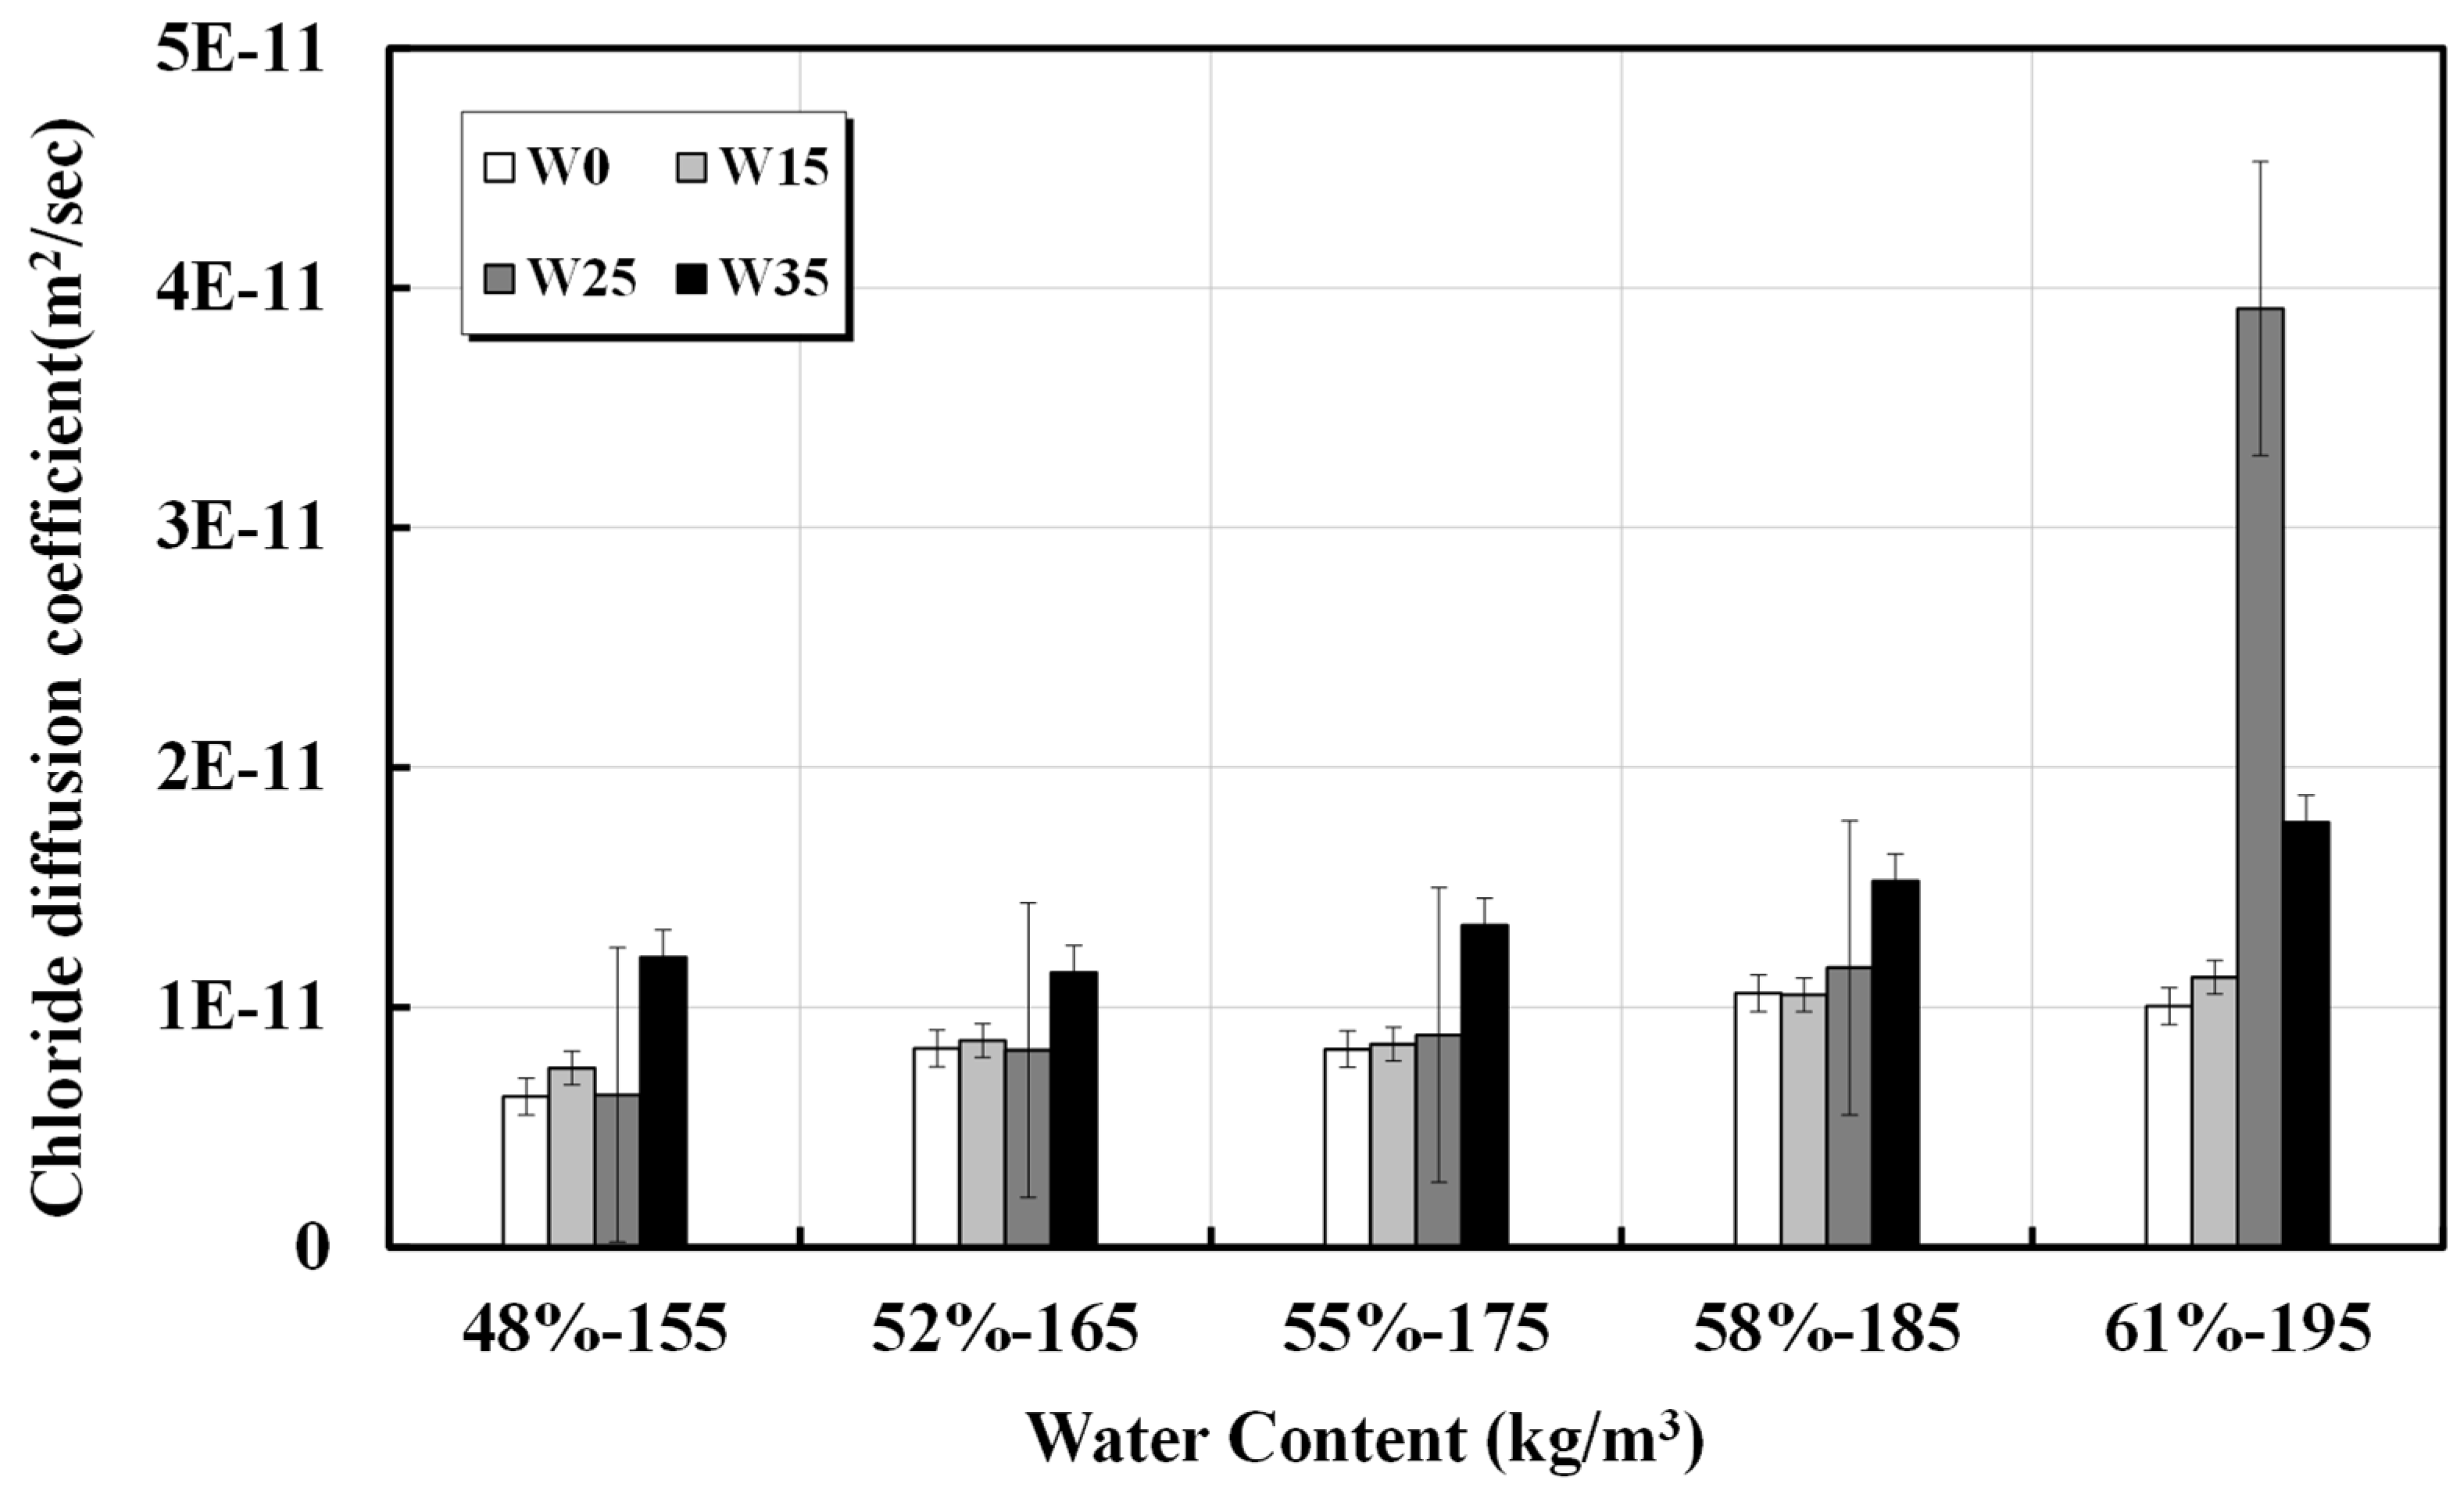
3.2. Chloride Ion Diffusion Coefficient
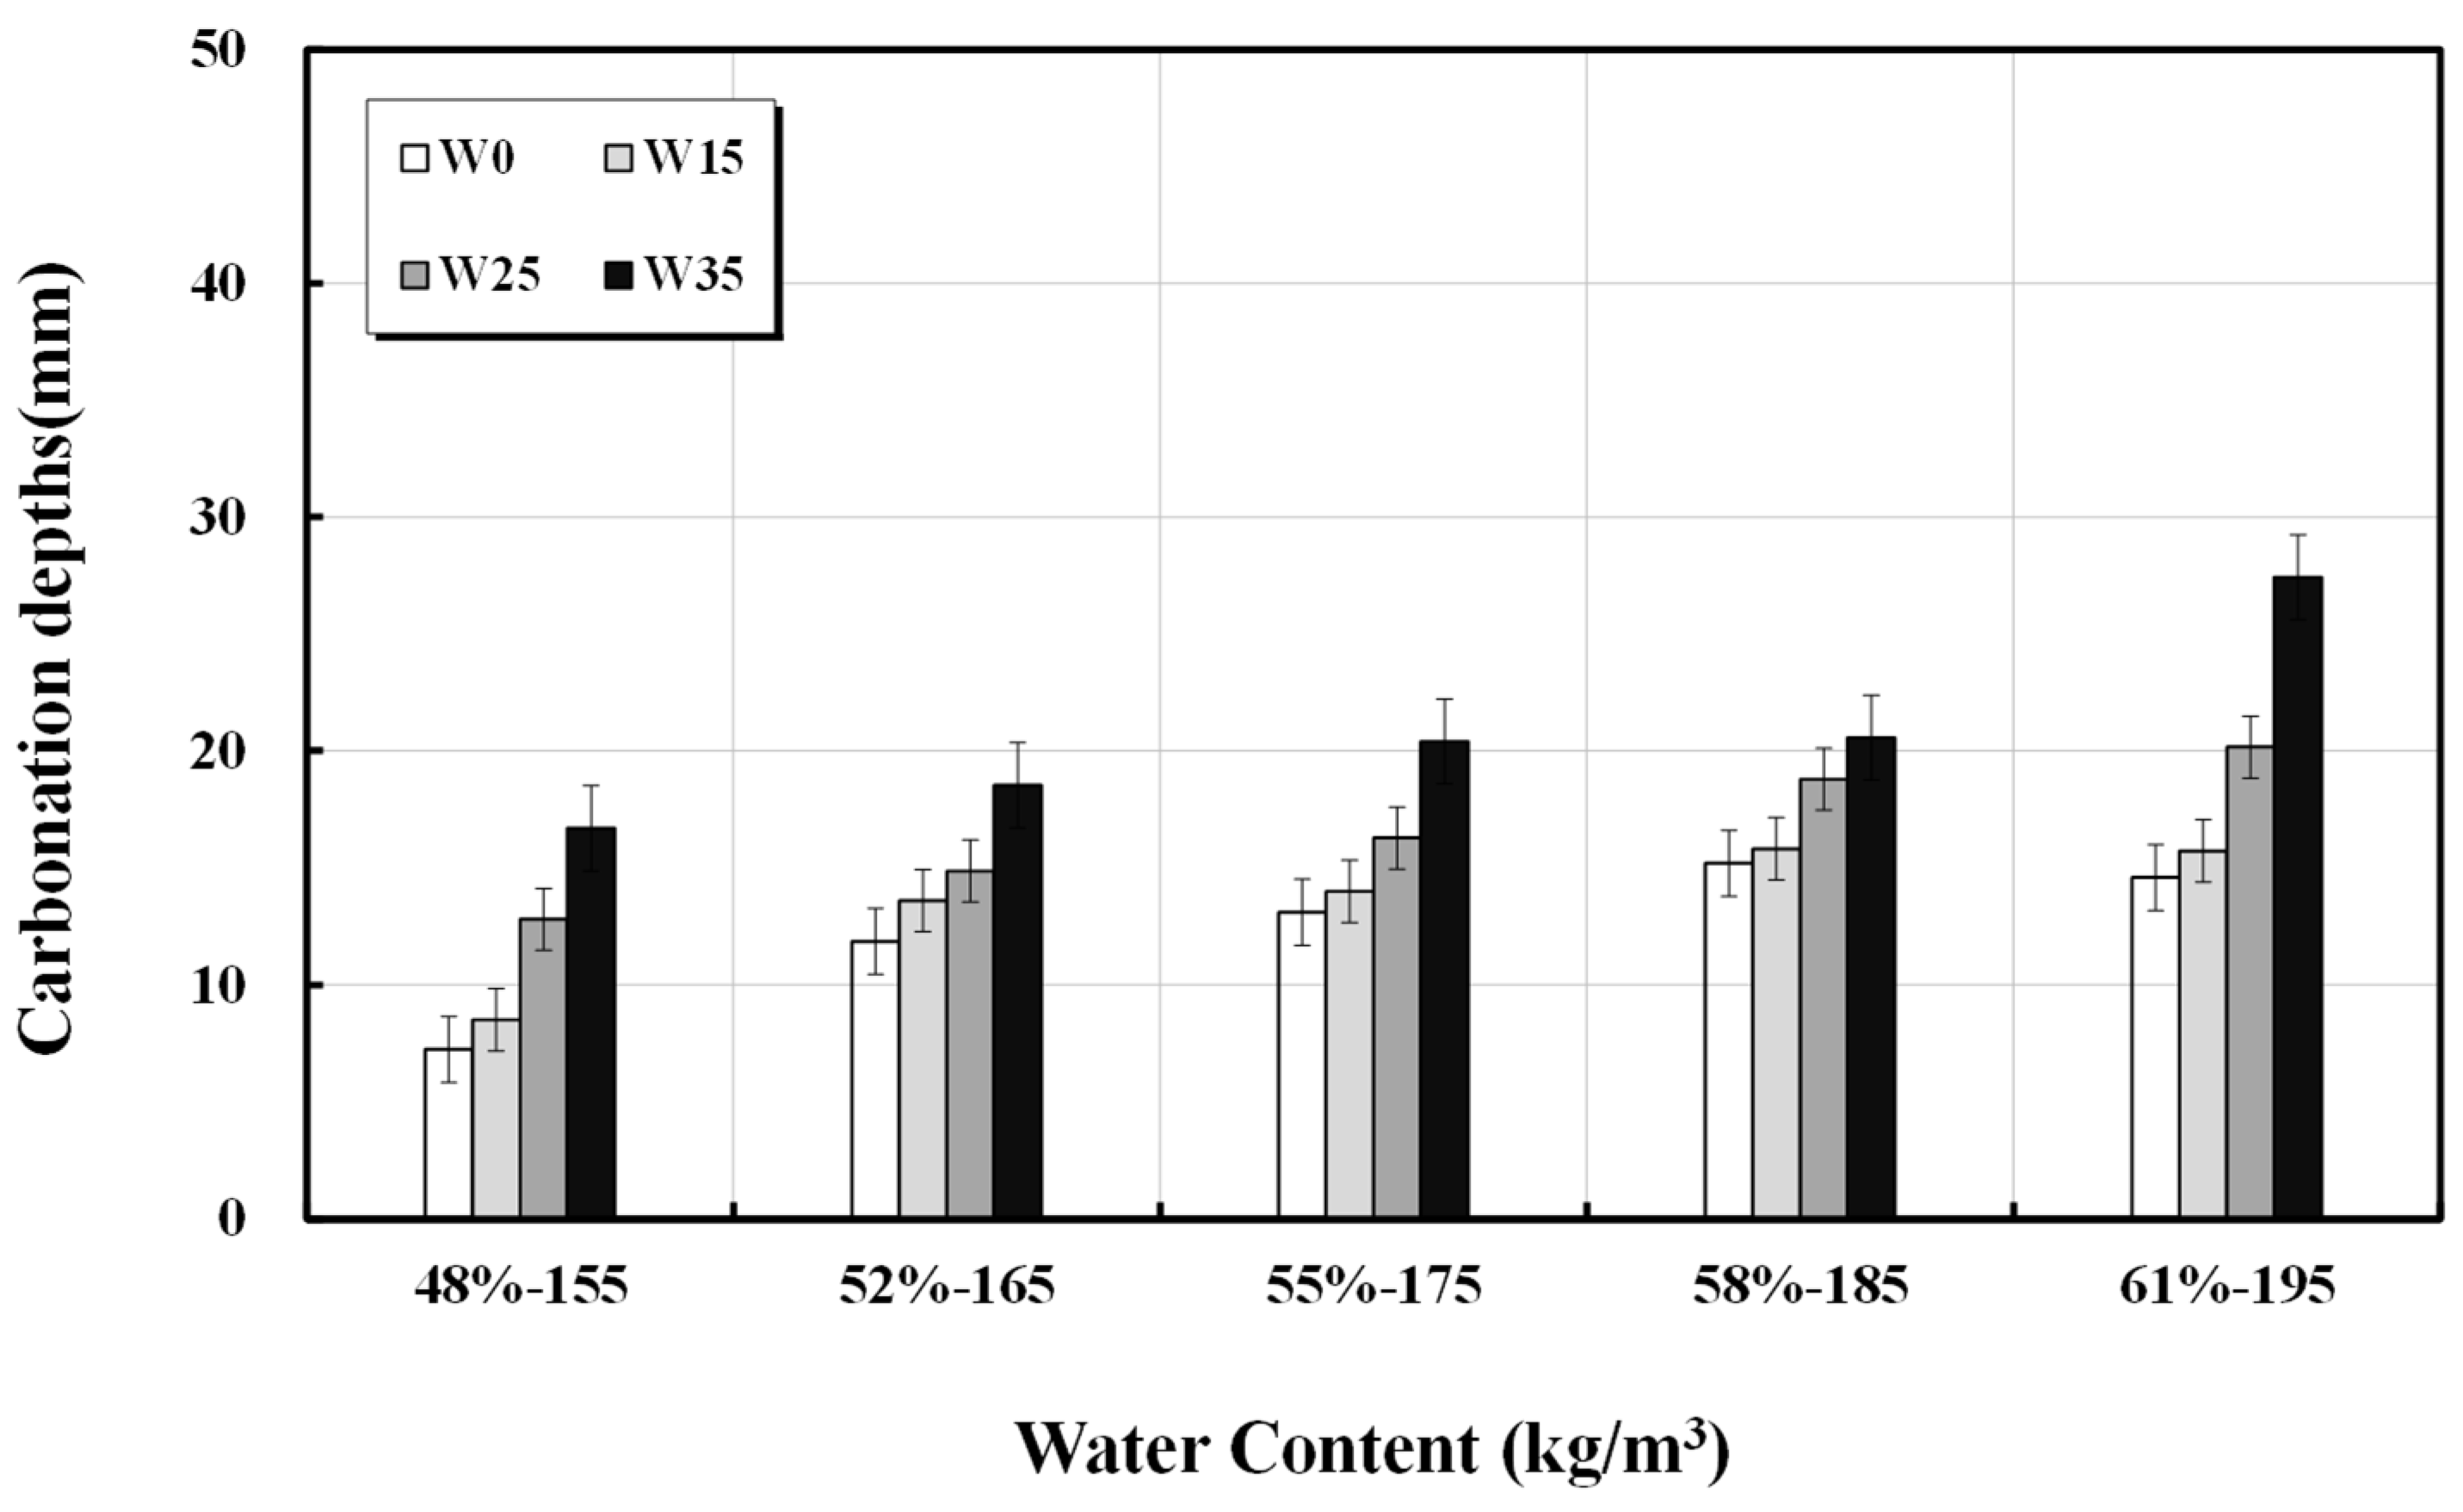
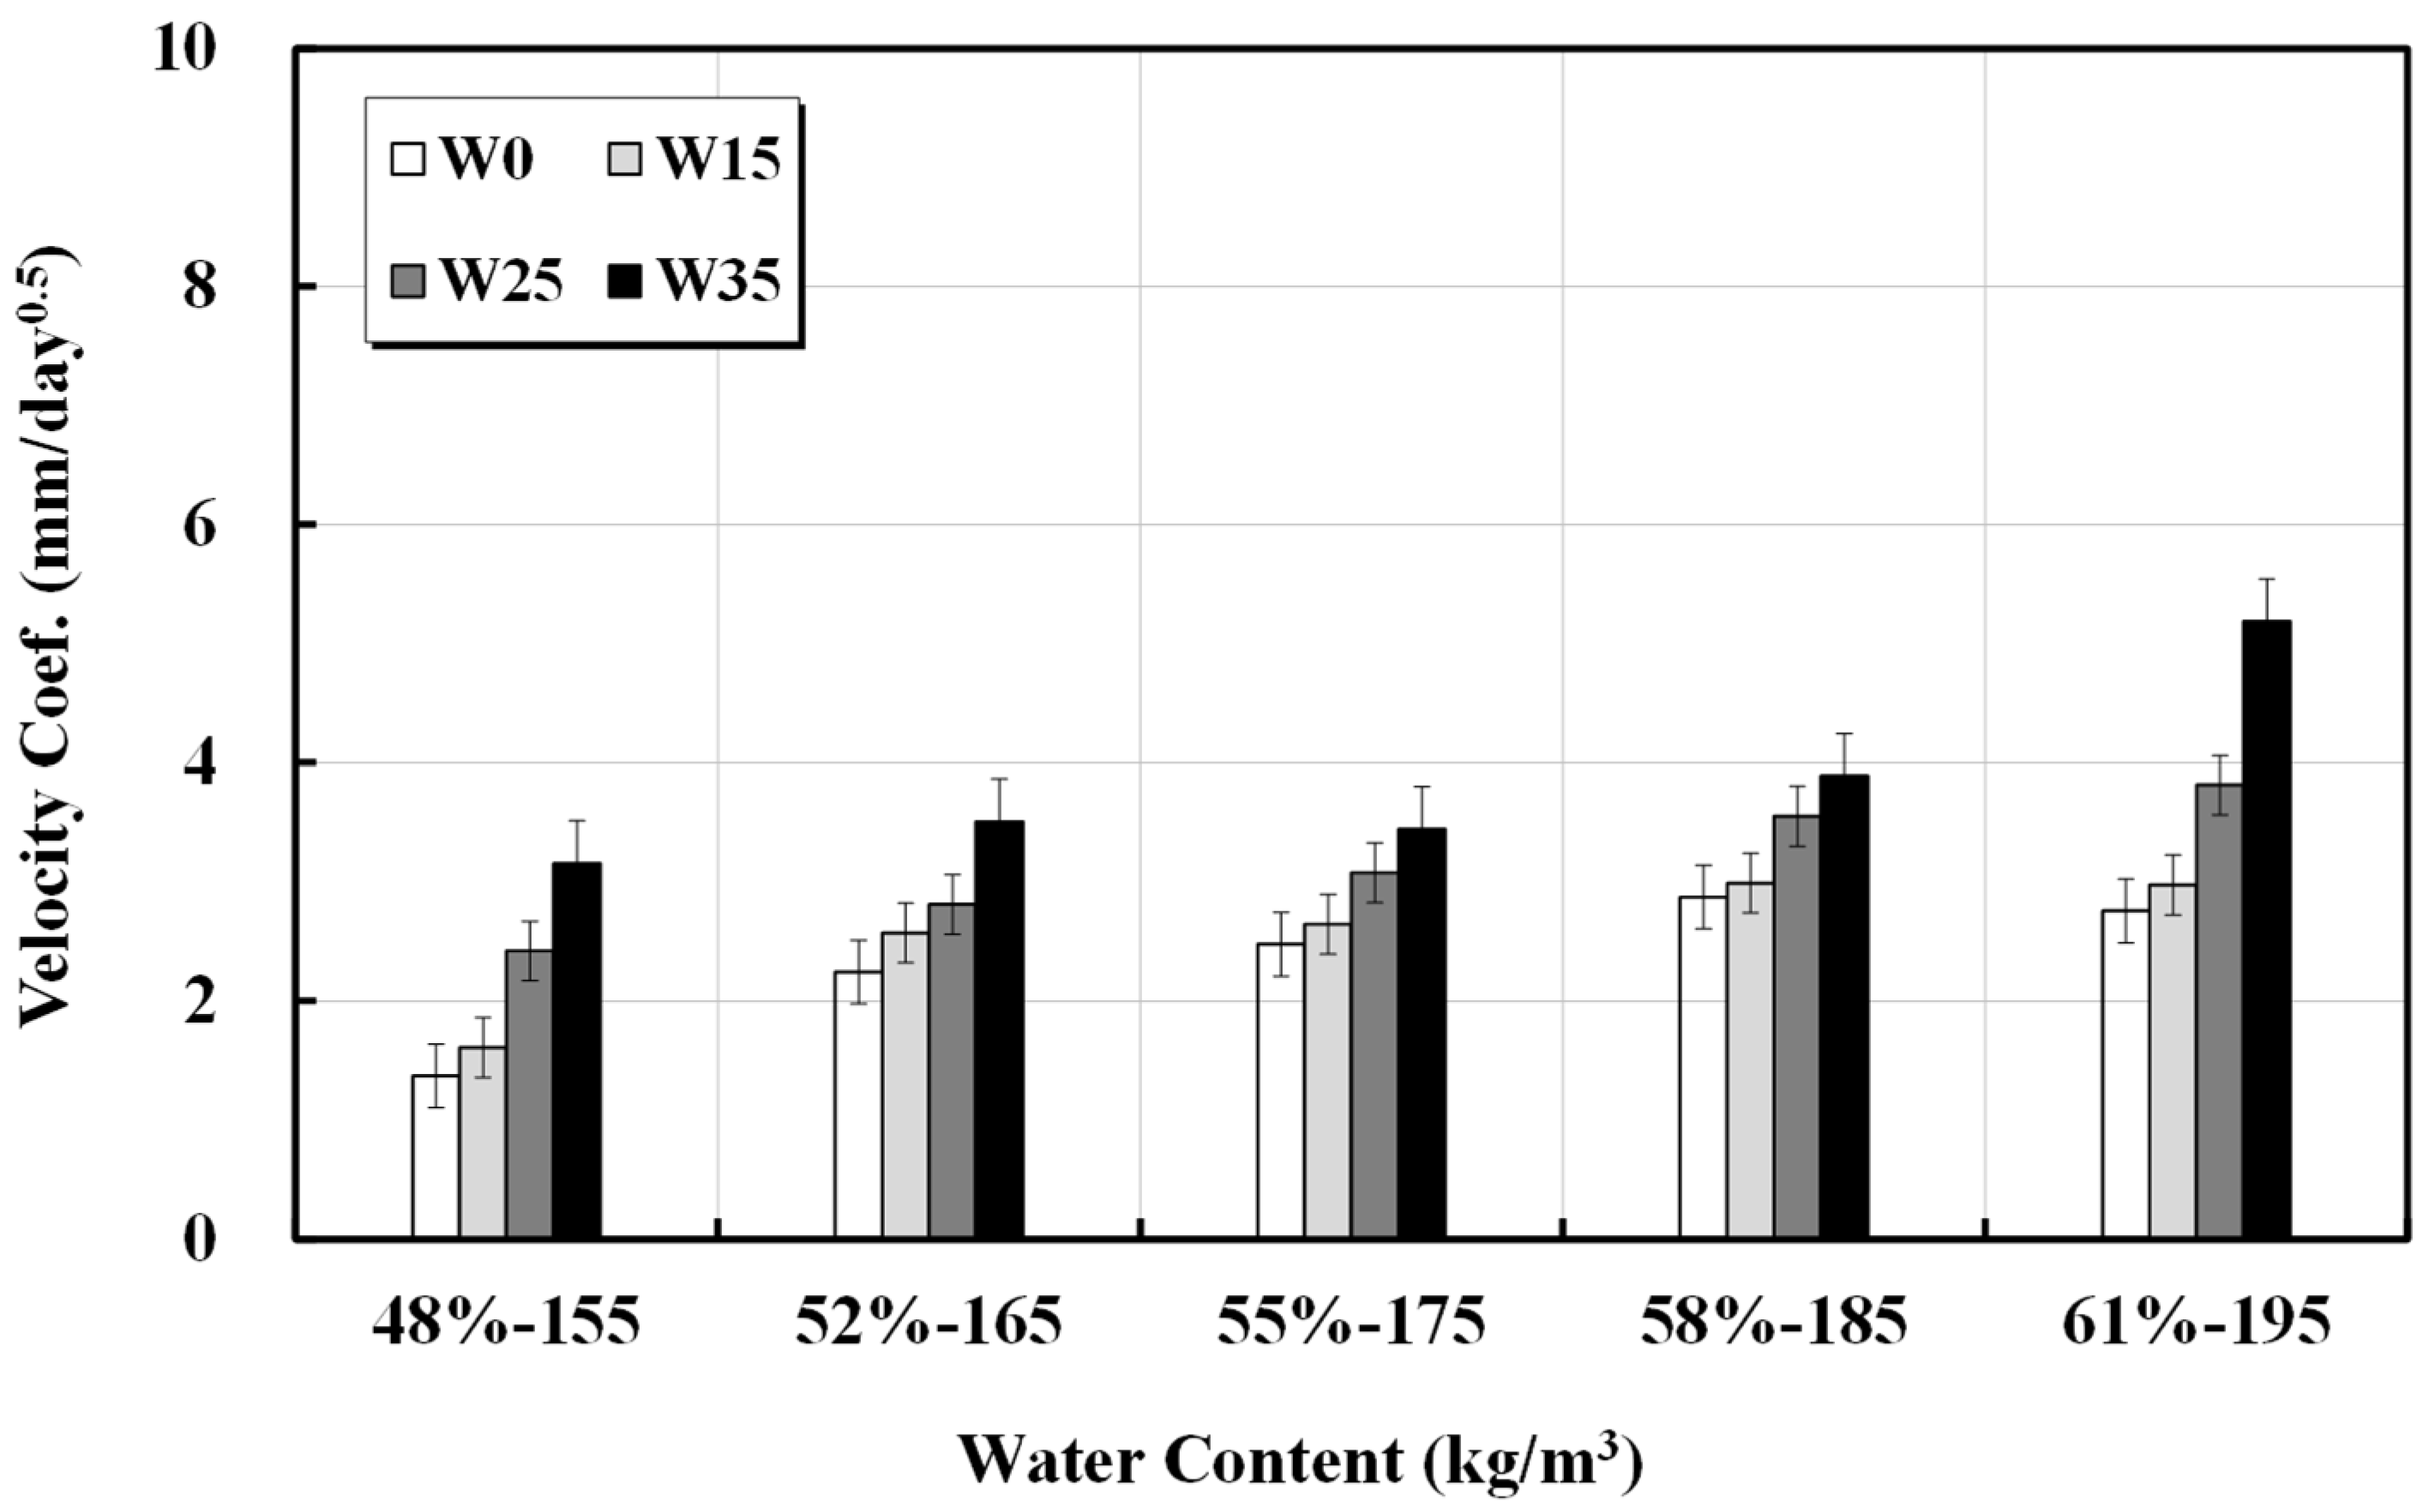
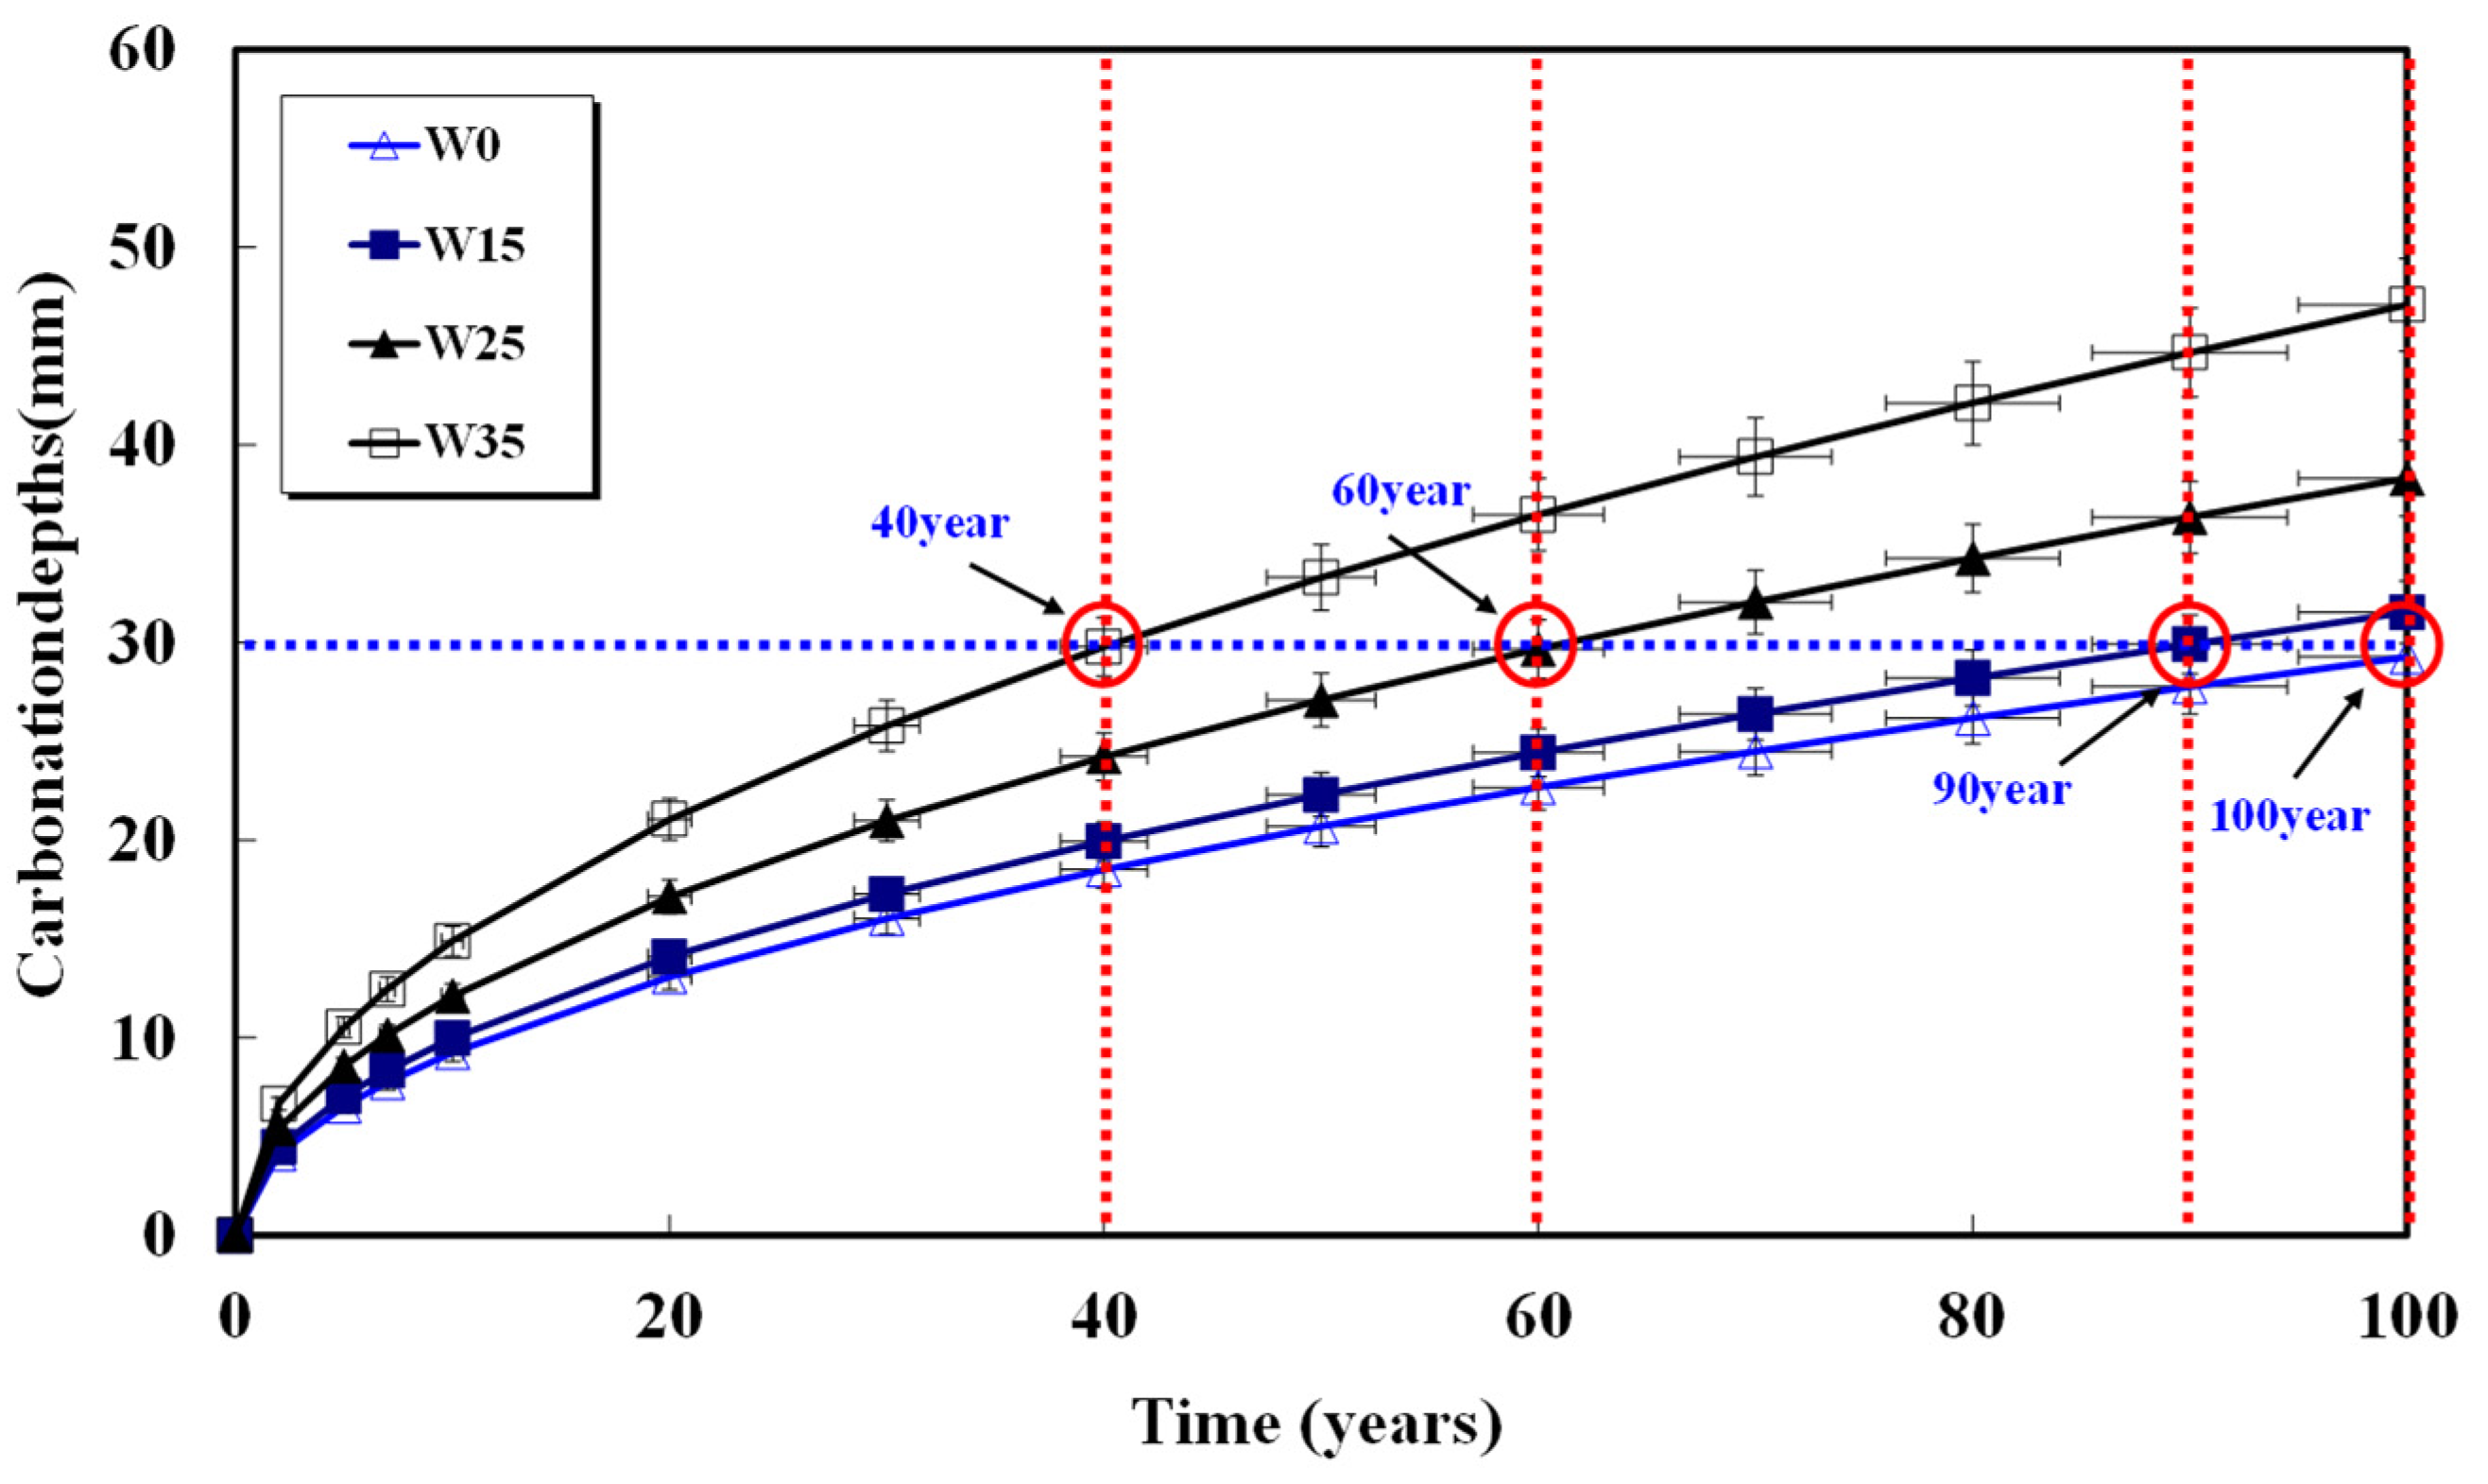
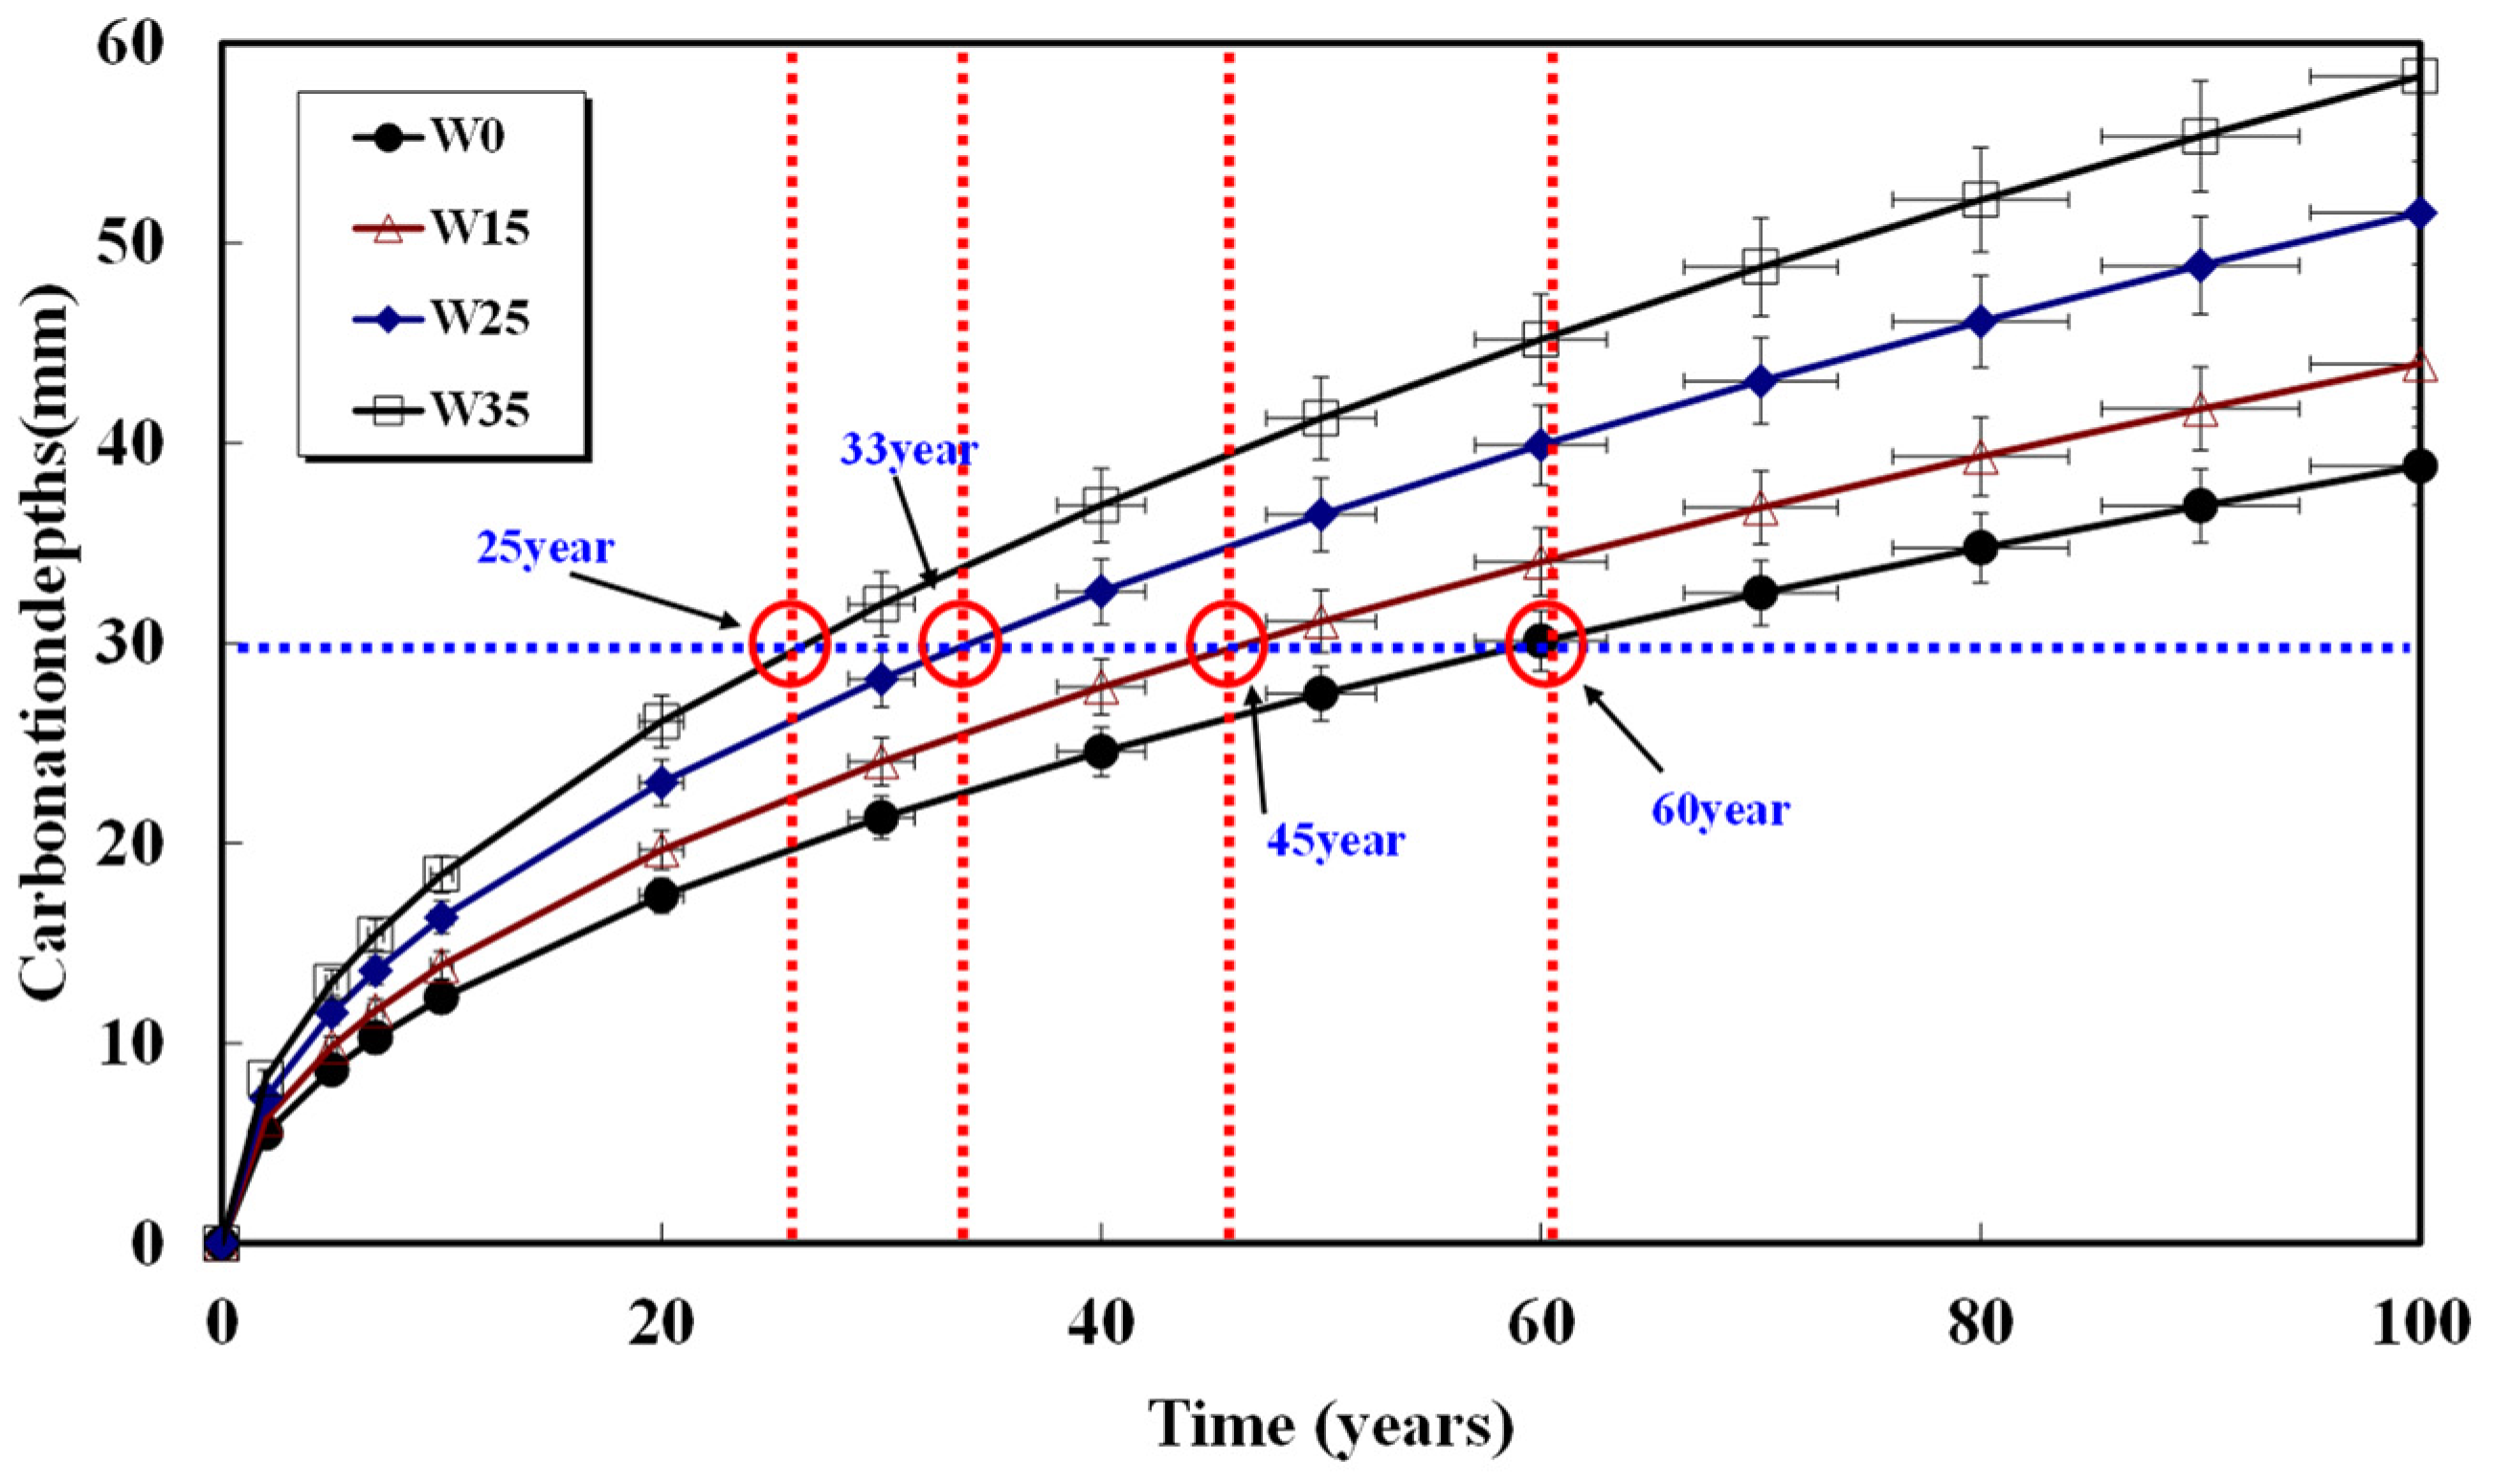
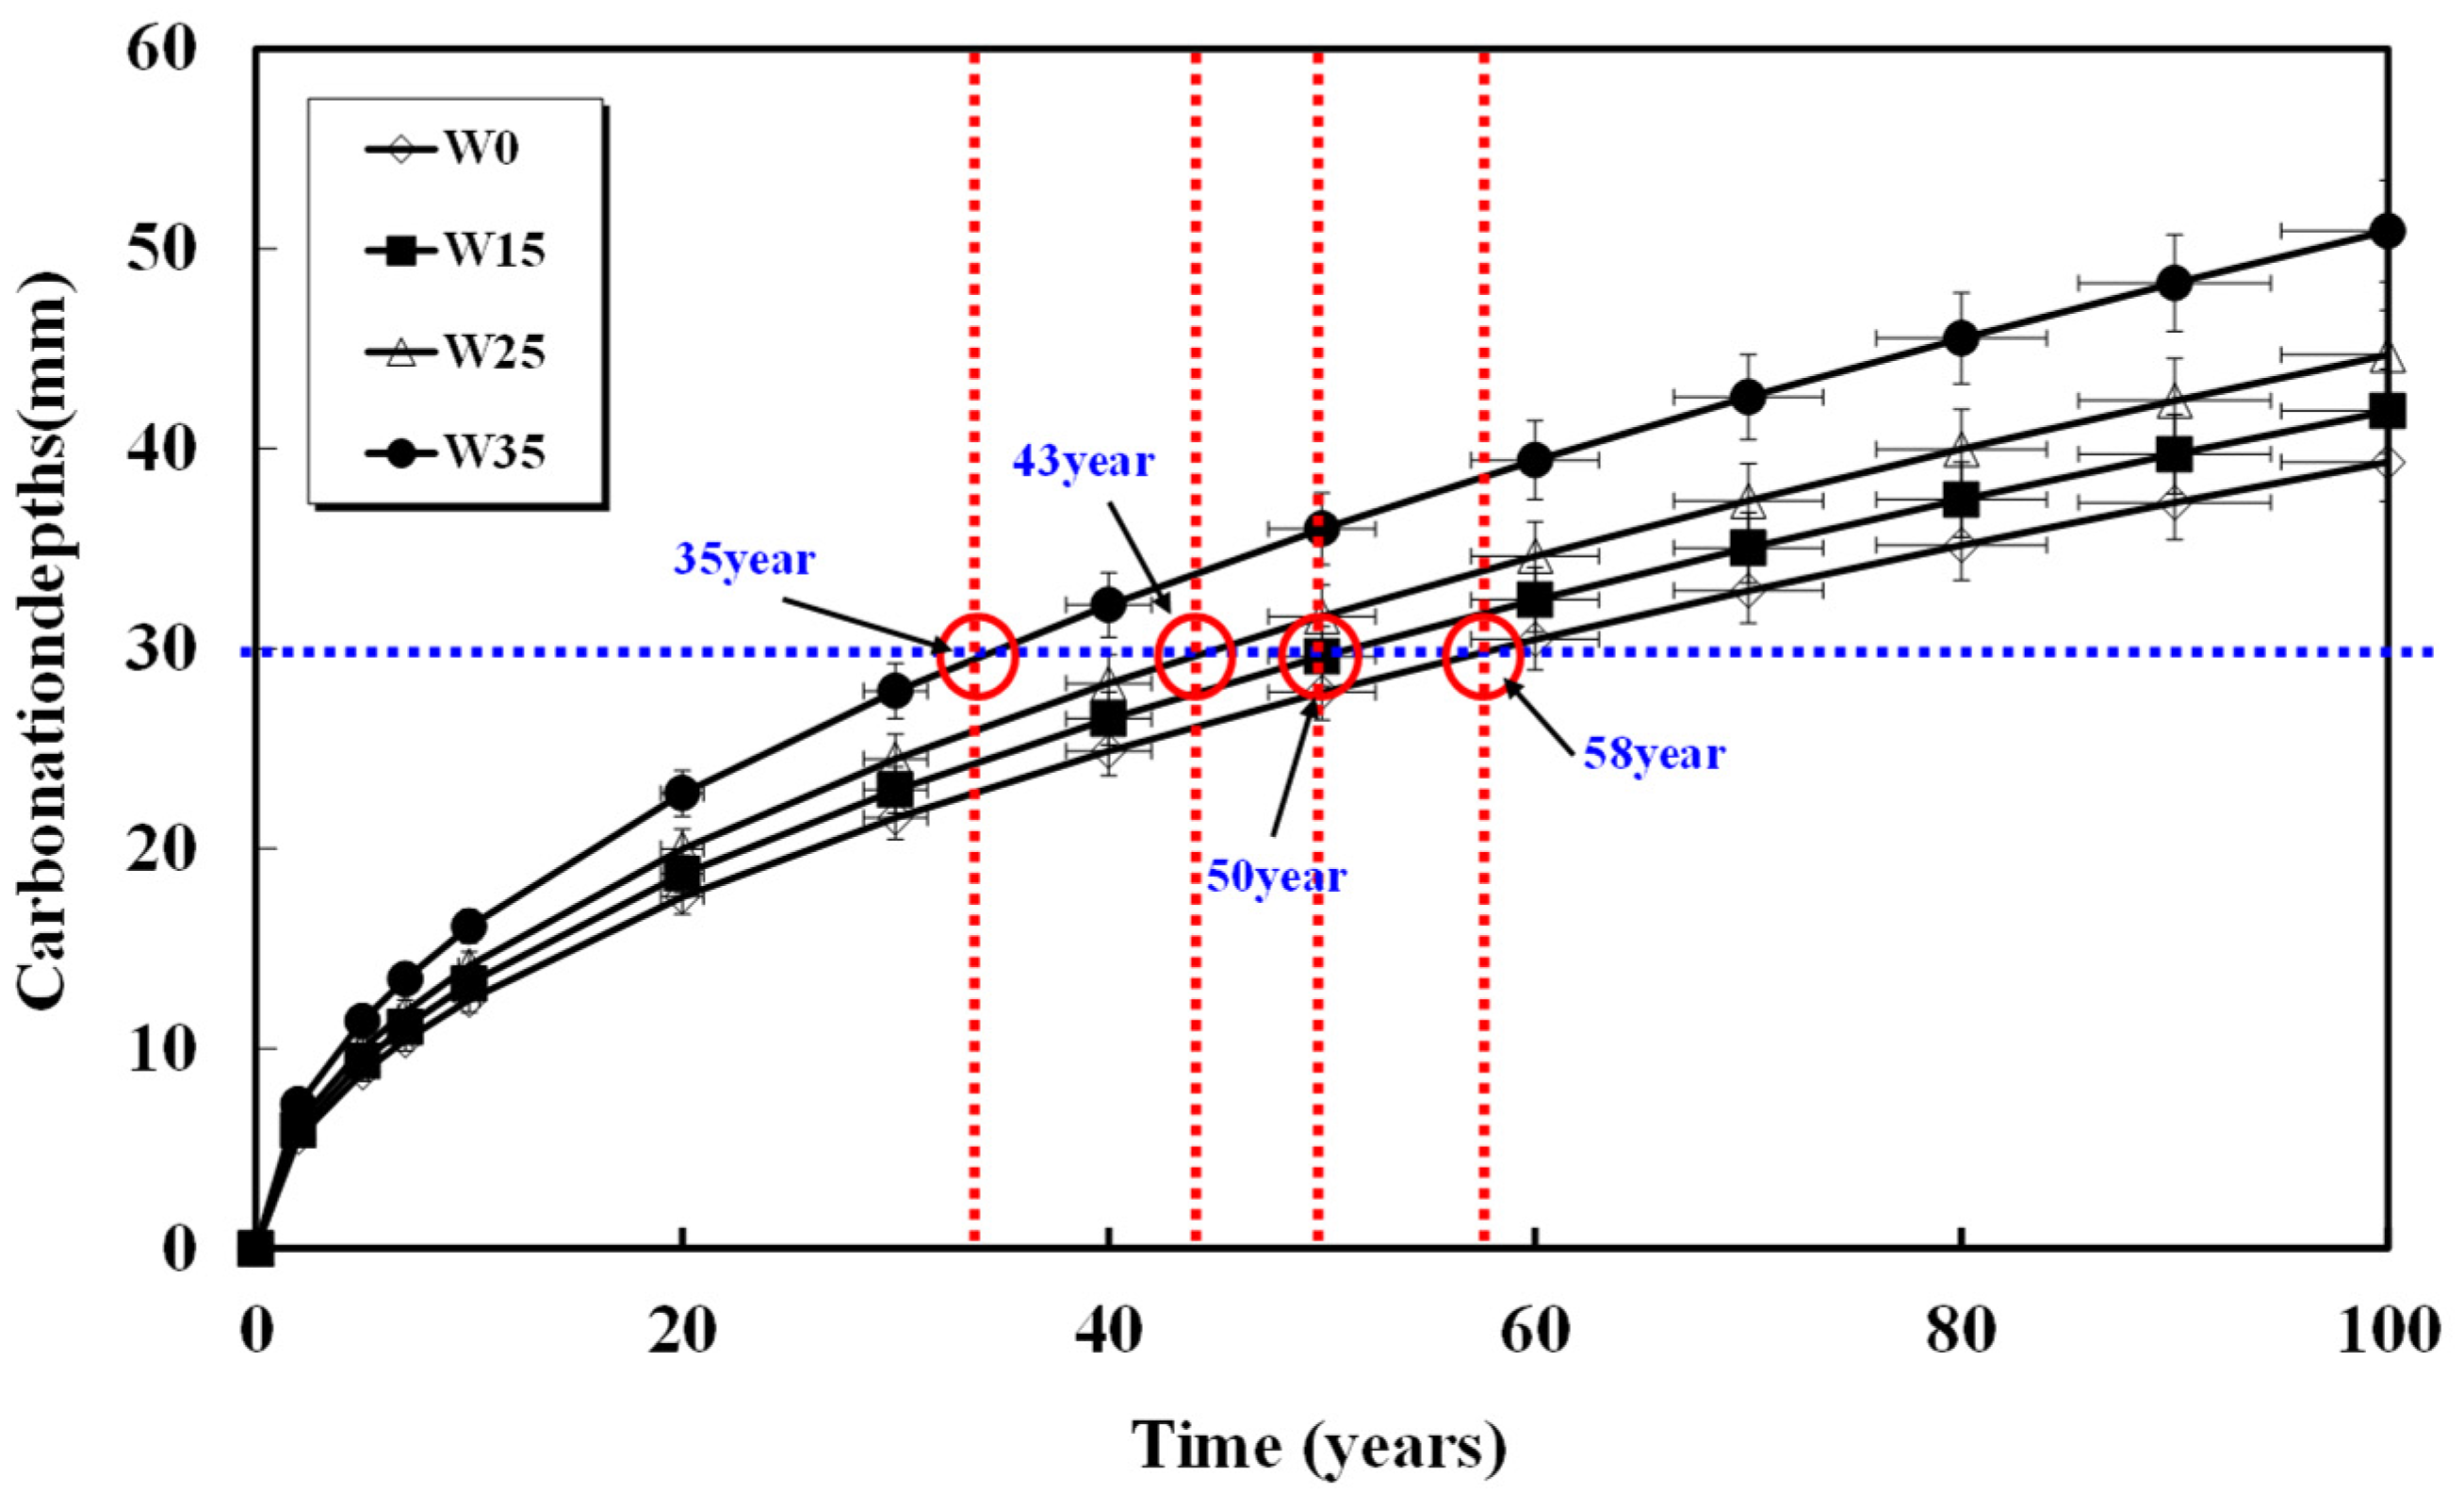
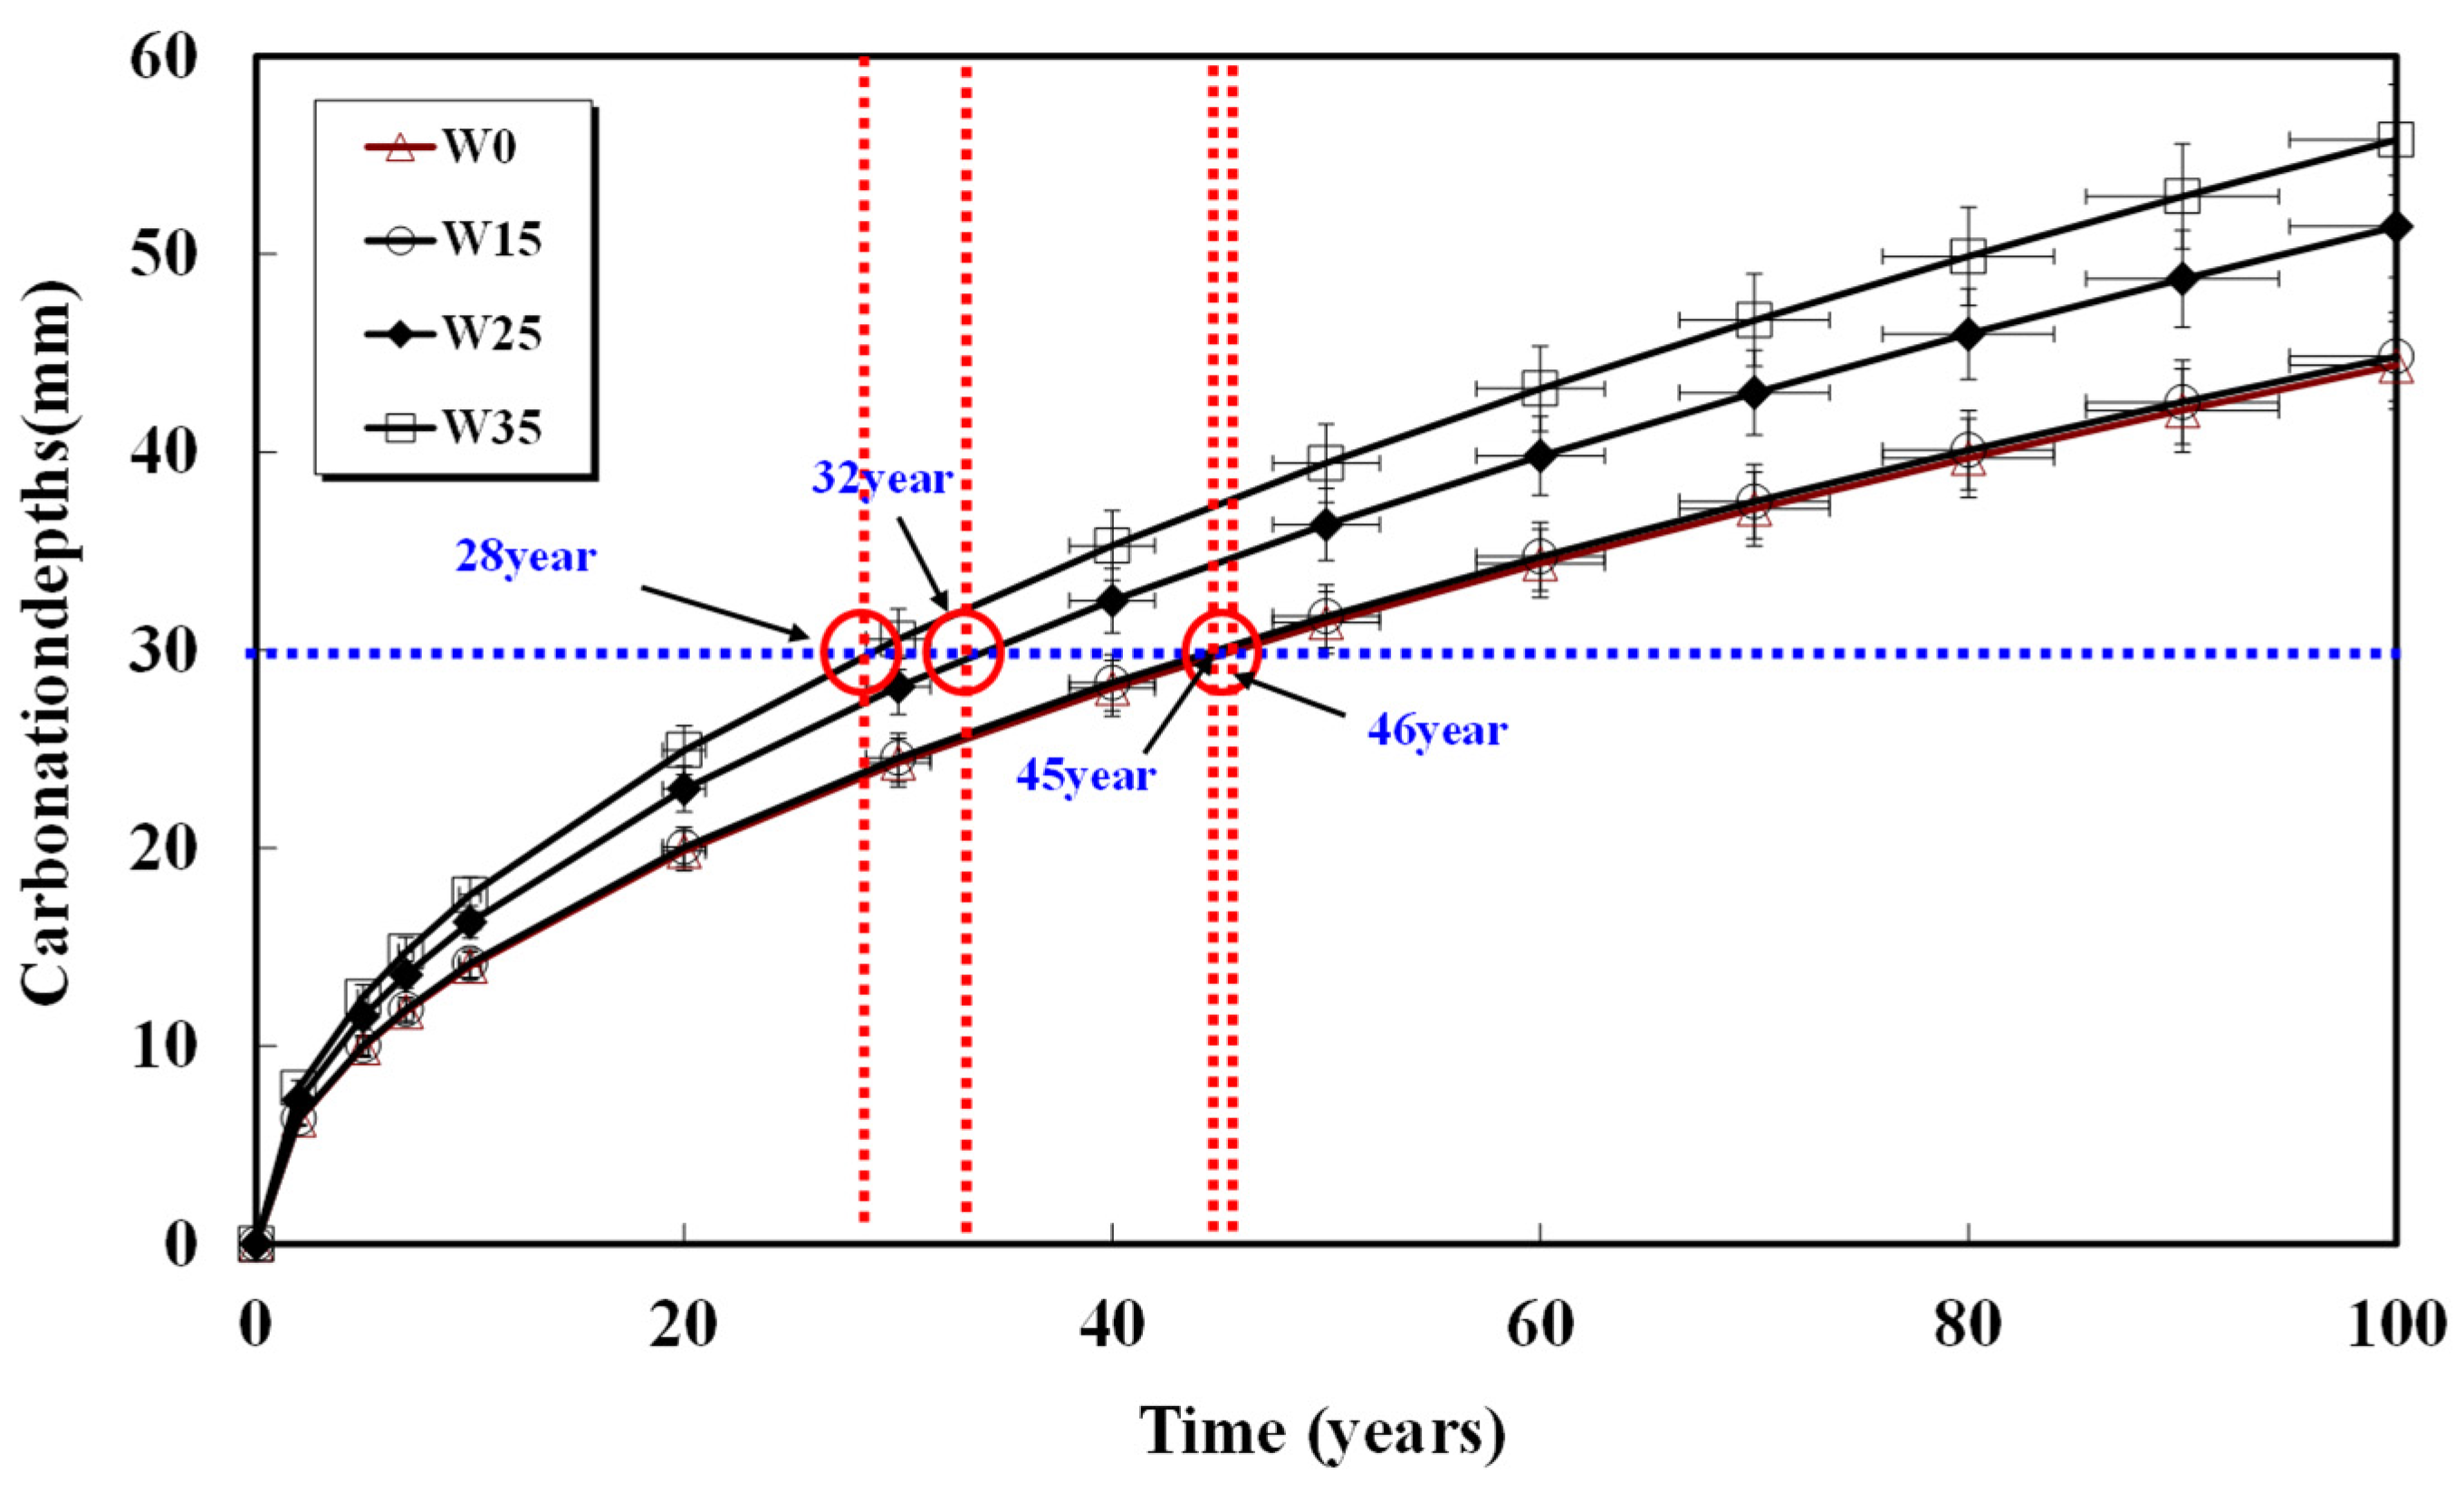
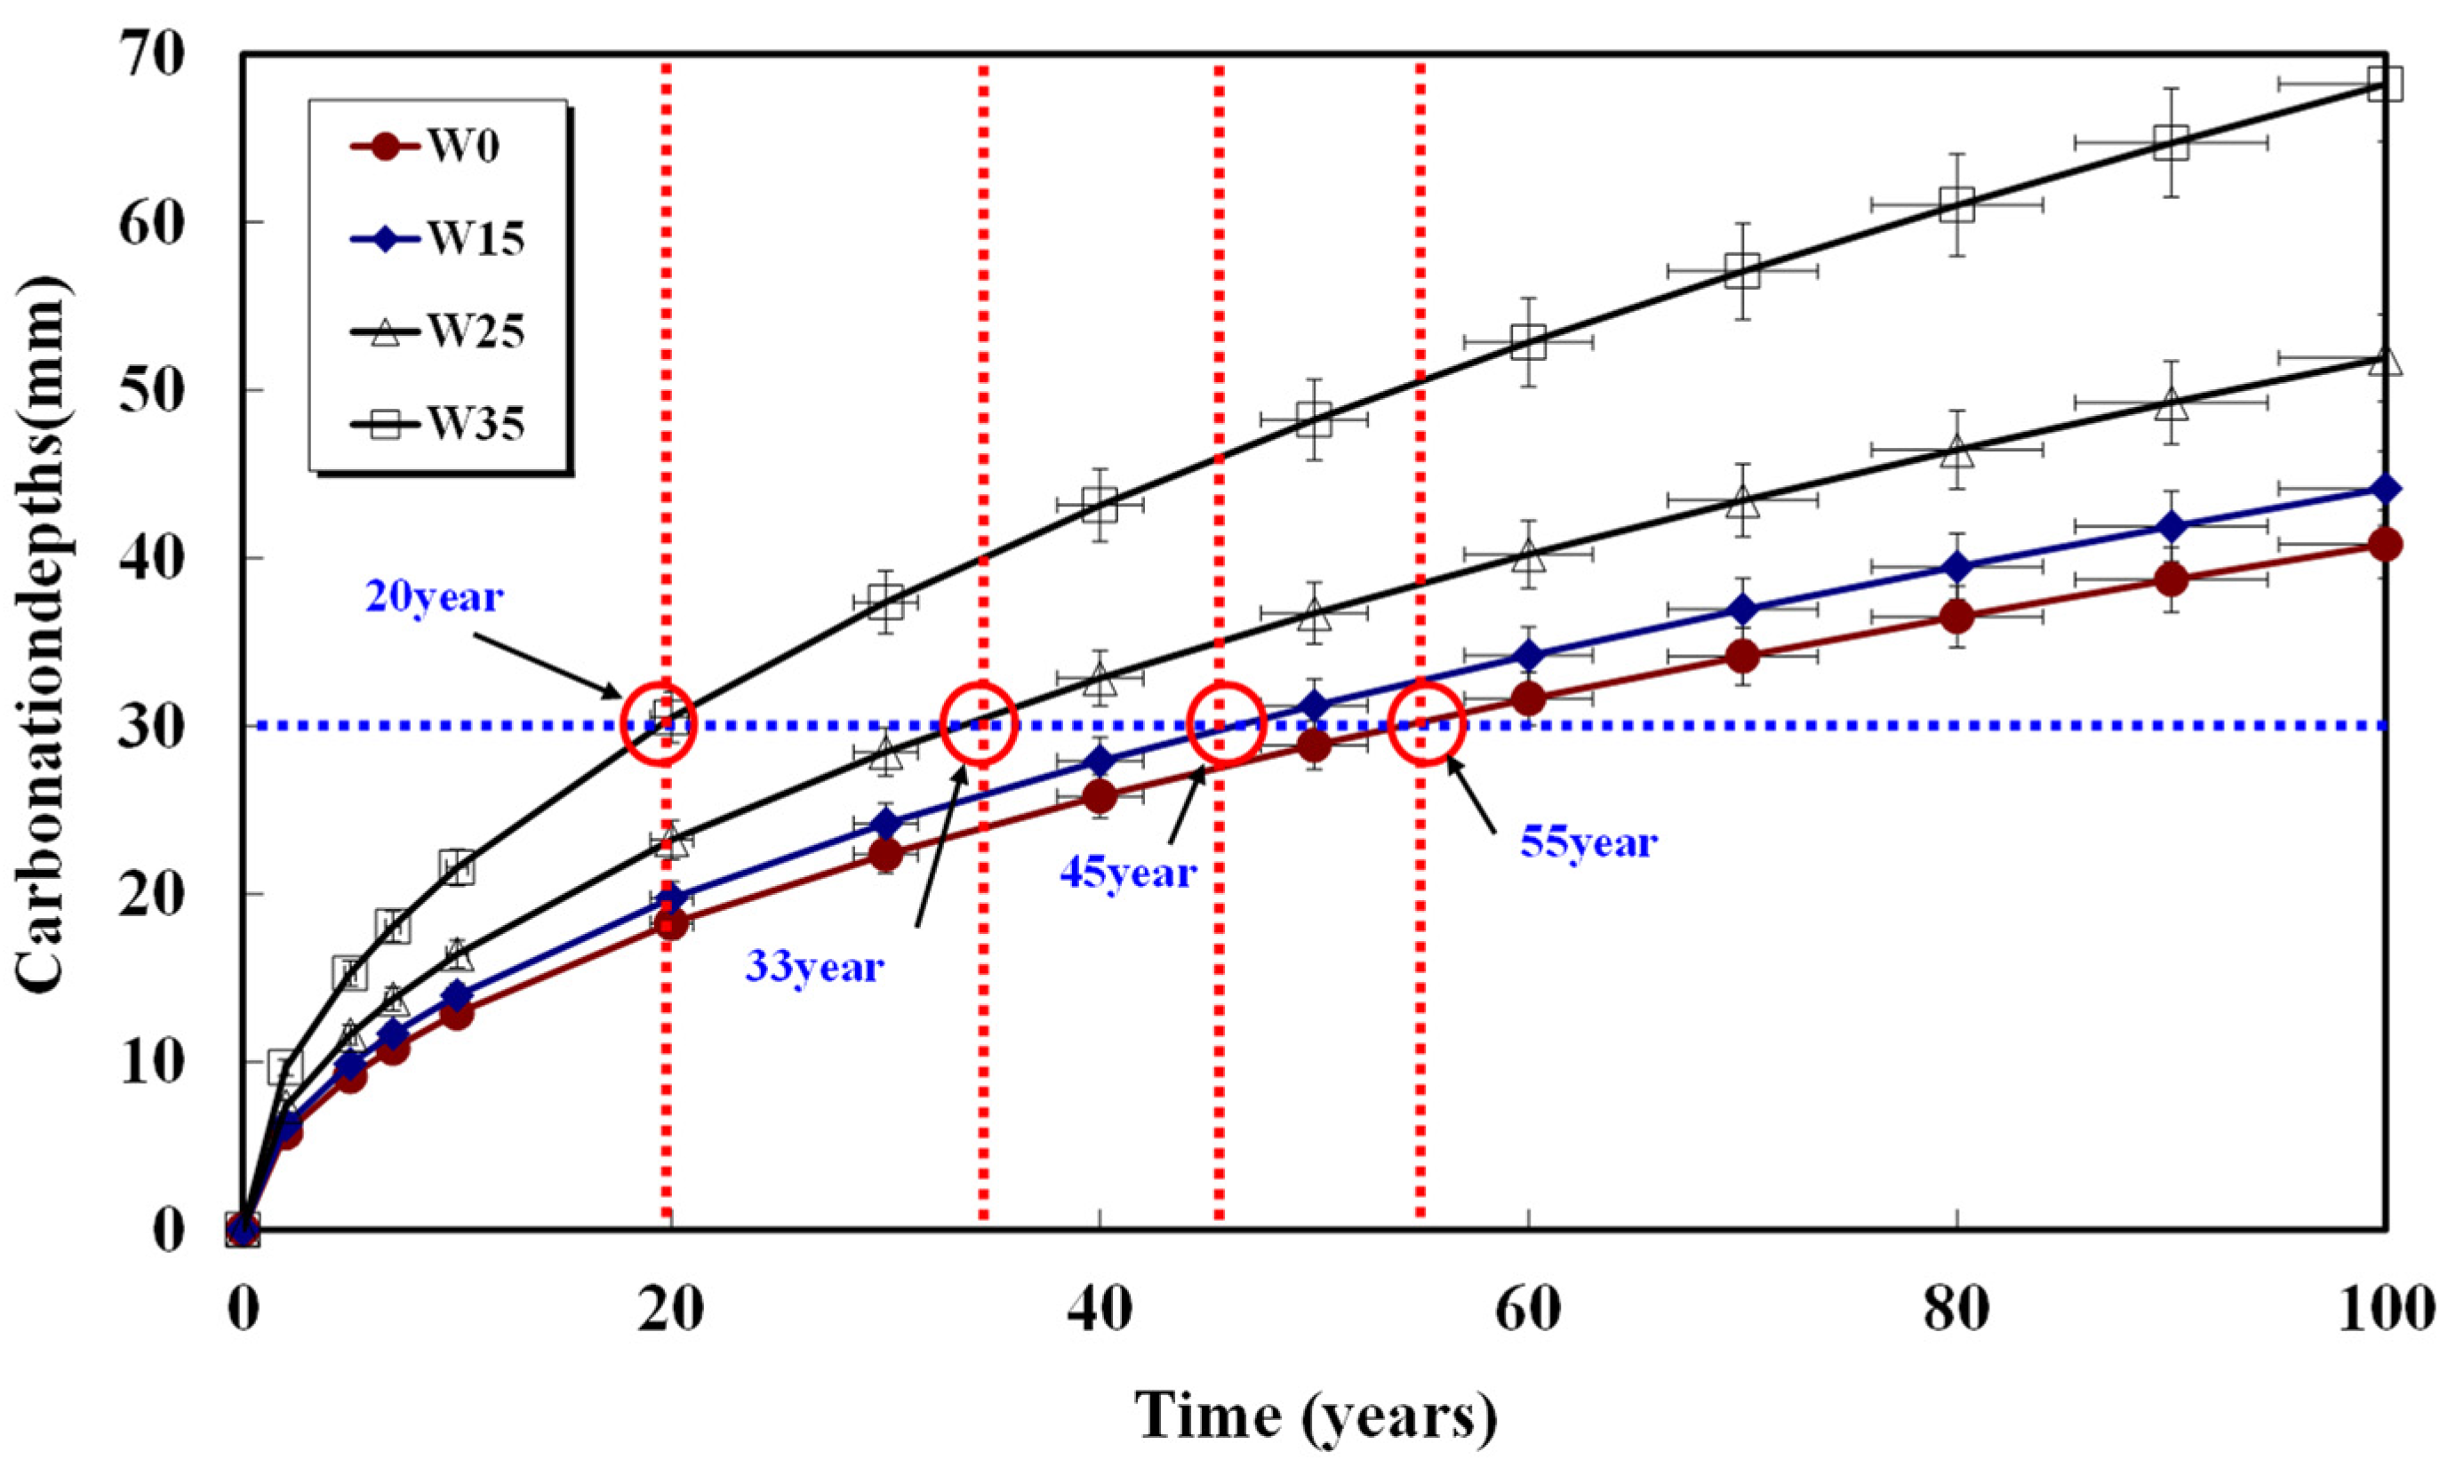
3.3. Carbonation
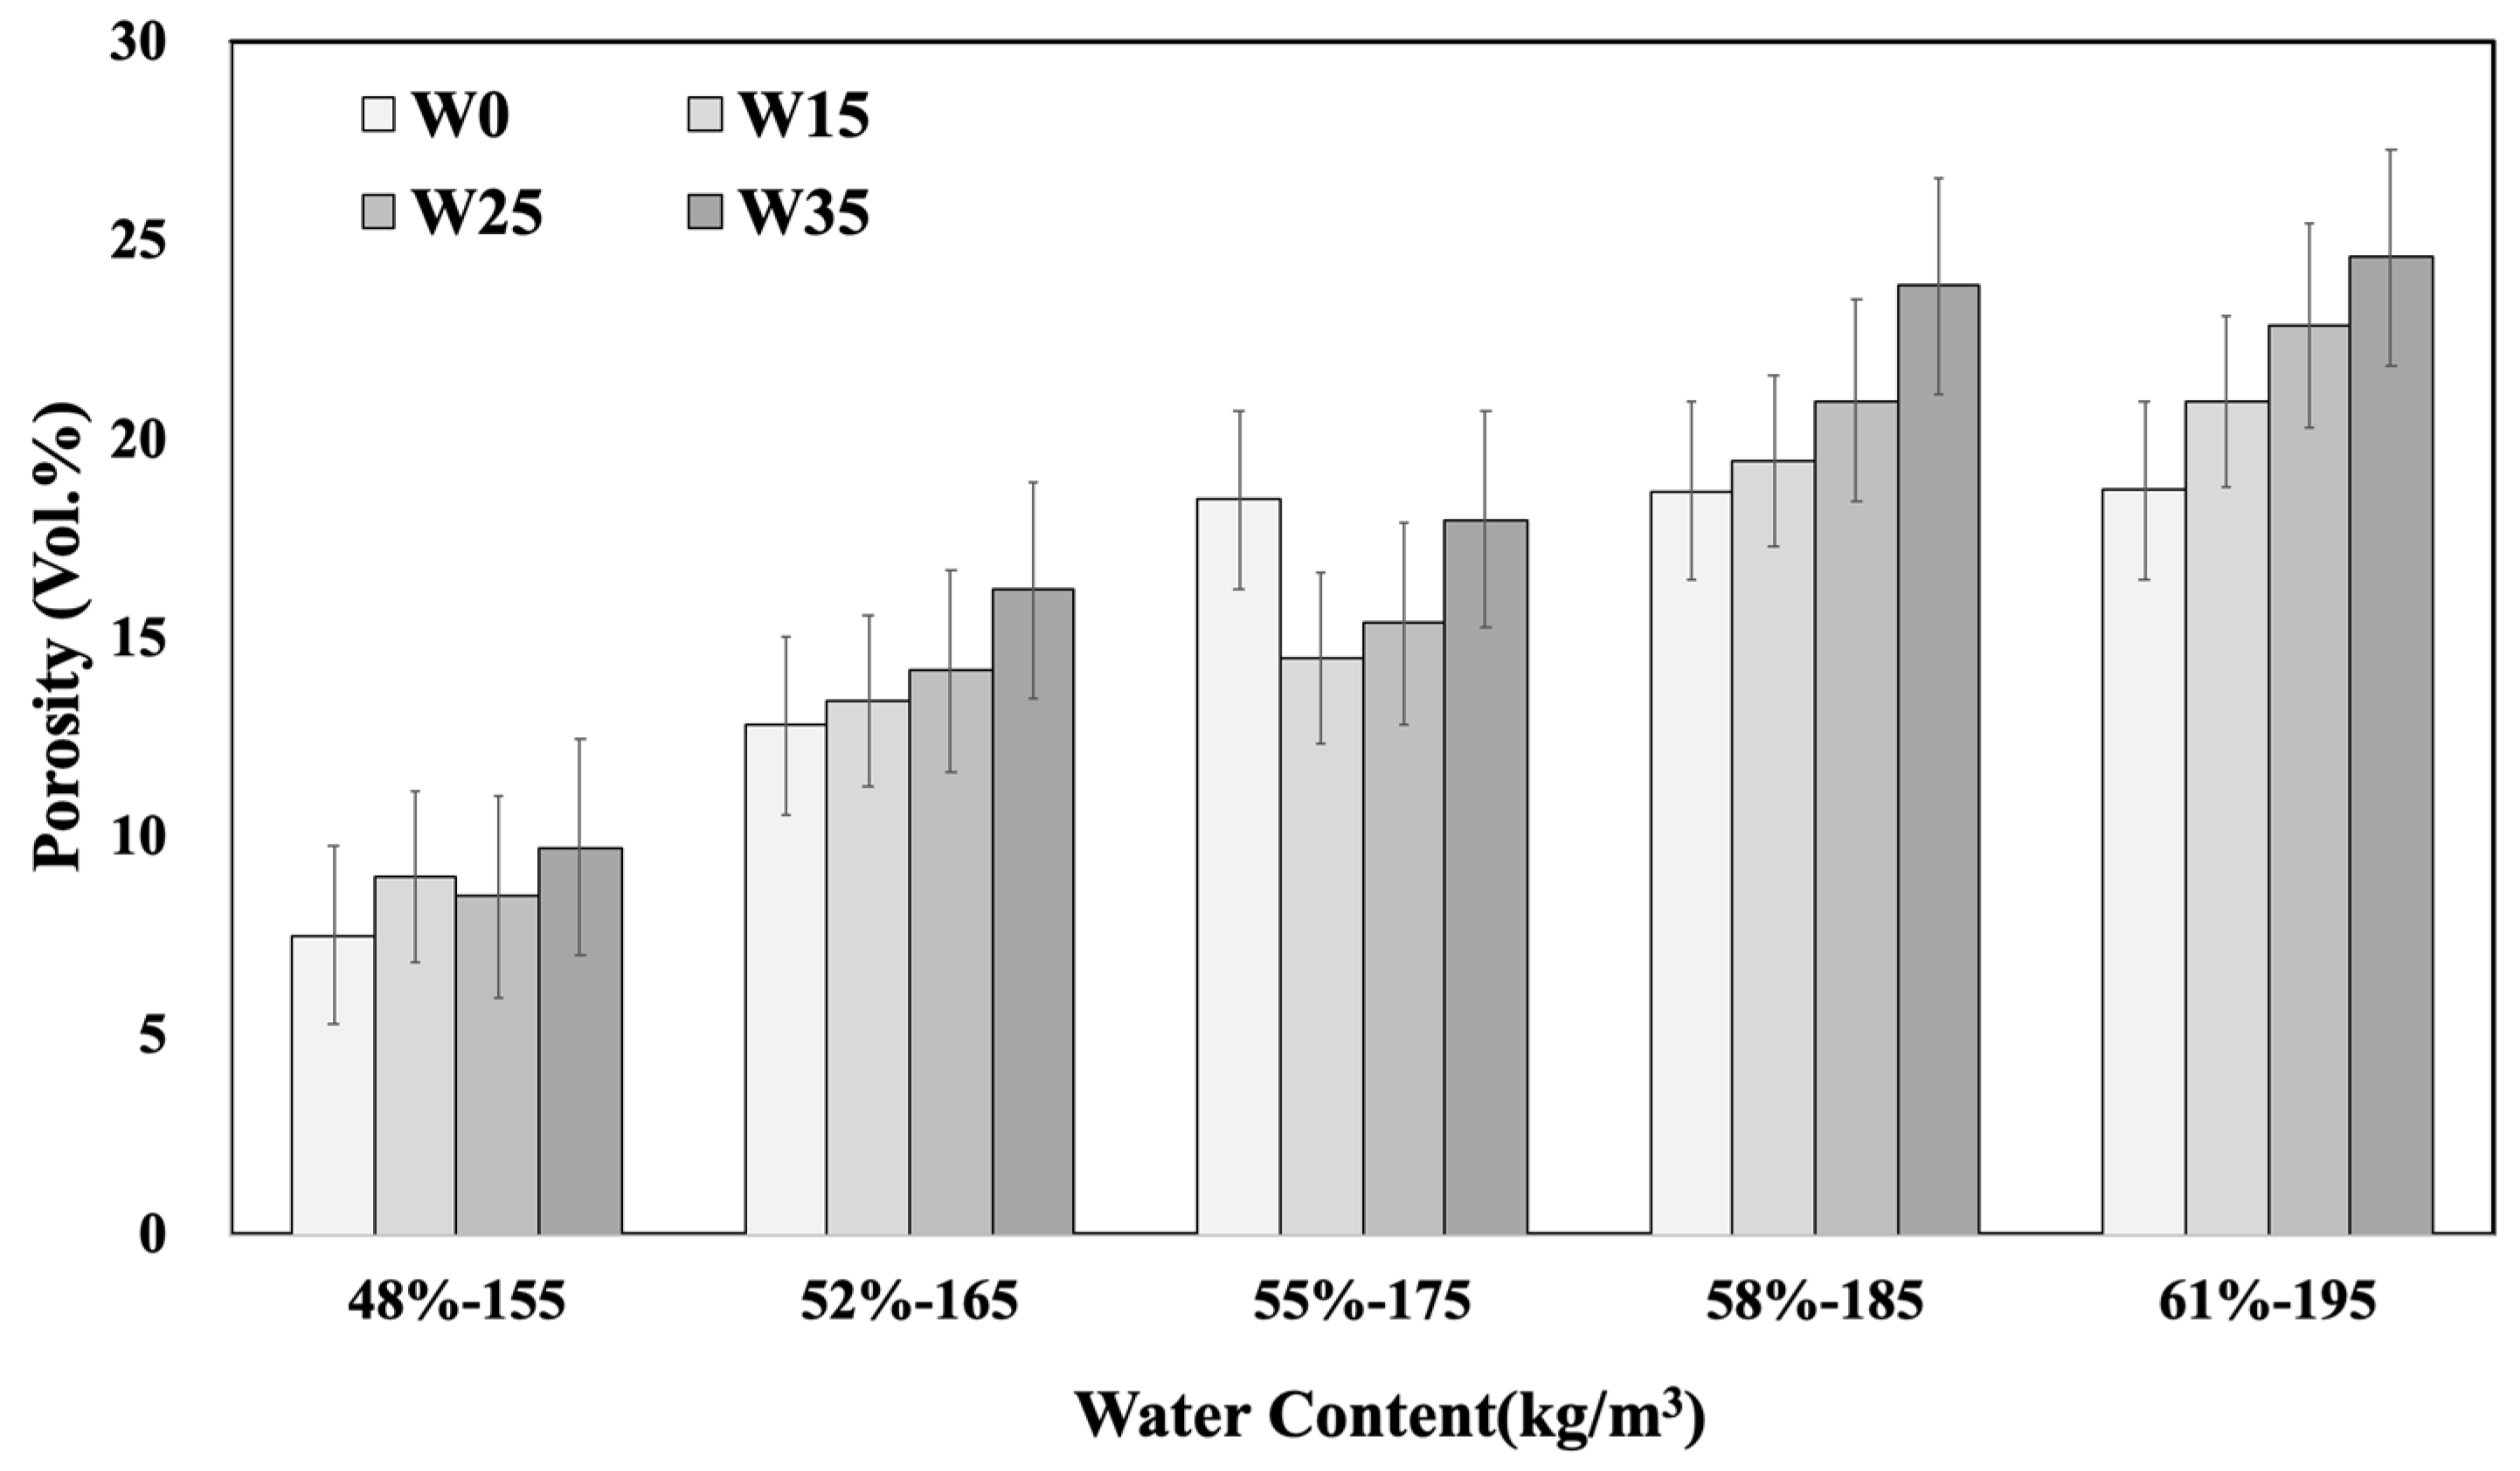
3.4. Porosity
4. Discussion
5. Conclusions
Author Contributions
Funding
Institutional Review Board Statement
Informed Consent Statement
Data Availability Statement
Conflicts of Interest
References
- Kovler, K.; Nicolas, R. Properties of fresh and hardened concrete. Cem. Concr. Res. 2011, 41, 775–792. [Google Scholar] [CrossRef]
- Nataraja, M.C.; Lelin, D. Concrete mixed proportioning as per IS 10262: 2009–Comparison with IS 10262: 1982 and ACI 211.1-91. Indian Concr. J. 2010, 64–70. [Google Scholar]
- Hover, K.C. The influence of water on the performance of concrete. Constr. Build. Mater. 2011, 25, 3003–3013. [Google Scholar] [CrossRef]
- Mehta, P.K.; Monteiro, P.J.M. Concrete: Microstructure, Properties, and Materials; McGraw Hill: New York, NY, USA, 2006; p. 659. [Google Scholar]
- Neville, A.M. Properties of Concrete, 4th and final ed.; Pearson Education Limited: London, UK; John Wiley/Prentice Hall: Chichester, UK, 1995; p. 844. [Google Scholar]
- Abrams, D.A. Design of concrete mixedtures. Bulletin 1918, 1, 2071-1050. [Google Scholar]
- Popovics, S.; Janos, U. Contribution to the concrete strength versus water-cement ratio relationship. J. Mater. Civ. Eng. 2008, 20, 459–463. [Google Scholar] [CrossRef]
- Popovics, S. Analysis of concrete strength versus water-cement ratio relationship. ACI Mater. J. 1990, 87, 517–529. [Google Scholar]
- Seitl, S.; Benešová, A.; Pascual, Á.P.; Malíková, L.; Bujdoš, D.; Bílek, V. Fatigue and fracture properties of concrete mixedtures with various water to cement ratio and maximum size of aggregates. Procedia Struct. Integr. 2022, 42, 1512–1519. [Google Scholar] [CrossRef]
- Marar, K.; Özgür, E. Effect of cement content and water-cement ratio on fresh concrete properties without admixedtures. Acad. J. 2011, 84, 2011. [Google Scholar]
- Zhao, Y.; Weilai, Z.; Hongru, Z. Properties of recycled aggregate concrete with different water control methods. Constr. Build. Mater. 2017, 152, 539–546. [Google Scholar] [CrossRef]
- Montero, J.; Laserna, S. Influence of effective mixeding water in recycled concrete. Constr. Build. Mater. 2017, 132, 343–352. [Google Scholar] [CrossRef]
- Pereira, C.G.; Castro-Gomes, J.; de Oliveira, L.P. Influence of natural coarse aggregate size, mineralogy and water content on the permeability of structural concrete. Constr. Build. Mater. 2009, 23, 602–608. [Google Scholar] [CrossRef]
- Aliabdo, A.A.; Elmoaty, M.A.; Hazem, A.S. Effect of water addition, plasticizer and alkaline solution constitution on fly ash based geopolymer concrete performance. Constr. Build. Mater. 2016, 121, 694–703. [Google Scholar] [CrossRef]
- ASTM C1079-87; Standard Test Methods for Determining the Water Content of Freshly Mixeded Concrete, Annual Book of ASTM Standards. ASTM: West Conshohocken, PA, USA, 1998; Volume 4, p. 2.
- AASHTO T318; Standard Method of Test for Water Content of Freshly Mixeded Concrete Using Microwave Oven Drying. American Association of State and Highway Transportation Officials: Washington, DC, USA, 2015.
- Popovics, S.; Popovics, J.S. Ultrasonic testing to determine water-cement ratio for freshly mixeded concrete. Cem. Concr. Aggreg. 1998, 20, 262–268. [Google Scholar]
- Chen, W.; Shen, P.; Shui, Z. Determination of water content in fresh concrete mixed based on relative dielectric constant measurement. Constr. Build. Mater. 2012, 34, 306–312. [Google Scholar] [CrossRef]
- KCS 14 20 10; Standard Specification of Concrete. Ministry of Land. Infrastructure and Transport: Seoul, Republic of Korea, 2022. (In Korean)
- Architectural Institute of Japan. Japanese Architectural Standard Specification for Reinforced Concrete Work (JASS 5); Architectural Institute of Japan: Tokyo, Japan, 2016. (In Japanese) [Google Scholar]
- BSI-5328; Part 2: Methods for Specifying Concrete Mixedes. British Standard Institution: London, UK, 1997.
- ACI 211.1-91; Standard Practice for Selecting Proportions for Normal, Heavyweight, and Mass Concrete. ACI Committee: Farmington Hills, MI, USA, 2002.
- Mishra, S.P. Comparison of IS, BS and ACI Methods of concrete mixed design and proposing function equations based design. Res. Dev. 2012, 2, 20–56. [Google Scholar]
- Chhachhia, A. Concrete mixed design by IS, ACI and BS methods: A Comparative Analysis. J. Build. Mat. Sci. 2020, 2, 30–33. [Google Scholar]
- KS F 2405; Standard Test Method for Compressive Strength of Concrete. Korean Standards Association: Seoul, Republic of Korea, 2010.
- NT BUILD 492; Concrete, Mortar and Cement-Based Repair Materials: Chloride Migration Coefficient from Non-Steady-State Migration Experiments. NordTest: Serravalle, Italy, 1999.
- KS F 2584; Standard Test Method Accelerated Carbonation of Concrete, Korean Standards Association: Seoul, Republic of Korea, 2020.
- KS F 2596; Standard Test Method Measuring Carbonation Depth of Concrete, Korean Standards Association: Seoul, Republic of Korea, 2016.
- KS F 2711; Standard Test Method for Resistance of Concrete to Chloride Ion Penetration by Electrical Conductance. Korean Standards Association: Seoul, Republic of Korea, 2017.
- Luping, T.; Nilsson, L.O. Rapid determination of the chloride diffusivity in concrete by applying an electric field. J. Mater. 1993, 89, 49–53. [Google Scholar]


| Specimens | W/C (%) | S/a (%) | Unit Weight (kg/m3) | ||||
|---|---|---|---|---|---|---|---|
| Total Water Content | Cement | FA | CA | ||||
| Unit Water | Addition | ||||||
| 48%-155 | 48.4 | 45.7 | 155 | 0 | 320 | 885 | 1050 |
| +15 | |||||||
| +25 | |||||||
| +35 | |||||||
| 52%-165 | 51.6 | 45.7 | 165 | 0 | 320 | 872 | 1036 |
| +15 | |||||||
| +25 | |||||||
| +35 | |||||||
| 55%-175 | 54.7 | 45.7 | 175 | 0 | 320 | 860 | 1021 |
| +15 | |||||||
| +25 | |||||||
| +35 | |||||||
| 58%-185 | 57.8 | 45.7 | 185 | 0 | 320 | 848 | 1007 |
| +15 | |||||||
| +25 | |||||||
| +35 | |||||||
| 61%-195 | 60.9 | 45.7 | 195 | 0 | 320 | 836 | 993 |
| +15 | |||||||
| +25 | |||||||
| +35 | |||||||
| Category | Density (g/m3) | Fineness Modulus (%) | Absorption Rate (%) | Passing Rate through 0.08 mm Sieve (%) |
|---|---|---|---|---|
| Fine aggregate | 2.64 | 2.57 | 1.42 | 3.00 |
| Coarse aggregate | 2.67 | 6.96 | 0.58 | - |
| Experimental Items | Levels | Test Standards |
|---|---|---|
| Compressive Strength | Ages 3 d, 7 d, 28 d | KS F 2405 |
| Chloride Ion Penetration Resistance | Age 28 d | NT BUILD 492 |
| Accelerated Carbonation Resistance | Ages 7 d, 14 d, 21 d, 28 d | KS F 2584, KS F 2596 |
| Porosity | Age 28 d | Mercury Intrusion Penetrometer |
| (Additional Water) | W0 (0 kg) | W15 (15 kg) | W25 (25 kg) | W35 (35 kg) | |
|---|---|---|---|---|---|
| Specimen | |||||
| 48%-155 |  |  |  |  | |
| 52%-165 |  |  |  |  | |
| 55%-175 |  |  |  |  | |
| 58%-185 |  |  |  |  | |
| 61%-195 |  |  |  |  | |
| Category | Chloride Ion Penetration Depth (m) | Chloride Ion Diffusion Coefficient (m2/s) | ||
|---|---|---|---|---|
| W/C-Unit Water-Add. Water (Specimen) | Additional Water (kg) | |||
| 48%-155 | W0 | 0 | 7.50 | 6.28 × 10⁻¹² |
| W15 | 15 | 8.73 | 7.48 × 10⁻¹² | |
| W25 | 25 | 7.58 | 6.35 × 10⁻¹² | |
| W35 | 35 | 13.56 | 1.21 × 10⁻¹¹ | |
| 52%-165 | W0 | 0 | 9.59 | 8.29 × 10⁻¹² |
| W15 | 15 | 9.95 | 8.62 × 10⁻¹² | |
| W25 | 25 | 9.51 | 8.22 × 10⁻¹² | |
| W35 | 35 | 12.82 | 1.14 × 10⁻¹¹ | |
| 55%175 | W0 | 0 | 9.56 | 8.26 × 10⁻¹² |
| W15 | 15 | 9.80 | 8.47 × 10⁻¹² | |
| W25 | 25 | 10.17 | 8.85 × 10⁻¹² | |
| W35 | 35 | 14.85 | 1.34 × 10⁻¹¹ | |
| 58%-185 | W0 | 0 | 12.03 | 1.06 × 10⁻¹¹ |
| W15 | 15 | 11.94 | 1.05 × 10⁻¹¹ | |
| W25 | 25 | 13.32 | 1.16 × 10⁻¹¹ | |
| W35 | 35 | 16.91 | 1.53 × 10⁻¹¹ | |
| 61%-195 | W0 | 0 | 11.45 | 1.01 × 10⁻¹¹ |
| W15 | 15 | 12.69 | 1.13 × 10⁻¹¹ | |
| W25 | 25 | 14.00 | 3.91 × 10⁻¹¹ | |
| W35 | 35 | 19.42 | 1.77 × 10⁻¹¹ | |
| 48%-155 | 52%-165 | 55%-175 | 58%-185 | 61%-195 | |
|---|---|---|---|---|---|
| W0 |  |  |  |  |  |
| W15 |  |  |  |  |  |
| W25 |  |  |  |  |  |
| W35 |  |  |  |  |  |
| Specimen | W0 (mm/day0.5) | W15 (mm/day0.5) | W25 (mm/day0.5) | W35 (mm/day0.5) |
|---|---|---|---|---|
| 48%-155 | 1.37 | 1.61 | 2.42 | 3.15 |
| 52%-165 | 2.24 | 2.57 | 2.81 | 3.50 |
| 55%-175 | 2.48 | 2.64 | 3.07 | 3.44 |
| 58%-185 | 2.87 | 2.99 | 3.55 | 3.89 |
| 61%-195 | 2.76 | 2.97 | 3.81 | 5.18 |
| Specimen | W0 (Year) | W15 (Year) | W25 (Year) | W35 (Year) |
|---|---|---|---|---|
| 48%-155 | 100 | 90 | 60 | 40 |
| 52%-165 | 60 | 45 | 33 | 25 |
| 55%-175 | 58 | 50 | 43 | 35 |
| 58%-185 | 46 | 45 | 32 | 28 |
| 61%-195 | 55 | 45 | 33 | 20 |
| Specimen | Porosity (vol. %) | |||
|---|---|---|---|---|
| W0 | W15 | W25 | W35 | |
| 48%-155 | 7.53 | 9.02 | 8.51 | 9.75 |
| 52%-165 | 12.81 | 13.42 | 14.19 | 16.24 |
| 55%-175 | 18.50 | 14.49 | 15.39 | 17.99 |
| 58%-185 | 18.71 | 19.45 | 20.99 | 23.87 |
| 61%-195 | 18.73 | 20.96 | 22.87 | 24.59 |
Disclaimer/Publisher’s Note: The statements, opinions and data contained in all publications are solely those of the individual author(s) and contributor(s) and not of MDPI and/or the editor(s). MDPI and/or the editor(s) disclaim responsibility for any injury to people or property resulting from any ideas, methods, instructions or products referred to in the content. |
© 2024 by the authors. Licensee MDPI, Basel, Switzerland. This article is an open access article distributed under the terms and conditions of the Creative Commons Attribution (CC BY) license (https://creativecommons.org/licenses/by/4.0/).
Share and Cite
Park, S.-H.; Ryu, H.-S.; Park, W.-J. Influence of Unit Water Content Control on Concrete Performance in the Ready-Mixed Concrete Production Process. Materials 2024, 17, 834. https://doi.org/10.3390/ma17040834
Park S-H, Ryu H-S, Park W-J. Influence of Unit Water Content Control on Concrete Performance in the Ready-Mixed Concrete Production Process. Materials. 2024; 17(4):834. https://doi.org/10.3390/ma17040834
Chicago/Turabian StylePark, Sang-Hoon, Hwa-Sung Ryu, and Won-Jun Park. 2024. "Influence of Unit Water Content Control on Concrete Performance in the Ready-Mixed Concrete Production Process" Materials 17, no. 4: 834. https://doi.org/10.3390/ma17040834